EP0884708A2 - Method and device for traffic condition prognosis - Google Patents
Method and device for traffic condition prognosis Download PDFInfo
- Publication number
- EP0884708A2 EP0884708A2 EP98250194A EP98250194A EP0884708A2 EP 0884708 A2 EP0884708 A2 EP 0884708A2 EP 98250194 A EP98250194 A EP 98250194A EP 98250194 A EP98250194 A EP 98250194A EP 0884708 A2 EP0884708 A2 EP 0884708A2
- Authority
- EP
- European Patent Office
- Prior art keywords
- traffic
- phase
- edge
- speed
- node
- Prior art date
- Legal status (The legal status is an assumption and is not a legal conclusion. Google has not performed a legal analysis and makes no representation as to the accuracy of the status listed.)
- Granted
Links
Images


Classifications
-
- G—PHYSICS
- G08—SIGNALLING
- G08G—TRAFFIC CONTROL SYSTEMS
- G08G1/00—Traffic control systems for road vehicles
- G08G1/01—Detecting movement of traffic to be counted or controlled
- G08G1/0104—Measuring and analyzing of parameters relative to traffic conditions
Definitions
- the invention relates to a method and a device for forecasting the Traffic condition based on the current detected by detectors Detection data relating to the traffic condition, which are determined by the detectors a set or adjustable reporting behavior transmitted to a control center will
- the task is accomplished through a procedure according to the independent Process claim 1 and a center according to the independent Device claim 16 solved.
- the method according to the invention is basically based on the allocation of phases to edges or edge sections of the transport network, with a forecast of the Traffic condition based on the calculation of the movement of these phases in the Traffic network is created.
- the edges are between two Sections of a road located at intersections or fatigue as Edge sections parts of edges and as nodes intersections, descents and Confluence. The method according to the invention works very efficiently.
- FCD floating car data
- FCD floating car data
- the traffic state forecasting method used by the invention Phases describe the traffic condition in an edge or with discrete values an edge section at a certain time.
- a phase can be simplest case with the coarsest quantization binary (ie “free”, “jammed”) to be discribed.
- a phase description with higher resolution, in particular in five stages e.g. "free”, “lively”, “dense”, “tough”, “jammed” is also possible. It is appropriately assumed that each phase has its state (e.g. "free") retained unchanged in time.
- the forecast of the future traffic condition is the speed of movement of the phase boundaries is calculated. This corresponds to a front phase boundary z.
- B. a traffic jam start and a rear phase boundary a traffic jam end.
- phase boundary and the rear phase boundary of a phase i.e. traffic jam start and traffic jam end or vice versa
- moving speed changes the size of a phase. Phases thus become larger or smaller, in extreme cases up to zero length. So can according to the invention also the change in the sizes of phases for forecasting the future traffic conditions can be used.
- the current traffic situation is appropriately disjoint, the traffic network completely overlapping phases described to a traffic condition forecast of the entire network. It is preferably in edges or Edge sections, in which, for example, because there are no vehicles in this Edge, there are no current detection data, the phase as "free” or according to the latest detection data from this section assumed to to receive a complete, current description of the traffic condition and one to allow complete traffic state forecasting, since this assumption is the same as that of the is most likely true.
- phase boundary speeds to be used for the forecast can vary depending on the type of data available can be calculated using the following methods:
- the calculation of the phase boundary speeds the phases based on the current detection data and the previous detection data e.g. through linear regression. It is possible to have two To determine the location of a phase boundary and the location and time To determine the phase boundary speed.
- the flows (unit: vehicles per time) before and after the phase boundary can be taken directly from the detection data supplied by a stationary detection device.
- each Phase boundary based on its current location and its phase boundary speed calculated their location at the time of the forecast and the edge sections between Phase start and phase end at the time of the forecast of the phase state of this Phase assigned.
- phase boundary velocities resulting from this phase resulting partial phases in the other edges adjacent to this node due to the phase velocity of the phase spreading over the node in front of the node and in each case the river in an edge adjacent to the node in the event of traffic jams and calculated without traffic jam.
- This enables realistic Traffic jam spread forecast across a node by including rivers in the node with traffic jam and without traffic jam.
- Phase boundary speed for example the speed of the Locomotion of a traffic jam
- the position of a The phase boundary at the time of the forecast results from the product of Phase boundary speed and the time between now and that Time of forecast.
- the edge sections which are spatially between the two predicted phase limits of a phase, the respective phase ("free” or “jammed” etc.) which is a simple and efficient forecast of Phases of edge sections in phase propagation across nodes enables.
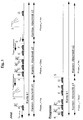
- edge k 1 shows a road 1, on which vehicles A, B, C, D, E, F, G move in the direction of the arrow labeled u vehicle .
- intersections and junctions of roads are called nodes and parts of roads between two nodes are called edges.
- the section of a road 1 located between two nodes is designated as edge k 1 in FIG. 1.
- an edge k 1 can be divided into edge sections a 1 , a 2 , a 3 .
- the traffic situation shown should forecast the future in Fig. 1 below for the traffic situation shown as an example.
- the current edge 1 is shown as an example in FIG. 1 above Traffic condition based on detection data detected by detectors in one Central in the form of traffic congestion covering the traffic jam in traffic phases representing an edge and for a future one Time a description of the traffic status of the transport network Calculation of movements and thus of future positions as well as moreover changes in the size of the traffic phases are forecast.
- Detection data about the current traffic condition can be measured by mobile detectors and / or stationary detectors. In any case, the type of data available depends on location and time. All or some vehicles can be used as mobile detectors, vehicles A, B, C and D, for example in FIG. 1 above, each being equipped with an antenna 2, from which traffic data, in particular the vehicle speed u vehicle that can be detected via the speedometer of a vehicle and also transmit a position, for example via GPS (global processioning system), to a control center (not shown here), for example at regular time intervals, at certain times, on request by the control center and / or in the case of certain events, such as a reduction in the vehicle speed or a change in the speed variance will.
- traffic data in particular the vehicle speed u vehicle that can be detected via the speedometer of a vehicle and also transmit a position, for example via GPS (global processioning system), to a control center (not shown here), for example at regular time intervals, at certain times, on request by the control center and / or in
- FCD floating car data
- the type of data obtained depends on the type of detection selected.
- mobile detectors in the control data FCD
- FCD control data
- Stationary detectors 3 deliver the current flow réelle in a point-related manner, that is to say for a specific point on an edge, and, if they are equipped with speed measuring devices, can also measure the local vehicle speed.
- sections for edges or Edge sections defined an assigned phase.
- a phase can be with a binary quantification have the value “free” or “jammed”.
- Subdivisions can include the values "free”, “lively”, “dense”, “tough”, “jammed” can be assigned. Any other quantification is also possible.
- the phase can be obtained in one from detection data obtained from mobile detectors 2 Edge or an edge section in which these detectors are located, for example due to the average speed of the detecting vehicles be determined.
- the speed variance can possibly be used in particular exact phase division can be used. So an edge section, in which the vehicles move at high speed (and possibly lower temporal speed fluctuation) move, assigned the phase "free” and an edge section in which the vehicles with lower Speed (and possibly a relatively high temporal fluctuation in speed) move, the phase "jammed” assigned.
- state limits which of the phase limits discussed here are different.
- Fig. 1 results, for example, that in the left edge section a 1 , the vehicle A is moving at a relatively high speed (and possibly low speed fluctuation), so that due to the data sent from the vehicle A via the antenna 2 to a control center, the control center Edge section a 1 the phase "free" can be assigned.
- the edge section a 2 it can be assumed that the vehicles B, C, D, E and F move at lower speeds (and higher speed fluctuations). Accordingly, it can be expected that the vehicles B, C, D equipped with an antenna 2 report a relatively low speed (and possibly high speed fluctuations) to a control center. The center would accordingly assign the phase section " 2 " to the edge section.
- the vehicle G Only the vehicle G is located in the edge section 3, but not with it an antenna 2, so no detection data to one here shown control center sent. So until later detection by a stationary detection device 3 is not detected. That is why the head office takes e.g. the Case, namely that there are only a few vehicles or none in the edge section a3 The vehicle is located and assigns the phase state "free" to this edge section a3. to. Alternatively, it is possible to phase an edge section or an edge assign based on the last measured detection data.
- the age of the last measurement in one can certain section of the route can be a criterion, there the status "free" to assume.
- data is only available from a small part of the vehicles to disposal.
- the forecast is the expected movement of the phase boundaries of each phase used within the transport network to determine the future location of the phase boundaries and thus the position and here also the size of the phases to a future one To determine the point in time.
- a phase has two phase boundaries, namely the top left of the vehicle in FIG. 1 B located front phase boundary 4 and the top right of the vehicle F in FIG. 1 rear phase boundary 5.
- vehicle G drives onto car column B, C, E, F on, so that phase 2 extends a little to the rear, even though it is in Direction of travel of the vehicles.
- the speed v is the phase boundaries of the speeds u Distinguish vehicles.
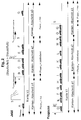
- FIG. 2 shows a further example of the current traffic situation in FIG. 2 above and in FIG. 2 below the future traffic situation that results from this.
- the front phase boundary 4 has moved to the left at the speed v front phase boundary and the rear phase boundary, that is to say the end of the traffic jam, has moved to the right at the speed V rear phase boundary .
- the forecast phase is defined by calculating the two forecast phase limits.
- v front phase boundary and v rear phase boundary can be calculated, for example by linear regression, from the positions of the phase boundaries at different times.
- the phase boundaries are as above executed, a prognosis of the phase movement along an edge is possible.
- FIG. 3 shows an example of a hatched jam in the upper edge k 1 , which has the front phase boundary 4 and the rear phase boundary 5 (indicated by thick arrows in the edges).
- the vehicles move in the traffic jam in the direction of the thick arrow in the shaded area at the speed u vehicle .
- the rear stowage limit 5 moves because, for example, more vehicles can drive onto the stowage limit from behind ( ⁇ ⁇ towards in FIG. 4) than from the stowage limit 5 towards the front ( ⁇ ⁇ down in FIG. 4), counter to the direction of the thick one Arrow, ie in the direction of the narrow arrow indicated next to the upper edge 1 at the speed v rear phase boundary towards the intersection.
- ⁇ k i.e. the flow in an edge k (k 3 or k 4 ) before reaching the jam
- ⁇ k the flow in an edge k (k 3 or k 4 ) before reaching the jam
- FCD the flow in an edge k (k 3 or k 4 ) before reaching the jam
- the residual flow ⁇ s 1 transported in the traffic jam can be determined using the following relationship obtained from a formula above by shaping.
- ⁇ 1 s ⁇ 1 * u 1 s / u 1 * (u 1 - v 1 ) / (u s 1 - v 1 ).
- 2 can be smaller than ⁇ 2 without a jam and in particular on ⁇
- 2nd ⁇ 2nd * ⁇ 1 s / ⁇ 1 sink when the congestion front passes the knot. It can also be greater than this value due to congestion avoidance.
- the local network topology and possible diversions can be taken into account.
- u k s min (u 1 s ; ⁇ u k * ( ⁇ ⁇ from ) / ( ⁇ ⁇ to )), where ⁇ (0 ⁇ ⁇ 1) can be determined phenomenologically.
- the speeds and, for example, positions of the vehicles that can be measured with GPS are transmitted from the vehicles to the control center.
- the fluxes ⁇ are measured by the stationary detectors at the detector and transmitted to a control center.
- the current common traffic condition is determined in the next common step 9 by the phases covering the network, a phase in an edge or an edge section being calculated in each case on the basis of the average vehicle speeds in this edge.
- the variance of the vehicle speeds u may also be included. High speed (and possibly additionally low variance) in speed can be interpreted as a "free" phase, for example.
- the calculation of the propagation speed v s of a front or rear phase boundary within an edge depends on the type of detection data available.
- the propagation velocity v s of a phase boundary within an edge can be derived from the rivers in this edge in front of and behind the phase boundary, for example in front of and behind a traffic jam end and the vehicle speed in front of and behind the phase boundary can also be determined, for example, in front of and behind a traffic jam end.
- the new phase limits (position phase limit ) can be determined from the phase limit speed (v phase limit in this edge) and the time difference between the forecast time and the current time. With the forecast of the phase boundaries, the forecast of the phases is possible within the edges.
- phase boundary forecast location beyond a node i.e. one Phase spread across an account gives:
- step 15 is to to return to start 6. This is a continuously updated traffic forecast possible.
- the method described above is a possible embodiment. Further This forecasting process can be optimized.
- the Measurement method not only FCD or FCD / stationary, but also a complex one location / time-dependent mixture of these. It may also be advantageous to knot to be classified according to turn rates.
- a phenomenological model can also be used be included.
- the dynamics of phase boundaries can be macroscopic Model or be determined phenomenologically.
- the forecast can ongoing or on service request, i.e. user request as part of a Traffic telematics service.
- Fig. 5 shows a block diagram of a "floating car” (floating in traffic Vehicle) with the reference symbol A, which is via a wireless communication interface 20 is connected to a central Z.
- the wireless Communication interface 20 can be, for example, mobile radio.
- the speed of the vehicle is measured with a sensor system 21 and the position of the vehicle (e.g. using GPS or in another way) certainly. It is possible that this data can be pre-processed using e.g. by Remote configuration created preset and virtual environment by comparison and evaluation.
- the raw or edited data u (and possibly the position) are via a communication interface 22, i.e. a Sender, sent to the receiver 23 of the control center.
- a computer 24 identifies traffic phases on the basis of this data (25) and the Movement of the phase boundaries predicted (26).
- phase forecasts obtained can be used for a traffic jam prognosis and / or for a forecast of Travel times (27) can be used.
Abstract
Description
Die Erfindung betrifft ein Verfahren und eine Vorrichtung zur Prognose des Verkehrszustandes aufgrund von durch Detektoren erfaßten, den aktuellen Verkehrszustand betreffenden Detektionsdaten, welche von den Detektoren gemäß einem eingestellten oder einstellbaren Meldeverhalten an eine Zentrale übermittelt werdenThe invention relates to a method and a device for forecasting the Traffic condition based on the current detected by detectors Detection data relating to the traffic condition, which are determined by the detectors a set or adjustable reporting behavior transmitted to a control center will
Aus "Adolf Mayo 'Traffic Flow Fundamentals', Eastwood Cliffs 1990" ist ein Verfahren zur Verkehrsanalyse und Verkehrsprognose aufgrund von von stationären Erfassungseinrichtungen gelieferten und damit punktbezogenen Daten wie der lokalen Geschwindigkeit oder der Verkehrsstärke bekannt."Adolf Mayo 'Traffic Flow Fundamentals', Eastwood Cliffs 1990" is a procedure for traffic analysis and traffic forecast based on stationary Detection devices supplied and thus point-related data such as the known local speed or traffic volume.
Ein derartiges Verfahren ist jedoch sehr rechenintensiv. Insbesondere ist es zur Verarbeitung von Daten von mobilen Erfassungseinrichtungen nicht geeignet. Die numerische Lösung von Differentialgleichungen, Intervalarithmetik oder sogar die Modellierung des Verhaltens einzelner Fahrzeuge wären erforderlich. Hiervon ausgehend ist die Aufgabe der vorliegenden Erfindung die Schaffung eines zur Prognose des Verkehrszustandes insbesondere aufgrund von durch mobile Erfassungseinrichtungen ("floating cars") ermittelten Verkehrsdaten geeigneten, effizienten Verfahrens und einer Vorrichtung hierzu.However, such a method is very computationally intensive. In particular, it is for Processing of data from mobile recording devices is not suitable. The numerical solution of differential equations, interval arithmetic or even the Modeling the behavior of individual vehicles would be required. Of that starting from the object of the present invention is to create a Prediction of the state of the traffic, in particular based on that of mobile Detection devices ("floating cars") determined suitable traffic data efficient method and a device for this.
Die Aufgabe wird durch ein Verfahren gemäß dem unabhängigen Verfahrensanspruch 1 und eine Zentrale nach dem unabhängigen Vorrichtungsanspruch 16 gelöst. The task is accomplished through a procedure according to the independent Process claim 1 and a center according to the independent Device claim 16 solved.
Das erfindungsgemäße Verfahren basiert im Grunde auf der Zuweisung von Phasen zu Kanten oder Kantenabschnitten des Verkehrsnetzes, wobei eine Prognose des Verkehrszustandes aufgrund der Berechnung der Bewegung dieser Phasen im Verkehrsnetz erstellt wird. Dabei werden als Kanten jeweils zwischen zwei Kreuzungen oder Einmüdungen befindliche Abschnitte einer Straße, als Kantenabschnitte Teile von Kanten und als Knoten Kreuzungen, Abfahrten und Einmündungen bezeichnet. Das erfindungsgemäße Verfahren arbeitet sehr effizient. Es liefert bei relativ geringer Rechenleistung gute Ergebnisse aufgrund von Daten von mobilen Erfassungseinrichtungen (= "FCD = floating car data"), kann aber auch sehr effizient Daten von stationären, beispielsweise neben einer Straße montierten Detektoren und/oder eine vorhandene, vorzugsweise dynamische OD-Matrix (origin-destination-matrix), welche angibt, wieviele Fahrzeuge von welchem Ausgangsort wann zu welchem Ziel fahren, zur Prognose verwenden.The method according to the invention is basically based on the allocation of phases to edges or edge sections of the transport network, with a forecast of the Traffic condition based on the calculation of the movement of these phases in the Traffic network is created. The edges are between two Sections of a road located at intersections or fatigue as Edge sections parts of edges and as nodes intersections, descents and Confluence. The method according to the invention works very efficiently. It delivers good results based on data from mobile recording devices (= "FCD = floating car data"), but can also be very efficient data from stationary, for example, mounted next to a road Detectors and / or an existing, preferably dynamic OD-matrix (origin-destination-matrix), which indicates how many vehicles from which point of departure use when to what destination, use for forecasting.
Die vom erfindungsgemäßen Verkehrszustands-Prognoseverfahren verwendeten Phasen beschreiben mit diskreten Werten den Verkehrszustand in einer Kante oder einem Kantenabschnitt zu einem bestimmten Zeitpunkt. Eine Phase kann dabei im einfachsten, die gröbste Quantisierung aufweisenden Fall binär (also "frei", "gestaut") beschrieben werden. Eine Phasenbeschreibung mit höherer Auflösung, insbesondere in fünf Stufen (z.B. "frei", "lebhaft", "dicht", "zäh", "gestaut") ist ebenfalls möglich. Dabei wird zweckmäßig angenommen, daß jede Phase ihren Zustand (z.B. "frei") zeitlich unverändert beibehält. Zur Prognose des künftigen Verkehrszustandes wird die Geschwindigkeit der Bewegung der Phasengrenzen berechnet. Dabei entspricht eine vordere Phasengrenze z. B. einem Stauanfang und eine hintere Phasengrenze einem Stauende.The traffic state forecasting method used by the invention Phases describe the traffic condition in an edge or with discrete values an edge section at a certain time. A phase can be simplest case with the coarsest quantization binary (ie "free", "jammed") to be discribed. A phase description with higher resolution, in particular in five stages (e.g. "free", "lively", "dense", "tough", "jammed") is also possible. It is appropriately assumed that each phase has its state (e.g. "free") retained unchanged in time. The forecast of the future traffic condition is the speed of movement of the phase boundaries is calculated. This corresponds to a front phase boundary z. B. a traffic jam start and a rear phase boundary a traffic jam end.
Wenn sich die vordere Phasengrenze und die hintere Phasengrenze einer Phase (also Stauanfang und Stauende oder umgekehrt) mit unterschiedlicher Geschwindigkeit bewegen, verändert sich die Größe einer Phase. Phasen können somit größer oder kleiner, im Extremfall bis zur Länge Null, werden. Somit kann erfindungsgemäß auch die Veränderung der Größen von Phasen zur Prognose des zukünftigen Verkehrszustandes verwendet werden.If the front phase boundary and the rear phase boundary of a phase (i.e. traffic jam start and traffic jam end or vice versa) with different Moving speed changes the size of a phase. Phases thus become larger or smaller, in extreme cases up to zero length. So can according to the invention also the change in the sizes of phases for forecasting the future traffic conditions can be used.
Die aktuelle Verkehrssituation wird zweckmäßig durch disjunkte, das Verkehrsnetz vollständig überdeckende Phasen beschrieben, um eine Verkehrszustandsprognose des Gesamtnetzes zu ermöglichen. Dabei wird vorzugsweise in Kanten oder Kantenabschnitten, in welchen, beispielsweise weil sich keine Fahrzeuge in dieser Kante befinden, keine aktuellen Detektionsdaten vorliegen, die Phase als "frei" oder entsprechend der letzten Detektionsdaten aus diesem Abschnitt angenommen, um eine vollständige, aktuelle Verkehrszustandsbeschreibung zu erhalten und eine vollständige Verkehrszustandsprognose zu erlauben, da diese Annahme die mit der höchsten Wahrscheinlichkeit zutreffende ist.The current traffic situation is appropriately disjoint, the traffic network completely overlapping phases described to a traffic condition forecast of the entire network. It is preferably in edges or Edge sections, in which, for example, because there are no vehicles in this Edge, there are no current detection data, the phase as "free" or according to the latest detection data from this section assumed to to receive a complete, current description of the traffic condition and one to allow complete traffic state forecasting, since this assumption is the same as that of the is most likely true.
Die Berechnung der zur Prognose zu verwendenden Phasengrenzengeschwindigkeiten jeder Phase können in Abhängigkeit von der Art der vorliegenden Daten nach den folgenden Verfahren berechnet werden:The calculation of the phase boundary speeds to be used for the forecast Each phase can vary depending on the type of data available can be calculated using the following methods:
Wenn nur Detektionsdaten von im Verkehr mitschwimmenden Detektoren vorliegen, erfolgt nach einer Ausgestaltung der Erfindung die Berechnung der Phasengrenzengeschwindigkeiten der Phasen aufgrund der aktuellen Detektionsdaten und der vorherigen Detektionsdaten z.B. durch lineare Regression. Es ist möglich, zu zwei Zeitpunkten den Ort einer Phasengrenze zu bestimmen und aus Ort und Zeit die Phasengrenzengeschwindigkeit zu bestimmen.If only detection data from detectors floating in traffic are available, according to one embodiment of the invention, the calculation of the phase boundary speeds the phases based on the current detection data and the previous detection data e.g. through linear regression. It is possible to have two To determine the location of a phase boundary and the location and time To determine the phase boundary speed.
Ferner ist es möglich, die Detektionsdaten von stationären Detektoren zumindest in
bestimmten Ortsbereichen zur Berechnung der Phasengrenzengeschwindigkeit zu
verwenden. Dies erfordert relativ geringe Rechenleistung. Dabei wird eine
Phasengrenzengeschwindigkeit zweckmäßig als Quotient aus der Differenz des
Zuflusses und Abflusses an der Phasengrenze und aus der Differenz der Dichten vor
und hinter der Phasengrenze (
Flüsse (Φ) werden zweckmäßig aus FCD geschätzt, stationär gemessen oder aus einer mit unabhängigen Methoden geschätzten, vorzugsweise dynamischen OD-Matrix (origin-destination-matrix = Matrix, die angibt, wann wieviele Fahrzeuge von welchem Anfang zu welchem Ziel fahren) erhalten. Rivers (Φ) are appropriately estimated from FCD, measured stationary or from a preferably dynamic OD matrix estimated by independent methods (origin-destination-matrix = matrix that indicates when and how many vehicles from which start to which destination).
Der Verkehrszustand in Kantenabschnitten, in welche Phasengrenzen nur entlang einer Kante eintreten, also in Kantenabschnitten, in welche keine Phasen über einen Knoten (= Kreuzung, Einmündung) hinweg eintreten, wird zweckmäßig aufgrund der Phasengrenzengeschwindigkeiten berechnet. Dabei wird vorzugsweise für jede Phasengrenze aufgrund ihres aktuellen Ortes und ihrer Phasengrenzengeschwindigkeit ihr Ort zum Prognosezeitpunkt berechnet und den Kantenabschnitten zwischen Phasenanfang und Phasenende zum Prognosezeitpunkt der Phasenzustand dieser Phase zugewiesen.The traffic condition in edge sections, in which phase boundaries only along enter an edge, i.e. in edge sections in which no phases over one Entering nodes (= intersection, confluence) is advisable due to the Phase boundary speeds calculated. It is preferred for each Phase boundary based on its current location and its phase boundary speed calculated their location at the time of the forecast and the edge sections between Phase start and phase end at the time of the forecast of the phase state of this Phase assigned.
Wenn aufgrund des prognostizierten Ortes einer Phasengrenze festgestellt wird, daß sich eine Phase über einen Knoten hinweg, also über das Ende einer Kante hinaus ausbreitet, werden die Phasengrenzengeschwindigkeiten der sich aus dieser Phase ergebenden Teil-Phasen in den anderen an diesem Knoten anliegenden Kanten aufgrund der Phasengeschwindigkeit der sich über den Knoten ausbreitenden Phase vor dem Knoten und jeweils dem Fluß in einer am Knoten anliegenden Kante bei Stau und ohne Stau berechnet. Dies ermöglicht eine realistische Stauausbreitungsprognose über einen Knoten hinweg durch Einbeziehung der Flüsse im Knoten bei Stau und ohne Stau. Zweckmäßig wird dabei die Phasengrenzengeschwindigkeit in einer Kante aus dem Quotient aus der Differenz der Flüsse in dieser Kante mit und ohne Stau und der Differenz des Verhältnisses des Flusses in der Kante ohne Stau zur Geschwindigkeit in der Kante ohne Stau und dem Verhältnis des Flusses in der Kante bei Stau und der Geschwindigkeit in der Kante ohne Stau berechnet, wobei zweckmäßig die Geschwindigkeit in der Kante bei Stau angenommen wird als Minimum aus der Geschwindigkeit der Fahrzeuge bei Stau in der Kante, aus welcher sich eine Phase über den Knoten hinweg ausbreitet und der Hälfte des Produkts aus der Fahrzeuggeschwindigkeit in der Kante und dem Verhältnis der Summe der vom Knoten abfließenden zur Summe der zum Knoten zufließenden Flüsse. Ferner wird zweckmäßig für den Fluß in einer Kante bei Stau das Produkt aus dem Fluß in der Kante ohne Stau und dem Verhältnis der Summe der vom Knoten abfließenden Flüsse zur Summe der zum Knoten zufließenden Flüsse verwendet.If it is determined based on the predicted location of a phase boundary that a phase across a node, i.e. beyond the end of an edge spreads, the phase boundary velocities resulting from this phase resulting partial phases in the other edges adjacent to this node due to the phase velocity of the phase spreading over the node in front of the node and in each case the river in an edge adjacent to the node in the event of traffic jams and calculated without traffic jam. This enables realistic Traffic jam spread forecast across a node by including rivers in the node with traffic jam and without traffic jam. This is useful Phase boundary speed in an edge from the quotient from the difference of the rivers in this edge with and without congestion and the difference in the ratio of the Flow in the ridge without congestion to the speed in the ridge without congestion and that Ratio of the flow in the edge in traffic jams and the speed in the edge calculated without traffic jam, where appropriate the speed in the edge in traffic jam is assumed as a minimum from the speed of the vehicles in a traffic jam the edge from which a phase spreads over the node and the Half of the product of the vehicle speed in the edge and that Ratio of the sum of the outflows from the node to the sum of those to the node inflowing rivers. It is also useful for the flow in an edge in a traffic jam the product of the river in the edge without congestion and the ratio of the sum of the flows flowing from the node to the sum of the flows flowing to the node Rivers used.
Damit läßt sich aus den vorhandenen Größen realitätsnah die jeweilige Phasengrenzengeschwindigkeit, also beispielsweise die Geschwindigkeit der Fortbewegung eines Stauendes, hinter einem Knoten berechnen. Die Position einer Phasengrenze zum Prognosezeitpunkt ergibt sich aus dem Produkt der Phasengrenzengeschwindigkeit und der Zeit zwischen jetzt und dem Prognosezeitpunkt. Den Kantenabschnitten, welche räumlich zwischen den beiden prognostizierten Phasengrenzen einer Phase liegen, wird die jeweilige Phase ("frei" oder "gestaut" etc.) zugewiesen, was eine einfache und effiziente Prognose von Phasen von Kantenabschnitten bei Phasenausbreitungen über Knoten hinweg ermöglicht.This allows the respective sizes to be realistically determined from the available sizes Phase boundary speed, for example the speed of the Locomotion of a traffic jam, calculate behind a node. The position of a The phase boundary at the time of the forecast results from the product of Phase boundary speed and the time between now and that Time of forecast. The edge sections, which are spatially between the two predicted phase limits of a phase, the respective phase ("free" or "jammed" etc.) which is a simple and efficient forecast of Phases of edge sections in phase propagation across nodes enables.
Weitere Merkmale und Vorteile der Erfindung ergeben sich aus der nachfolgenden Beschreibung eines Ausführungsbeispiels anhand der Zeichnung. Dabei zeigt
- Fig. 1
- schematisch eine in mehrere Kantenabschnitte unterteilte Straße mit darauf fahrenden Fahrzeugen zum jetzigen und zum Prognosezeitpunkt,
- Fig. 2
- ebenfalls eine Straße zum jetzigen und zum Prognosezeitpunkt, wobei sich die jetzige Stauphase vergrößert,
- Fig. 3
- schematisch eine Kreuzung, über welche hinweg in ihre Zuflüsse sich ein Stau zurückstaut,
- Fig. 4
- als Flußdiagramm ein Beispiel der Berechnung des Phasenzustandes eines Verkehrsnetzes in Abhängigkeit von der Art der vorliegenden Detektionsdaten und
- Fig. 5
- als Blockschaltbild eine Verkehrsüberwachungszentrale, ein Fahrzeug und deren Kommunikation.
- Fig. 1
- schematically a road divided into several edge sections with vehicles running on it at the current time and at the time of the forecast,
- Fig. 2
- also a street at the current and at the time of the forecast, whereby the current congestion phase increases,
- Fig. 3
- schematically an intersection, over which a traffic jam back into its tributaries,
- Fig. 4
- as a flowchart an example of the calculation of the phase state of a traffic network depending on the type of detection data and
- Fig. 5
- a traffic control center, a vehicle and their communication as a block diagram.
Fig. 1 zeigt eine Straße 1, auf welcher sich in Richtung des mit uFahrzeug bezeichneten Pfeiles Fahrzeuge A, B, C, D, E, F, G fortbewegen. Im folgenden werden Kreuzungen und Einmündungen von Straßen als Knoten und zwischen zwei Knoten befindliche Teile von Straßen als Kanten bezeichnet. Entsprechend wird in Fig. 1 der zwischen zwei nicht dargestellten Knoten befindliche Abschnitt einer Straße 1 als Kante k1 bezeichnet. Zur weiteren Unterteilung kann eine Kante k1 in Kantenabschnitte a1, a2, a3 unterteilt sein. 1 shows a road 1, on which vehicles A, B, C, D, E, F, G move in the direction of the arrow labeled u vehicle . In the following, intersections and junctions of roads are called nodes and parts of roads between two nodes are called edges. Correspondingly, the section of a road 1 located between two nodes (not shown ) is designated as edge k 1 in FIG. 1. For further subdivision, an edge k 1 can be divided into edge sections a 1 , a 2 , a 3 .
Aus der in Fig. 1 oben für den jetzigen Zeitpunkt beispielhaft für die Kante 1 dargestellten Verkehrssituation soll für einen künftigen Zeitpunkt eine Prognose der in Fig. 1 unten beispielhaft für die Kante 1 dargestellten Verkehrssituation erfolgen. Dazu wird der aktuelle, in Fig. 1 oben beispielhaft für die Kante 1 dargestellte Verkehrszustand aufgrund von durch Detektoren erfaßten Detektionsdaten in einer Zentrale in Form von das Verkehrsnetz überdeckenden, jeweils den Stauzustand in einer Kante repräsentierenden Verkehrsphasen bestimmt und für einen künftigen Zeitpunkt eine Beschreibung des Verkehrszustandes des Verkehrsnetzes durch Berechnung der Bewegungen und damit der zukünftigen Positionen sowie überdies der Größenveränderungen der Verkehrsphasen prognostiziert.From the example in FIG. 1 above for the current time for edge 1 The traffic situation shown should forecast the future in Fig. 1 below for the traffic situation shown as an example. For this purpose, the current edge 1 is shown as an example in FIG. 1 above Traffic condition based on detection data detected by detectors in one Central in the form of traffic congestion covering the traffic jam in traffic phases representing an edge and for a future one Time a description of the traffic status of the transport network Calculation of movements and thus of future positions as well as moreover changes in the size of the traffic phases are forecast.
Dabei können Detektionsdaten über den aktuellen Verkehrszustand durch mobile Detektoren und/oder stationäre Detektoren gemessen werden. In jedem Fall ist die Art der vorliegenden Daten orts- und zeitabhängig. Als mobile Detektoren können alle oder einige Fahrzeuge eingesetzt werden, wobei in Fig. 1 oben beispielhaft die Fahrzeuge A, B, C und D jeweils mit einer Antenne 2 ausgestattet sind, von welcher Verkehrsdaten, insbesondere die über den Geschwindigkeitsmesser eines Fahrzeuges erfaßbare Fahrzeuggeschwindigkeit uFahrzeug und auch eine z.B. über GPS (global processioning system) erfaßbare Position an eine hier nicht dargestellte Zentrale, z.B. in regelmäßigen Zeitabständen, zu bestimmten Zeiten, auf Anfrage durch die Zentrale und/oder bei bestimmten Ereignissen, wie Verringerung der Fahrzeuggeschwindigkeit oder Veränderung der Geschwindigkeitsvarianz übertragen werden. Da die Detektoren bei diesem Verfahren mit den Fahrzeugen, in welchen sie angeordnet sind, m Verkehr mitschwimmen, werden die mit diesem Verfahren erhaltenen Daten auch als FCD (floating car data) bezeichnet. Alternativ oder zusätzlich ist es möglich, durch über oder neben einer Straße angeordnete stationäre Detektoren 3 Detektionsdaten zu erhalten.Detection data about the current traffic condition can be measured by mobile detectors and / or stationary detectors. In any case, the type of data available depends on location and time. All or some vehicles can be used as mobile detectors, vehicles A, B, C and D, for example in FIG. 1 above, each being equipped with an antenna 2, from which traffic data, in particular the vehicle speed u vehicle that can be detected via the speedometer of a vehicle and also transmit a position, for example via GPS (global processioning system), to a control center (not shown here), for example at regular time intervals, at certain times, on request by the control center and / or in the case of certain events, such as a reduction in the vehicle speed or a change in the speed variance will. Since the detectors in this method swim along with the vehicles in which they are arranged, the data obtained with this method are also referred to as FCD (floating car data). Alternatively or additionally, it is possible to obtain 3 detection data by means of stationary detectors arranged above or next to a street.
Es hängt von der Art der gewählten Detektion ab, welche Art von Daten erhalten werden. Durch mobile Detektoren werden in der Regel Daten (FCD) über die Geschwindigkeit uFahrzeug und die Position PosFahrzeug unmittelbar erhalten. Stationäre Detektoren 3 liefern punktbezogen, also für einen bestimmten Punkt an einer Kante den aktuellen Fluß Φ und können, falls sie mit Geschwindigkeitsmeßeinrichtungen ausgestattet sind, überdies die lokale Fahrzeuggeschwindigkeit messen. The type of data obtained depends on the type of detection selected. By mobile detectors in the control data (FCD) are the velocity u vehicle and directly obtain the position pos vehicle. Stationary detectors 3 deliver the current flow bezogen in a point-related manner, that is to say for a specific point on an edge, and, if they are equipped with speed measuring devices, can also measure the local vehicle speed.
Aufgrund der Detektionsdaten wird nun abschnittsweise für Kanten oder Kantenabschnitte eine zugeordnete Phase definiert. Eine Phase kann bei einer binären Quantifizierung den Wert "frei" oder "gestaut" aufweisen. Bei einer 5-fachen Unterteilung können einer Phase beispielsweise die Werte "frei", "lebhaft", "dicht", "zäh", "gestaut" zugewiesen werden. Auch jede andere Quantifizierung ist möglich.On the basis of the detection data, sections for edges or Edge sections defined an assigned phase. A phase can be with a binary quantification have the value "free" or "jammed". At a 5-fold Subdivisions can include the values "free", "lively", "dense", "tough", "jammed" can be assigned. Any other quantification is also possible.
Aus von mobilen Detektoren 2 gewonnenen Detektionsdaten kann die Phase in einer Kante oder einem Kantenabschnitt, in welchem sich diese Detektoren befinden, beispielsweise aufgrund der mittleren Geschwindigkeit der detektierenden Fahrzeuge bestimmt werden. Eventuell kann die Geschwindigkeitsvarianz insbesondere zur genauen Phasenunterteilung herangezogen werden. So kann einem Kantenabschnitt, in welchem sich die Fahrzeuge mit hoher Geschwindigkeit (und eventuell geringer zeitlicher Geschwindigkeitsschwankung) fortbewegen, die Phase "frei" zugeordnet werden und einem Kantenabschnitt, in welchem sich die Fahrzeuge mit niedriger Geschwindigkeit (und eventuell relativ hoher zeitlicher Geschwindigkeitsschwankung) fortbewegen, die Phase "gestaut" zugeordnet werden. Bei mehr als binärer Phasen-Quantifizierung ist es möglich, im durch Geschwindigkeit und Varianz der in einer Kante sich fortbewegenden Fahrzeuge aufgespannten Parameterraum geeignete Zustandsgrenzen zu definieren, welche von den hier diskutierten Phasengrenzen zu unterscheiden sind.The phase can be obtained in one from detection data obtained from mobile detectors 2 Edge or an edge section in which these detectors are located, for example due to the average speed of the detecting vehicles be determined. The speed variance can possibly be used in particular exact phase division can be used. So an edge section, in which the vehicles move at high speed (and possibly lower temporal speed fluctuation) move, assigned the phase "free" and an edge section in which the vehicles with lower Speed (and possibly a relatively high temporal fluctuation in speed) move, the phase "jammed" assigned. With more than binary phase quantification it is possible in the speed and variance of the one Edge suitable for moving vehicles spanned parameter space Define state limits, which of the phase limits discussed here are different.
In Fig. 1 ergibt sich beispielsweise, daß im linken Kantenabschnitt a1 sich das Fahrzeug A mit relativ hoher Geschwindigkeit (und eventuell niedriger Geschwindigkeitsschwankung) fortbewegt, so daß aufgrund der vom Fahrzeug A über die Antenne 2 an eine Zentrale gesendeten Daten in der Zentrale dem Kantenabschnitt a1 die Phase "frei" zugeordnet werden kann. Im Kantenabschnitt a2 ist zu vermuten, daß sich die Fahrzeuge B, C, D, E und F mit niedrigerer Geschwindigkeit (und höheren Geschwindigkeitsschwankungen) fortbewegen. Demgemäß ist zu erwarten, daß die mit einer Antenne 2 ausgestatteten Fahrzeuge B, C, D an eine Zentrale relativ niedrige Geschwindigkeit (und eventuell hohe Geschwindigkeitsschwankungen) melden. Die Zentrale würde demgemäß dem Kantenabschnitt a2 die Phase "gestaut" zuordnen. In Fig. 1 results, for example, that in the left edge section a 1 , the vehicle A is moving at a relatively high speed (and possibly low speed fluctuation), so that due to the data sent from the vehicle A via the antenna 2 to a control center, the control center Edge section a 1 the phase "free" can be assigned. In the edge section a 2 it can be assumed that the vehicles B, C, D, E and F move at lower speeds (and higher speed fluctuations). Accordingly, it can be expected that the vehicles B, C, D equipped with an antenna 2 report a relatively low speed (and possibly high speed fluctuations) to a control center. The center would accordingly assign the phase section " 2 " to the edge section.
Im Kantenabschnitt 3 befindet sich nur das Fahrzeug G, welches jedoch nicht mit einer Antenne 2 ausgestattet ist, also keine Detektionsdaten an eine hier nicht gezeigte Zentrale übersendet. Also wird es bis zur späteren Detektion durch eine stationäre Detektionseinrichtung 3 nicht erfaßt. Deshalb nimmt die Zentrale z.B. den Fall an, nämlich daß sich im Kantenabschnitt a3 nur wenige Fahrzeuge oder kein Fahrzeug befindet und ordnet diesem Kantenabschnitt a3 den Phasenzustand "frei" zu. Alternativ ist es möglich, einem Kantenabschnitt oder einer Kante die Phase aufgrund der letzten gemessenen Detektionsdaten zuzuordnen.Only the vehicle G is located in the edge section 3, but not with it an antenna 2, so no detection data to one here shown control center sent. So until later detection by a stationary detection device 3 is not detected. That is why the head office takes e.g. the Case, namely that there are only a few vehicles or none in the edge section a3 The vehicle is located and assigns the phase state "free" to this edge section a3. to. Alternatively, it is possible to phase an edge section or an edge assign based on the last measured detection data.
Im oben ausgeführten Beispiel wurden festen Kantenabschnitten gleicher Länge auf einer Kante jeweils Phasen zugeordnet. Ferner ist es möglich, entlang einer Kante mit beliebiger Auflösung Phasen unterschiedlicher Länge zu definieren, indem beispielsweise zwischen zwei um mehr als einen Schwellwert beabstandeten Fahrzeugen die Phase "frei" angenommen wird und entlang einer beliebig langen Fahrzeugkolonne die Phase "Stau" angenommen wird.In the example given above, fixed edge sections of the same length were used phases are assigned to an edge. It is also possible to use along an edge any resolution to define phases of different lengths by for example between two spaced apart by more than one threshold Vehicles the phase "free" is assumed and along any length Vehicle column the "traffic jam" phase is adopted.
Mangels vollständiger Daten kann auch das Alter der letzten Messung in einem bestimmten Streckenabschnitt ein Kriterium sein, dort den Zustand "frei" anzunehmen. In der Regel stehen Daten nur von einem kleinen Teil der Fahrzeuge zur Verfügung.In the absence of complete data, the age of the last measurement in one can certain section of the route can be a criterion, there the status "free" to assume. As a rule, data is only available from a small part of the vehicles to disposal.
Aufgrund des in Fig. 1 oben dargestellten aktuellen Verkehrszustandes des Verkehrsnetzes soll nun eine Prognose berechnet werden, wie in Fig. 1 unten dargestellt.Due to the current traffic condition of the vehicle shown in FIG. 1 above A traffic forecast is now to be calculated, as in FIG. 1 below shown.
Zur Prognose wird die erwartete Bewegung der Phasengrenzen jeder Phase innerhalb des Verkehrsnetzes verwendet, um die künftige Lage der Phasengrenzen und damit die Position und hier auch der Größe der Phasen zu einem zukünftigen Zeitpunkt zu bestimmen.The forecast is the expected movement of the phase boundaries of each phase used within the transport network to determine the future location of the phase boundaries and thus the position and here also the size of the phases to a future one To determine the point in time.
Eine Phase hat zwei Phasengrenzen, nämlich die in Fig. 1 oben links vom Fahrzeug B befindliche vordere Phasengrenze 4 und die in Fig. 1 oben rechts vom Fahrzeug F befindliche hintere Phasengrenze 5. A phase has two phase boundaries, namely the top left of the vehicle in FIG. 1 B located front phase boundary 4 and the top right of the vehicle F in FIG. 1 rear phase boundary 5.
Die vordere Phasengrenze kann sich beispielsweise im Falle eines Unfalles an der Position des Fahrzeuges B in Fig. 1 mit der Geschwindigkeit Vvordere Phasengrenze = Null bewegen, in welchem Falle sich die hintere Phasengrenze 5 in Fig. 1 oben nach rechts mit der Geschwindigkeit Vhintere Phasengrenze bewegen würde, wobei sich die Länge der Phase 2 = "Stau" vergrößern würde.The front phase boundary can move, for example in the event of an accident, at the position of the vehicle B in FIG. 1 with the speed V front phase boundary = zero, in which case the rear phase boundary 5 in FIG. 1 moves upward to the right at the speed V rear Phase boundary would move, the length of phase 2 = "traffic jam" would increase.
Selten ist der Fall, daß der Stau, wie in Fig. 1 oben, durch niedrige Geschwindigkeiten der Fahrzeuge B, C etc. erzeugt wird, wobei sich die vordere Phasengrenze mit der Geschwindigkeit Vvordere Phasengrenze in Bildrichtung nach links bewegt. Häufiger ist eine Bewegung der vorderen und hinteren Phasengrenze entgegen der Flußrichtung, also in Fig. 1 nach rechts.Rarely is the case that the congestion, as in FIG. 1 above, is generated by low speeds of vehicles B, C etc., the front phase boundary moving to the left at the speed V front phase boundary . More frequent is a movement of the front and rear phase boundary against the flow direction, that is to the right in Fig. 1.
Ferner fährt im in Fig. 1 dargestellten Beispiel das Fahrzeug G auf die Autokolonne B, C, E, F auf, so daß sich die Phase 2 nach hinten etwas verlängert, obwohl sie sich in Fahrtrichtung der Fahrzeuge fortbewegt.Furthermore, in the example shown in FIG. 1, vehicle G drives onto car column B, C, E, F on, so that phase 2 extends a little to the rear, even though it is in Direction of travel of the vehicles.
Dabei ist die Geschwindigkeit v der Phasengrenzen von den Geschwindigkeiten u der Fahrzeuge zu unterscheiden.The speed v is the phase boundaries of the speeds u Distinguish vehicles.
In Fig. 2 ist ein weiteres Beispiel der aktuellen Verkehrssituation in Fig. 2 oben und in Fig. 2 unten der sich daraus entwickelnden künftigen Verkehrssituation dargestellt. In diesem Beispiel hat sich die vordere Phasengrenze 4 mit der Geschwindigkeit vvordere Phasengrenze nach links bewegt und die hintere Phasengrenze, also das Stauende mit der Geschwindigkeit Vhintere Phasengrenze nach rechts bewegt.FIG. 2 shows a further example of the current traffic situation in FIG. 2 above and in FIG. 2 below the future traffic situation that results from this. In this example, the front phase boundary 4 has moved to the left at the speed v front phase boundary and the rear phase boundary, that is to say the end of the traffic jam, has moved to the right at the speed V rear phase boundary .
Die Fahrzeuge B, C aus der Phase 6 in Fig. 2 oben sind in Fig. 2 unten bereits nach links aus dem Stau herausgefahren.The vehicles B, C from phase 6 in FIG. 2 above are already behind in FIG. 2 left the traffic jam.
Obige Beispiele veranschaulichen, daß aufgrund des aktuellen Verkehrszustandes eine Prognose des künftigen Verkehrszustandes möglich ist, wenn die Geschwindigkeiten Vstau = vvordere Phasengrenze und Vstau = Vhintere Phasengrenze berechnet werden, mit welchen sich jeweils eine Phase fortbewegt. Aus den berechneten Phasengrenzengeschwindigkeiten läßt sich dann zumindest längs einer Kante für eine Prognose der Ort der Phasengrenze zum Prognosezeitpunkt aus der Beziehung "Weg = Geschwindigkeit mal Zeit" und dem aktuellen Ort der Phasengrenze bestimmen. Mit der Berechnung der beiden prognostizierten Phasengrenzen ist die prognostizierte Phase definiert.The above examples illustrate that, based on the current traffic condition, a forecast of the future traffic condition is possible if the speeds V congestion = v front phase boundary and V congestion = V rear phase boundary are calculated, with each of which a phase travels. From the calculated phase boundary velocities, the location of the phase boundary at the time of the prognosis can be determined at least along an edge for a prediction from the relationship "path = velocity times time" and the current location of the phase boundary. The forecast phase is defined by calculating the two forecast phase limits.
Die Berechnung der Geschwindigkeit einer Phasengrenze hängt von der Art der
vorliegenden Daten ab.
Liegen nur Daten von mobilen Detektoren (FCD) vor, so kann vvordere Phasengrenze und
vhintere Phasengrenze z.B. durch lineare Regression aus den Positionen der Phasengrenzen
zu verschiedenen Zeiten berechnet werden. Falls überdies Daten (Φ) von stationären
Quellen vorliegen, können die Phasengrenzengeschwindigkeiten v aus der Beziehung
If only data from mobile detectors (FCD) are available, then v front phase boundary and v rear phase boundary can be calculated, for example by linear regression, from the positions of the phase boundaries at different times. In addition, if there are data (Φ) from stationary sources, the phase boundary velocities v can be taken from the relationship
Mit den zu erhaltenden Geschwindigkeiten v der Phasengrenzen ist damit, wie oben ausgeführt, eine Prognose der Phasen-Bewegung längs einer Kante möglich.With the velocities v to be obtained, the phase boundaries are as above executed, a prognosis of the phase movement along an edge is possible.
Jedoch kann sich aus dem wie oben berechneten Produkt der Geschwindigkeit der betrachteten Phasengrenze und der Zeitdifferenz zwischen jetzt und dem Prognosezeitpunkt, also aus dem derart prognostizierten Phasengrenzenort, auch ergeben, daß sich eine Phase über einen Knoten, also eine Kreuzung, einen Zufluß zur Straße oder einen Abfluß von der Straße hinwegbewegt. In diesem Falle ist eine Betrachtung der Kanten, welche mit dem Knoten verbunden sind, über welchen sich die betrachtete Phase hinwegbewegt, erforderlich.However, from the product calculated as above, the speed of the considered phase boundary and the time difference between now and that Forecast time, i.e. from the phase boundary location predicted in this way, too result in a phase over a node, i.e. an intersection, an inflow moved to the street or a drain from the street. In this case it is Examination of the edges, which are connected with the knot, over which there is moved the phase under consideration, required.
Fig. 3 zeigt dabei beispielhaft einen schraffiert dargestellten Stau in der oberen Kante k1, welcher die in (durch dicke Pfeile in den Kanten jeweils angedeuteter) Fahrtrichtung vordere Phasengrenze 4 und die hintere Phasengrenze 5 aufweist. Dabei bewegen sich die Fahrzeuge im Stau in Richtung des dicken Pfeiles in der schraffierten Fläche mit der Geschwindigkeit uFahrzeug fort. Die hintere Staugrenze 5 bewege sich, weil beispielsweise mehr Fahrzeuge auf die Staugrenze von hinten auffahren (Σ Φzu in Fig. 4) als von der Staugrenze 5 nach vorne wegfahren können (Σ Φab in Fig. 4), entgegen der Richtung des dicken Pfeiles, also in Richtung des neben der oberen Kante 1 angedeuteten schmalen Pfeiles mit der Geschwindigkeit vhintere Phasengrenze auf die Kreuzung zu.3 shows an example of a hatched jam in the upper edge k 1 , which has the front phase boundary 4 and the rear phase boundary 5 (indicated by thick arrows in the edges). The vehicles move in the traffic jam in the direction of the thick arrow in the shaded area at the speed u vehicle . The rear stowage limit 5 moves because, for example, more vehicles can drive onto the stowage limit from behind (Σ Σ towards in FIG. 4) than from the stowage limit 5 towards the front (Σ Σ down in FIG. 4), counter to the direction of the thick one Arrow, ie in the direction of the narrow arrow indicated next to the upper edge 1 at the speed v rear phase boundary towards the intersection.
Bei Rückstau aus der Kante k1 in die Kreuzung hinein ist zu erwarten, daß in der unteren Kante k3 und der linken Kante k4, aus welchen sich Fahrzeuge auf die Kreuzung zubewegen, ebenfalls Rückstau in Form einer Bewegung einer hinteren Phasengrenze einer "Stau"-Phase entgegen der Fahrtrichtung in diesen Kanten ausbreitet.In the case of backwater from the edge k 1 into the intersection, it is to be expected that in the lower edge k 3 and the left edge k 4 , from which vehicles are moving towards the intersection, also backwater in the form of a movement of a rear phase boundary of a "traffic jam "Phase spreads against the direction of travel in these edges.
Hierzu soll nun wieder die Phasengrenzengeschwindigkeit der hinteren Phase 5 in
den Kanten 3 und 4 berechnet werden. Mit der oben angegebenen bekannten
Beziehung
Dabei werden die Variablen in dieser Formel z.B. folgendermaßen bestimmt:
Φk, also der Fluß in einer Kante k (k3 oder k4) vor dem Erreichen des Staus, kann mit
stationären Detektoren gemessen werden, aus FCD geschätzt werden oder einer mit
unabhängigen Methoden geschätzten dynamischen OD-Matrix entnommen werden.
Ferner kann, wenn ausschließlich FCD-Daten vorliegen, ein Fluß Φ aus der
Beziehung
Der im Stau transportierte Restfluß Φs 1 kann mit der aus einer obigen Formel durch
Umformen erreichten folgenden Beziehung bestimmt werden.
Der Fluß in einer Knoten-Zufluß-Kante k3 oder k4 kann bei Abwesenheit von
Schockwellen im Bereich des Knotens aufgrund von Flußerhaltung (
Die Geschwindigkeit der Fahrzeuge in der Kante k im Stau zu berechnen ist
schwieriger. Einerseits ist davon auszugehen, daß die Dichte im neuen Stau hinter
dem Knoten größer als im freien Verkehr in dieser Kante ist, andererseits ist eine
Staugeschwindigkeit uk s zur Berechnung erforderlich. Deshalb wird die
Geschwindigkeit uk s folgendermaßen angenommen:
Damit ist auch eine Prognose der Bewegung von Phasengrenzen bei Rückstau einer hinteren Phasengrenze 5 über einen Knoten hinweg in andere Kanten möglich. In die Abflußkante k2 breitet sich zumindest ein Rückstau nicht aus.This also makes it possible to predict the movement of phase boundaries when a rear phase boundary 5 is backed up over a node into other edges. At least one backflow does not spread into the drainage edge k 2 .
Zur Berechnung der Ausbreitung von Phasen über Knoten hinweg ist die Einbeziehung insbesondere von phänomologischen Daten wie dem Abbiegeverhalten an Knoten ohne Stau und/oder bei Stau vorteilhaft.To calculate the spread of phases across nodes is the Inclusion in particular of phenomenological data such as the turning behavior advantageous at nodes without traffic jams and / or traffic jams.
Fig. 4 zeigt anhand eines Flußdiagramms die Berechnung einer Phasenprognose. Nach Eintritt in das Programm an einer mit "Start" bezeichneten Stelle 6 werden eventuell die aktuellen Fahrzeuggeschwindigkeiten u (und eventuelle die Fahrzeugpositionen pos) in Variablen als vorherige Fahrseuggeschwindigkeiten und Positionen gespeichert. Das weitere Verfahren hängt von der Art der praktizierten Meßmethode ab:4 shows the calculation of a phase forecast using a flow chart. After entering the program, you will be at a point 6 marked "Start" possibly the current vehicle speeds u (and possibly the Vehicle positions pos) in variables as previous vehicle speeds and Positions saved. The further procedure depends on the type of practice Measurement method from:
Bei reiner FCD-Messung 7 werden von den Fahrzeugen an die Zentrale lediglich die Geschwindigkeiten, und z.B. mit GPS meßbare Positionen der Fahrzeuge, übermittelt. Bei FCD-Messung und zusätzlicher stationärer Erfassung werden zusätzlich zu den FCD-Daten uFahrzeug von den stationären Detektoren jeweils die Flüsse Φ am Detektor gemessen und an eine Zentrale übermittelt. Bei beiden Meßmethoden wird im nächsten gemeinsamen Schritt 9 der aktuelle Verkehrszustand durch das Netz überdeckende Phasen bestimmt, wobei eine Phase in einer Kante oder einem Kantenabschnitt jeweils aufgrund der mittleren Fahrzeuggeschwindigkeiten in dieser Kante berechnet wird. Eventuell kann auch die Varianz der Fahrzeuggeschwindigkeiten u mit einbezogen werden. Hohe Geschwindigkeit (und eventuell zusätzlich niedrige Varianz) der Geschwindigkeit kann beispielsweise als Phase "frei" interpretiert werden.In the case of pure FCD measurement 7, only the speeds and, for example, positions of the vehicles that can be measured with GPS, are transmitted from the vehicles to the control center. In the case of FCD measurement and additional stationary detection, in addition to the FCD data u vehicle , the fluxes Φ are measured by the stationary detectors at the detector and transmitted to a control center. With both measurement methods, the current common traffic condition is determined in the next common step 9 by the phases covering the network, a phase in an edge or an edge section being calculated in each case on the basis of the average vehicle speeds in this edge. The variance of the vehicle speeds u may also be included. High speed (and possibly additionally low variance) in speed can be interpreted as a "free" phase, for example.
Die Berechnung der Fortpflanzungsgeschwindigkeit vs einer vorderen oder hinteren Phasengrenze innerhalb einer Kante hängt von der Art der vorliegenden Detektionsdaten ab.The calculation of the propagation speed v s of a front or rear phase boundary within an edge depends on the type of detection data available.
Liegen nur FCD-Daten, also Fahrzeuggeschwindigkeiten jetzt und zu mindestens
einem früheren Zeitpunkt vor, kann die Fortpflanzungsgeschwindigkeit v einer
Phasengrenze innerhalb einer Kante z.B. durch lineare Regression bestimmt werden.
Ferner wäre sogar aus Daten eines einzelnen "Floating Car" die Bestimmung der
Fortpflanzungsgeschwindigkeit v einer Phasengrenze aus der Beziehung Fluß =
Dichte mal Geschwindigkeit (
Die Phasenausbreitungsprognose 12 innerhalb einer Kante (also zwischen Kreuzungen und Einmündungen) aufgrund der Phasengrenzengeschwindigkeit ergibt sich aus der Beziehung Weg = Geschwindigkeit mal Zeit und der aktuellen Phasengrenzen-Position (Position aktuell). Damit lassen sich die neuen Phasengrenzen (PositionPhasengrenze)aus der Phasengrenzengeschwindigkeit (v Phasengrenze in dieser Kante) und der Zeitdifferenz zwischen dem Prognosezeitpunkt und der jetzigen Zeit bestimmen. Mit der Prognose der Phasengrenzen ist innerhalb der Kanten die Prognose der Phasen möglich.The phase spread forecast 12 within an edge (that is, between intersections and junctions) based on the phase boundary speed results from the relationship path = speed times time and the current phase boundary position ( current position). The new phase limits (position phase limit ) can be determined from the phase limit speed (v phase limit in this edge) and the time difference between the forecast time and the current time. With the forecast of the phase boundaries, the forecast of the phases is possible within the edges.
Es kann sich ein Phasengrenzen-Prognose-Ort jenseits eines Knotens, also eine Phasenausbreitung über einen Konten hinweg, ergeben:There can be a phase boundary forecast location beyond a node, i.e. one Phase spread across an account gives:
Die Phasenausbreitungsprognose über Knoten (Kreuzungen, Einmündungen, Abfahrten) hinweg in an diesem Knoten anliegende Kanten ergibt sich mit der im Kasten 13 angegebenen Formel.The phase spread forecast over nodes (crossings, junctions, Descents) in edges adjacent to this node results in the im Box 13 formula given.
Hiermit ist die Ausgabe 14 der Phasenprognose für das gesamte Verkehrsnetz möglich, anhand derer sich der Verkehrszustand zum Prognosezeitpunkt im Verkehrsnetz beurteilen läßt.This is edition 14 of the phase forecast for the entire transport network possible, on the basis of which the traffic condition at the time of the forecast in Traffic network can be assessed.
Bei zyklischem Durchlaufen des Verfahrens besteht der nächste Schritt 15 darin, wieder zum Start 6 zurückzukehren. Damit ist eine laufend aktualisierte Verkehrsprognose möglich.When the method is cycled through, the next step 15 is to to return to start 6. This is a continuously updated traffic forecast possible.
Das oben beschriebene Verfahren ist ein mögliches Ausführungsbeispiel. Weitere Optimierungen dieses Prognoseverfahrens sind möglich. Insbesondere kann die Meßmethode nicht nur FCD oder FCD/stationär, sondern auch eine komplexe orts-/zeitabhängige Mischung hiervon sein. Ferner kann es vorteilhaft sein, Knoten nach Abbiegequoten zu klassifizieren. Auch kann ein phänomenologisches Modell mit einbezogen werden. Die Dynamik von Phasengrenzen kann aus einem makroskopischen Modell oder phänomenologisch bestimmt werden. Die Prognose kann laufend oder auf Dienstanfrage, also Benutzeranfrage im Rahmen eines Verkehrstelematikdienstes, hin erfolgen.The method described above is a possible embodiment. Further This forecasting process can be optimized. In particular, the Measurement method not only FCD or FCD / stationary, but also a complex one location / time-dependent mixture of these. It may also be advantageous to knot to be classified according to turn rates. A phenomenological model can also be used be included. The dynamics of phase boundaries can be macroscopic Model or be determined phenomenologically. The forecast can ongoing or on service request, i.e. user request as part of a Traffic telematics service.
Fig. 5 zeigt als Blockschaltbild ein "floating car" (im Verkehr mitschwimmendes Fahrzeug) mit dem Bezugszeichen A, welches über eine drahtlose Kommunikationsschnittstelle 20 mit einer Zentrale Z in Verbindung steht. Die drahtlose Kommunikationsschnittstelle 20 kann beispielsweise Mobilfunk sein.Fig. 5 shows a block diagram of a "floating car" (floating in traffic Vehicle) with the reference symbol A, which is via a wireless communication interface 20 is connected to a central Z. The wireless Communication interface 20 can be, for example, mobile radio.
Im Fahrzeug A werden mit einer Sensorik 21 die Geschwindigkeit des Fahrzeuges und die Position des Fahrzeuges (z.B. anhand von GPS oder in anderer Weise) bestimmt. Eventuell kann eine Vorbearbeitung dieser Daten anhand einer z.B. durch Fernkonfiguration erstellten Voreinstellung und virtuellen Umgebung durch Vergleich und Auswertung möglich sein. Die unbearbeiteten oder bearbeiteten Daten u (und evtl. die Position) werden über eine Kommunikationsschnittstelle 22, also einen Sender, an den Empfänger 23 der Zentrale gesendet. In der Zentrale werden von einem Rechner 24 aufgrund dieser Daten Verkehrsphasen identifiziert (25) und die Bewegung der Phasengrenzen prognostiziert (26).In vehicle A, the speed of the vehicle is measured with a sensor system 21 and the position of the vehicle (e.g. using GPS or in another way) certainly. It is possible that this data can be pre-processed using e.g. by Remote configuration created preset and virtual environment by comparison and evaluation. The raw or edited data u (and possibly the position) are via a communication interface 22, i.e. a Sender, sent to the receiver 23 of the control center. At the headquarters are from A computer 24 identifies traffic phases on the basis of this data (25) and the Movement of the phase boundaries predicted (26).
Aus der Identifikation von Verkehrsphasen (25) ist die Entwicklung von Verkehrsmeldungen und Berechnung von Reisezeiten (28) möglich. Die gewonnenen Phasen-Prognosen können für eine Stauverlaufsprognose und/oder für eine Prognose von Reisezeiten (27) verwendet werden.From the identification of traffic phases (25) is the development of traffic reports and calculation of travel times (28) possible. The phase forecasts obtained can be used for a traffic jam prognosis and / or for a forecast of Travel times (27) can be used.
Ferner ist es vorstellbar, aufgrund der identifizierten Verkehrsphasen (z.B. Stau) und der Prognose der Bewegung der Phasengrenzen von einer Steuerung 29 aus über die Kommunikationsschnittstelle 23 in Form eines Senders und Empfängers z.B. per Funk (20) ein Fahrzeug A über dessen Kommunikationsschnittstelle 22 in Form eines Senders und Empfängers von A vor Staus zu warnen und evtl. Umleitungsvorschläge zu geben. Auch ist eine Fernkonfiguration der virtuellen Umgebung im Fahrzeug A von der Zentrale aus möglich. Hier wäre in Figur 5 noch ein Pfeil vom gestrichelten Kasten "Verkehrsinformation" zur Kommunikationseinheit der Zentrale und eine Dienstleistungskomponente im Fahrzeug A einzufügen.Furthermore, it is conceivable, based on the identified traffic phases (e.g. traffic jam) and the prognosis of the movement of the phase boundaries from a controller 29 the communication interface 23 in the form of a transmitter and receiver e.g. by Radio (20) a vehicle A via its communication interface 22 in the form of a To warn sender and recipient of A of traffic jams and possible redirection suggestions to give. There is also a remote configuration of the virtual environment in vehicle A. possible from the head office. Here would be an arrow from the dashed in Figure 5 Box "traffic information" to the communication unit of the control center and one Insert service component in vehicle A.
Claims (16)
die Zentrale aus der Vielzahl der eingehenden Meldungen eine Beschreibung des aktuellen Verkehrszustandes des Verkehrsnetzes in Form das Verkehrsnetz überdeckender, jeweils den Zustand in einer Kante oder einem Kantenabschnitt repräsentierender Verkehrsphasen bestimmt
und wobei die Zentrale für einen künftigen Zeitpunkt eine Beschreibung des Verkehrszustandes des Verkehrsnetzes durch Berechnung zumindest der Bewegungen und der zukünftigen Positionen der Verkehrsphasen im Verkehrsnetz prognostiziert.Method for forecasting the traffic condition in a traffic network formed from a plurality of edges and nodes on the basis of detection data relating to the current traffic which are detected by detectors and which are transmitted from the detectors to a central station in accordance with a set or adjustable reporting behavior, wherein
the control center determines from the large number of incoming messages a description of the current traffic condition of the traffic network in the form of traffic phases covering the traffic network, each representing the condition in an edge or an edge section
and the control center predicts a description of the traffic state of the traffic network by calculating at least the movements and the future positions of the traffic phases in the traffic network for a future point in time.
dadurch gekennzeichnet,
daß die Verkehrsphasen in fünf Stufen quantisiert werden.Method according to claim 1,
characterized,
that the traffic phases are quantized in five stages.
dadurch gekennzeichnet,
daß die Verkehrsphase in einem Kantenabschnitt aufgrund der Geschwindigkeiten der Fahrzeuge in diesem Kantenabschnitt bestimmt wird.Method according to one of the preceding claims,
characterized,
that the traffic phase in an edge section is determined on the basis of the speeds of the vehicles in this edge section.
dadurch gekennzeichnet,
daß zur Bestimmung der Verkehrsphase in einem Kantenabschnitt nur oder auch eine Fahrzeuggeschwindigkeitsvarianz verwendet wird. Method according to one of the preceding claims,
characterized,
that only or a vehicle speed variance is used to determine the traffic phase in an edge section.
dadurch gekennzeichnet,
daß die Prognose überdies auf der Berechnung der Größenveränderung von Verkehrsphasen basiert.Method according to one of the preceding claims,
characterized,
that the forecast is also based on the calculation of the size change of traffic phases.
dadurch gekennzeichnet,
daß disjunkte, das Verkehrsnetz vollständig überdeckende Verkehrsphasen zur Verkehrszustandsprognose verwendet werden.Method according to one of the preceding claims,
characterized,
that disjoint traffic phases that completely cover the traffic network are used for the traffic condition forecast.
dadurch gekennzeichnet,
daß in Kantenabschnitten, in welchen keine Detektionsdaten vorliegen, die Verkehrsphase als "frei" angenommen wird.Method according to one of the preceding claims,
characterized,
that the traffic phase is assumed to be "free" in edge sections in which there is no detection data.
dadurch gekennzeichnet,
daß die Berechnung der Phasengrenzengeschwindigkeit der Phasengrenzen alleine aufgrund von durch im Verkehr mitschwimmende Detektoren gemeldeten, aktuellen und vorherigen Detektionsdaten durch lineare Regression erfolgt.Method according to one of the preceding claims,
characterized,
that the calculation of the phase boundary speed of the phase boundaries takes place solely on the basis of current and previous detection data reported by detectors floating in the traffic by linear regression.
dadurch gekennzeichnet,
daß zur Berechnung der Phasengrenzengeschwindigkeit der Phasengrenzen einer Verkehrsphase zumindest in einigen Ortsbereichen Detektionsdaten von im Verkehr mitschwimmenden Detektoren und Detektionsdaten von stationären Detektoren verwendet werden.Method according to one of claims 1 to 7,
characterized,
that in order to calculate the phase boundary speed of the phase boundaries of a traffic phase, at least in some local areas, detection data from detectors floating in traffic and detection data from stationary detectors are used.
dadurch gekennzeichnet,
daß die Berechnung des Verkehrszustandes von Kantenabschnitten, in welchen sich Phasengrenzen nur entlang dieser Kante fortbewegen, aufgrund der Phasengrenzengeschwindigkeit erfolgt. Method according to one of the preceding claims,
characterized,
that the calculation of the traffic condition of edge sections, in which phase boundaries only move along this edge, takes place on the basis of the phase boundary speed.
dadurch gekennzeichnet,
daß, wenn sich eine Verkehrsphase über einen Knoten hinweg ausbreitet, die Phasengrenzengeschwindigkeiten der Phasen in den an diesem Knoten anliegenden Kanten (k) mit Zufluß zum Knoten aufgrund der Phasengrenzengeschwindigkeit (vk) in der Verkehrsphase, die sich über den Knoten hinweg ausbreitet, vor dem Knoten und jeweils dem Fluß Φ in einer am Knoten anliegenden Kante bei Stau (Φk s) und ohne Stau (Φk s) berechnet wird.Method according to one of claims 1 to 9,
characterized,
that when a traffic phase spreads across a node, the phase boundary speeds of the phases in the edges (k) adjacent to that node with inflow to the node due to the phase boundary speed (v k ) in the traffic phase spreading across the node the node and in each case the flow Φ in an edge adjacent to the node in the case of traffic jam (Φ k s ) and without traffic jam (Φ k s ) is calculated.
dadurch gekennzeichnet,
daß die Phasengrenzengeschwindigkeit vk in einer Kante nach folgender Beziehung berechnet wird:
characterized,
that the phase boundary velocity v k is calculated in an edge according to the following relationship:
dadurch gekennzeichnet,
daß für die Geschwindigkeit uk s der Fahrzeuge in der Kante k durch Stau eingesetzt wird:
characterized,
that for the speed u k s of the vehicles in the edge k is used by congestion:
dadurch gekennzeichnet,
daß der Fluß Φk s in einer Kante k bei Stau aus dem Fluß Φk in der Kante ohne Stau und den Zuflüssen Φzu zum Knoten und den Abflüssen Φab vom Knoten berechnet wird zu:
characterized,
that the flow Φ k s in an edge k for congestion is calculated from the flow Φ k in the edge without congestion and the inflows Φ to the node and the outflows Φ from the node to:
dadurch gekennzeichnet,
daß zur Berechnung der Ausbreitung und/oder Größenveränderung einer Verkehrsphase die benachbarten Verkehrsphasen mitberücksichtigt werden.Method according to one of the preceding claims,
characterized,
that the neighboring traffic phases are also taken into account when calculating the spread and / or size change of a traffic phase.
mit einem Empfänger für Meldungen von Detektoren und einem Rechner(24)zur Prognose der zukünftigen Verkehrssituation mit einem Programm, welches Schritte zur Bestimmung von Verkehrsphasen in Kanten oder Kantenabschnitten aufgrund von Daten, die von Detektoren eingehen, und zur Prognose der künftigen Positionen der Phasengrenzen aufweist.Central (z), in particular for performing the method according to one of the preceding claims,
with a receiver for reports from detectors and a computer (24) for forecasting the future traffic situation with a program which has steps for determining traffic phases in edges or edge sections on the basis of data coming in from detectors and for forecasting the future positions of the phase boundaries .
Applications Claiming Priority (2)
| Application Number | Priority Date | Filing Date | Title |
|---|---|---|---|
| DE19725556A DE19725556A1 (en) | 1997-06-12 | 1997-06-12 | Method and device for predicting traffic conditions |
| DE19725556 | 1997-06-12 |
Publications (3)
| Publication Number | Publication Date |
|---|---|
| EP0884708A2 true EP0884708A2 (en) | 1998-12-16 |
| EP0884708A3 EP0884708A3 (en) | 2000-03-15 |
| EP0884708B1 EP0884708B1 (en) | 2004-08-25 |
Family
ID=7832719
Family Applications (1)
| Application Number | Title | Priority Date | Filing Date |
|---|---|---|---|
| EP98250194A Expired - Lifetime EP0884708B1 (en) | 1997-06-12 | 1998-06-04 | Method and device for traffic condition prognosis |
Country Status (3)
| Country | Link |
|---|---|
| EP (1) | EP0884708B1 (en) |
| AT (1) | ATE274736T1 (en) |
| DE (2) | DE19725556A1 (en) |
Cited By (12)
| Publication number | Priority date | Publication date | Assignee | Title |
|---|---|---|---|---|
| EP1026649A2 (en) * | 1999-02-06 | 2000-08-09 | DaimlerChrysler AG | Method and device to prepare traffic information |
| NL1011501C2 (en) * | 1999-03-09 | 2000-09-12 | Wiebren De Jonge | The Traffic Information & Pricing (TIP) system. |
| EP1061491A1 (en) * | 1999-06-11 | 2000-12-20 | DDG Gesellschaft für Verkehrsdaten mbH | Method for filtering of traffic data to determine travel speeds on roads |
| WO2001020574A1 (en) * | 1999-09-14 | 2001-03-22 | Daimlerchrysler Ag | Method for monitoring the condition of traffic for a traffic network comprising effective narrow points |
| WO2001055993A1 (en) * | 2000-01-27 | 2001-08-02 | Trafficmaster Developments Limited | Apparatus and method for monitoring road traffic |
| EP1154389A1 (en) * | 2000-05-10 | 2001-11-14 | DaimlerChrysler AG | Method to determine the traffic situation in a road network |
| EP1176569A2 (en) * | 2000-07-28 | 2002-01-30 | DaimlerChrysler AG | Method for monitoring the condition of traffic for a traffic network comprising effective narrow points |
| EP1235195A2 (en) * | 2001-02-23 | 2002-08-28 | Hitachi, Ltd. | Method of presuming traffic conditions by using floating cars |
| EP1326222A1 (en) * | 2002-01-03 | 2003-07-09 | DDG Gesellschaft für Verkehrsdaten mbH | Method for self consistent estimation of predictive travel times for use with mobile or stationary detectors for measuring run travel times |
| WO2004059592A1 (en) * | 2002-12-20 | 2004-07-15 | Daimlerchrysler Ag | Method and system for centre- based, anticipated disturbance recognition by disturbance flank detection using section-related travel time estimation |
| CN100463009C (en) * | 2006-12-25 | 2009-02-18 | 北京世纪高通科技有限公司 | Traffic information fusion processing method and system |
| DE19917154B4 (en) * | 1999-04-16 | 2013-09-05 | Deutsche Telekom Ag | Method for detecting congestion situations on roads and vehicle equipment with a unit for carrying out the method |
Families Citing this family (8)
| Publication number | Priority date | Publication date | Assignee | Title |
|---|---|---|---|---|
| DE19835979B4 (en) * | 1998-08-08 | 2005-01-05 | Daimlerchrysler Ag | Method for monitoring traffic conditions and vehicle inflow control in a road network |
| DE19944077C2 (en) * | 1999-09-14 | 2002-02-07 | Daimler Chrysler Ag | Method and device for traffic condition monitoring |
| DE19954971B4 (en) * | 1999-11-16 | 2004-08-12 | Daimlerchrysler Ag | System for influencing the traffic flow of vehicles |
| DE10018562C1 (en) * | 2000-04-14 | 2002-02-07 | Daimler Chrysler Ag | Traffic data provision method for traffic network uses data signaling vehicles which circulate with traffic flow for providing data for each regulated network node |
| DE10062856B4 (en) * | 2000-12-16 | 2008-01-10 | Daimlerchrysler Ag | Method for vehicle-specific traffic forecast |
| JP4982143B2 (en) | 2006-09-27 | 2012-07-25 | クラリオン株式会社 | Traffic situation prediction device |
| US9542843B2 (en) | 2007-08-29 | 2017-01-10 | Continental Teves Ag & Co. Ohg | Personalized updating of digital navigation maps |
| DE102018210020A1 (en) | 2018-06-20 | 2019-12-24 | Robert Bosch Gmbh | Method for controlling a traffic flow |
Citations (4)
| Publication number | Priority date | Publication date | Assignee | Title |
|---|---|---|---|---|
| WO1994011839A1 (en) * | 1992-11-19 | 1994-05-26 | Kjell Olsson | Prediction method of traffic parameters |
| EP0715285A1 (en) * | 1994-11-28 | 1996-06-05 | MANNESMANN Aktiengesellschaft | Method for reducing the amount of data to be transmitted from vehicles of a fleet of vehicles |
| EP0740280A2 (en) * | 1995-04-28 | 1996-10-30 | INFORM Institut für Operations Research und Management GmbH | Disturbance detection method for road traffic |
| DE19647127A1 (en) * | 1996-11-14 | 1998-05-28 | Daimler Benz Ag | Road traffic jam monitoring and analysis method |
-
1997
- 1997-06-12 DE DE19725556A patent/DE19725556A1/en not_active Withdrawn
-
1998
- 1998-06-04 DE DE59811857T patent/DE59811857D1/en not_active Expired - Lifetime
- 1998-06-04 EP EP98250194A patent/EP0884708B1/en not_active Expired - Lifetime
- 1998-06-04 AT AT98250194T patent/ATE274736T1/en not_active IP Right Cessation
Patent Citations (4)
| Publication number | Priority date | Publication date | Assignee | Title |
|---|---|---|---|---|
| WO1994011839A1 (en) * | 1992-11-19 | 1994-05-26 | Kjell Olsson | Prediction method of traffic parameters |
| EP0715285A1 (en) * | 1994-11-28 | 1996-06-05 | MANNESMANN Aktiengesellschaft | Method for reducing the amount of data to be transmitted from vehicles of a fleet of vehicles |
| EP0740280A2 (en) * | 1995-04-28 | 1996-10-30 | INFORM Institut für Operations Research und Management GmbH | Disturbance detection method for road traffic |
| DE19647127A1 (en) * | 1996-11-14 | 1998-05-28 | Daimler Benz Ag | Road traffic jam monitoring and analysis method |
Non-Patent Citations (2)
| Title |
|---|
| IOKIBE T ET AL: "TRAFFIC PREDICTION METHOD BY FUZZY LOGIC" PROCEEDINGS OF THE INTERNATIONAL CONFERENCE ON FUZZY SYSTEMS,US,NEW YORK, IEEE, Bd. CONF. 2, Seite 673-678 XP000371490 ISBN: 0-7803-0614-7 * |
| SADAO TAKABA ET AL: "ESTIMATION AND MEASUREMENT OF TRAVEL TIME BY VEHICLE DETECTORS AND LICENSE PLATE READERS" PROCEEDINGS OF THE VEHICLE NAVIGATION AND INFORMATION SYSTEMS CONFERENCE,US,NEW YORK, IEEE, Bd. -, Seite 257-267 XP000348211 ISBN: 0-7803-0488-8 * |
Cited By (19)
| Publication number | Priority date | Publication date | Assignee | Title |
|---|---|---|---|---|
| EP1026649A3 (en) * | 1999-02-06 | 2000-09-27 | DaimlerChrysler AG | Method and device to prepare traffic information |
| US6240364B1 (en) | 1999-02-06 | 2001-05-29 | Daimlerchrysler Ag | Method and device for providing traffic information |
| EP1026649A2 (en) * | 1999-02-06 | 2000-08-09 | DaimlerChrysler AG | Method and device to prepare traffic information |
| AU763951B2 (en) * | 1999-03-09 | 2003-08-07 | Wiebren De Jonge | The traffic information and pricing (TIP) system |
| NL1011501C2 (en) * | 1999-03-09 | 2000-09-12 | Wiebren De Jonge | The Traffic Information & Pricing (TIP) system. |
| WO2000054240A1 (en) * | 1999-03-09 | 2000-09-14 | Wiebren De Jonge | The traffic information and pricing (tip) system |
| DE19917154B4 (en) * | 1999-04-16 | 2013-09-05 | Deutsche Telekom Ag | Method for detecting congestion situations on roads and vehicle equipment with a unit for carrying out the method |
| EP1061491A1 (en) * | 1999-06-11 | 2000-12-20 | DDG Gesellschaft für Verkehrsdaten mbH | Method for filtering of traffic data to determine travel speeds on roads |
| WO2001020574A1 (en) * | 1999-09-14 | 2001-03-22 | Daimlerchrysler Ag | Method for monitoring the condition of traffic for a traffic network comprising effective narrow points |
| US6813555B1 (en) | 1999-09-14 | 2004-11-02 | Daimlerchrysler Ag | Method for monitoring the condition of traffic for a traffic network comprising effective narrow points |
| WO2001055993A1 (en) * | 2000-01-27 | 2001-08-02 | Trafficmaster Developments Limited | Apparatus and method for monitoring road traffic |
| EP1154389A1 (en) * | 2000-05-10 | 2001-11-14 | DaimlerChrysler AG | Method to determine the traffic situation in a road network |
| EP1176569A3 (en) * | 2000-07-28 | 2003-05-14 | DaimlerChrysler AG | Method for monitoring the condition of traffic for a traffic network comprising effective narrow points |
| EP1176569A2 (en) * | 2000-07-28 | 2002-01-30 | DaimlerChrysler AG | Method for monitoring the condition of traffic for a traffic network comprising effective narrow points |
| EP1235195A2 (en) * | 2001-02-23 | 2002-08-28 | Hitachi, Ltd. | Method of presuming traffic conditions by using floating cars |
| EP1235195A3 (en) * | 2001-02-23 | 2005-02-09 | Hitachi, Ltd. | Method of presuming traffic conditions by using floating cars |
| EP1326222A1 (en) * | 2002-01-03 | 2003-07-09 | DDG Gesellschaft für Verkehrsdaten mbH | Method for self consistent estimation of predictive travel times for use with mobile or stationary detectors for measuring run travel times |
| WO2004059592A1 (en) * | 2002-12-20 | 2004-07-15 | Daimlerchrysler Ag | Method and system for centre- based, anticipated disturbance recognition by disturbance flank detection using section-related travel time estimation |
| CN100463009C (en) * | 2006-12-25 | 2009-02-18 | 北京世纪高通科技有限公司 | Traffic information fusion processing method and system |
Also Published As
| Publication number | Publication date |
|---|---|
| DE59811857D1 (en) | 2004-09-30 |
| DE19725556A1 (en) | 1998-12-24 |
| ATE274736T1 (en) | 2004-09-15 |
| EP0884708B1 (en) | 2004-08-25 |
| EP0884708A3 (en) | 2000-03-15 |
Similar Documents
| Publication | Publication Date | Title |
|---|---|---|
| EP0884708B1 (en) | Method and device for traffic condition prognosis | |
| DE102007037920B4 (en) | Traffic condition prediction device | |
| EP3042368B1 (en) | Method, evaluation system and vehicle for forecasting at least a traffic jam parameter | |
| EP1212738B1 (en) | Method for monitoring the condition of traffic for a traffic network comprising effective narrow points | |
| EP0789341B1 (en) | Vehicle on board detection of traffic jam | |
| DE102011083677A1 (en) | Method for predicting traffic conditions for e.g. electric car, involves determining future information for traffic conditions of vehicle based on current state of vehicle and historical data | |
| DE69631629T2 (en) | Registration and prediction of traffic obstructions | |
| DE102008003039A1 (en) | Vehicle traffic condition recognizing method for traffic assistance system, involves differentiating traffic jam conditions on basis of measured speed, and recognizing traffic jam condition if another traffic jam condition is not recognized | |
| EP2280383A1 (en) | Method for determining traffic information for a section of a road network and traffic calculator to implement the method | |
| DE102013000385A1 (en) | Method for determining travel route proposal for upcoming trip, involves providing description of particular traffic event together with typical environment feature given during particular traffic event | |
| EP1061491A1 (en) | Method for filtering of traffic data to determine travel speeds on roads | |
| EP0292897A2 (en) | Evaluation method of the travel time measured in vehicles by means of a guidance and information device in a guidance and information system | |
| DE10108611A1 (en) | Simulation and prediction method for individual motor vehicle movement within a road network, by separation of macroscopic modeling from microscopic or individual vehicle modeling | |
| DE10036364C2 (en) | Process for creating forecast traffic data for traffic information | |
| DE19944077C2 (en) | Method and device for traffic condition monitoring | |
| DE102005055244A1 (en) | Traffic data-based accident detecting method, involves concluding existence of accident when accident criterion is derived and determined from characteristic properties and parameters of temporal-spatial traffic patterns | |
| EP2887332B1 (en) | Method and system for detection of a traffic situation on a stretch of road | |
| EP2418632B1 (en) | Method for regulating a signalling assembly | |
| EP1528524B1 (en) | Method for traffic prognosis based on historical data | |
| EP2047448B1 (en) | Method and device for generating early warnings signalling traffic collapses at narrow points | |
| DE10326973A1 (en) | Traffic information method for automatically determining a high-quality measure for traffic information applies a traffic reference position while comparing journey times over a section of journey | |
| DE10234367B3 (en) | Traffic situation imaging method for traffic flow organization system uses correlation of flow lines dependent on measured traffic parameters | |
| EP1526493B1 (en) | Method for display of traffic information in a vehicle | |
| DE102010064063B4 (en) | Method and device for computer-aided prognosis of the travel time of a vehicle on a route made up of one or more route segments | |
| DE10359977B4 (en) | Method for determining a travel time |
Legal Events
| Date | Code | Title | Description |
|---|---|---|---|
| PUAI | Public reference made under article 153(3) epc to a published international application that has entered the european phase |
Free format text: ORIGINAL CODE: 0009012 |
|
| AK | Designated contracting states |
Kind code of ref document: A2 Designated state(s): AT BE CH CY DE DK ES FI FR GB GR IT LI NL PT SE |
|
| AX | Request for extension of the european patent |
Free format text: AL;LT;LV;MK;RO;SI |
|
| PUAL | Search report despatched |
Free format text: ORIGINAL CODE: 0009013 |
|
| AK | Designated contracting states |
Kind code of ref document: A3 Designated state(s): AT BE CH CY DE DK ES FI FR GB GR IE IT LI LU MC NL PT SE |
|
| AX | Request for extension of the european patent |
Free format text: AL;LT;LV;MK;RO;SI |
|
| 17P | Request for examination filed |
Effective date: 20000509 |
|
| AKX | Designation fees paid |
Free format text: AT BE CH CY DE DK ES FI FR GB GR IT LI NL PT SE |
|
| RAP1 | Party data changed (applicant data changed or rights of an application transferred) |
Owner name: VODAFONE AG |
|
| 17Q | First examination report despatched |
Effective date: 20030414 |
|
| RAP1 | Party data changed (applicant data changed or rights of an application transferred) |
Owner name: VODAFONE HOLDING GMBH |
|
| GRAP | Despatch of communication of intention to grant a patent |
Free format text: ORIGINAL CODE: EPIDOSNIGR1 |
|
| RAP1 | Party data changed (applicant data changed or rights of an application transferred) |
Owner name: ATX EUROPE GMBH |
|
| GRAS | Grant fee paid |
Free format text: ORIGINAL CODE: EPIDOSNIGR3 |
|
| GRAA | (expected) grant |
Free format text: ORIGINAL CODE: 0009210 |
|
| AK | Designated contracting states |
Kind code of ref document: B1 Designated state(s): AT BE CH CY DE DK ES FI FR GB GR IT LI NL PT SE |
|
| PG25 | Lapsed in a contracting state [announced via postgrant information from national office to epo] |
Ref country code: NL Free format text: LAPSE BECAUSE OF FAILURE TO SUBMIT A TRANSLATION OF THE DESCRIPTION OR TO PAY THE FEE WITHIN THE PRESCRIBED TIME-LIMIT Effective date: 20040825 Ref country code: IT Free format text: LAPSE BECAUSE OF FAILURE TO SUBMIT A TRANSLATION OF THE DESCRIPTION OR TO PAY THE FEE WITHIN THE PRESCRIBED TIME-LIMIT;WARNING: LAPSES OF ITALIAN PATENTS WITH EFFECTIVE DATE BEFORE 2007 MAY HAVE OCCURRED AT ANY TIME BEFORE 2007. THE CORRECT EFFECTIVE DATE MAY BE DIFFERENT FROM THE ONE RECORDED. Effective date: 20040825 Ref country code: GB Free format text: LAPSE BECAUSE OF FAILURE TO SUBMIT A TRANSLATION OF THE DESCRIPTION OR TO PAY THE FEE WITHIN THE PRESCRIBED TIME-LIMIT Effective date: 20040825 Ref country code: FR Free format text: LAPSE BECAUSE OF FAILURE TO SUBMIT A TRANSLATION OF THE DESCRIPTION OR TO PAY THE FEE WITHIN THE PRESCRIBED TIME-LIMIT Effective date: 20040825 Ref country code: FI Free format text: LAPSE BECAUSE OF FAILURE TO SUBMIT A TRANSLATION OF THE DESCRIPTION OR TO PAY THE FEE WITHIN THE PRESCRIBED TIME-LIMIT Effective date: 20040825 |
|
| REG | Reference to a national code |
Ref country code: GB Ref legal event code: FG4D Free format text: NOT ENGLISH |
|
| REG | Reference to a national code |
Ref country code: CH Ref legal event code: EP |
|
| RAP2 | Party data changed (patent owner data changed or rights of a patent transferred) |
Owner name: ATX EUROPE GMBH |
|
| REF | Corresponds to: |
Ref document number: 59811857 Country of ref document: DE Date of ref document: 20040930 Kind code of ref document: P |
|
| NLT2 | Nl: modifications (of names), taken from the european patent patent bulletin |
Owner name: ATX EUROPE GMBH |
|
| PG25 | Lapsed in a contracting state [announced via postgrant information from national office to epo] |
Ref country code: SE Free format text: LAPSE BECAUSE OF FAILURE TO SUBMIT A TRANSLATION OF THE DESCRIPTION OR TO PAY THE FEE WITHIN THE PRESCRIBED TIME-LIMIT Effective date: 20041125 Ref country code: GR Free format text: LAPSE BECAUSE OF FAILURE TO SUBMIT A TRANSLATION OF THE DESCRIPTION OR TO PAY THE FEE WITHIN THE PRESCRIBED TIME-LIMIT Effective date: 20041125 Ref country code: DK Free format text: LAPSE BECAUSE OF FAILURE TO SUBMIT A TRANSLATION OF THE DESCRIPTION OR TO PAY THE FEE WITHIN THE PRESCRIBED TIME-LIMIT Effective date: 20041125 |
|
| PG25 | Lapsed in a contracting state [announced via postgrant information from national office to epo] |
Ref country code: ES Free format text: LAPSE BECAUSE OF FAILURE TO SUBMIT A TRANSLATION OF THE DESCRIPTION OR TO PAY THE FEE WITHIN THE PRESCRIBED TIME-LIMIT Effective date: 20041206 |
|
| NLV1 | Nl: lapsed or annulled due to failure to fulfill the requirements of art. 29p and 29m of the patents act | ||
| GBV | Gb: ep patent (uk) treated as always having been void in accordance with gb section 77(7)/1977 [no translation filed] |
Effective date: 20040825 |
|
| PG25 | Lapsed in a contracting state [announced via postgrant information from national office to epo] |
Ref country code: CY Free format text: LAPSE BECAUSE OF FAILURE TO SUBMIT A TRANSLATION OF THE DESCRIPTION OR TO PAY THE FEE WITHIN THE PRESCRIBED TIME-LIMIT Effective date: 20050604 Ref country code: AT Free format text: LAPSE BECAUSE OF NON-PAYMENT OF DUE FEES Effective date: 20050604 |
|
| PG25 | Lapsed in a contracting state [announced via postgrant information from national office to epo] |
Ref country code: LI Free format text: LAPSE BECAUSE OF NON-PAYMENT OF DUE FEES Effective date: 20050630 Ref country code: CH Free format text: LAPSE BECAUSE OF NON-PAYMENT OF DUE FEES Effective date: 20050630 Ref country code: BE Free format text: LAPSE BECAUSE OF NON-PAYMENT OF DUE FEES Effective date: 20050630 |
|
| PLBE | No opposition filed within time limit |
Free format text: ORIGINAL CODE: 0009261 |
|
| STAA | Information on the status of an ep patent application or granted ep patent |
Free format text: STATUS: NO OPPOSITION FILED WITHIN TIME LIMIT |
|
| 26N | No opposition filed |
Effective date: 20050526 |
|
| EN | Fr: translation not filed | ||
| REG | Reference to a national code |
Ref country code: CH Ref legal event code: PL |
|
| BERE | Be: lapsed |
Owner name: *ATX EUROPE G.M.B.H. Effective date: 20050630 |
|
| PG25 | Lapsed in a contracting state [announced via postgrant information from national office to epo] |
Ref country code: PT Free format text: LAPSE BECAUSE OF NON-PAYMENT OF DUE FEES Effective date: 20050125 |
|
| PGFP | Annual fee paid to national office [announced via postgrant information from national office to epo] |
Ref country code: DE Payment date: 20150619 Year of fee payment: 18 |
|
| REG | Reference to a national code |
Ref country code: DE Ref legal event code: R119 Ref document number: 59811857 Country of ref document: DE |
|
| PG25 | Lapsed in a contracting state [announced via postgrant information from national office to epo] |
Ref country code: DE Free format text: LAPSE BECAUSE OF NON-PAYMENT OF DUE FEES Effective date: 20170103 |