EP0822416A2 - Verfahren und Vorrichtung zur Verbesserung zeitabhängiger Bildeinzelheiten auf einer Rasteranzeige - Google Patents
Verfahren und Vorrichtung zur Verbesserung zeitabhängiger Bildeinzelheiten auf einer Rasteranzeige Download PDFInfo
- Publication number
- EP0822416A2 EP0822416A2 EP97304952A EP97304952A EP0822416A2 EP 0822416 A2 EP0822416 A2 EP 0822416A2 EP 97304952 A EP97304952 A EP 97304952A EP 97304952 A EP97304952 A EP 97304952A EP 0822416 A2 EP0822416 A2 EP 0822416A2
- Authority
- EP
- European Patent Office
- Prior art keywords
- display
- memory
- display image
- values
- brightness
- Prior art date
- Legal status (The legal status is an assumption and is not a legal conclusion. Google has not performed a legal analysis and makes no representation as to the accuracy of the status listed.)
- Granted
Links
Images


Classifications
-
- G—PHYSICS
- G01—MEASURING; TESTING
- G01R—MEASURING ELECTRIC VARIABLES; MEASURING MAGNETIC VARIABLES
- G01R13/00—Arrangements for displaying electric variables or waveforms
- G01R13/40—Arrangements for displaying electric variables or waveforms using modulation of a light beam otherwise than by mechanical displacement, e.g. by Kerr effect
- G01R13/401—Arrangements for displaying electric variables or waveforms using modulation of a light beam otherwise than by mechanical displacement, e.g. by Kerr effect for continuous analogue, or simulated analogue, display
- G01R13/403—Arrangements for displaying electric variables or waveforms using modulation of a light beam otherwise than by mechanical displacement, e.g. by Kerr effect for continuous analogue, or simulated analogue, display using passive display devices, e.g. liquid crystal display or Kerr effect display devices
-
- G—PHYSICS
- G01—MEASURING; TESTING
- G01R—MEASURING ELECTRIC VARIABLES; MEASURING MAGNETIC VARIABLES
- G01R13/00—Arrangements for displaying electric variables or waveforms
- G01R13/02—Arrangements for displaying electric variables or waveforms for displaying measured electric variables in digital form
-
- G—PHYSICS
- G09—EDUCATION; CRYPTOGRAPHY; DISPLAY; ADVERTISING; SEALS
- G09G—ARRANGEMENTS OR CIRCUITS FOR CONTROL OF INDICATING DEVICES USING STATIC MEANS TO PRESENT VARIABLE INFORMATION
- G09G1/00—Control arrangements or circuits, of interest only in connection with cathode-ray tube indicators; General aspects or details, e.g. selection emphasis on particular characters, dashed line or dotted line generation; Preprocessing of data
- G09G1/06—Control arrangements or circuits, of interest only in connection with cathode-ray tube indicators; General aspects or details, e.g. selection emphasis on particular characters, dashed line or dotted line generation; Preprocessing of data using single beam tubes, e.g. three-dimensional or perspective representation, rotation or translation of display pattern, hidden lines, shadows
- G09G1/14—Control arrangements or circuits, of interest only in connection with cathode-ray tube indicators; General aspects or details, e.g. selection emphasis on particular characters, dashed line or dotted line generation; Preprocessing of data using single beam tubes, e.g. three-dimensional or perspective representation, rotation or translation of display pattern, hidden lines, shadows the beam tracing a pattern independent of the information to be displayed, this latter determining the parts of the pattern rendered respectively visible and invisible
- G09G1/16—Control arrangements or circuits, of interest only in connection with cathode-ray tube indicators; General aspects or details, e.g. selection emphasis on particular characters, dashed line or dotted line generation; Preprocessing of data using single beam tubes, e.g. three-dimensional or perspective representation, rotation or translation of display pattern, hidden lines, shadows the beam tracing a pattern independent of the information to be displayed, this latter determining the parts of the pattern rendered respectively visible and invisible the pattern of rectangular co-ordinates extending over the whole area of the screen, i.e. television type raster
- G09G1/162—Control arrangements or circuits, of interest only in connection with cathode-ray tube indicators; General aspects or details, e.g. selection emphasis on particular characters, dashed line or dotted line generation; Preprocessing of data using single beam tubes, e.g. three-dimensional or perspective representation, rotation or translation of display pattern, hidden lines, shadows the beam tracing a pattern independent of the information to be displayed, this latter determining the parts of the pattern rendered respectively visible and invisible the pattern of rectangular co-ordinates extending over the whole area of the screen, i.e. television type raster for displaying digital inputs as analog magnitudes, e.g. curves, bar graphs, coordinate axes, singly or in combination with alpha-numeric characters
-
- G—PHYSICS
- G01—MEASURING; TESTING
- G01R—MEASURING ELECTRIC VARIABLES; MEASURING MAGNETIC VARIABLES
- G01R13/00—Arrangements for displaying electric variables or waveforms
- G01R13/20—Cathode-ray oscilloscopes
- G01R13/22—Circuits therefor
- G01R13/34—Circuits for representing a single waveform by sampling, e.g. for very high frequencies
- G01R13/342—Circuits for representing a single waveform by sampling, e.g. for very high frequencies for displaying periodic H.F. signals
Definitions
- This invention relates generally to electronic display systems and in particular to a method and apparatus for displaying signal information with improved image details on a raster display having limited brightness levels in an electronic measurement instrument.
- Oscilloscopes are a form of test and measurement instrument that has been used for many years to measure and display electrical signals as graphical waveforms. Oscilloscopes have been traditionally divided into two classes, analog and digital, based on the technology used in the instrument. The method of measuring and displaying electrical signals between these analog and digital classes of technology is very different and each technology has its own attendant advantages and disadvantages. An electrical signal to be measured is coupled to an input terminal of the measurement instrument and becomes an input signal.
- Analog oscilloscopes measure and display the input signal by displacing an electron beam vertically as a function of the amplitude of the electrical signal as the beam is swept from one side of a cathode ray tube (CRT) to the other at a sweep rate.
- the pattern that is traced out on the phosphor of the CRT is integrated in the eyes of the oscilloscope user which allows the entire waveform to be seen.
- the CRT phosphor is selected to have a persistence time long enough to permit this integration over a wide range of sweep speeds.
- Analog oscilloscopes tend to have a high measurement duty cycle. Measurement duty cycle is the ratio of measurement time to the time spent processing the measurement and is also known as "dead time.” Most of the dead time of the analog oscilloscope is the time during which the electron beam is returned from the end of a sweep back to the beginning to start another sweep. It is desirable to have a high measurement duty cycle in order to display as much measurement information as possible because any information from the input signal that arrives during the dead time is lost. At higher sweep rates, the display of the analog oscilloscope is updated very rapidly, thereby giving the displayed waveform a "live" look that provides the ability to reveal a great deal of information about the input signal to the user, particularly in situations involving complex input signals which have considerable variation over a given measurement time. The ability to display a large amount of information about the input signal with a high measurement duty cycle tends to make the analog oscilloscope a good qualitative tool.
- Digital storage oscilloscopes operate by digitizing the input signal into discrete digital samples using an analog to digital converter (ADC), storing the digital samples in trace memory, and then converting the digital samples into graphical traces in a trace memory for subsequent display as a graphical image, typically on a raster display.
- a raster display typically uses a two dimensional array or matrix of picture elements (pixels) arranged in rows and columns, with each pixel assigned a brightness value.
- a typical raster display has hundreds of rows and columns with which to construct a display image with the raster display update rate being independent of the sweep or measurement rate.
- DSO's have an advantage over analog oscilloscopes by having the ability to store, recall, and perform calculations on the stored digital samples. As such. DSO's tend to be good quantitative tools for accurately measuring voltage and time characteristics of the input signal. However, the measurement duty cycle of DSO's, along with the update rate, tends to be substantially lower than that of analog oscilloscopes. In a DSO, the full measurement speed is only available when the trace memory is being filled while the remaining time is dead time in which the digital samples are processed. The DSO, therefore, while a good quantitative tool, tends to be not as good for use as a qualitative tool for visualizing the real time behavior of the input signal because of its relatively low measurement duty cycle.
- a single acquisition of the input signal over a predetermined acquisition time captures a view of the electrical signal in the spatial domain, which is the amplitude variation of the input signal versus acquisition time.
- a complex electrical signal may have variations over multiple acquisitions in the temporal domain which is amplitude variation versus acquisition number.
- the changing character of the electrical signal in the temporal domain may be captured over multiple acquisitions which are stored as the display image.
- the display image is thus a function of acquisition time, which remains constant, and temporal time, which is as long as desired and measured in the terms of the number of acquisitions.
- a new DSO measurement architecture has recently emerged that substantially improves the update rate and measurement duty cycle.
- digital samples are converted directly to pixel information as quickly as they arrive from the ADC to build a display image over numerous acquisitions.
- the display image because of its increased measurement duty cycle, more closely resembles the traditional analog oscilloscope in providing a qualitative image of the electrical signal.
- the display image is stored only in the form of pixel information and not in terms of actual measurement values, the qualitative value of the display image is reduced because precise measurements are no longer possible.
- the multiple acquisitions must be mapped onto a limited set of pixels in the raster display with each pixel having a limited set of brightness levels.
- various methods have been devised for building the display image while preserving the temporal information over multiple acquisitions of the electrical signal.
- Prior art DSO's typically use false color to represent the frequency of which any particular pixel has been accessed over multiple acquisitions. In this way, transient signals and infrequent anomalies may be highlighted with a different color from that of a repetitious signal having substantially the same temporal behavior over multiple acquisitions.
- DSO's are increasingly being designed as portable, handheld, battery-operated instruments, often using liquid crystal display (LCD) technology.
- LCD liquid crystal display
- Readily-available LCD technology effectively provides only four levels of brightness, typically in a monochrome LCD display. Power consumption, physical size, and LCD display brightness and resolution are critical factors in the design of a portable DSO.
- a method of displaying digital samples in the form of a raster display image with enhanced image details using a limited set of brightness values is provided.
- a raster display device is employed to display the image which is stored in display memory as pixels arranged by row and column.
- Digital samples are stored in intensity memory which is typically mapped to the rows and columns of the raster display.
- Digital samples taken from an input signal which is present at a set of input terminals of a DSO arrive at a relatively high sample rate.
- Each trigger event creates a sweep of samples across the columns of the intensity memory.
- the digital samples are interpolated and stored as pixel information in the high resolution intensity memory.
- An adaptive mapping process maps the high resolution intensity information to low intensity brightness information for storage in a display memory in a manner so as to maximize image details.
- An equal number of pixels from each of the four brightness levels from light to dark are allocated in each column along the sweep in an adaptive manner depending on the distribution of intensity information.
- An adaptive recombination process combines past and present brightness information in a manner that best preserves image details when the temporal behavior of the input signal is changing.
- a composite indicator is developed based on the past pixel information previously stored in the brightness memory. The present and past brightness information is combined in a manner governed by the composite indicator so as to most effectively preserve image details.
- a raster display device is employed to display the image which is stored as brightness levels in the display memory as pixels arranged by row and column.
- the raster display device is a liquid crystal display (LCD) having four brightness levels ranging from white. light gray, dark gray, to black.
- One object of the present invention is to provide a method of displaying enhanced image details on a raster display.
- Another object of the present invention is to provide a method of displaying enhanced image details on a raster display having a limited number of brightness levels.
- An additional object of the present invention is to provide a method of displaying enhanced image details on a raster display using an adaptive algorithm to combine past and present display images.
- a further object of the present invention is to provide a raster display system for displaying improved image details using adaptive algorithms to map intensity to brightness information and to combine past and present brightness information.
- an input signal 10 which is illustrated as a sine wave signal for purposes of example.
- Most oscilloscopes, analog or digital, are capable of displaying the sine wave signal because there is relatively slow variation in the temporal domain.
- a series of sweeps 12, 14, 16, and 18, each with a sweep time t are conducted sequentially during the overall measurement time T for a total sweep time of 4t.
- the time between each of the sweeps 12, 14, 16, and 18 is dead time.
- the ratio of sweep time to overall measurement time is the measurement duty cycle. If the input signal 10 has a transient event 20 as shown, it is desirable that the oscilloscope have as high a duty cycle as possible to maximize the chance of capturing the transient event 20.
- FIG. 1B illustrates a raster display image that shows a composite display image 22 of the input signal 10 as captured by the sweeps 12, 14, 16, and 18.
- various oscilloscope technologies may be used to combine the images captured by the sweeps 12, 14, 16, and 18 to form the composite display image 22.
- the transient event 20 may be highlighted as a temporal variation using the available brightness levels of the display.
- FIG. 2 is a simplified block diagram of a digital storage oscilloscope (DSO) according to the prior art.
- the input signal 10 is coupled to an analog to digital converter (ADC) 30 which produces a series of digital samples which are stored in a trace memory 32. After an entire trace has been collected as a sweep, the trace information is processed into pixel information and transferred to a display memory 34 and the trace appears on a display 36 as a graphical trace.
- ADC analog to digital converter
- This method of measurement and display often derived using repetitive digital sampling techniques, provides a detailed waveform display of the input signal 10 in the spatial domain but with a relatively low duty cycle. If the input signal 10 is not repetitive or is complex in nature and having a large amount of temporal variation, this method suffers because a substantial amount of signal information is lost during the dead time.
- FIG. 3 is a simplified block diagram of a DSO which adds a display processor 38 after the trace memory 32 according to the present invention.
- the input signal 10 is coupled to the ADC 30 which provides digital samples 40 to the display processor 38.
- the display processor 38 operates to convert the digital samples 40 via the trace memory 32 into pixel information as the digital samples 40 arrive which is placed into the display memory 34 for display on the display 36.
- the display processor 38 operates on the pixel information derived from multiple sweeps to display the composite image 22 in enhanced detail according to the present invention as explained in further detail below.
- FIG. 4 is a three dimensional representation of an input signal 20 in the form of a video test signal as measured over multiple sweeps.
- Video signals containing synchronization pulses, chrominance information, and luminance information, are typical of complex signals often measured by the oscilloscope.
- a complete video frame comprises 525 video lines in the North American NTSC standard or 625 video lines in the European PAL standard. Within the video frame, a large amount of temporal variation among the video lines is possible. It is desirable that as much information as possible about the temporal domain variation within the overall video frame be displayed.
- Sweeps 50, 52, 54, 56, and 58 graphically depict a representative sample of the types of video lines that may be encountered within a single video frame.
- the sweep of the measurement instrument is synchronized to measure each video line separately.
- the sweep 50, 52, 54, 56, and 58 are defined by amplitude versus sweep time.
- the sweeps 50, 52, 54, 56, and 58 are sequentially measured and combined to form the composite image 22.
- the sweep number axis thus represents the temporal variation of the input signal over time.
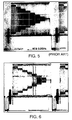
- FIG. 5 is an illustration of the input signal 10 of FIG. 4 in the form of a video test signal over an entire video frame as would typically be displayed on an analog oscilloscope according to the prior art.
- the analog oscilloscope has an advantage of being able to displav a relatively complex structure with a relatively high amount of temporal variation comprising the multiple sweeps of the input signal 10 and thus conveys a substantial amount of information about the input signal 10 to the oscilloscope user.
- FIG. 6 is a composite display image as developed over multiple sweeps on a raster display of a DSO incorporating a display processor operating according to the present invention.
- the display processor 38 (shown in FIG. 3) develops an enhanced image which more clearly shows the variations in the temporal variations in the input signal 10 by allocating the limited brightness levels among the pixels of a raster display in an optimal manner using the first and second adaptive processes.
- the raster display has four brightness levels including white, light gray, dark gray, and black.
- the raster display must have at least two brightness levels in order for the invention to operate and preferably more than two. Color may be used to indicate brightness levels and the invention may be readily adapted to take advantage of color displays.
- the relatively high measurement duty cycle allows more information to be captured from the input signal 10.
- the composite display image of FIG. 6 more closely resembles the oscillograph of FIG. 5 and, as implemented in a DSO using a display processor 38. allows more of the image details to be displayed on a display having limited brightness levels.
- the first and second adaptive processes in the display processor 38 provide for the optimal use of the limited brightness levels of the display 36 in order to more clearly show the structure of the input signal 10 as discussed in further detail below.
- the digital samples 40 are from the ADC 30 in the preferred embodiment and are converted to difference values between the samples in order to capture the speed of change of signal amplitude over the acquisition time in the spatial domain.
- the digital samples 40 may also originate from any type of digital source such as stored waveforms or another type of measurement front-end such as a frequency counter-timer that is amenable to graphical display over multiple sweeps and sharing a common sweep time.
- the digital samples 40 may also arrive in the form of measurement values rather than difference values, depending on the needs of the application.
- the digital samples 40 arrive at an intensity memory 50 which is arranged by rows and columns, with intensity bins arranged vertically within each column. Each intensity bin serves to store up to a predetermined amount of digital samples 40 which are assigned to an intensity bin. An interpolation process (not shown) may be employed to assign each digital sample 40 to a particular column and row within the intensity memory 50.
- each intensity bin may store up to 2 12 (12 bits) of intensity information. Greater or fewer numbers of bits may be chosen for the intensity bins depending on the available memory capacity and component cost as well as the dynamic range needed to preserve desired information about the input signal 10.
- a predetermined number of digital samples 40 are collected, depending on the sample rate of the ADC 30, and allocated to the intensity bins within the column as the sweep progresses from column to column, from left to right.
- the number of columns in the intensity memory 50 may vary from as few as one to as many as the number of columns contained in the display and depends on considerations of component cost versus throughput and functionality. In the preferred embodiment, three columns were chosen so that brightness levels before and after the current column may be assigned based on variations in the spatial domain.
- the 12-bit, high resolution intensity information must be converted to 2-bit, lower resolution brightness information for the display image. This conversion happens on the fly, such that only a few high resolution columns are needed.
- An adaptive process 100 operates on the higher resolution intensity information to produce brightness information at a lower resolution as an adaptive mapping process. Adaptive brightness mapping is necessary because modern display technology does not easily allow for brightness resolution extending much beyond eight bits (256 levels). Furthermore, the human eye does not respond to overly subtle variations in brightness and the lower brightness levels would likely be difficult to see, thus making extended brightness resolution in the display 36 unnecessary.
- the display 36 is implemented as a liquid crystal display (LCD) of which four levels of brightness are used including white, light gray, dark gray, and black.
- LCD liquid crystal display
- Other display technologies, including color displays, may be readily adapted to take advantage of the present invention because of the fundamental limitations in brightness resolution mentioned above.
- the adaptive process 100 operates on one column at a time and maps the high resolution intensity information to lower-resolution brightness information according to a statistical analysis of the input signal. It is desirable to display predetermined portions of light gray, dark gray, and black pixels within a column in order to display enhanced image details.
- the predetermined portions among the light gray. dark gray, and black pixels are equal with the remaining white pixels remain where no pixels have been allocated.
- Other predetermined portions and distributions of brightness levels may also be chosen as desired.
- the equal distribution of pixel brightness levels is achieved by dynamically changing the intensity to brightness mapping based on the distribution of intensity levels within the intensity bins. The choice between using white pixels or black pixels for the remaining pixels is arbitrary and equally desirable.
- FIG. 8A (not to scale), there is shown an intensity to brightness level mapping with quantiles Q2 and Q3 having levels selected to providing equal areas 202, 204, and 206 under a curve 200.
- the fourth brightness level for example the white brightness level, is the arbitrarily-chosen default level of the areas of the display 36 where there is no signal.
- the shape of the curve 200 represents the distribution of values contained in the intensity bits which may assume values from 0 to 4,095.
- the shape of the curve 200 is not important because the adaptive process 100 allocates the distribution of pixels solely on the area under the curve 200, whatever its shape.
- the areas 202, 204, and 206 are made equal by appropriate setting of the quantiles Q2 and Q3.
- the curve 200 may represent the input signal 10 that contains a substantial amount of high frequency content such that the digital samples 40 are allocated across a relatively high number of different intensity bins, leaving the frequency of occurrence relatively low for any particular intensity bin. In this situation, it is desirable that the quantiles Q2 and Q3 be moved down lower in order to obtain enhanced image details.
- the high frequency content is more likely to be emphasized by being assigned to brightness level 1 or 2 while not masking out the low frequency content which is likely to be assigned to brightness level 3.
- FIG. 8B shows how the adaptive process 100 reacts to a change in the intensity to brightness mapping based on a new column of intensity information.
- a curve 201 having a different shape from the curve 200 requires a new allocation and the quantiles Q2 and Q3 are adjusted to maintain the equality of the areas 202, 204, and 206.
- the curve 201 is shifted from the curve 200 and may represent the input signal 10 that contains a substantial amount of low frequency content such that the digital samples 40 are allocated across a relatively low number of different intensity bins, leaving the frequency of occurrence relatively high for a particular set of intensity bins. In this situation, it is desirable that the quantiles Q2 and Q3 be moved up higher in order to obtain enhanced image details. Now, the low frequency content, while highly visible with brightness levels 2 or 3 does not mask out the remaining high frequency content which will likely be assigned brightness level 1.
- the adaptive process 100 thus provides a stream of present brightness values by column which are equally balanced by brightness level for the present column. By adaptively modifying the quantiles as discussed above, the mapping of the high-resolution brightness levels to the low-resolution intensity levels is possible without substantially compromising the visibility of the details of the composite image 22.
- an adaptive process 102 which operates as an adaptive recombination process to combine each present brightness value with a past brightness value that is already in display 34 to obtain a new brightness value based on an indication of the past behavior of the input signal 10.
- Each new brightness value is coupled to the display memory 34.
- the display 36 is typically implemented as a display subsystem that reads the contents of the display memory 34 at a display rate that is independent of the sweep rate.
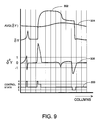
- the adaptive process 102 extracts a composite indicator of the past temporal behavior of the input signal 10 from the pixel information stored in the display memory 34 and uses that composite indicator to generate a series of control states which govern how each present brightness value is combined with a corresponding past brightness value to obtain a new brightness value. Using the control state, an appropriate recombination algorithm is chosen which allows for displaying image details optimally where the display image is a composite of past and present brightness levels.
- Trace 302 labeled ⁇ Y is the jump size within the actual column of the current sweep or the maximum difference betweeen row values of the intensity bins of the intensity memory 50. It may be desirable to smooth or low-pass filter the trace 302 in order to maintain a more stable composite indicator.
- Trace 304, labeled AVG ( ⁇ Y ) is a running average of the trace 302. The length used in the running average calculation is chosen to reflect an overall indication of the temporal behavior of the signal across a substantial number of columns.
- Trace 306, labeled ⁇ 2 Y is the derivative of trace 302.
- the control state 300 is created through the interaction of the traces 302, 304, and 306 and is chosen to have one of four possible states.
- State 2 is chosen whenever the derivative of trace 302, ⁇ 2 Y, is within a set of predetermined limits, which are arbitrarily labeled as +1 and -1 on the graph.
- ⁇ 2 Y is within the predetermined limits, the temporal behavior of the past brightness levels is defined to be stable. In this situation, the past and present brightness levels may be combined using a simple "OR" function in which the highest level of the past and present brightness levels is chosen as the new brightness level.
- Brightness level 3 is arbitrarily chosen as the highest level in the preferred embodiment corresponding to the black level.
- a series of control states 300 may be used as the composite indicator to be used in determining how the past and present brightness values are to be combined according to a set of truth tables.
- States 1, 3, or 4 may be chosen when ⁇ 2 Y is greater than the predetermined limits, meaning that the temporal behavior of the past brightness levels is in transition and there is significant slope to the curvature of ⁇ Y.
- two variables are used. First, the polarity of ⁇ 2 Y is determined to be positive or negative. Second. ⁇ Y is determined to be greater or smaller than AVG( ⁇ Y). For example, in order to get to state 1, the polarity of ⁇ 2 Y is determined to be negative and ⁇ Y is determined to be smaller than AVG( ⁇ Y). This means there is presently too little emphasis on brightness values and that the past and present values should combined in a way so as to increase an emphasis on brightness in a way not allowed by a simple OR function.
- Control State Table summarizes the assignment of states 1 through 4 based on the determinations of the state of ⁇ 2 Y and of the value of ⁇ Y with respect to AVG( ⁇ Y) which is then used to obtain the appropriate truth table.
- the adaptive process 102 provides for the adaptivity in the brightness recombination between past and present brightness values by selection of the control state based on the past brightness information stored in the display memory.
- the appropriate truth table also referred to as a recombination algorithm, is selected. Referring now to FIG. 10A-D, there is shown a set of four truth tables that govern the result of the recombination between past and present brightness values.
- FIG. 10B is the truth table labeled OR corresponding to state 2.
- the logical OR function combines the present brightness value with the past brightness value by selecting the larger of the past and present brightness value to obtain the new brightness value.
- the OR function is most appropriate for combining past and present brightness information where the temporal behavior of the input signal is not substantially changing over multiple sweeps.
- FIG. 10A, 10C, and 10D differ from the OR truth table of FIG. 10B according to the numbers that are circled.
- OR truth tables labeled OR
- SUM SUM
- DECREMENT PAST DECREMENT PAST
- INTERMEDIATE an adaptive recombination based on the past temporal behavior of the input signal 10 is accomplished.
- the adaptive recombination is conducted in a manner which preserves as much as possible the image details when the brightness levels are changing over the various sweeps, meaning the temporal behavior of the input signal is changing.
- the relative change and rate of change of the past brightness information is captured by ⁇ 2 Y and the value of ⁇ Y with respect to AVG( ⁇ Y) used in the above table.
- SUM is used when there is not enough emphasis on brightness levels.
- Brightness level 1 between past and present is assigned to a new brightness level 2.
- DECREMENT PAST is used when there is an overemphasis on intensity in the past brightness data.
- Past brightness information that is level 3 is decremented to level 2 to de-emphasize.
- INTERMEDIATE is also chosen to de-emphasize past brightness levels but less severely than the DECREMENT PAST function.
- Other truth tables in addition to the OR, SUM, DECREMENT PAST, and INTERMEDIATE may readily be added to the set using a reasonable amount of experimentation to obtain an optimal recombination based on the particular characteristics of the input signal 10.
- Recombination methods other than the selection of truth tables may be effectively employed, particularly when more brightness levels are being used with respect to the preferred embodiment, causing the sized of the truth tables to grow rapidly.
- a proportional method of recombination between past and present brightness levels may be employed.
- the past and present hrightness levels may be combined proportionately according to a linear equation which has the composite indicator as an independent variable. Proportionate recombination may thus be appropriate where more numerous brightness levels are available or a greater amount of control over recombination is required.
- the adaptive recombination of old and new brightness values may be performed in multiple dimensions, for example with brightness and with color, in substantially the same manner as above.
- the present invention may be readily adapted for greater or fewer brightness levels. Therefore, the scope of the present invention should be determined by the following claims.
Landscapes
- Physics & Mathematics (AREA)
- General Physics & Mathematics (AREA)
- Engineering & Computer Science (AREA)
- Radar, Positioning & Navigation (AREA)
- Remote Sensing (AREA)
- Computer Hardware Design (AREA)
- Theoretical Computer Science (AREA)
- Controls And Circuits For Display Device (AREA)
- Control Of Indicators Other Than Cathode Ray Tubes (AREA)
Applications Claiming Priority (2)
| Application Number | Priority Date | Filing Date | Title |
|---|---|---|---|
| US08/692,833 US5929842A (en) | 1996-07-31 | 1996-07-31 | Method and apparatus for improving time variant image details on a raster display |
| US692833 | 2003-10-23 |
Publications (3)
| Publication Number | Publication Date |
|---|---|
| EP0822416A2 true EP0822416A2 (de) | 1998-02-04 |
| EP0822416A3 EP0822416A3 (de) | 2000-05-03 |
| EP0822416B1 EP0822416B1 (de) | 2007-04-04 |
Family
ID=24782209
Family Applications (1)
| Application Number | Title | Priority Date | Filing Date |
|---|---|---|---|
| EP97304952A Expired - Lifetime EP0822416B1 (de) | 1996-07-31 | 1997-07-01 | Verfahren und Vorrichtung zur Verbesserung zeitabhängiger Bildeinzelheiten auf einer Rasteranzeige |
Country Status (3)
| Country | Link |
|---|---|
| US (1) | US5929842A (de) |
| EP (1) | EP0822416B1 (de) |
| DE (1) | DE69737543T2 (de) |
Cited By (14)
| Publication number | Priority date | Publication date | Assignee | Title |
|---|---|---|---|---|
| EP0947838A2 (de) * | 1998-04-03 | 1999-10-06 | Tektronix, Inc. | Digitaloszilloskop mit hohem Wellenformdurchsatz, variabler Intensitätsaufrasterung und Graustufen- oder Farbbildschirm |
| EP0947840A2 (de) * | 1998-04-03 | 1999-10-06 | Tektronix, Inc. | Reduktion der Bittiefe pro Pixel von einem Raster mit variabler Intensität zu einem Graustufe- oder Farbbildschirm |
| EP0947842A2 (de) * | 1998-04-03 | 1999-10-06 | Tektronix, Inc. | Nicht linearitätskorrektur eines Digitaloscilloscops mit Aufrasterung von veränderlicher Instensität |
| EP0947837A2 (de) * | 1998-04-03 | 1999-10-06 | Tektronix, Inc. | Verfahren zur Hervorhebung von unregelmässigen Ereignissen in einem digitalen Oszilloskop mit Graustufen-oder Farbbildschirm |
| EP0962781A2 (de) * | 1998-06-05 | 1999-12-08 | Tektronix, Inc. | Feststellung ungewöhnlicher Wellenformen |
| FR2790630A1 (fr) * | 1999-01-19 | 2000-09-08 | Tektronix Inc | Procede et appareil permettant d'ajuster simultanement la luminosite et le contraste au moyen d'un unique bouton dans un equipement numerique de mesure |
| EP1336852A2 (de) * | 2002-02-12 | 2003-08-20 | Tektronix, Inc. | Vorrichtung und Verfahren zum Ausgleichen von Ausgangspixelintensitätswerten eines aus gerasterten Bilddaten erzeugten Histogramms |
| EP1462809A1 (de) * | 2003-03-27 | 2004-09-29 | Tektronix Inc. | Automatische Reihung und Speicherung von unikalen Wellenformen in Oszilloskopen |
| EP1927862A1 (de) * | 2006-11-28 | 2008-06-04 | Rohde & Schwarz GmbH & Co. KG | Verfahren und Vorrichtung zur Auswahl einer Farbstufe und einer Helligkeitsstufe für Bildpunkte eines Displays |
| WO2008064752A1 (de) * | 2006-11-28 | 2008-06-05 | Rohde & Schwarz Gmbh & Co. Kg | Verfahren und vorrichtung zur ermittlung einer statistischen messkenngrösse |
| WO2010011374A2 (en) * | 2008-04-09 | 2010-01-28 | Harris Corporation | Video monitoring device providing parametric signal curve display features and related methods |
| US7936920B2 (en) | 2004-10-25 | 2011-05-03 | Athentech Technologies Inc | Method and apparatus for multiple data channel analysis using relative strength histograms |
| EP2110674A3 (de) * | 2008-04-17 | 2012-05-02 | Tektronix, Inc. | Zeichnen von Wellenformen im Erfassungssystem ohne Totzeit |
| EP2990809A1 (de) * | 2014-08-29 | 2016-03-02 | Rohde & Schwarz GmbH & Co. KG | Messvorrichtung mit Anzeigespeicher mit Speicherzellen mit einer reduzierten Bitzahl und zugehöriges Verfahren |
Families Citing this family (22)
| Publication number | Priority date | Publication date | Assignee | Title |
|---|---|---|---|---|
| AU751502B2 (en) * | 1997-03-21 | 2002-08-15 | Avix Inc. | Method of displaying high-density dot-matrix bit-mapped image on low-density dot-matrix display and system therefor |
| US6728648B1 (en) * | 1999-09-24 | 2004-04-27 | Tektronix, Inc. | Test and measurement instrument having telecommunications mask testing capability with an autofit to mask feature |
| US6778931B1 (en) * | 1999-09-24 | 2004-08-17 | Tektronix, Inc. | Test and measurement instrument having multi-channel telecommunications mask testing capability |
| US7038681B2 (en) * | 2000-03-29 | 2006-05-02 | Sourceprose Corporation | System and method for georeferencing maps |
| AU2001245995A1 (en) * | 2000-03-29 | 2001-10-08 | Provar Inc. | System and method for georeferencing digital raster maps |
| US7148898B1 (en) * | 2000-03-29 | 2006-12-12 | Sourceprose Corporation | System and method for synchronizing raster and vector map images |
| US7825929B2 (en) * | 2003-04-04 | 2010-11-02 | Agilent Technologies, Inc. | Systems, tools and methods for focus and context viewing of large collections of graphs |
| US7750908B2 (en) * | 2003-04-04 | 2010-07-06 | Agilent Technologies, Inc. | Focus plus context viewing and manipulation of large collections of graphs |
| DE102006041824A1 (de) * | 2006-09-06 | 2008-03-27 | Rohde & Schwarz Gmbh & Co. Kg | Vorrichtung und Verfahren für Analyse von Signalverläufen unter Verwendung von Masken |
| US8111209B2 (en) * | 2007-06-28 | 2012-02-07 | Qualcomm Mems Technologies, Inc. | Composite display |
| US20100019993A1 (en) * | 2008-07-23 | 2010-01-28 | Boundary Net, Incorporated | Calibrating pixel elements |
| US20100019997A1 (en) * | 2008-07-23 | 2010-01-28 | Boundary Net, Incorporated | Calibrating pixel elements |
| US20100020107A1 (en) * | 2008-07-23 | 2010-01-28 | Boundary Net, Incorporated | Calibrating pixel elements |
| CN102075774B (zh) * | 2010-12-17 | 2012-07-04 | 电子科技大学 | 一种数字三维示波器显示波形亮度的快速调节方法 |
| US20130132128A1 (en) | 2011-11-17 | 2013-05-23 | Us Airways, Inc. | Overbooking, forecasting and optimization methods and systems |
| US20140257881A1 (en) | 2013-03-08 | 2014-09-11 | Us Airways, Inc. | Demand forecasting systems and methods utilizing fare adjustment |
| US11321721B2 (en) | 2013-03-08 | 2022-05-03 | American Airlines, Inc. | Demand forecasting systems and methods utilizing prime class remapping |
| US9727940B2 (en) | 2013-03-08 | 2017-08-08 | American Airlines, Inc. | Demand forecasting systems and methods utilizing unobscuring and unconstraining |
| US20140278615A1 (en) | 2013-03-15 | 2014-09-18 | Us Airways, Inc. | Misconnect management systems and methods |
| US10748087B2 (en) * | 2014-01-17 | 2020-08-18 | American Airlines, Inc. | Determining even-spaced quantiles for network optimization |
| US10755207B1 (en) * | 2014-01-17 | 2020-08-25 | American Airlines, Inc. | Demand class remapping for airline seat bookings |
| US20160293144A1 (en) * | 2015-03-31 | 2016-10-06 | Tektronix, Inc. | Intensity information display |
Citations (7)
| Publication number | Priority date | Publication date | Assignee | Title |
|---|---|---|---|---|
| US5283596A (en) * | 1991-02-05 | 1994-02-01 | Hewlett-Packard Company | Digitally synthesized gray scale for raster scan oscilloscope color display of overlapping multichannel waveforms |
| GB2271699A (en) * | 1992-10-13 | 1994-04-20 | Gould Inc | Distinguishing overlapping oscilloscope traces |
| EP0677746A2 (de) * | 1994-04-13 | 1995-10-18 | Tektronix, Inc. | Architektur für Digitaloszilloskop zur Signalüberwachung mit verbessertem Arbeitszyklus |
| GB2295948A (en) * | 1994-12-08 | 1996-06-12 | Tektronix Inc | Graded display of digitally compressed waveforms |
| EP0738089A1 (de) * | 1995-04-06 | 1996-10-16 | Hitachi Denshi Kabushiki Kaisha | Oszilloskop mit Videosignaleingang |
| WO1996037785A1 (en) * | 1995-05-23 | 1996-11-28 | Philips Electronics N.V. | Image quality improvement on raster display |
| WO1997044677A1 (en) * | 1996-05-24 | 1997-11-27 | Lecroy, S.A. | Digital oscilloscope display and method therefor |
Family Cites Families (4)
| Publication number | Priority date | Publication date | Assignee | Title |
|---|---|---|---|---|
| US3621214A (en) * | 1968-11-13 | 1971-11-16 | Gordon W Romney | Electronically generated perspective images |
| US4547797A (en) * | 1982-10-12 | 1985-10-15 | Sperry Corporation | Apparatus for color tracking and brightness correction for multi-gun color cathode ray tube display |
| GB2235856B (en) * | 1989-09-01 | 1993-11-17 | Quantel Ltd | Improvements in or relating to electronic graphic systems |
| JPH05158464A (ja) * | 1991-12-09 | 1993-06-25 | Toshiba Corp | 解像度変換回路 |
-
1996
- 1996-07-31 US US08/692,833 patent/US5929842A/en not_active Expired - Fee Related
-
1997
- 1997-07-01 EP EP97304952A patent/EP0822416B1/de not_active Expired - Lifetime
- 1997-07-01 DE DE69737543T patent/DE69737543T2/de not_active Expired - Fee Related
Patent Citations (7)
| Publication number | Priority date | Publication date | Assignee | Title |
|---|---|---|---|---|
| US5283596A (en) * | 1991-02-05 | 1994-02-01 | Hewlett-Packard Company | Digitally synthesized gray scale for raster scan oscilloscope color display of overlapping multichannel waveforms |
| GB2271699A (en) * | 1992-10-13 | 1994-04-20 | Gould Inc | Distinguishing overlapping oscilloscope traces |
| EP0677746A2 (de) * | 1994-04-13 | 1995-10-18 | Tektronix, Inc. | Architektur für Digitaloszilloskop zur Signalüberwachung mit verbessertem Arbeitszyklus |
| GB2295948A (en) * | 1994-12-08 | 1996-06-12 | Tektronix Inc | Graded display of digitally compressed waveforms |
| EP0738089A1 (de) * | 1995-04-06 | 1996-10-16 | Hitachi Denshi Kabushiki Kaisha | Oszilloskop mit Videosignaleingang |
| WO1996037785A1 (en) * | 1995-05-23 | 1996-11-28 | Philips Electronics N.V. | Image quality improvement on raster display |
| WO1997044677A1 (en) * | 1996-05-24 | 1997-11-27 | Lecroy, S.A. | Digital oscilloscope display and method therefor |
Cited By (25)
| Publication number | Priority date | Publication date | Assignee | Title |
|---|---|---|---|---|
| EP0947838A2 (de) * | 1998-04-03 | 1999-10-06 | Tektronix, Inc. | Digitaloszilloskop mit hohem Wellenformdurchsatz, variabler Intensitätsaufrasterung und Graustufen- oder Farbbildschirm |
| EP0947840A2 (de) * | 1998-04-03 | 1999-10-06 | Tektronix, Inc. | Reduktion der Bittiefe pro Pixel von einem Raster mit variabler Intensität zu einem Graustufe- oder Farbbildschirm |
| EP0947842A2 (de) * | 1998-04-03 | 1999-10-06 | Tektronix, Inc. | Nicht linearitätskorrektur eines Digitaloscilloscops mit Aufrasterung von veränderlicher Instensität |
| EP0947837A2 (de) * | 1998-04-03 | 1999-10-06 | Tektronix, Inc. | Verfahren zur Hervorhebung von unregelmässigen Ereignissen in einem digitalen Oszilloskop mit Graustufen-oder Farbbildschirm |
| EP0947840A3 (de) * | 1998-04-03 | 2000-12-13 | Tektronix, Inc. | Reduktion der Bittiefe pro Pixel von einem Raster mit variabler Intensität zu einem Graustufe- oder Farbbildschirm |
| EP0947838A3 (de) * | 1998-04-03 | 2000-12-13 | Tektronix, Inc. | Digitaloszilloskop mit hohem Wellenformdurchsatz, variabler Intensitätsaufrasterung und Graustufen- oder Farbbildschirm |
| EP0947837A3 (de) * | 1998-04-03 | 2000-12-20 | Tektronix, Inc. | Verfahren zur Hervorhebung von unregelmässigen Ereignissen in einem digitalen Oszilloskop mit Graustufen-oder Farbbildschirm |
| EP0947842A3 (de) * | 1998-04-03 | 2001-01-17 | Tektronix, Inc. | Nicht linearitätskorrektur eines Digitaloscilloscops mit Aufrasterung von veränderlicher Instensität |
| KR100559353B1 (ko) * | 1998-04-03 | 2006-03-15 | 텍트로닉스 인코포레이티드 | 가변 휘도 또는 컬러 표시장치와 가변 휘도 래스터라이저를 가지는 고 파형 처리량 디지털 오실로스코프 |
| EP0962781A2 (de) * | 1998-06-05 | 1999-12-08 | Tektronix, Inc. | Feststellung ungewöhnlicher Wellenformen |
| EP0962781A3 (de) * | 1998-06-05 | 2002-01-02 | Tektronix, Inc. | Feststellung ungewöhnlicher Wellenformen |
| FR2790630A1 (fr) * | 1999-01-19 | 2000-09-08 | Tektronix Inc | Procede et appareil permettant d'ajuster simultanement la luminosite et le contraste au moyen d'un unique bouton dans un equipement numerique de mesure |
| EP1336852A3 (de) * | 2002-02-12 | 2004-05-06 | Tektronix, Inc. | Vorrichtung und Verfahren zum Ausgleichen von Ausgangspixelintensitätswerten eines aus gerasterten Bilddaten erzeugten Histogramms |
| EP1336852A2 (de) * | 2002-02-12 | 2003-08-20 | Tektronix, Inc. | Vorrichtung und Verfahren zum Ausgleichen von Ausgangspixelintensitätswerten eines aus gerasterten Bilddaten erzeugten Histogramms |
| US7139426B2 (en) | 2002-02-12 | 2006-11-21 | Tektronix, Inc. | Histogram data collector for applying progressively adjusted histogram equalization to an oscilloscope image |
| EP1462809A1 (de) * | 2003-03-27 | 2004-09-29 | Tektronix Inc. | Automatische Reihung und Speicherung von unikalen Wellenformen in Oszilloskopen |
| US7936920B2 (en) | 2004-10-25 | 2011-05-03 | Athentech Technologies Inc | Method and apparatus for multiple data channel analysis using relative strength histograms |
| EP1927862A1 (de) * | 2006-11-28 | 2008-06-04 | Rohde & Schwarz GmbH & Co. KG | Verfahren und Vorrichtung zur Auswahl einer Farbstufe und einer Helligkeitsstufe für Bildpunkte eines Displays |
| WO2008064752A1 (de) * | 2006-11-28 | 2008-06-05 | Rohde & Schwarz Gmbh & Co. Kg | Verfahren und vorrichtung zur ermittlung einer statistischen messkenngrösse |
| US8630818B2 (en) | 2006-11-28 | 2014-01-14 | Rohde & Schwarz GmgH & Co. KG | Method and device for the determination of a statistical measurement value |
| WO2010011374A2 (en) * | 2008-04-09 | 2010-01-28 | Harris Corporation | Video monitoring device providing parametric signal curve display features and related methods |
| WO2010011374A3 (en) * | 2008-04-09 | 2010-03-18 | Harris Corporation | Video signal parameter waveform or vector display providing brightness modulation of the displayed curve depending upon its derivative with respect to time |
| US8717435B2 (en) | 2008-04-09 | 2014-05-06 | Hbc Solutions, Inc. | Video monitoring device providing parametric signal curve display features and related methods |
| EP2110674A3 (de) * | 2008-04-17 | 2012-05-02 | Tektronix, Inc. | Zeichnen von Wellenformen im Erfassungssystem ohne Totzeit |
| EP2990809A1 (de) * | 2014-08-29 | 2016-03-02 | Rohde & Schwarz GmbH & Co. KG | Messvorrichtung mit Anzeigespeicher mit Speicherzellen mit einer reduzierten Bitzahl und zugehöriges Verfahren |
Also Published As
| Publication number | Publication date |
|---|---|
| US5929842A (en) | 1999-07-27 |
| DE69737543T2 (de) | 2007-12-13 |
| EP0822416A3 (de) | 2000-05-03 |
| EP0822416B1 (de) | 2007-04-04 |
| DE69737543D1 (de) | 2007-05-16 |
Similar Documents
| Publication | Publication Date | Title |
|---|---|---|
| US5929842A (en) | Method and apparatus for improving time variant image details on a raster display | |
| EP0901636B2 (de) | Display und verfahren für digitaloszilloskop | |
| JP4722953B2 (ja) | ヒストグラム調整装置 | |
| JP2997913B2 (ja) | 波形の取込み及び表示方法 | |
| EP0435527A1 (de) | Kodierung eines Bildelementes | |
| US5550963A (en) | Graded display of digitally compressed waveforms | |
| DE69927879T2 (de) | Feststellung ungewöhnlicher Wellenformen | |
| US6104374A (en) | Sparse vector rasterization | |
| DE69921889T2 (de) | Methode zum Reagieren auf ungewöhnliche Wellenformen | |
| EP1094320B1 (de) | Test- und Messinstrument mit mehrkanaliger Telekommunikationsmaskentestfähigkeit | |
| US6333732B1 (en) | Multi-function digital persistence decay | |
| JP3610273B2 (ja) | デジタル試験測定機器の調整方法及び装置 | |
| EP0371231B1 (de) | Verfahren und Einrichtung zur Erhöhung der Geschwindigkeit zum Generieren von Bildern für Rasteranzeige | |
| JPH05209905A (ja) | 波形表示方法 | |
| EP0969285B1 (de) | Verfahren zur Kontrast- und Helligkeitsregelung in einem Rasterabtastdigitaloszilloskop | |
| JPH11326463A (ja) | 波形画像の可変輝度又は可変カラ―の表示における稀な事象を強調する方法 | |
| US6201527B1 (en) | Technique for displaying enveloped waveform | |
| JPH02276972A (ja) | 波形測定装置 | |
| GB2207517A (en) | Signal processing | |
| JP2003057269A (ja) | 波形表示装置及び波形表示方法 | |
| JPS63265288A (ja) | 面分析デ−タの表示諧調割り当て方式 | |
| EP0586424A1 (de) | Videosimulation einer crt-antwort. | |
| JPH0378036B2 (de) |
Legal Events
| Date | Code | Title | Description |
|---|---|---|---|
| PUAI | Public reference made under article 153(3) epc to a published international application that has entered the european phase |
Free format text: ORIGINAL CODE: 0009012 |
|
| AK | Designated contracting states |
Kind code of ref document: A2 Designated state(s): DE FR GB |
|
| PUAL | Search report despatched |
Free format text: ORIGINAL CODE: 0009013 |
|
| AK | Designated contracting states |
Kind code of ref document: A3 Designated state(s): AT BE CH DE DK ES FI FR GB GR IE IT LI LU MC NL PT SE |
|
| 17P | Request for examination filed |
Effective date: 20001103 |
|
| AKX | Designation fees paid |
Free format text: DE FR GB |
|
| 17Q | First examination report despatched |
Effective date: 20010206 |
|
| GRAP | Despatch of communication of intention to grant a patent |
Free format text: ORIGINAL CODE: EPIDOSNIGR1 |
|
| GRAS | Grant fee paid |
Free format text: ORIGINAL CODE: EPIDOSNIGR3 |
|
| GRAA | (expected) grant |
Free format text: ORIGINAL CODE: 0009210 |
|
| AK | Designated contracting states |
Kind code of ref document: B1 Designated state(s): DE FR GB |
|
| REG | Reference to a national code |
Ref country code: GB Ref legal event code: FG4D |
|
| REF | Corresponds to: |
Ref document number: 69737543 Country of ref document: DE Date of ref document: 20070516 Kind code of ref document: P |
|
| ET | Fr: translation filed | ||
| PLBE | No opposition filed within time limit |
Free format text: ORIGINAL CODE: 0009261 |
|
| STAA | Information on the status of an ep patent application or granted ep patent |
Free format text: STATUS: NO OPPOSITION FILED WITHIN TIME LIMIT |
|
| 26N | No opposition filed |
Effective date: 20080107 |
|
| PGFP | Annual fee paid to national office [announced via postgrant information from national office to epo] |
Ref country code: DE Payment date: 20080829 Year of fee payment: 12 |
|
| PGFP | Annual fee paid to national office [announced via postgrant information from national office to epo] |
Ref country code: FR Payment date: 20080729 Year of fee payment: 12 |
|
| PGFP | Annual fee paid to national office [announced via postgrant information from national office to epo] |
Ref country code: GB Payment date: 20080729 Year of fee payment: 12 |
|
| GBPC | Gb: european patent ceased through non-payment of renewal fee |
Effective date: 20090701 |
|
| REG | Reference to a national code |
Ref country code: FR Ref legal event code: ST Effective date: 20100331 |
|
| PG25 | Lapsed in a contracting state [announced via postgrant information from national office to epo] |
Ref country code: FR Free format text: LAPSE BECAUSE OF NON-PAYMENT OF DUE FEES Effective date: 20090731 |
|
| PG25 | Lapsed in a contracting state [announced via postgrant information from national office to epo] |
Ref country code: GB Free format text: LAPSE BECAUSE OF NON-PAYMENT OF DUE FEES Effective date: 20090701 |
|
| PG25 | Lapsed in a contracting state [announced via postgrant information from national office to epo] |
Ref country code: DE Free format text: LAPSE BECAUSE OF NON-PAYMENT OF DUE FEES Effective date: 20100202 |