EP0457989B1 - Titrationskurvenabschätzung zur adaptiven pH-Wert-Kontrolle - Google Patents
Titrationskurvenabschätzung zur adaptiven pH-Wert-Kontrolle Download PDFInfo
- Publication number
- EP0457989B1 EP0457989B1 EP90312628A EP90312628A EP0457989B1 EP 0457989 B1 EP0457989 B1 EP 0457989B1 EP 90312628 A EP90312628 A EP 90312628A EP 90312628 A EP90312628 A EP 90312628A EP 0457989 B1 EP0457989 B1 EP 0457989B1
- Authority
- EP
- European Patent Office
- Prior art keywords
- titration curve
- gain
- data points
- model
- controller
- Prior art date
- Legal status (The legal status is an assumption and is not a legal conclusion. Google has not performed a legal analysis and makes no representation as to the accuracy of the status listed.)
- Expired - Lifetime
Links
- 238000000954 titration curve Methods 0.000 title claims description 88
- 230000003044 adaptive effect Effects 0.000 title claims description 25
- 238000000034 method Methods 0.000 claims description 135
- 239000003153 chemical reaction reagent Substances 0.000 claims description 34
- 238000002156 mixing Methods 0.000 claims description 13
- 238000000354 decomposition reaction Methods 0.000 claims description 4
- 239000002131 composite material Substances 0.000 claims description 2
- 239000002253 acid Substances 0.000 description 26
- 239000000243 solution Substances 0.000 description 20
- 238000012360 testing method Methods 0.000 description 20
- 239000000126 substance Substances 0.000 description 17
- 239000000203 mixture Substances 0.000 description 14
- 150000002500 ions Chemical class 0.000 description 13
- XLYOFNOQVPJJNP-UHFFFAOYSA-N water Substances O XLYOFNOQVPJJNP-UHFFFAOYSA-N 0.000 description 12
- 239000002699 waste material Substances 0.000 description 11
- 150000007513 acids Chemical class 0.000 description 10
- 238000010494 dissociation reaction Methods 0.000 description 10
- 230000005593 dissociations Effects 0.000 description 10
- 238000006386 neutralization reaction Methods 0.000 description 8
- 230000003139 buffering effect Effects 0.000 description 7
- 230000007935 neutral effect Effects 0.000 description 7
- 238000004448 titration Methods 0.000 description 6
- 238000006243 chemical reaction Methods 0.000 description 5
- 230000000694 effects Effects 0.000 description 5
- NBIIXXVUZAFLBC-UHFFFAOYSA-N Phosphoric acid Chemical compound OP(O)(O)=O NBIIXXVUZAFLBC-UHFFFAOYSA-N 0.000 description 4
- FAPWRFPIFSIZLT-UHFFFAOYSA-M Sodium chloride Chemical compound [Na+].[Cl-] FAPWRFPIFSIZLT-UHFFFAOYSA-M 0.000 description 4
- QAOWNCQODCNURD-UHFFFAOYSA-N Sulfuric acid Chemical compound OS(O)(=O)=O QAOWNCQODCNURD-UHFFFAOYSA-N 0.000 description 4
- -1 hydrogen ions Chemical class 0.000 description 4
- 150000003839 salts Chemical class 0.000 description 4
- HEMHJVSKTPXQMS-UHFFFAOYSA-M Sodium hydroxide Chemical compound [OH-].[Na+] HEMHJVSKTPXQMS-UHFFFAOYSA-M 0.000 description 3
- 229910052739 hydrogen Inorganic materials 0.000 description 3
- 239000001257 hydrogen Substances 0.000 description 3
- 230000010355 oscillation Effects 0.000 description 3
- 235000011007 phosphoric acid Nutrition 0.000 description 3
- 238000011144 upstream manufacturing Methods 0.000 description 3
- 239000002351 wastewater Substances 0.000 description 3
- 206010013457 Dissociation Diseases 0.000 description 2
- 230000002378 acidificating effect Effects 0.000 description 2
- 235000019846 buffering salt Nutrition 0.000 description 2
- 238000012937 correction Methods 0.000 description 2
- 238000010586 diagram Methods 0.000 description 2
- 238000010790 dilution Methods 0.000 description 2
- 239000012895 dilution Substances 0.000 description 2
- 208000018459 dissociative disease Diseases 0.000 description 2
- 230000005284 excitation Effects 0.000 description 2
- GPRLSGONYQIRFK-UHFFFAOYSA-N hydron Chemical compound [H+] GPRLSGONYQIRFK-UHFFFAOYSA-N 0.000 description 2
- 238000004540 process dynamic Methods 0.000 description 2
- 239000011780 sodium chloride Substances 0.000 description 2
- 235000011149 sulphuric acid Nutrition 0.000 description 2
- 235000008733 Citrus aurantifolia Nutrition 0.000 description 1
- 235000011941 Tilia x europaea Nutrition 0.000 description 1
- 230000001154 acute effect Effects 0.000 description 1
- 229910000147 aluminium phosphate Inorganic materials 0.000 description 1
- 230000033228 biological regulation Effects 0.000 description 1
- AXCZMVOFGPJBDE-UHFFFAOYSA-L calcium dihydroxide Chemical compound [OH-].[OH-].[Ca+2] AXCZMVOFGPJBDE-UHFFFAOYSA-L 0.000 description 1
- 239000000920 calcium hydroxide Substances 0.000 description 1
- 235000011116 calcium hydroxide Nutrition 0.000 description 1
- 229910001861 calcium hydroxide Inorganic materials 0.000 description 1
- 238000012824 chemical production Methods 0.000 description 1
- 230000015271 coagulation Effects 0.000 description 1
- 238000005345 coagulation Methods 0.000 description 1
- 230000001143 conditioned effect Effects 0.000 description 1
- 238000001816 cooling Methods 0.000 description 1
- 230000001934 delay Effects 0.000 description 1
- 238000013461 design Methods 0.000 description 1
- 230000029087 digestion Effects 0.000 description 1
- 238000007865 diluting Methods 0.000 description 1
- 238000005530 etching Methods 0.000 description 1
- 238000013213 extrapolation Methods 0.000 description 1
- 238000001914 filtration Methods 0.000 description 1
- 239000012530 fluid Substances 0.000 description 1
- 239000004571 lime Substances 0.000 description 1
- 239000000463 material Substances 0.000 description 1
- 238000005554 pickling Methods 0.000 description 1
- 238000001556 precipitation Methods 0.000 description 1
- 238000004886 process control Methods 0.000 description 1
- 238000012545 processing Methods 0.000 description 1
- 230000029219 regulation of pH Effects 0.000 description 1
- 239000000523 sample Substances 0.000 description 1
- 230000035945 sensitivity Effects 0.000 description 1
- 238000004065 wastewater treatment Methods 0.000 description 1
Images


Classifications
-
- G—PHYSICS
- G05—CONTROLLING; REGULATING
- G05D—SYSTEMS FOR CONTROLLING OR REGULATING NON-ELECTRIC VARIABLES
- G05D11/00—Control of flow ratio
-
- G—PHYSICS
- G01—MEASURING; TESTING
- G01N—INVESTIGATING OR ANALYSING MATERIALS BY DETERMINING THEIR CHEMICAL OR PHYSICAL PROPERTIES
- G01N31/00—Investigating or analysing non-biological materials by the use of the chemical methods specified in the subgroup; Apparatus specially adapted for such methods
- G01N31/16—Investigating or analysing non-biological materials by the use of the chemical methods specified in the subgroup; Apparatus specially adapted for such methods using titration
- G01N31/162—Determining the equivalent point by means of a discontinuity
- G01N31/164—Determining the equivalent point by means of a discontinuity by electrical or electrochemical means
-
- G—PHYSICS
- G01—MEASURING; TESTING
- G01N—INVESTIGATING OR ANALYSING MATERIALS BY DETERMINING THEIR CHEMICAL OR PHYSICAL PROPERTIES
- G01N31/00—Investigating or analysing non-biological materials by the use of the chemical methods specified in the subgroup; Apparatus specially adapted for such methods
- G01N31/16—Investigating or analysing non-biological materials by the use of the chemical methods specified in the subgroup; Apparatus specially adapted for such methods using titration
- G01N31/166—Continuous titration of flowing liquids
-
- G—PHYSICS
- G05—CONTROLLING; REGULATING
- G05B—CONTROL OR REGULATING SYSTEMS IN GENERAL; FUNCTIONAL ELEMENTS OF SUCH SYSTEMS; MONITORING OR TESTING ARRANGEMENTS FOR SUCH SYSTEMS OR ELEMENTS
- G05B13/00—Adaptive control systems, i.e. systems automatically adjusting themselves to have a performance which is optimum according to some preassigned criterion
- G05B13/02—Adaptive control systems, i.e. systems automatically adjusting themselves to have a performance which is optimum according to some preassigned criterion electric
- G05B13/04—Adaptive control systems, i.e. systems automatically adjusting themselves to have a performance which is optimum according to some preassigned criterion electric involving the use of models or simulators
-
- G—PHYSICS
- G05—CONTROLLING; REGULATING
- G05D—SYSTEMS FOR CONTROLLING OR REGULATING NON-ELECTRIC VARIABLES
- G05D21/00—Control of chemical or physico-chemical variables, e.g. pH value
-
- Y—GENERAL TAGGING OF NEW TECHNOLOGICAL DEVELOPMENTS; GENERAL TAGGING OF CROSS-SECTIONAL TECHNOLOGIES SPANNING OVER SEVERAL SECTIONS OF THE IPC; TECHNICAL SUBJECTS COVERED BY FORMER USPC CROSS-REFERENCE ART COLLECTIONS [XRACs] AND DIGESTS
- Y10—TECHNICAL SUBJECTS COVERED BY FORMER USPC
- Y10T—TECHNICAL SUBJECTS COVERED BY FORMER US CLASSIFICATION
- Y10T436/00—Chemistry: analytical and immunological testing
- Y10T436/11—Automated chemical analysis
- Y10T436/117497—Automated chemical analysis with a continuously flowing sample or carrier stream
Definitions
- This invention relates in general to pH control, and in particular to methods of estimating titration curves for the adaptive control of pH, and to adaptive pH controllers using such methods.
- the control of pH is important in many processes including boiler water treatment, chemical and biological reaction, municipal waste digestion, acid pickling/etching processes, cooling tower water treatment, electrohydrolysis, coagulation/precipitation processes, chemical reactor feeds and wastewater neutralization. Waste water treatment is especially difficult because composition is unknown and varies with time.
- the control of pH is a very difficult problem.
- the titration curve is a plot showing pH that results from adding a given proportion of reagent.
- the source of the difficulty of pH control is the result of two major factors: firstly, the nonlinearity of the titration curve at any particular point in time and the time variation in the shape of the titration curve as the influent composition changes; and secondly, the influent flow rate, concentrations of various acids, bases and buffering salts, and temperature change with time.
- PID proportional-integral-differential
- US Patent No US-A-3 899 294 discloses a method for titration curve identification by simply titrating a slip stream of the main effluent stream. Then the titration curve is used to select the reagent flow rate to attain the desired pH. This procedure is relatively expensive since an automated titration system must be used to obtain the titration curve. In addition, the titration time for such an automated system may be significant in comparison to the fluid residence time in the process; therefore, when composition changes of the process stream occur, the analytical dead-time will reduce the effectiveness of the controller.
- pH control appears to be a very simple process with a single input, a single output and easily modeled first order linear dynamics.
- a reagent stream is added to the incoming process stream, the two streams are mixed, and the pH is measured. The proper pH is achieved by adding the proper proportion of reagent.
- the gain is extremely nonlinear and may change drastically if the process composition changes slightly.
- the gain may be so high that the output pH is hopelessly sensitive to tiny errors in the control effort.
- a general purpose pH controller must handle all three problems: nonlinear gain, time-varying gain, and extremely high gain.
- a method of estimating a titration curve for the adaptive control of pH in a process in which a reagent is added to an influent flowing at a flowrate comprising: providing a plurality of pH values, each corresponding to a ratio of reagent flowrate to flowrate of influent; collecting a plurality of pH data points, each representing a ratio between reagent flowrate and influent flowrate, at the provided pH values; and producing a model titration curve from the collected pH data points; characterised by the steps of: storing the plurality of pH data points in a bin system based on pH; and using the model titration curve produced from the stored pH data points to establish a gain schedule for operating a controller for adding the reagent to a mixing element, the gain schedule being derived by inversion of the slope between an actual operating point and a desired set point on the model titration curve.
- the present invention also provides an adaptive pH controller comprising: means for measuring the flow rate of an influent; means for mixing the influent with a reagent; means for measuring the pH of effluent from the mixing means; and PI control means responsive to the measured pH of the effluent and to the measured flowrate of the influent to set the flowrate of the reagent to the mixing means in accordance with a model titration curve produced by a method as set out above.
- a preferred embodiment of the present invention provides an adaptive pH controller and method of estimating a titration curve for use by such a controller, which collects a plurality of data points each comprising the ratio of reagent flowrate to influent flowrate and the observed pH at that flow rate. The points are stored in a bin system based on pH rather than time to produce a model of the titration curve. Analytical and heuristic methods are used to create the best possible model for the titration curve which is thereafter used in the adaptive control.
- Embodiments of the invention have been found to effect pH control accurately and quickly in a manner which closely follows the titration curve even when it has high gain characteristics and further when the titration curve changes with time as is often the case.
- An adaptive pH controller embodying the invention attempts to solve the difficult pH control problem discussed above.
- Previous control schemes typically diverted the process stream into a large tank with a conservatively tuned PI controller.
- Difficult or complex processes may involve a series of two or even three progressively larger tanks with independent control systems.
- an adaptive controller 20 replaces these tanks with a small, fast inline system comprising a pump 10 for injecting reagent, a small mixing element 12, and a pH probe 14 at the output of the mixing element 12.
- a PI controller 16 is (as previously) used to complete the loop.
- a ratio controller 17 is used, with flow rate fed forward from a flow meter 18.
- a sophisticated gain schedule based on a model of the process is used, and to adapt to process changes, the process model is in turn identified online from process data by a powerful new estimation technique.
- Implementation of the controller includes the gain scheduled PI controller, the estimator, and a full set of heuristics to gather new data points, discard old data points, and reconcile inconsistent data points.
- Fig 4 and Fig 5 show the placement of the inline controller 20 with tanks, Fig 4 having a downstream tank and Fig 5 an upstream tank.
- the controller has completed a series of tests in a pH pilot plant with good test results.
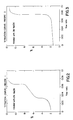
- titration curve is a plot showing the pH that results from adding a given proportion of reagent.
- recipe 1 for example
- the proper controller tuning depends on the titration curve, and depends on where the setpoint falls on the curve.
- a gain schedule can be derived that gives good control results with a PI controller, and the gain scheduled PI controller is now an industry standard.
- the gain schedule is only as good as the titration curve it is based on, and for many applications, especially waste water neutralization, the process curve may change greatly.
- the adaptive controller gathers process data to estimate a new process model for the controller gain schedule.
- the structure looks like this: DATA GATHERING ⁇ MODEL ESTIMATION ⁇ GAIN SCHEDULE ⁇ PI CONTROL
- the gain scheduling and PI control portions are separate from the adaptive portion. They control based on the process titration curve. For applications where the process composition is fairly constant, in chemical production for example, the titration curve may be determined offline, and only the gain schedule and PI control portions implemented online. For applications such as waste water neutralization, the process will change from hour to hour and day to day, and the data gathering and model estimation sections are needed to provide the gain scheduler with an up-to-date process model.
- the gain scheduler does not store the actual titration curve. It stores a parameterized model instead, and calculates the gain directly from the parameters.
- Figs. 6 and 7 show how gain is derived from the curve, and show gain schedules from the model and actual titration curve for recipe 1.
- the concentration of H+ is a nonlinear function of reagent added, representing a complex equilibrium among all the chemical components of the process stream.
- Acids, bases, and salts can provide or remove H+ ions from the solution, fighting the effect of adding reagent and causing buffering that reduces the process gain at different pH values.
- Water itself disassociates into its component H+ and OH ⁇ ions.
- the relationships involved are approximately exponential, but typically include empirical correction factors which must be determined experimentally. Calculating a titration curve from chemical composition is an extremely difficult task. Attempting to back-calculate chemical composition from a titration curve is not possible.
- the inventive pH controller uses a simplified chemical model, but even so, identifying a process model from titration curve data is impossible. The model is simply too nonlinear and has too many parameters.
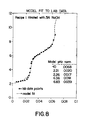
- the estimation scheme embodying the invention tries something different. It decomposes the observed titration curve into a combination of simpler titration curves.
- a library of titration curves intended to span all possible process characteristics is stored.
- a chemical model enables one to describe each library curve with a set of stored parameters. The curves can be combined linearly to produce a composite curve.
- the estimator finds the linear combination of library titration curves that best fits the observed process data.
- the individual library titration curves are each perfectly reasonable titration curves based on a simplified chemical model, and the model guarantees that any combination of them will be a reasonable titration curve as well. If the library curves are well chosen, a combination can be found that fits the observed data well, and can safely be extrapolated between observed data points. The same chemical model can be used to invert any combination of parameters directly into a gain schedule.
- Svd singular valve decomposition
- Fig. 8 shows the actual lab titration curve data for a recipe and the model titration curve fit to it. The 5 parameter fit is good, and the gain schedule derived from it is correspondingly good (Fig. 7).
- the estimator Given a good set of data points, the estimator can find a process model and forward it to the gain scheduler. But obtaining a good set of data points when the process is continuously and rapidly changing is difficult. By the time one gathers a new data point, all previous points may be outdated.
- the adaptive control design and heuristics attempt to solve this problem by gathering data as fast as possible and checking to ensure that the past data is consistent with current data.
- Each data point consists of the ratio of reagent flow to influent flow, and the observed pH that results.
- the search mode is used to gather an initial set of data points, or to fully replace an obsolete set of data points after a major disturbance.
- a binary search over the entire range of controller output is performed. Successive steps are made, always heading toward the setpoint, each step half the size of the previous step. The search concludes when the setpoint is closely bracketed, or the step size becomes too small. After each step in control output, the controller waits for pH to settle out, takes a new data point, and then makes the next step.
- Data points are stored in a bin system based on pH, rather than in time sequence, to help build a model of the whole titration curve and to avoid problems due to lack of excitation. However, this can cause problems due to inconsistency between old and new points. There are a number of heuristics to deal with this problem:
- the heuristics deal well with the difficult problems posed by trying to track a quickly, continuously changing process, while still storing a wide range of data points to model the full titration curve and to avoid "collapse" of the estimation scheme during good control.
- the estimator receives the full set of data, plus a parameterized model of the reagent used.
- the estimator must also be given a "library" of building block titration curves which are used to decompose the process titration curve.
- the set chosen for the included pilot plant tests was a set consisting of one unbuffered curve, and a set of curves with buffering at the pH valve of each observed data point. Each curve can be described by a single parameter. This has an intuitive appeal, and for small sets of data gives a much smaller set of parameters and a quicker solution. Solutions are typically found in under 1 second.
- the estimator returns a process model consisting of a list of library curves, and a concentration value for the model chemical components of each curve.
- the model is reported to the gain scheduler and is used to compute the gain schedule until a new model is calculated.
- Control is done with the PI controller 16 and the gain schedule derived from the process model. It is important to note that the process model can be obtained in different ways; in the adaptive configuration the model is found online by the estimator, but for nonadaptive problems, the model may be found offline from laboratory titration data and no online estimation done.
- the estimation technique embodying the invention may be used on any set of titration data; the inline control system described provides a method to gather that data online.
- the PI controller is a ratio controller, using process flow rate at 18 as a fed forward multiplier.
- the controller must be tuned to the physical dynamics of the process, i.e. time constant and deadtime. These are functions of process flow rate. Some estimate of them must be provided to the controller.
- process dynamics were lumped into one parameter called settling time, which was fit as a straight line through values measured at high and low flow rates.
- Time constant and deadtime were assumed to be roughly equal for the inline process. Settling time is used to decide how long to freeze the control effort. Time constant and the deadtime are used for PI controller tuning, not estimation, and so are not critical to the estimation process.
- the inline setup is essential for adaptive control, due to the need for speed.
- any configuration can be used, with the PI controller tuned to the dynamics of the system. Since the inline system has a higher relative deadtime than a tank, a tank is easier to control and the gain scheduled controller embodying the invention applies more than equally well to a conventional tank setup.
- the inline configuration can also be used with a tank as shown in Figs. 4 and 5 to provide better performance.
- the tank is not used as a controlled vessel, however. It may be placed downstream of the controller to filter out the effect of short process disturbances and small oscillations in output pH. It may also be placed upstream of the pH controller, filtering out short process disturbances and providing a place for recirculation when output pH is out of spec.
- a test regimen for the controller was devised to simulate a wide range of "real world” conditions, and to create situations which previous adaptive pH controllers were unable to handle.
- the tests include startup on a range of different process streams, flow changes, concentration changes, and changes from one process to another. Both step changes and fast and slow ramp changes are used. For comparison, some tests were done using a gain schedule derived offline using the estimation technique embodying the invention.
- Startups begin with a binary search, as the controller tries to find data points in the control band that bracket the setpoint. On a flat, buffered titration curve, this is easy to do. A wide range of control values fall in the control band. On a steep curve, control must fall into a tiny range, and the search will take longer and may quit without succeeding. Once the search is done, a model is fit, and PI control turned on.
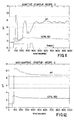
- Recipe 1 has a low process gain at the neutral point, allowing a higher controller gain (see titration curve, Fig. 2).
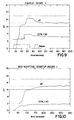
- Fig. 9 shows the startup.
- the binary search lasts only from time 10s to 70s.
- the PI controller was then turned on and the pH rapidly brought to the setpoint.
- One additional data point was gathered on the way.
- Fig. 10 shows a nonadaptive startup on the same recipe, with a gain schedule determined offline from the process titration curve. Control is good, showing that the gain scheduled PI controller can indeed compensate for the highly variable, highly nonlinear process gain.
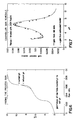
- recipe 2 has a very high process gain at the neutral point (titration curve, Fig. 3).
- Fig. 11 shows the startup.
- PI control was turned on and the pH brought up.
- Several data points were taken along the way, and the controller gain increased in the pH 4-5 region. The pH is eventually brought close to neutral, but the system never really settles out.
- Results here are typical of performance when the process gain is high (titration curve very steep).
- the control output must fall in a very narrow band, so the binary search process is long, and involves several excursions as the control signal overshoots the desired band in both directions.
- the process is very sensitive to tiny changes in process and reagent streams, amplifying noise and drift. Feedback gain is low, which makes for poor tracking of disturbances.
- control output is actually very close to the correct value.
- the titration curve shows that an error of 1 pH at the output corresponds to an error of much less than 1% at the control input. But the sensitivity of the process exaggerates the error.
- Fig. 12 shows the nonadaptive startup.
- the controller is tuned with a gain schedule determined offline.
- pH first overshoots: the titration curve steepens so fast that the lag and deadtime make the gain schedule too aggressive.
- the reason is that the controller gain at this pH is extremely low (see Fig. 3), and that the controller is trying to track a subtle flow rate disturbance.
- the waste stream is pumped from a tank, and as the tank level falls, the flow rate falls also.
- the disturbance is not seen in the flow rate reported to the controller, which is derived from the pump set point.
- the controller gain is so low that flowrate falls faster than the control output.
- Concentration changes may be linked to flow rate (for example, when rain water pours into a sewer, diluting the stream and increasing the flow), or may occur independently of flow (for example, when a process that contributes a small but concentrated portion of the waste stream changes behavior).
- the main problem is that pH may be shifted to a part of the titration curve with a very different gain from the setpoint. A non-gain scheduled controller might get stuck, or drastically overshoot the setpoint. The gain schedule handles this problem well.
- Other difficulties include a process gain change proportional to the change in concentration, and a titration curve shift that makes new data points inconsistent with old ones.
- Recipe 1 was tested because its titration curve shows extreme changes in gain (see Fig. 2). A change in pH puts the controller on a part of the curve that is distinctly different from where it started. The test shows a 50%, 3 minute ramp down in concentration, and then a step back up to the original value.
- Recipe changes represent a complete change in process behavior. No single gain schedule can account for the process variations seen in the test recipes. Tests included step changes, fast ramps, and slow ramps. They represent a variety of problems for the controller.
- Figs. 14 and 15 show a slow change from recipe 1 to recipe 2, with concentrations adjusted so that the control effort and outlet pH stayed the same, giving the controller no sign that the process had changed. This is a very tough test for an adaptive controller.
- Fig. 14 shows the test for a non-adaptive controller, tuned for the recipe 1 titration curve. Starting at time 200s, a slow ramp between the processes is made, and the titration curve gets steeper and steeper. There is no large disturbance to force the controller into oscillation, but as the ramp progresses small oscillations start and finally go out of control.
- Fig. 15 shows the same test for the adaptive controller embodying the invention.
- a binary search is performed on startup, and causes an excursion to pH 10.5, after which control is established.
- the adaptive pH controller embodying the invention rapidly adapts to extreme process variations and load changes, requires very little tuning, and achieves pH regulation unheard of in an inline controller.
- Models for the chemistry of ionic solutions are well developed, but very complex, typically involving a number of experimentally derived correction factors to reconcile calculated and observed results. For control purposes, there is no need to calculate the exact behavior of a solution from its chemical composition. A simplified model can match observed process behavior adequately.
- the model used herein is described in Eq. (1). It ignores acidity coefficients, and assumes that all chemical reactions have reached equilibrium before pH is measured.
- pH measures the activity or effective concentration of hydrogen ions in a solution.
- the effective concentration may be different from the actual concentration, but in dilute solution the effect can be ignored.
- Models can be written for all chemical reactions that involve hydrogen ions. These reactions include the dissociations of acids, bases, salts, and water.
- K w ionic product for water (10 ⁇ 14 at 24° C)
- [OH ⁇ ] hydroxyl ions concentration, moles/litre Simple acids and bases dissociate in water more or less completely to form ions; the extent of dissociation is measured by a dissociation constant K a for an acid or K b for a base.
- K b [B′][OH]/[BOH]
- pK b -log10 (Kb)
- the formula for a complex base such as lime, Ca(OH)2, is similar, and the formula can be extended to triple acids and bases (such as phosphoric acid, H3PO4).
- Equation (11) is the basic equation used in pH estimation.
- Every observed process data point represents a different chemical equilibrium involving the process components and the added reagent.
- the estimation problem amounts to solving a system of equations for all unknowns to identify the real process parameters. Assuming that pH is measured and pKw (-log10 ([H+][OH])) is known, that still leaves all of the C a 's and N a 's, and all the C b 's and N b 's to be found as noted in Eq. (11) above. The C a 's and C b 's are nonlinear functions of the true parameters, pK a and pK b . In addition, the number of components in the real process is unknown. Solving the system directly is clearly hopeless.
- C a1 through C an are the dissociation fractions of each preselected acid N a1 through N an are the unknown normalities of each acid
- C b1 through C bn are the dissociation fractions of each preselected base N b1 through bn are the unknown normalities of each base
- D is a constant term lumping ions contributed from known sources (water, reagent).
- Computer software can convert the data points and preselected pK's to the form of the equation.
- the problem is then solved as a linear least squares problem, using the technique of singular value decomposition (svd).
- svd singular value decomposition
- svd enables one to find a solution even if there are fewer equations than unknowns.
- svd can be used to find it.
- the result is a very stable solution to the problem that can be trusted to give reasonable answers no matter what data set is supplied.
- the only problem encountered is the need to force chemical normalities to be positive. An iterative procedure is used to eliminate negative normality solutions. The solution is quick and guaranteed to converge.
- the solution can be guaranteed to behave like a real titration curve because the solution is a chemical model of the process that best fits the observed data.
- the set point pH is known, and the current pH is measured. What is needed is the corresponding flow ratios on the model titration curve (the measured flow ratio should not be used; mismatch between real and model titration curves can lead to unreasonable gain values).
- each normality coefficient of a waste stream component must be multiplied by D w
- each normality coefficient of a reagent component must be multiplied by D r .
Landscapes
- Health & Medical Sciences (AREA)
- Life Sciences & Earth Sciences (AREA)
- General Physics & Mathematics (AREA)
- Physics & Mathematics (AREA)
- Chemical & Material Sciences (AREA)
- Molecular Biology (AREA)
- Analytical Chemistry (AREA)
- Biochemistry (AREA)
- General Health & Medical Sciences (AREA)
- Immunology (AREA)
- Pathology (AREA)
- Engineering & Computer Science (AREA)
- Automation & Control Theory (AREA)
- Chemical Kinetics & Catalysis (AREA)
- Electrochemistry (AREA)
- Artificial Intelligence (AREA)
- Evolutionary Computation (AREA)
- Medical Informatics (AREA)
- Software Systems (AREA)
- Computer Vision & Pattern Recognition (AREA)
- Control Of Non-Electrical Variables (AREA)
- Feedback Control In General (AREA)
- Investigating Or Analyzing Non-Biological Materials By The Use Of Chemical Means (AREA)
Claims (8)
- Verfahren zur Schätzung einer Titrationskurve für die adaptive pH-Wertkontrolle in einem Verfahren, in welchem ein Reagenz zu einem Zufluß zugesetzt wird, der mit einer Fließgeschwindigkeit fließt, wobei man
mehrere pH-Werte vorsieht, von denen jeder einem Verhältnis von Reagenz-Fließgeschwindigkeit zu Zufluß-Fließgeschwindigkeit entspricht,
bei den vorgesehenen pH-Werten mehrere pH-Wertdatenpunkte sammelt, von denen jeder ein Verhältnis zwischen Reagenz-Fließgeschwindigkeit und Zufluß-Fließgeschwindigkeit repräsentiert, und
aus den gesammelten pH-Wertdatenpunkten eine Modelltitrationskurve erzeugt, gekennzeichnet durch die Stufen, in denen man
die mehreren pH-Wertdatenpunkte in einem auf pH-Wert beruhenden Speichersystem speichert und
die aus den gespeicherten pH-Wertdatenpunkten erzeugte Modelltitrationskurve verwendet, um einen Ausbeuteplan für das Arbeiten einer Kontrolleinrichtung (16) für die Zugabe des Reagenz zu einem Mischelement (12) aufzustellen, wobei der Ausbeuteplan durch Umkehr der Neigung zwischen einem tatsächlichen Arbeitspunkt und einem erwünschten Sollwert auf der Modelltitrationskurve abgeleitet wird. - Verfahren nach Anspruch 1, bei dem die Stufe einen Vorsehens mehrerer pH-Werte darin besteht, daß man mehrere Modelltitrationskurven speichert, von denen jede für ein getrenntes Verfahren erzeugt wird, um einen Bestand an gespeicherten Titrationskurven zu erzeugen, und die beste lineare Kombination der gespeicherten Kurven mit gesammelten Datenpunkten zusammenpaßt, um eine zusammengesetzte Titrationskurve für die Verwendung bei der Kontrolle des Verfahrens zu erzeugen.
- Verfahren nach Anspruch 2, bei dem man die gesammelten Datenpunkte einem Einzelwertzerlegungsverfahren unterzieht, um die engste Kombination gespeicherter Titrationskurven zu den gesammelten Datenpunkten zu lokalisieren.
- Verfahren nach Anspruch 1, Anspruch 2 oder Anspruch 3, bei dem man neue Datenpunkte sammelt und jeden neu gesammelten Datenpunkt mit dem vorher gesammelten Datenpunkt hinsichtlich Verträglichkeit gemäß der Modelltitrationskurve vergleicht und, wenn der neu gesammelte Datenpunkt unverträglich mit dem vorher gesammelten Datenpunkt gemäß der Modelltitrationskurve ist, den vorher gesammelten Datenpunkt aus dem Speicher entfernt.
- Verfahren nach Anspruch 1, Anspruch 2 oder Anspruch 3, bei dem man neue Datenpunkte sammelt und jeden neuen Datenpunkt mit einem Sollwert vergleicht, der von einem Ausbeuteplan stammt, der von der Modelltitrationskurve erzeugt wurde, wobei der Ausbeuteplan Parameter einschließt, die die Kurvenneigung zwischen einer beobachteten Bedingung in dem Verfahren und dem Sollwert umfaßt, und, wenn die Übereinstimmung zwischen den neu gesammelten Datenpunkten und den vorher gesammelten Datenpunkten, die in dem Speichersystem gespeichert sind, gut ist, die Modelltitrationskurve in dem Speichersystem hält.
- Verfahren nach einem der vorausgehenden Ansprüche, bei dem man jeden Datenpunkt mit einer Markierung versieht, die die Zeit angibt, in welcher der Datenpunkt aufgenommen wurde, um neuere Punkte von älteren Punkten zu unterscheiden.
- Verfahren nach einem der vorausgehenden Ansprüche, bei dem der Zufluß durch das Mischelement (12) fließt und bei dem alle der mehreren pH-Werte von dem Mischelement (12) aufgenommen werden.
- Adaptive pH-Wertkontrolleinrichtung mit
Einrichtungen (18) zum Messen der Fließgeschwindigkeit eines Zuflusses,
Einrichtungen (12) zum Mischen des Zuflusses mit einem Reagenz,
Einrichtungen (14) zum Messen des pH-Wertes des Auslaufs aus der Mischeinrichtung (12) und
PI-Kontrolleinrichtungen (16), die auf den gemessenen pH-Wert des Auslaufes und die gemessene Fließgeschwindigkeit des Zulaufes reagieren, um die Fließgeschwindigkeit des Reagenz zu der Mischeinrichtung (12) gemäß einer Modelltitrationskurve einzustellen, die nach einem Verfahren gemäß einem der Ansprüche 1 bis 7 erzeugt wurde.
Applications Claiming Priority (2)
| Application Number | Priority Date | Filing Date | Title |
|---|---|---|---|
| US07/526,416 US5132916A (en) | 1990-05-21 | 1990-05-21 | Methodology for ph titration curve estimation for adaptive control |
| US526416 | 1990-05-21 |
Publications (2)
| Publication Number | Publication Date |
|---|---|
| EP0457989A1 EP0457989A1 (de) | 1991-11-27 |
| EP0457989B1 true EP0457989B1 (de) | 1994-08-24 |
Family
ID=24097250
Family Applications (1)
| Application Number | Title | Priority Date | Filing Date |
|---|---|---|---|
| EP90312628A Expired - Lifetime EP0457989B1 (de) | 1990-05-21 | 1990-11-20 | Titrationskurvenabschätzung zur adaptiven pH-Wert-Kontrolle |
Country Status (9)
| Country | Link |
|---|---|
| US (1) | US5132916A (de) |
| EP (1) | EP0457989B1 (de) |
| JP (1) | JP2632609B2 (de) |
| KR (1) | KR910020534A (de) |
| CN (1) | CN1028569C (de) |
| AU (1) | AU633994B2 (de) |
| DE (1) | DE69011851T2 (de) |
| MX (1) | MX173341B (de) |
| NO (1) | NO904807L (de) |
Families Citing this family (19)
| Publication number | Priority date | Publication date | Assignee | Title |
|---|---|---|---|---|
| US5291418A (en) * | 1991-07-05 | 1994-03-01 | Eastman Kodak Company | Adjustment of electric potential by automatic titration |
| US5282130A (en) * | 1992-05-20 | 1994-01-25 | Elsag International B.V. | Method and apparatus for obtaining process characteristics in a self-tuning controller |
| US5696696A (en) * | 1994-10-11 | 1997-12-09 | Betzdearborn, Inc. | Apparatus and method for automatically achieving and maintaining congruent control in an industrial boiler |
| US5923571A (en) * | 1994-10-11 | 1999-07-13 | Betzdearborn, Inc. | Apparatus and method for automatic congruent control of multiple boilers sharing a common feedwater line and chemical feed point |
| US5640330A (en) * | 1995-04-18 | 1997-06-17 | Ibm Corporation | Method for analyzing pH titration data |
| US6072576A (en) * | 1996-12-31 | 2000-06-06 | Exxon Chemical Patents Inc. | On-line control of a chemical process plant |
| AU7709700A (en) * | 1999-09-23 | 2001-04-24 | Chroma Graphics, Inc. | Method and apparatus for describing and simulating complex systems |
| US8609040B2 (en) | 2010-08-23 | 2013-12-17 | Avia Biosystems, Llc | System for creation of formulations and generation of denaturation graphs |
| CN102890516A (zh) * | 2012-10-09 | 2013-01-23 | 荣捷生物工程(苏州)有限公司 | 可生成线性pH梯度溶液的控制系统及其方法 |
| US10545482B2 (en) * | 2014-07-23 | 2020-01-28 | Honeywell International Inc. | Robust control design approach for chemical processing industries and other industries |
| FR3042596B1 (fr) * | 2015-10-14 | 2017-11-03 | Bioentech | Procede d'estimation de la concentration de composes d'interet de substrat ou de digestat de methaniseur |
| US11397171B2 (en) * | 2017-09-18 | 2022-07-26 | Ecolab Usa Inc. | Adaptive range flow titration systems and methods with sample conditioning |
| CA3096538A1 (en) | 2018-04-09 | 2019-10-17 | Ecolab Usa Inc. | Methods for colorimetric endpoint detection and multiple analyte titration systems |
| US11397170B2 (en) * | 2018-04-16 | 2022-07-26 | Ecolab Usa Inc. | Repetition time interval adjustment in adaptive range titration systems and methods |
| CN111382874B (zh) * | 2018-12-28 | 2024-04-12 | 第四范式(北京)技术有限公司 | 实现线上机器学习模型的更新迭代的方法和装置 |
| JP7415437B2 (ja) * | 2019-10-25 | 2024-01-17 | 三浦工業株式会社 | ボイラ水のpH調整方法 |
| CN113087301B (zh) * | 2021-04-08 | 2021-12-07 | 常州康绿环保科技有限公司 | 一种河道污水的异位微生物修复方法 |
| CN113884619B (zh) * | 2021-09-30 | 2024-02-02 | 眉山博雅新材料股份有限公司 | 一种滴定方法 |
| CN113880155B (zh) * | 2021-10-11 | 2023-05-05 | 九江七所精密机电科技有限公司 | 一种低压锅炉炉水水质在线调节方法 |
Family Cites Families (13)
| Publication number | Priority date | Publication date | Assignee | Title |
|---|---|---|---|---|
| US3730685A (en) * | 1971-02-24 | 1973-05-01 | Du Pont | Computer controlled method of titration |
| US3769178A (en) * | 1972-04-27 | 1973-10-30 | Rothermel Ass Inc | Method and apparatus for end point detection in potentiometric titration |
| US4053743A (en) * | 1976-02-18 | 1977-10-11 | Antti Johannes Niemi | Method for controlling the ph and other concentration variables |
| FI55414C (fi) * | 1977-06-07 | 1979-07-10 | Niemi Antti Johannes | Foerfarande och anordning foer reglering av ph |
| JPS5489687A (en) * | 1977-12-27 | 1979-07-16 | Mitsubishi Chem Ind | Titration controlling method |
| FR2504680A1 (fr) * | 1981-04-28 | 1982-10-29 | Tacussel Jacques | Procede et appareillage pour les analyses et les titrages electrochimiques automatiques |
| JPS57208445A (en) * | 1981-06-19 | 1982-12-21 | Rikagaku Kenkyusho | Buffer power titration method and apparatus therefor |
| US4465593A (en) * | 1982-03-23 | 1984-08-14 | Environmental Technology (U.S.), Inc. | Recovery of metal from waste water by chemical precipitation |
| FR2561782B1 (fr) * | 1984-03-23 | 1987-09-04 | Inst Rech Hydrographiques | Procede et dispositif d'analyse physico-chimique automatique d'une solution a flux continu |
| JPS63148099U (de) * | 1987-03-17 | 1988-09-29 | ||
| US4907167A (en) * | 1987-09-30 | 1990-03-06 | E. I. Du Pont De Nemours And Company | Process control system with action logging |
| JPH01218692A (ja) * | 1988-02-26 | 1989-08-31 | Nkk Corp | 活性汚泥法における操業管理方法 |
| US4975865A (en) * | 1989-05-31 | 1990-12-04 | Mitech Corporation | Method and apparatus for real-time control |
-
1990
- 1990-05-21 US US07/526,416 patent/US5132916A/en not_active Expired - Fee Related
- 1990-11-05 NO NO90904807A patent/NO904807L/no unknown
- 1990-11-14 AU AU66605/90A patent/AU633994B2/en not_active Ceased
- 1990-11-20 CN CN90109264A patent/CN1028569C/zh not_active Expired - Fee Related
- 1990-11-20 DE DE69011851T patent/DE69011851T2/de not_active Expired - Fee Related
- 1990-11-20 EP EP90312628A patent/EP0457989B1/de not_active Expired - Lifetime
-
1991
- 1991-03-30 KR KR1019910005069A patent/KR910020534A/ko not_active Abandoned
- 1991-04-25 MX MX2551991D patent/MX173341B/es unknown
- 1991-05-21 JP JP3144150A patent/JP2632609B2/ja not_active Expired - Lifetime
Also Published As
| Publication number | Publication date |
|---|---|
| EP0457989A1 (de) | 1991-11-27 |
| DE69011851D1 (de) | 1994-09-29 |
| CN1056756A (zh) | 1991-12-04 |
| US5132916A (en) | 1992-07-21 |
| JPH04232515A (ja) | 1992-08-20 |
| AU633994B2 (en) | 1993-02-11 |
| DE69011851T2 (de) | 1994-12-15 |
| CN1028569C (zh) | 1995-05-24 |
| KR910020534A (ko) | 1991-12-20 |
| NO904807D0 (no) | 1990-11-05 |
| JP2632609B2 (ja) | 1997-07-23 |
| AU6660590A (en) | 1991-11-21 |
| NO904807L (no) | 1991-11-22 |
| MX173341B (es) | 1994-02-17 |
Similar Documents
| Publication | Publication Date | Title |
|---|---|---|
| EP0457989B1 (de) | Titrationskurvenabschätzung zur adaptiven pH-Wert-Kontrolle | |
| Kalafatis et al. | A new approach to the identification of pH processes based on the Wiener model | |
| Wright et al. | Nonlinear control of pH processes using the strong acid equivalent | |
| Williams et al. | In-line process-model-based control of wastewater pH using dual base injection | |
| US4940551A (en) | Method for pH control | |
| US4053743A (en) | Method for controlling the ph and other concentration variables | |
| EP1658534B1 (de) | Verfahren und einrichtungsanordnung zur automatischen dosisregelung von chemikalien | |
| Mahuli et al. | Experimental demonstration of non-linear model-based in-line control of pH | |
| US4165218A (en) | Monitoring surfactant in electrolyte during metal treatment | |
| US5175502A (en) | Method and apparatus for determining acid concentration | |
| JP6513540B2 (ja) | フッ素含有排水の処理方法およびその処理装置 | |
| Jutila | An application of adaptive pH-control algorithms based on physico-chemical modelling in a chemical waste-water treatment plant | |
| EP0768589B1 (de) | Methode zur Regelung der Bestandteile eines Phosphatbades | |
| Maiti et al. | Adaptive dynamic matrix control of pH | |
| JP2007061800A (ja) | 水処理プラントに適用する凝集剤注入制御装置 | |
| CN1888896A (zh) | 二水湿法磷酸生产过程中so3含量的软测量方法 | |
| US5286358A (en) | Method of analyzing the complexing power of a pickling liquor | |
| Alina et al. | Internal model control for wastewater ph neutralization process | |
| Palatý et al. | Diffusion dialysis of sulfuric acid in a batch cell | |
| Yeo et al. | Control of pH processes based on the genetic algorithm | |
| Mahuli | Nonlinear model-based control of pH | |
| Kittisupakorna et al. | Use of Globally Linearizing Control with Extended Kalman Filter for pH Control of a Wastewater Treatment Process | |
| Badran et al. | On designing algorithms for controlling pH | |
| US20040256069A1 (en) | Estimation and control in the wet end using CO2 | |
| Young et al. | Robust control of a nonlinear process with system uncertainty and delay using variable structure |
Legal Events
| Date | Code | Title | Description |
|---|---|---|---|
| PUAI | Public reference made under article 153(3) epc to a published international application that has entered the european phase |
Free format text: ORIGINAL CODE: 0009012 |
|
| AK | Designated contracting states |
Kind code of ref document: A1 Designated state(s): DE FR GB IT |
|
| 17P | Request for examination filed |
Effective date: 19911129 |
|
| 17Q | First examination report despatched |
Effective date: 19930805 |
|
| GRAA | (expected) grant |
Free format text: ORIGINAL CODE: 0009210 |
|
| ITF | It: translation for a ep patent filed | ||
| AK | Designated contracting states |
Kind code of ref document: B1 Designated state(s): DE FR GB IT |
|
| REF | Corresponds to: |
Ref document number: 69011851 Country of ref document: DE Date of ref document: 19940929 |
|
| ET | Fr: translation filed | ||
| PLBE | No opposition filed within time limit |
Free format text: ORIGINAL CODE: 0009261 |
|
| STAA | Information on the status of an ep patent application or granted ep patent |
Free format text: STATUS: NO OPPOSITION FILED WITHIN TIME LIMIT |
|
| 26N | No opposition filed | ||
| PGFP | Annual fee paid to national office [announced via postgrant information from national office to epo] |
Ref country code: GB Payment date: 19951026 Year of fee payment: 6 |
|
| PGFP | Annual fee paid to national office [announced via postgrant information from national office to epo] |
Ref country code: FR Payment date: 19961021 Year of fee payment: 7 |
|
| PGFP | Annual fee paid to national office [announced via postgrant information from national office to epo] |
Ref country code: DE Payment date: 19961028 Year of fee payment: 7 |
|
| PG25 | Lapsed in a contracting state [announced via postgrant information from national office to epo] |
Ref country code: GB Effective date: 19961120 |
|
| GBPC | Gb: european patent ceased through non-payment of renewal fee |
Effective date: 19961120 |
|
| PG25 | Lapsed in a contracting state [announced via postgrant information from national office to epo] |
Ref country code: FR Free format text: THE PATENT HAS BEEN ANNULLED BY A DECISION OF A NATIONAL AUTHORITY Effective date: 19971130 |
|
| PG25 | Lapsed in a contracting state [announced via postgrant information from national office to epo] |
Ref country code: DE Free format text: LAPSE BECAUSE OF NON-PAYMENT OF DUE FEES Effective date: 19980801 |
|
| REG | Reference to a national code |
Ref country code: FR Ref legal event code: ST |
|
| PG25 | Lapsed in a contracting state [announced via postgrant information from national office to epo] |
Ref country code: IT Free format text: LAPSE BECAUSE OF NON-PAYMENT OF DUE FEES;WARNING: LAPSES OF ITALIAN PATENTS WITH EFFECTIVE DATE BEFORE 2007 MAY HAVE OCCURRED AT ANY TIME BEFORE 2007. THE CORRECT EFFECTIVE DATE MAY BE DIFFERENT FROM THE ONE RECORDED. Effective date: 20051120 |