EP0307989A2 - Spectromètre à résonance magnétique nucléaire - Google Patents
Spectromètre à résonance magnétique nucléaire Download PDFInfo
- Publication number
- EP0307989A2 EP0307989A2 EP88201866A EP88201866A EP0307989A2 EP 0307989 A2 EP0307989 A2 EP 0307989A2 EP 88201866 A EP88201866 A EP 88201866A EP 88201866 A EP88201866 A EP 88201866A EP 0307989 A2 EP0307989 A2 EP 0307989A2
- Authority
- EP
- European Patent Office
- Prior art keywords
- frequency
- signal
- magnetic resonance
- nuclear magnetic
- analog
- Prior art date
- Legal status (The legal status is an assumption and is not a legal conclusion. Google has not performed a legal analysis and makes no representation as to the accuracy of the status listed.)
- Withdrawn
Links
Images

Classifications
-
- G—PHYSICS
- G01—MEASURING; TESTING
- G01R—MEASURING ELECTRIC VARIABLES; MEASURING MAGNETIC VARIABLES
- G01R33/00—Arrangements or instruments for measuring magnetic variables
- G01R33/20—Arrangements or instruments for measuring magnetic variables involving magnetic resonance
- G01R33/28—Details of apparatus provided for in groups G01R33/44 - G01R33/64
- G01R33/32—Excitation or detection systems, e.g. using radio frequency signals
- G01R33/36—Electrical details, e.g. matching or coupling of the coil to the receiver
- G01R33/3621—NMR receivers or demodulators, e.g. preamplifiers, means for frequency modulation of the MR signal using a digital down converter, means for analog to digital conversion [ADC] or for filtering or processing of the MR signal such as bandpass filtering, resampling, decimation or interpolation
-
- G—PHYSICS
- G01—MEASURING; TESTING
- G01R—MEASURING ELECTRIC VARIABLES; MEASURING MAGNETIC VARIABLES
- G01R33/00—Arrangements or instruments for measuring magnetic variables
- G01R33/20—Arrangements or instruments for measuring magnetic variables involving magnetic resonance
- G01R33/28—Details of apparatus provided for in groups G01R33/44 - G01R33/64
- G01R33/32—Excitation or detection systems, e.g. using radio frequency signals
- G01R33/36—Electrical details, e.g. matching or coupling of the coil to the receiver
- G01R33/3607—RF waveform generators, e.g. frequency generators, amplitude-, frequency- or phase modulators or shifters, pulse programmers, digital to analog converters for the RF signal, means for filtering or attenuating of the RF signal
Definitions
- the invention relates to a nuclear magnetic resonance spectrometer, in which at least two mixing stages are provided in the receiving branch for converting the nuclear magnetic resonance signals into a lower frequency range, and in which an analog-digital converter converts the nuclear magnetic resonance signals converted into the lower frequency range into a sequence of digital data words, wherein the sampling frequency is at least twice as high as the highest frequency in the converted nuclear magnetic resonance signal.
- Such a spectrometer is known from DE-OS 2 928 551, in particular Fig. 13.
- the image frequency is the frequency which has the same frequency spacing as the useful frequency from the mixed frequency with which the useful frequency is mixed).
- the noise and interference signals in the image frequency range must therefore be suppressed by a filter arranged in the signal path upstream of the mixer.
- the requirements for this filter are relatively low in the known spectrometer, because the first frequency with which the nuclear magnetic resonance signal is mixed is significantly higher than the Lamor frequency, so that the image frequency range can be suppressed by a filter with low slope.
- the second mixer stage the output signal of the first mixer stage is mixed down into the baseband.
- the second mixer stage is designed as a quadrature mixer, in which the output signal of the first mixer stage is multiplied by two signals offset by 90 ° relative to one another, the frequency of which corresponds exactly to the temporal mean value of the output signal of the first mixer stage. This mixing process prevents disturbances or noise that lie outside the frequency range of the nuclear magnetic resonance signal from being transposed into the baseband.
- the quadrature mixer must be constructed exactly symmetrically, and the phase shift between the two sinusoidal signals must be exactly 90 °.
- the fulfillment of these requirements with an analog mixing stage is relatively complex.
- Another disadvantage is that the lowest useful frequency in the baseband is so low that a DC voltage amplifier must be used to amplify the output signal of the quadrature mixer. Shifting the operating point of this amplifier results in a disturbing drift, which leads to reconstruction errors in the further processing of the signal.
- the low-frequency 1 / f noise (often also referred to as sparkling noise) and harmonics of the mains frequency have a particularly disruptive effect in the baseband.
- the nuclear magnetic resonance signal is mixed with a first frequency in the first mixing stage, that the nuclear magnetic resonance signal is mixed in the first mixing stage with a first frequency that is close to the Lamor frequency and that in one to the first mixing stage following the second mixer stage, the output signal of the first mixer stage is mixed with a second frequency which differs from the difference frequency and is substantially smaller than the first frequency.
- the useful signal is not transposed into the baseband by the two (or more) mixes, but into a higher frequency range.
- DC-decoupled stages can be used in the analog part of the spectrometer, so that the problem of DC voltage drift is eliminated.
- interference caused by harmonics of the mains frequency and by the so-called 1 / f noise is suppressed because the useful frequency range is higher than the frequency range of these interference.
- the useful frequency band can be converted into a frequency range that can still be processed by the currently available analog-digital converters with the required resolution (15 bit!) Without noise or interference outside the useful frequency band can be transposed essentially into the useful frequency band by the double mixing process, and without the filtering effort required for this being disproportionately high.
- a further development of the invention provides that the second frequency for the second mixer stage (and for any further mixer stages) is higher than the (respective) useful frequency.
- the filtering at the input of the mixing stage can be carried out by means of a low pass (instead of a bandpass), which then suppresses the image frequency range on the one hand and the sum frequency at the output of the preceding mixing stage on the other hand.
- a signal generator is provided in the transmission branch, in which a carrier is modeled with a third frequency that is less than half the sampling frequency of the analog-digital converter and that the output signal of the signal generator with the same Frequencies are mixed like the nuclear magnetic resonance signal in the receiving branch.
- the first and the second frequency and the sampling frequency are selected such that the frequency spacing between the first and the second frequency and the highest signal frequency still to be transmitted at the input of the associated mixer, divided by the first or second frequency corresponds at least approximately to the frequency spacing between half the sampling frequency and the uppermost signal frequency still to be implemented by the analog / digital converter, divided by half the sampling frequency. It is thereby achieved that the requirements for the steepness of the edges of the filters provided at the inputs or the outputs of the mixing stages are the same, so that the lowest filter effort results overall.
- Another embodiment of the invention provides that the generators supplying the first and the second frequency and the sampling frequency are synchronized with a common reference oscillator. This ensures that all frequencies are in a fixed relation to each other, so that phase noise is largely prevented.
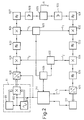
- Fig. 1, 1 denotes a device that generates a homogeneous and stationary magnetic field of, for example, 0.5 T in an examination area 2 that runs perpendicular to the plane of the drawing and that, if necessary, also generates magnetic gradient fields, ie magnetic fields that are in the same direction run like the stationary homogeneous magnetic field, the strength of which, however, changes linearly in the direction of the magnetic field or in a direction perpendicular thereto.
- the device 1 is coupled to a generator 3, which generates the stationary magnetic field, and to a generator 4, which supplies the currents for the various magnetic gradient fields.
- a high-frequency coil 5 which generates a high-frequency magnetic field perpendicular to the stationary magnetic field and which is connected to the output of a spectrometer 6.
- the spectrometer delivers the radio frequency energy for the radio frequency in transmission mode coil 5 and in reception mode processes the nuclear magnetic resonance signals induced in this coil.
- the generators 3 and 4 and the spectrometer 6 are controlled by a digital central unit 7, which contains a control part 71 for this purpose.
- the digital central unit comprises a processing part 72, which processes the data supplied by the spectrometer 6 and reconstructs the nuclear magnetization distribution in the examination area 2 therefrom.
- the spectrometer comprises a signal generator 61 which delivers at its output a sequence of digital data words, which represents an envelope signal modulated on a carrier of 102.45 KHz.
- the envelope signal defines the time course of the envelope of the high-frequency pulse generated by the coil 5. It is taken from an envelope memory present in the signal generator and multiplied in a digital multiplier 612 by a sinusoidal signal with a carrier frequency of 102.45 KHz. This signal is taken from a table memory (look-up table) 613 in which a sine table is stored.
- the clock frequency for reading out the memories 611 and 613, which is substantially higher than the carrier frequency of 102.45 kHz, is supplied by a sequence control unit 711, which is part of the control unit 71.
- the digital signal of the signal generator 61 is fed to a digital-to-analog converter 620.
- the analog output signal of this converter represented by a filter, not shown, is mixed in a mixer 621 with a signal that is generated by a frequency synthesizer 622 and whose frequency f2 is 1.35 MHz.
- a difference appears at the output of mixer stage 621 frequency band (around 1.24755 MHz) and a sum frequency band.
- a low-pass filter 623 passes the difference frequency band and largely suppresses the sum frequency band.
- the mixing frequency f1 is generated by a synthesizer 625, which, like the synthesizer 622, is generated by e.g. 10 MHz oscillating reference oscillator 626 is synchronized. This synchronization largely prevents phase noise.
- the output signal of the mixer 624 in turn contains a sum frequency band which is largely suppressed by a low pass 627 and a difference frequency band which is amplified in a power amplifier 628 after passing through the low pass 624.
- the difference frequency is 21.29245 MHz. This is the lamor frequency for hydrogen protons in a stationary magnetic field of 0.5 T.
- the difference frequency band is fed to the high-frequency coil 5 via a switching device 629, which thereby generates a magnetic high-frequency pulse.
- the changeover switch 629 In reception mode, ie after the examination area or a part thereof has been excited by one or more high-frequency pulses, the changeover switch 629 is switched over so that the nuclear magnetic resonance signals induced in the high-frequency coil 5 are fed to a preamplifier 630.
- the frequency of the nuclear magnetic resonance signals lies around the nuclear magnetic resonance frequency (21.29245 MHz), the maximum bandwidth of the nuclear magnetic resonance signals depending on the size of the examination area and on the gradient of the magnetic gradient field; a typical value for the bandwidth is 60 kHz.
- the top useful frequency, which is amplified in the preamplifier 630 is therefore 21.32245 MHz.
- the output signal of the preamplifier 630 is fed through a filter 631 to an input of a mixer 632, the other mixing input of which is fed to the output signal of the synthesizer 625 with the frequency f 1.
- Fig. 3a the spectra of the signals at the inputs and outputs of the mixer 632 are shown, the useful frequency band being designated B1.
- the mixing process results in a difference frequency band B2 and a sum frequency band B'2. -
- the image frequency band includes those frequencies whose frequency distance from the carrier f 1 is the same as the frequency distance of the useful signals in the B 1 from this carrier.
- the lowest image frequency is designated f S1 in FIG. 3a. For the example given, it is 23.75755 MHz.
- the filter 631 must therefore be designed so that it passes through the useful frequency band B 1 without weakening it while suppressing the frequency f S1 and all higher image frequencies.
- the filter is preferably designed as a low-pass filter, the amplitude frequency response of which is designated by the dashed curve G 1 in FIG. 3a.
- the output signal of the mixer 632 is fed via a filter 633 designed as a low-pass filter to a further mixer 634, in which it is mixed with the second frequency f2.
- the spectrum at the inputs and outputs of this mixing stage is shown in Fig. 3b - on an enlarged scale, as indicated by the dash-dotted line.
- Analogue to mixer level 632 are also here generated a difference frequency band B3 (at 102.45 KHz) and a sum frequency band B'3 during the mixing process.
- the low-pass filter 633 must be constructed in such a way that it passes the useful frequency band B2 unattenuated, while suppressing the image frequency f S2 as much as possible.
- the required amplitude frequency response is designated in Fig. 3b with G2. Through this low-pass filter, the sum frequency band B'2 at the output of the first mixer stage is completely suppressed.
- the output signal of the mixer 634 is fed via a low-pass filter 635 to an analog-digital converter 636, the sampling frequency f T of which is 280 KHz.
- an analog-digital converter 636 can digitize signals with a frequency of up to 140 kHz. Band B3 lies in this frequency range (72.45 KHz to 132.45 KHz). Signals whose frequency is above twice the sampling frequency are folded into the useful frequency band below 140 kHz by the sampling process (aliasing effect), but their frequency spacing from half the carrier frequency is retained.
- the frequency response required for this is designated in Fig. 3 with G3.
- the output signal of the analog-digital converter is then further processed in a digital filter 721 which is part of the unit 72.
- the interference frequency components below the useful frequency band are in this filter suppressed, for example harmonics of the network frequency etc.
- the further signal processing in unit 72 can take place in a manner known per se.
- the clock frequencies for the digital filter 721 and the analog-digital converter 636 are - like the clock frequency for the signal generator 61 - also synchronized with the frequency of the reference oscillator.
- the effort for the filter 630 could be reduced if the first frequency f 1 were higher by 250 kHz; the distance between the top frequency of the useful band B1 and the lowest image frequency f S1 would then be 500 KHz larger. Then, however, the difference frequency band B2 would also be 250 KHz higher and then the second frequency f2 would have to be 250 KHz higher if the position of the frequency band B3 should remain unchanged.
- the low-pass filter 633 would then have relatively steep edges because the frequency spacing related to the frequency f 2 would be reduced. - The effort for the filter 633 could be reduced if the position of the band B2 f2 were slightly increased. This in turn would result in stricter requirements for the low pass 635. Since the sampling frequency of the (15 bit) analog-to-digital converter has an upper limit, the frequencies f 1 and f 2 can still be freely selected; however, this affects the outlay for filters 631 to 635, as the above considerations show.
- the frequencies f1 and f2 are therefore chosen so that the relative slope of all filters are the same. With relative slope, the quotient of the difference between the (top) useful frequency and the (lowest) image frequency divided by the center frequency (f1, f2 or f T / 2). This quotient is approximately 0.108 for the filters 631, 633 and 635. To suppress the undesired frequencies by, for example, 20 db, these filters must be of at least 22nd order. If the effort for one of these filters were changed by shifting the frequencies f 1 and / or f 2, the effort for at least one other filter would have to be increased significantly, so that the total effort would increase.
- the difference band B2 would not change its position. In this case, a high pass would be required as a filter to suppress the image frequencies.
- the frequency band B3 would then appear in the inverted position, i.e. the highest frequency component of the nuclear magnetic resonance signal would be the lowest in band B3 (and vice versa), but this could be taken into account in the further processing of the Fourier-transformed signal.
- the band B3 would appear in the normal position at the input of the analog-digital converter. In this case, however, it would not be sufficient if a high-pass filter was used as the input filter 633 before the second mixer stage, because this filter would also have to suppress the sum frequency band. Ultimately, the filter would therefore have to be designed as a very high-order bandpass filter - which is quite complex - or the sum frequency band B'2 at the output of the mixer 632 would have to be suppressed by means of an additional low-pass filter, which, however, could be constructed relatively simply.
Landscapes
- Physics & Mathematics (AREA)
- Condensed Matter Physics & Semiconductors (AREA)
- General Physics & Mathematics (AREA)
- Magnetic Resonance Imaging Apparatus (AREA)
Applications Claiming Priority (2)
| Application Number | Priority Date | Filing Date | Title |
|---|---|---|---|
| DE3730293 | 1987-09-10 | ||
| DE19873730293 DE3730293A1 (de) | 1987-09-10 | 1987-09-10 | Kernresonanz-spektrometer |
Publications (2)
| Publication Number | Publication Date |
|---|---|
| EP0307989A2 true EP0307989A2 (fr) | 1989-03-22 |
| EP0307989A3 EP0307989A3 (fr) | 1990-09-26 |
Family
ID=6335629
Family Applications (1)
| Application Number | Title | Priority Date | Filing Date |
|---|---|---|---|
| EP19880201866 Withdrawn EP0307989A3 (fr) | 1987-09-10 | 1988-09-01 | Spectromètre à résonance magnétique nucléaire |
Country Status (4)
| Country | Link |
|---|---|
| US (1) | US4873486A (fr) |
| EP (1) | EP0307989A3 (fr) |
| JP (1) | JPS6472045A (fr) |
| DE (1) | DE3730293A1 (fr) |
Cited By (3)
| Publication number | Priority date | Publication date | Assignee | Title |
|---|---|---|---|---|
| EP0411840A2 (fr) * | 1989-08-04 | 1991-02-06 | General Electric Company | Récepteur de haute fréquence pour un instrument à résonance magnétique nucléaire |
| EP0937993A1 (fr) * | 1998-02-24 | 1999-08-25 | Council of Scientific and Industrial Research | Récepteur à mode de détection simple pour détecter la résonance magnétique dans le domaine temporel |
| DE10004423A1 (de) * | 2000-02-02 | 2001-08-16 | Siemens Ag | Zusatzgerät für ein Steuergerät für einen Magnetresonanztomographen |
Families Citing this family (3)
| Publication number | Priority date | Publication date | Assignee | Title |
|---|---|---|---|---|
| US6294914B1 (en) * | 1993-06-02 | 2001-09-25 | The Board Of Trustees Of The University Of Illinois | Method of enhancing an MRI signal |
| US5594341A (en) * | 1994-06-27 | 1997-01-14 | Varian Associates, Inc. | Nuclear magnetic resonance receiver, method and system |
| US20030207672A1 (en) * | 2002-05-03 | 2003-11-06 | Intel Corporation | Wideband tuning circuit for low-voltage silicon process and method for generating a tuning frequency |
Citations (2)
| Publication number | Priority date | Publication date | Assignee | Title |
|---|---|---|---|---|
| CH526777A (de) * | 1971-05-28 | 1972-08-15 | Spectrospin Ag | Verfahren zur Aufnahme von Spinresonanzspektren und Vorrichtung zu dessen Durchführung |
| US3720816A (en) * | 1969-11-08 | 1973-03-13 | Spectrospin Ag | Method for fourier analysis of interference signals |
Family Cites Families (4)
| Publication number | Priority date | Publication date | Assignee | Title |
|---|---|---|---|---|
| DE1962471C3 (de) * | 1968-12-25 | 1975-03-27 | Nihon Denshi K.K., Tokio | Verfahren zur Messung der gyromagnetischen Resonanz nach der Seitenbandmethode |
| US3886439A (en) * | 1970-07-30 | 1975-05-27 | Laukien Guenther R | Method of separating broad and narrow lines of a frequency spectrum |
| US4297637A (en) * | 1978-07-20 | 1981-10-27 | The Regents Of The University Of California | Method and apparatus for mapping lines of nuclear density within an object using nuclear magnetic resonance |
| US4551856A (en) * | 1983-05-16 | 1985-11-05 | Motorola, Inc. | Synthesized multiple conversion receiver system with provision for avoiding receiver self-quieting spurious response |
-
1987
- 1987-09-10 DE DE19873730293 patent/DE3730293A1/de not_active Withdrawn
-
1988
- 1988-09-01 EP EP19880201866 patent/EP0307989A3/fr not_active Withdrawn
- 1988-09-07 JP JP63222603A patent/JPS6472045A/ja active Pending
- 1988-09-08 US US07/241,635 patent/US4873486A/en not_active Expired - Fee Related
Patent Citations (2)
| Publication number | Priority date | Publication date | Assignee | Title |
|---|---|---|---|---|
| US3720816A (en) * | 1969-11-08 | 1973-03-13 | Spectrospin Ag | Method for fourier analysis of interference signals |
| CH526777A (de) * | 1971-05-28 | 1972-08-15 | Spectrospin Ag | Verfahren zur Aufnahme von Spinresonanzspektren und Vorrichtung zu dessen Durchführung |
Cited By (5)
| Publication number | Priority date | Publication date | Assignee | Title |
|---|---|---|---|---|
| EP0411840A2 (fr) * | 1989-08-04 | 1991-02-06 | General Electric Company | Récepteur de haute fréquence pour un instrument à résonance magnétique nucléaire |
| EP0411840A3 (en) * | 1989-08-04 | 1991-07-03 | General Electric Company | Radio frequency receiver for a nmr instrument |
| EP0937993A1 (fr) * | 1998-02-24 | 1999-08-25 | Council of Scientific and Industrial Research | Récepteur à mode de détection simple pour détecter la résonance magnétique dans le domaine temporel |
| DE10004423A1 (de) * | 2000-02-02 | 2001-08-16 | Siemens Ag | Zusatzgerät für ein Steuergerät für einen Magnetresonanztomographen |
| DE10004423C2 (de) * | 2000-02-02 | 2002-01-31 | Siemens Ag | Zusatzgerät für ein Steuergerät für einen Magnetresonanztomographen |
Also Published As
| Publication number | Publication date |
|---|---|
| DE3730293A1 (de) | 1989-03-23 |
| US4873486A (en) | 1989-10-10 |
| JPS6472045A (en) | 1989-03-16 |
| EP0307989A3 (fr) | 1990-09-26 |
Similar Documents
| Publication | Publication Date | Title |
|---|---|---|
| EP0292064B1 (fr) | Appareil pour tomographie à spin nucléaire comportant un émeutteur/récepteur numérique | |
| EP0336479B1 (fr) | Spectromètre à résonance magnétique nucléaire | |
| EP0226247A2 (fr) | Procédé de tomographie à spin nucléaire et dispositif de mise en oeuvre de ce procédé | |
| EP0789251B1 (fr) | Procédé RM de détermination de l'inhomogénéité du champ magnétique dans la région d'examen et dispositif RM pour la mise en oeuvre du procédé | |
| EP0304737B1 (fr) | Procédé pour réduire le bruit d'un mélangeur et mélangeur pour réaliser le procédé | |
| DE2356712C3 (de) | Verfahren zur Bildung eines magnetischen Resonanzspektrums und Spektrometer zu dessen Durchführung | |
| EP0349078B1 (fr) | Circuit de production de signaux haute fréquence pour l'examen par spin nucléaire | |
| EP0259935B1 (fr) | Procédé de tomographie en spins nucléaires et tomographe en spins nucléaires pour la mise en oeuvre du procédé | |
| EP0307989A2 (fr) | Spectromètre à résonance magnétique nucléaire | |
| DE3739856A1 (de) | Kernresonanz-spektroskopieverfahren | |
| EP0329240A2 (fr) | Procédé pour déterminer la distribution spectrale de la magnétisation nucléaire dans un volume limité et dispositif pour la mise en oeuvre du procédé | |
| EP0427343A2 (fr) | Procédé de tomographie à spin nucléaire pour la production d'images séparées de la graisse et de l'eau et dispositif pour la réalisation du procédé | |
| EP0357100A2 (fr) | Procédé tomographique à résonance nucléaire et tomographe à résonance nucléaire pour la mise en oeuvre de ce procédé | |
| DE4326045A1 (de) | Kernspinresonanzgerät mit mindestens zwei Sendefrequenzen | |
| EP0357141B1 (fr) | Générateur de haute fréquence pour un appareil d'examen à spin nucléaire | |
| EP0232945A2 (fr) | Procédé pour déterminer la distribution de la magnétisation nucléaire dans une couche de région d'examen et tomographe à spin nucléaire pour la mise en oeuvre du procédé | |
| EP0478030B1 (fr) | Procédé pour la spectroscopie RMN à deux dimensions | |
| DE19901750A1 (de) | Anordnung zum Messen des Phasenrauschens eines Meßobjekts | |
| DE102004037577A1 (de) | Verfahren zum Messen des Phasenrauschens eines Hochfrequenzsignals und Meßgerät zum Ausführen dieses Verfahrens | |
| DE4207045A1 (de) | Digitales frequenzerzeugungsgeraet | |
| EP0248469B1 (fr) | Procédé de tomographie dans des spins nucléaires | |
| DE1773846C3 (de) | Verfahren und Vorrichtung zur Erzeu gung eines linearen Frequenzvorschubs bei Kernresonanzspektrographen | |
| EP0502449A1 (fr) | Convertisseur de fréquence | |
| DE3701849A1 (de) | Verfahren und vorrichtung fuer die kernspintomographie | |
| DE3808281A1 (de) | Verfahren zur bestimmung der kernmagnetisierungsverteilung und anordnung zur durchfuehrung des verfahrens |
Legal Events
| Date | Code | Title | Description |
|---|---|---|---|
| PUAI | Public reference made under article 153(3) epc to a published international application that has entered the european phase |
Free format text: ORIGINAL CODE: 0009012 |
|
| AK | Designated contracting states |
Kind code of ref document: A2 Designated state(s): DE FR GB NL |
|
| PUAL | Search report despatched |
Free format text: ORIGINAL CODE: 0009013 |
|
| AK | Designated contracting states |
Kind code of ref document: A3 Designated state(s): DE FR GB NL |
|
| RHK1 | Main classification (correction) |
Ipc: G01R 33/54 |
|
| 17P | Request for examination filed |
Effective date: 19910321 |
|
| 17Q | First examination report despatched |
Effective date: 19931119 |
|
| STAA | Information on the status of an ep patent application or granted ep patent |
Free format text: STATUS: THE APPLICATION IS DEEMED TO BE WITHDRAWN |
|
| 18D | Application deemed to be withdrawn |
Effective date: 19940330 |