EP0232946A2 - Procédé pour déterminer la distribution spatiale et spectrale de la magnétisation nucléaire dans une région d'examen et dispositif pour la mise en oeuvre du procédé - Google Patents
Procédé pour déterminer la distribution spatiale et spectrale de la magnétisation nucléaire dans une région d'examen et dispositif pour la mise en oeuvre du procédé Download PDFInfo
- Publication number
- EP0232946A2 EP0232946A2 EP87200188A EP87200188A EP0232946A2 EP 0232946 A2 EP0232946 A2 EP 0232946A2 EP 87200188 A EP87200188 A EP 87200188A EP 87200188 A EP87200188 A EP 87200188A EP 0232946 A2 EP0232946 A2 EP 0232946A2
- Authority
- EP
- European Patent Office
- Prior art keywords
- gradient
- samples
- field
- magnetic
- frequency
- Prior art date
- Legal status (The legal status is an assumption and is not a legal conclusion. Google has not performed a legal analysis and makes no representation as to the accuracy of the status listed.)
- Withdrawn
Links
Images


Classifications
-
- G—PHYSICS
- G01—MEASURING; TESTING
- G01R—MEASURING ELECTRIC VARIABLES; MEASURING MAGNETIC VARIABLES
- G01R33/00—Arrangements or instruments for measuring magnetic variables
- G01R33/20—Arrangements or instruments for measuring magnetic variables involving magnetic resonance
- G01R33/44—Arrangements or instruments for measuring magnetic variables involving magnetic resonance using nuclear magnetic resonance [NMR]
- G01R33/48—NMR imaging systems
- G01R33/4818—MR characterised by data acquisition along a specific k-space trajectory or by the temporal order of k-space coverage, e.g. centric or segmented coverage of k-space
- G01R33/482—MR characterised by data acquisition along a specific k-space trajectory or by the temporal order of k-space coverage, e.g. centric or segmented coverage of k-space using a Cartesian trajectory
-
- G—PHYSICS
- G01—MEASURING; TESTING
- G01R—MEASURING ELECTRIC VARIABLES; MEASURING MAGNETIC VARIABLES
- G01R33/00—Arrangements or instruments for measuring magnetic variables
- G01R33/20—Arrangements or instruments for measuring magnetic variables involving magnetic resonance
- G01R33/44—Arrangements or instruments for measuring magnetic variables involving magnetic resonance using nuclear magnetic resonance [NMR]
- G01R33/48—NMR imaging systems
- G01R33/483—NMR imaging systems with selection of signals or spectra from particular regions of the volume, e.g. in vivo spectroscopy
-
- G—PHYSICS
- G01—MEASURING; TESTING
- G01R—MEASURING ELECTRIC VARIABLES; MEASURING MAGNETIC VARIABLES
- G01R33/00—Arrangements or instruments for measuring magnetic variables
- G01R33/20—Arrangements or instruments for measuring magnetic variables involving magnetic resonance
- G01R33/44—Arrangements or instruments for measuring magnetic variables involving magnetic resonance using nuclear magnetic resonance [NMR]
- G01R33/48—NMR imaging systems
- G01R33/54—Signal processing systems, e.g. using pulse sequences ; Generation or control of pulse sequences; Operator console
- G01R33/56—Image enhancement or correction, e.g. subtraction or averaging techniques, e.g. improvement of signal-to-noise ratio and resolution
Definitions
- the invention relates to a method for determining the spatial and spectral distribution of the nuclear magnetization in an examination area, in which a number of sequences act on the examination area in the presence of a homogeneous stationary magnetic field, each sequence having at least one magnetic high-frequency pulse for excitation of nuclear magnetic resonance and subsequently comprises several periods of a magnetic gradient field with a periodically changing its polarity gradient, after which the echo signals generated in the examination area are converted into digital samples and these are subjected to a discrete Fourier transformation.
- a method is known (Matsui et al, J.Am.Chem.Soc. 1985, 107, pages 2817 to 2818).
- the invention also relates to an arrangement for carrying out the method.
- Each sequence comprises two high-frequency pulses that tilt the magnetization vector from its previous position by 90 ° or 180 ° in the examination area.
- a gradient field is switched on for the purpose of phase coding, the gradient of which changes from sequence to sequence.
- a further magnetic gradient field is created, the gradient n of which runs in a direction perpendicular to the (y) direction of the gradient of the aforementioned gradient field (ie in the x direction) and changes periodically from a positive to a negative value .
- an echo signal is emitted generated.
- the echo signals that arise with positive (or with negative) gradients are converted to digital samples and subjected to a Fourier transformation.
- the digital samples generated in this way can each be classified into three different groups:
- the first group comprises the equidistant samples of an echo signal.
- the second group comprises samples which occur in different sequences in each case with the same echo signal and in the same phase with respect to the periodic gradient field, and the third group comprises the samples which in different echo signals of the same sequence each in the same phase with respect to the Gradient field occur.
- the time interval between the samples of a group is always the same; it is smallest in the first group and largest in the second group.
- the groups of samples obtained in this way are subjected to a three-dimensional discrete Fourier transformation, which results in the nuclear magnetization in the examination area as a function of the location (x, y) and as a function of the frequency (more precisely: as a function of the frequency deviation from the center frequency of the high-frequency excitation pulse).
- the bandwidth within which the nuclear magnetization can be detected corresponds to the frequency of the magnetic gradient field. If, for example, this has a period of 4.992 ms, a bandwidth of 200.3 Hz results.
- This frequency range can be broken down into a number of sub-ranges, the number of which corresponds to the number of periods of the periodic gradient field within a sequence.
- the periodic gradient field is practically rectangular in time, so that the sampled values are always recorded at times when the gradient is constant and either positive or negative (in reality, the course over time is not exactly rectangular, but the switchover time (50 ⁇ s) shorter than the time interval between two samples (78 ⁇ s), so that the echo signal is always sampled at times when the gradient is constant and either positive or negative.
- the spatial resolution in the direction in which the gradient of the periodic magnetic gradient field runs is limited; the highest spatial frequency in this direction is proportional to the time integral over the positive or negative part of the period of the gradient. It is not possible to increase this value by increasing the gradient if the current through the gradient coils, with the aid of which the gradient field is generated, has already reached its maximum value. It is also practically impossible to increase the resolving power by increasing the period of the periodic gradient field, because this reduces the resolvable bandwidth, which corresponds to the reciprocal of the period.
- the spatial resolution capability is further restricted in practice.
- the gradient coils must be large enough to accommodate a patient. As a result, they have greater inductance and store more electromagnetic energy than smaller coils.
- the switchover phase from a positive to a negative gradient (and vice versa) takes considerably longer than in the known one Method so that the duration of the switching phase can be a multiple of the time interval between two successive samples of an echo signal generated in the examination area.
- the sampling of the echo signals must be limited to the time intervals in which the gradient is constant.
- the temporal integral over the gradient during this interval is (with the same strength of the gradient and with the same period duration) even smaller than with a rectangular course of the magnetic gradient field, which results in a reduced resolution.
- the object of the present invention is to provide a method which, in contrast, results in an improved resolving power when the periodic gradient field deviates from the rectangular shape, and an arrangement for carrying out this method.
- this object is achieved according to the invention in that the temporal profile of the magnetic gradient field deviates from the rectangular shape, that the sampled values that occur when the gradient field changes and that these and the other sampled values are also detected Spatial frequency range assigned and transformed from this into the spatial range by the Fourier transformation.
- the echo signals are also sampled in the phases in which the gradient of the periodic gradient field changes, in particular also in the changeover phases.
- the echo signals are converted into n digital samples at equidistant times, an immediate Fourier transformation using these samples would lead to errors.
- the sample values are assigned to the spatial frequencies at which they were recorded in the invention. Because of the changed gradient in the spatial frequency range, the sample values are not at the same distance from one another.
- the subsequent Fourier transformation must therefore be designed in such a way that it can be carried out on the basis of function values discretely specified at non-equidistant reference points.
- such Fourier transform methods are known, e.g. from "ntz Archive” Vol. 3 (1981) Issue 2, pages 35 to 38.
- the assignment to the spatial frequency range can also take place in that the signal is not sampled equidistantly in time in such a way that the sampled values in the spatial frequency range are each at the same distance from one another.
- a digital converter arrangement for generating digital samples from the echo signals, a memory for recording the samples and a computer for performing a Fourier transformation with the samples is characterized in that the control device is designed in this way is that at least one of the gradient coils generates a periodic magnetic field with a time course deviating from the rectangular shape, that during the periods with non-constant gradients from the digital converter arrangement, digital samples are generated from the echo signals and stored in the memory, and that Means are provided which convert the sequence of the sampled values into a sequence of values which is equidistant in the spatial frequency range and which are fed to the computer for the Fourier transformation from the spatial frequency range into the spatial area.
- the measurement time can be halved by switching a second magnetic gradient field, the gradient of which is perpendicular to the gradient of the first gradient field, synchronously with the first gradient field, the change in the time integral over the gradient of the second gradient field being small in comparison to the temporal integral over the resulting gradients of both gradient fields, and that the echo signals occurring with a positive gradient of the first magnetic gradient field on the one hand and with a negative gradient on the other hand are converted into digital samples and subjected separately to a Fourier transformation. Be positive polarity of the gradient of the magnetic gradient field other areas of the spatial frequency-time range are detected than in the case of negative polarity, so that the time for the detection of the sample values assigned to this area is halved.
- the nuclear spin tomography device shown schematically in FIG. 1 contains an arrangement consisting of four coils 1 for generating a homogeneous stationary magnetic field which can be of the order of a few tenths to a few T. This field runs in the z direction of a Cartesian coordinate system.
- the coils 1 arranged concentrically to the z-axis can be arranged on a spherical surface 2.
- the patient 20 to be examined is located inside these coils.
- each coil 3 is preferably arranged on the same spherical surface. Furthermore, four coils 7 are provided, which generate a magnetic field Gx, which also runs in the z direction, but whose gradient runs in the x direction.
- a magnetic field Gy running in the z-direction with a gradient in the y-direction is generated by four coils 5, which can be identical to the coils 7, but which are arranged spatially offset from one another by 90 °. Of these four coils 5, only two are shown in FIG. 1.
- each of the three coil arrangements 3, 5 and 7 for generating the magnetic gradient fields Gz, Gy and Gx is arranged symmetrically to the sphere surface 2, the field strength is in the center of the sphere, which at the same time forms the coordinate origin of the Cartesian x, y, z coordinate system, determined only by the stationary homogeneous magnetic field of the coil assembly 1.
- a high-frequency modulated current is supplied to the high-frequency coil from a high-frequency generator during each high-frequency pulse. - Following one or more high-frequency pulses, the high-frequency coil 11 is used to receive the echo signals generated by nuclear magnetic resonance in the examination area. Instead, a separate high-frequency receiving coil can also be used.
- the high-frequency coil 11 is connected on the one hand to a high-frequency generator 4 and on the other hand to a high-frequency receiver 6 via a switching device 12.
- the high-frequency generator 4 contains a high-frequency oscillator 40 which has vibrations with a frequency equal to the Larmor frequency of the hydrogen protons at the field strength generated by the coils 1; at a field strength of 0.5 T this frequency is around 21.3 MHz and at 2 T around 85 MHz.
- the output of the oscillator 40 is connected to an input of a mixer 43.
- the mixer 43 is supplied with a second input signal from a digital-to-analog converter 44, the input of which is connected to a digital memory 45. Controlled by a control device 15, a sequence of digital data words representing an envelope signal is read out of the memory 45.
- the mixer stage 17 processes the input signals supplied to it so that the carrier oscillation modulated with the envelope signal appears at its output.
- the envelope signal is chosen so that a preferably amplitude-modulated signal results, the bandwidth of which is relatively large.
- the output signal of the mixer 43 is fed via a switch 46 controlled by the control device 15 to a high-frequency power amplifier 47, the output of which is connected to the switching device 12. This is also controlled by the control device 15.
- the receiver 6 contains a radio-frequency amplifier 60, which is connected to the switching device 12 and to which the echo signals induced in the radio-frequency coil 11 caused by nuclear magnetic resonance are supplied if the switching device 12 is controlled accordingly.
- the amplifier 60 has a mute input controlled by the control device 15, via which it can be blocked, so that the gain is practically zero.
- the output of amplifier 60 is with the connected to the first inputs of two multiplicative mixer stages 61 and 62, each of which supplies an output signal corresponding to the product of their input signals.
- a signal with the frequency of the oscillator 40 is fed to the second input of the mixer stages 61 and 62, a phase shift of 90 ° between the signals at the two inputs. This phase shift is generated with the aid of a 90 ° phase shifter 48, the output of which is connected to the input of the mixer 62 and the input of which is connected to the input of the mixer 61 and to the output of the oscillator 40.
- the output signals of the mixer stages 61 and 62 are each fed to an analog-to-digital converter 65 and 66 via low-pass filters 63 and 64, which suppress the frequency supplied by the oscillator 40 and all frequencies above and only allow low-frequency components to pass through. This converts the analog signals of the circuit 61... 64 forming a quadrature demodulator into digital data words which are fed to a memory 14.
- the analog-to-digital converters 65 and 66 and the memory 14 receive their clock pulses from a clock pulse generator 16, which can be blocked or released by the control device 15 via a control line, so that only in a measurement interval defined by the control device 15 is that of the High-frequency coil 11 delivered signals transposed in the low-frequency range can be converted into a sequence of digital data words and stored in the memory 14.
- the three coil arrangements 3, 5 and 7 are each supplied with a current by current generators 23, 25 and 27, the timing of which can be controlled by the control unit 15.
- the digital samples stored in the memory 14 are transmitted via an assignment device 19, the function of which will be explained below. fed to a computer 17 which determines the spatial distribution of the nuclear magnetization in the examination area on the basis of the sampled values and outputs the determined distribution to a suitable display unit, for example a monitor 18.
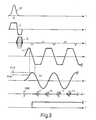
- FIG. 3 shows the temporal course of various signals received or generated with the circuit according to FIG. 2 for a unique sequence.
- a high-frequency pulse is generated, which is shown schematically in the first line of FIG. 3. This is preferably a 90 ° pulse that tilts the nuclear magnetization in the examination area by 90 °.
- the sequence can also include two radio frequency pulses, e.g. a 90 ° pulse and then a 180 ° pulse (spin echo technique).
- the second line shows the time course of the gradient field generated by the coil arrangement 3.
- This gradient field is effective during the high-frequency pulse with a first polarity and then with the opposite polarity.
- the time course is chosen so that the time integral just reaches the value zero via the gradient field Gz from the center of the high-frequency pulse until this gradient field is switched off. Applying this gradient field means that the high-frequency pulse can only excite a certain layer. Since this means that a layer is selected, the term "selection gradient" has become common.
- the time course of this gradient is the same as the time course of the high-frequency pulse for all sequences when examining a slice.
- the third line of FIG. 3 shows the time profile of the magnetic gradient field Gy generated by the coils 5.
- This field is effective following the radio frequency excitation pulse (first line) and its amplitude varies from sequence to sequence; the time interval between two successive sequences is of the order of one second. Because the phase position is influenced with the aid of this magnetic gradient field, this field is also referred to as the "phase coding gradient".
- the fourth line shows the time profile of the magnetic gradient field Gx generated by the coils 7. While this gradient field is present, the signal induced in the coil 11 is converted into digital samples in the high-frequency receiver 6. This gradient field is therefore also called the measurement gradient.
- This gradient field is turned on when the phase encoding gradient Gy is turned off. The polarity is switched periodically from a positive value to a negative value, the number of periods in a sequence being determined by the required spectral resolution; If the sequence contains ten periods, for example, then the nuclear magnetization can be determined within the bandwidth in ten spectral ranges.
- the first positive half-oscillation of the measurement gradient Gx which can also be applied during the phase coding interval, is shorter than the other half-oscillations of the measurement gradient, which are identical to one another. It is designed so that the time integral over this gradient is zero up to the middle of the first negative half-oscillation.
- the periods in which the gradient Gx is constant are typically about 2 ms and the changeover from positive to negative polarity and vice versa likewise takes 2 ms each, so that the period of the temporally trapezoidal oscillation of the measurement gradient is 8 ms. This results in a bandwidth of 125 Hz, within which the spectral distribution can be determined.
- echo signals E1, E2, E3, E4 etc. are generated during each half-oscillation of the magnetic gradient field, the maximum of which in each case lies in the middle of the time intervals in which the gradient is constant in each case.
- the seventh line of FIG. 3 shows the time period during which the amplifier 60 is active and digital samples are generated by the analog-digital converter and are stored in the memory 14. The sampled values that occur during the transition from the negative to the positive maximum value of the gradient are also recorded.
- the time course of the k value in the x direction is shown and there designated kx.
- the k value is the product of the time integral over the magnetic gradient field Gx, multiplied by the so-called gyromagnetic ratio, which is around 42.5 MHz / T for hydrogen protons.
- the k value can also be understood as spatial frequency (cf.Med.Phys. 10 (5), September / October 1983, pages 610 to 621).
- the kx value also has a periodic course with the same period as the magnetic gradient field to which it is assigned, with its extreme values at the zero crossings of the gradient field and its zero crossings in the middle of the time interval, during which the gradient is constant and positive and negative .
- the k value is a function of time linear; during the switching phases, the k value has a non-linear profile, for example a quadratic profile, if the gradient changes linearly over time in the switching phases. If the samples that occur during the switchover phase were not taken into account in the reconstruction of the nuclear magnetization distribution, then the maximum achievable k value k′xm would be reduced to two thirds of the maximum k value kxm that results, even if the samples be used during the switchover phase. This measure improves the spatial resolution (ie the highest spatial frequency) by 50%.
- FIG. 4 shows once again the time profile kx of the k value in the x direction during the first negative half-oscillation of the gradient field Gx and an associated echo signal E1.
- This echo signal then occurs, for example, at the output of the low pass 63.
- a second echo signal occurs at the output of the low pass 64, which is sampled at the same times as E1 and which, together with E1, forms a complex echo signal.
- a k value can be assigned to each sampling instant at which the echo signal E1 (at the output of one of the low-pass filters 63 and 64) is converted into a digital sampling value, so that the sequence of the sampling values in the time domain converts into a sequence of sampling values in the kx range or in the spatial frequency range.
- the sequence of samples in the spatial frequency range has an uneven spacing if they are sampled equidistantly in the time domain, and conversely an equidistant spacing of the support points in the spatial frequency range is associated with a non-equidistant sampling in the time domain.
- the echo signal is the Fourier transform from the spatial domain to the spatial frequency domain corresponds, it is necessary to subject the samples in the spatial frequency range to a Fourier transformation in order to obtain the spatial distribution of the nuclear magnetization in the examination area.
- the echo signal can be sampled (denser in the middle than at the beginning and at the end) in such a way that the samples in the kx range are equidistant, because then a Fourier transformation can be used without further ado.
- the clock pulse generator 16 which controls the memory 14 and the analog-digital converters 65 and 66, has a correspondingly variable clock frequency.
- the number of Samples that fall within the spatial frequency interval assigned to the higher spatial frequencies are greater than 1; for the interval + kN (-kN) there are, for example, four samples. If several samples fall within a spatial frequency interval, a resulting sample value is determined by averaging and assigned to the relevant spatial frequency interval. This improves the signal / noise ratio for this spatial frequency range.
- the sequence F (kx) of sampled values with equidistant reference points in the k-range then arises in FIG. The assignment described takes place with the assignment device 19; if necessary, it can also be carried out by the computer 17.
- the sequence explained with reference to FIG. 4 relates only to the samples of a single echo signal. If the samples of the echo signal E3 and all other echo signals that are assigned to a negative gradient are evaluated in the same way, a two-dimensional array of samples F (kx, t) results, which are a function of the spatial frequency n x direction and the time t are. The time values assigned to the different echoes differ in each case by a period.
- the change in the amplitude of the phase encoding gradient Gy corresponds to a change in the k value in the y direction - hereinafter referred to as ky -, so that ultimately a three-dimensional array of in each case equidistant sample values F (kx, ky, t) results, after which a three-dimensional discrete Fourier transform, the nuclear magnetization distribution f (x, y, v) can be determined as a function of the location x, y and the frequency v.
- the acquisition of the samples and the possible reconstruction of the spatial and spectral distribution of the nuclear magnetization is explained with reference to FIG. 5, in which the acquisition of the samples m kx, ky, t space is shown on the left. Then a kx, t-plane is scanned periodically in each sequence and this is repeated for a different ky in each sequence.
- the nuclear magnetization at the points of a grid with 2N + 1 points in the x-direction, M points in the y-direction and p points in the v-direction can be determined from these z samples by means of the three-dimensional discrete Fourier transformation mentioned.
- images of the spatial distribution of the nuclear magnetization for a specific frequency can be generated, which e.g. corresponds to the Larmor frequency of the hydrogen protons bound to fat or to water, so that separate fat and water images can be obtained.
- a specific frequency e.g. corresponds to the Larmor frequency of the hydrogen protons bound to fat or to water, so that separate fat and water images can be obtained.
- the maxima of the nuclear magnetization are not at the same point in the spectral range. This could be lower with admission procedures spectral resolution, for example the Dixon method, which only resolves two spectral points, lead to errors in the separation of fat and water images.
- this location-dependent shift of the spectrum during the reconstruction can be corrected because the inhomogeneity of the magnetic gradient field of the coil remains the same and can be measured.
- M sequences are required to determine the spectral and spatial distribution of the nuclear magnetization, M being for example 128. If, for example, the time interval between the start of two successive sequences is one second, this means that the required measurement can be carried out in only about two minutes.
- the reconstruction of the nuclear magnetization distribution only requires the conversion of every second echo signal, so that the sampling of the echo signals between them can basically be dispensed with.
- a nuclear magnetization distribution f ′ (x, y, v) results which would correspond to the distribution f (x, y, v) if the echo signals were not disturbed by noise will.
- the signal-to-noise ratio can therefore be improved if the values f (x, y, v) and f ′ (x, y, v) are added to one another.
- the kx value decreasing, the gradient field Gy initially does not change, so that samples are acquired in the upper kx-t plane.
- the ky value is reduced by the amount ky / M, and in the subsequent positive half-oscillation of the gradient field Gx (increasing profile of the kx values), the samples in the adjacent level below are recorded.
- a scanning takes place in the plane above it, etc.
- each sequence comprises only a single radio frequency pulse, however sequences with several radio frequency pulses, e.g. with a 90 ° pulse and a subsequent 180 ° pulse (spin-echo method) or sequences with three successive high-frequency pulses (stimulated echo method).
- the bandwidth which can be resolved spectroscopically in the method according to the invention corresponds to the reciprocal of a period (ie 125 Hz in the example given). If there are substances in the area under investigation that make a significant contribution to the echo signal and whose frequency spacing is greater than the bandwidth, then the spectra of these substances are folded into one another (back-folding). In such cases, spectral separation is no longer possible.
- the frequency distance between two substances is proportional to the strength of the stationary homogeneous magnetic field.
- the bandwidth is quadrupled (to 500 Hz), a four times larger number of spectral values - however also a measuring time four times as long.
Landscapes
- Physics & Mathematics (AREA)
- General Physics & Mathematics (AREA)
- High Energy & Nuclear Physics (AREA)
- Condensed Matter Physics & Semiconductors (AREA)
- Nuclear Medicine, Radiotherapy & Molecular Imaging (AREA)
- Radiology & Medical Imaging (AREA)
- Engineering & Computer Science (AREA)
- Signal Processing (AREA)
- General Health & Medical Sciences (AREA)
- Health & Medical Sciences (AREA)
- Optics & Photonics (AREA)
- Spectroscopy & Molecular Physics (AREA)
- Magnetic Resonance Imaging Apparatus (AREA)
Applications Claiming Priority (2)
| Application Number | Priority Date | Filing Date | Title |
|---|---|---|---|
| DE19863604280 DE3604280A1 (de) | 1986-02-12 | 1986-02-12 | Verfahren zur bestimmung der raeumlichen und der spektralen verteilung der kernmagnetisierung in einem untersuchungsbereich und anordnung zur durchfuehrung des verfahrens |
| DE3604280 | 1986-02-12 |
Publications (2)
| Publication Number | Publication Date |
|---|---|
| EP0232946A2 true EP0232946A2 (fr) | 1987-08-19 |
| EP0232946A3 EP0232946A3 (fr) | 1990-02-07 |
Family
ID=6293878
Family Applications (1)
| Application Number | Title | Priority Date | Filing Date |
|---|---|---|---|
| EP87200188A Withdrawn EP0232946A3 (fr) | 1986-02-12 | 1987-02-09 | Procédé pour déterminer la distribution spatiale et spectrale de la magnétisation nucléaire dans une région d'examen et dispositif pour la mise en oeuvre du procédé |
Country Status (6)
| Country | Link |
|---|---|
| US (1) | US4794337A (fr) |
| EP (1) | EP0232946A3 (fr) |
| JP (1) | JPS62186852A (fr) |
| CA (1) | CA1264180A (fr) |
| DE (1) | DE3604280A1 (fr) |
| IL (1) | IL81501A0 (fr) |
Cited By (2)
| Publication number | Priority date | Publication date | Assignee | Title |
|---|---|---|---|---|
| EP0344518A1 (fr) * | 1988-05-30 | 1989-12-06 | Siemens Aktiengesellschaft | Séquences d'impulsions en tomographie à spin nucléaire pour la production d'images avec différentes valeurs de contraste T2 |
| NL9002405A (nl) * | 1989-11-05 | 1991-06-03 | Elscint Ltd | Verborgen reconstructie. |
Families Citing this family (26)
| Publication number | Priority date | Publication date | Assignee | Title |
|---|---|---|---|---|
| US4940941A (en) * | 1986-12-03 | 1990-07-10 | Advanced Nmr Systems, Inc. | Method of high-speed magnetic resonance imaging |
| EP0325461A3 (fr) * | 1988-01-22 | 1990-08-16 | Kabushiki Kaisha Toshiba | Système d'imagerie par résonance magnétique |
| JP2960419B2 (ja) * | 1988-08-10 | 1999-10-06 | 株式会社日立製作所 | 磁気共鳴イメージング方法 |
| JPH0263434A (ja) * | 1988-08-31 | 1990-03-02 | Toshiba Corp | 磁気共鳴イメージング装置 |
| JP2777155B2 (ja) * | 1988-11-30 | 1998-07-16 | 株式会社東芝 | 磁気共鳴映像装置 |
| DE4003547C2 (de) * | 1989-02-24 | 1999-10-07 | Siemens Ag | Abtastung von Kernresonanzsignalen bei allgemeinen Gradientenformen |
| US4999580A (en) * | 1989-06-20 | 1991-03-12 | The Board Of Trustees Of The Leland Stanford Junior University | magnetic resonance imaging and spectroscopy using a single excitation pulse for simultaneous spatial and spectral selectivity |
| US5201311A (en) * | 1989-08-11 | 1993-04-13 | General Electric Company | Spatially-localized chemical-reaction-rate NMR spectroscopic imaging |
| DE4035410C2 (de) * | 1989-11-20 | 2000-03-16 | Siemens Ag | Pulssequenz nach dem Echoplanarverfahren |
| US5493224A (en) * | 1992-03-03 | 1996-02-20 | Hitachi, Ltd. | Ultra high-speed magnetic resonance imaging method and apparatus |
| EP0576712A1 (fr) * | 1992-07-03 | 1994-01-05 | Siemens Aktiengesellschaft | Séquence d'impulsions d'imagérie rapide pour la tomographie à spin nucléaire |
| US5296808A (en) * | 1992-10-26 | 1994-03-22 | Albert Macovski | MRI imaging system without aliasing |
| JP2737608B2 (ja) * | 1993-07-31 | 1998-04-08 | 株式会社島津製作所 | Mrイメージング装置 |
| US5709208A (en) * | 1994-04-08 | 1998-01-20 | The United States Of America As Represented By The Department Of Health And Human Services | Method and system for multidimensional localization and for rapid magnetic resonance spectroscopic imaging |
| US5657758A (en) * | 1994-04-08 | 1997-08-19 | The United States Of America As Represented By The Secretary, Department Of Health And Human Services | Method and system for multidimensional localization and for rapid magnetic resonance spectroscopic imaging |
| DE19511831A1 (de) * | 1995-03-30 | 1996-10-02 | Siemens Ag | Verfahren und Vorrichtung zur Gewinnung von Bilddaten aus Kernresonanzsignalen, die unter Gradienten mit beliebigem Zeitverlauf gewonnen werden |
| DE19826864A1 (de) * | 1998-06-17 | 1999-12-23 | Philips Patentverwaltung | MR-Verfahren |
| US6297637B1 (en) * | 1998-12-29 | 2001-10-02 | Siemens Aktiengesellschaft | High-frequency receiver, particularly for a nuclear magnetic resonance apparatus |
| US6373249B1 (en) * | 1999-05-21 | 2002-04-16 | University Of Rochester | System and method for three-dimensional interleaved water and fat image acquisition with chemical-shift correction |
| US6259253B1 (en) * | 1999-06-10 | 2001-07-10 | Ohio State University Research Foundation | MRI transceiver |
| DE19957754A1 (de) * | 1999-12-01 | 2001-06-07 | Philips Corp Intellectual Pty | MR-Verfahren zur Erzeugung von Navigatorimpulsen |
| DE19962850B4 (de) * | 1999-12-24 | 2006-12-07 | Forschungszentrum Jülich GmbH | Spektroskopisches Bildgebungsverfahren |
| US6583623B1 (en) | 2000-03-31 | 2003-06-24 | University Of Rochester | Interleaved water and fat dual-echo spin echo magnetic resonance imaging with intrinsic chemical shift elimination |
| US6725718B2 (en) * | 2001-02-08 | 2004-04-27 | Vega Grieshaber Kg | Method and device for the coarse differentiation between a liquid or a bulk material of a filling product present in a receptacle |
| JP4082194B2 (ja) * | 2002-12-03 | 2008-04-30 | セイコーエプソン株式会社 | 画像処理方法および画像処理装置ならびに画像処理プログラム |
| JP5780512B2 (ja) * | 2010-06-07 | 2015-09-16 | 株式会社東芝 | 磁気共鳴イメージング装置 |
Citations (3)
| Publication number | Priority date | Publication date | Assignee | Title |
|---|---|---|---|---|
| EP0127480A2 (fr) * | 1983-05-31 | 1984-12-05 | Albert Macovski | Production d'images en temps réel par résonance magnétique nucléaire |
| EP0165610A2 (fr) * | 1984-06-20 | 1985-12-27 | Hitachi, Ltd. | Procédé pour la formation à grande vitesse d'images à trois dimensions par résonance magnétique nucléaire |
| EP0181015A1 (fr) * | 1984-09-28 | 1986-05-14 | Koninklijke Philips Electronics N.V. | Procédé et dispositif pour déterminer à grande vitesse la distribution de la magnétisation nucléaire dans une région d'un corps |
Family Cites Families (4)
| Publication number | Priority date | Publication date | Assignee | Title |
|---|---|---|---|---|
| GB1596160A (en) * | 1976-12-15 | 1981-08-19 | Nat Res Dev | Nuclear magnetic resonance apparatus and methods |
| NL8203519A (nl) * | 1982-09-10 | 1984-04-02 | Philips Nv | Werkwijze en inrichting voor het bepalen van een kernmagnetisatieverdeling in een deel van een lichaam. |
| US4651096A (en) * | 1985-02-19 | 1987-03-17 | Resonex | Imaging method for nuclear magnetic resonance utilizing balanced gradient fields |
| US4678996A (en) * | 1985-05-07 | 1987-07-07 | Picker International, Inc. | Magnetic resonance imaging method |
-
1986
- 1986-02-12 DE DE19863604280 patent/DE3604280A1/de not_active Withdrawn
-
1987
- 1987-02-04 CA CA000529024A patent/CA1264180A/fr not_active Expired
- 1987-02-09 EP EP87200188A patent/EP0232946A3/fr not_active Withdrawn
- 1987-02-09 IL IL81501A patent/IL81501A0/xx unknown
- 1987-02-09 JP JP62026498A patent/JPS62186852A/ja active Pending
- 1987-02-11 US US07/013,319 patent/US4794337A/en not_active Expired - Fee Related
Patent Citations (3)
| Publication number | Priority date | Publication date | Assignee | Title |
|---|---|---|---|---|
| EP0127480A2 (fr) * | 1983-05-31 | 1984-12-05 | Albert Macovski | Production d'images en temps réel par résonance magnétique nucléaire |
| EP0165610A2 (fr) * | 1984-06-20 | 1985-12-27 | Hitachi, Ltd. | Procédé pour la formation à grande vitesse d'images à trois dimensions par résonance magnétique nucléaire |
| EP0181015A1 (fr) * | 1984-09-28 | 1986-05-14 | Koninklijke Philips Electronics N.V. | Procédé et dispositif pour déterminer à grande vitesse la distribution de la magnétisation nucléaire dans une région d'un corps |
Non-Patent Citations (2)
| Title |
|---|
| JOURNAL OF AMERICAN CHEMICAL SOCIETY, Band 107, 1985, Seiten 2817-2818, American Chemical Society; S. MATSUI et al.: "High-speed spatially resolved high-resolution NMR spectroscopy" * |
| MAGNETIC RESONANCE IN MEDICINE, Band 1, Nr. 3, 1. September 1984, Seiten 370-386, Academic Press. Inc., New York, US; P. MANSFIELD: "Spatial mapping of the chemical shift in NMR" * |
Cited By (3)
| Publication number | Priority date | Publication date | Assignee | Title |
|---|---|---|---|---|
| EP0344518A1 (fr) * | 1988-05-30 | 1989-12-06 | Siemens Aktiengesellschaft | Séquences d'impulsions en tomographie à spin nucléaire pour la production d'images avec différentes valeurs de contraste T2 |
| US4901020A (en) * | 1988-05-30 | 1990-02-13 | Siemens Aktiengesellschaft | Pulse sequence for operating a nuclear magnetic resonance tomography apparatus for producing images with different T2 contrast |
| NL9002405A (nl) * | 1989-11-05 | 1991-06-03 | Elscint Ltd | Verborgen reconstructie. |
Also Published As
| Publication number | Publication date |
|---|---|
| US4794337A (en) | 1988-12-27 |
| CA1264180A (fr) | 1990-01-02 |
| JPS62186852A (ja) | 1987-08-15 |
| IL81501A0 (en) | 1987-09-16 |
| DE3604280A1 (de) | 1987-08-13 |
| EP0232946A3 (fr) | 1990-02-07 |
Similar Documents
| Publication | Publication Date | Title |
|---|---|---|
| EP0232946A2 (fr) | Procédé pour déterminer la distribution spatiale et spectrale de la magnétisation nucléaire dans une région d'examen et dispositif pour la mise en oeuvre du procédé | |
| EP0629876B1 (fr) | Procédé pour la génération d'une séquence d'image RM et dispositif pour la mise en oeuvre du procédé | |
| EP0088970B1 (fr) | Procédé de mesure de la résonance magnétique nucléaire pour la tomographie NMR | |
| EP0642031B1 (fr) | Procédé pour la formation d'images par résonance magnétique et dispositif pour la mise en oeuvre du procédé | |
| DE102010041191B4 (de) | Erstellung von MR-Bilddaten mit paralleler Schichtanregung und teilweiser Überlappung der Schichten im Frequenzbereich | |
| EP0074022A1 (fr) | Dispositif de tomographie à spin nucléaire | |
| DE102013206026B3 (de) | Optimierte Gradientenecho-Multiecho-Messsequenz | |
| EP0226247A2 (fr) | Procédé de tomographie à spin nucléaire et dispositif de mise en oeuvre de ce procédé | |
| DE2110175A1 (de) | Verfahren und Vorrichtung zur automatischen Phasenkontrolle bei einer Fourier-Analyse von abgelesenen Impulsresonanzdaten | |
| EP0378628B1 (fr) | Procede et dispositif de generation d'une sequence de signaux d'echo du spin, et utilisation de ces procede et dispositif en tomographie a spin nucleaire | |
| EP3176596B1 (fr) | Séquence truefisp modifiée pour collecte parallèle de données rm | |
| WO1995027218A1 (fr) | Sequence d'impulsions pour un appareil de remnographie | |
| EP0259935B1 (fr) | Procédé de tomographie en spins nucléaires et tomographe en spins nucléaires pour la mise en oeuvre du procédé | |
| EP0412602B1 (fr) | Procédé de spectroscopie RMN et dispositif pour sa mise en oeuvre | |
| EP0357100A2 (fr) | Procédé tomographique à résonance nucléaire et tomographe à résonance nucléaire pour la mise en oeuvre de ce procédé | |
| EP0427343A2 (fr) | Procédé de tomographie à spin nucléaire pour la production d'images séparées de la graisse et de l'eau et dispositif pour la réalisation du procédé | |
| DE3542215A1 (de) | Kernspintomographieverfahren und anordnung zur durchfuehrung des verfahrens | |
| EP0369538B1 (fr) | Procédé de tomographie par spin nucléaire pour déterminer la magnétisation nucléaire dans un nombre de couches parallèles | |
| DE3938370A1 (de) | Kernspintomographieverfahren und kernspintomograph zur durchfuehrung des verfahrens | |
| DE102012216773B4 (de) | Aufnahme von mindestens zwei Messdatensätzen eines Untersuchungsobjekts mittels einer Magnetresonanzanlage | |
| EP0496447B1 (fr) | Procédé de spectroscopie RMN et dispositif de mise en oeuvre du procédé | |
| EP0478030B1 (fr) | Procédé pour la spectroscopie RMN à deux dimensions | |
| EP1107015A2 (fr) | Procédé de la résonance magnétique pour la génération d'impulsions navigatrices | |
| DE3701849A1 (de) | Verfahren und vorrichtung fuer die kernspintomographie | |
| DE3618432A1 (de) | Kernspintomographieverfahren |
Legal Events
| Date | Code | Title | Description |
|---|---|---|---|
| PUAI | Public reference made under article 153(3) epc to a published international application that has entered the european phase |
Free format text: ORIGINAL CODE: 0009012 |
|
| AK | Designated contracting states |
Kind code of ref document: A2 Designated state(s): DE FR GB NL SE |
|
| RAP1 | Party data changed (applicant data changed or rights of an application transferred) |
Owner name: N.V. PHILIPS' GLOEILAMPENFABRIEKEN Owner name: PHILIPS PATENTVERWALTUNG GMBH |
|
| PUAL | Search report despatched |
Free format text: ORIGINAL CODE: 0009013 |
|
| AK | Designated contracting states |
Kind code of ref document: A3 Designated state(s): DE FR GB NL SE |
|
| STAA | Information on the status of an ep patent application or granted ep patent |
Free format text: STATUS: THE APPLICATION IS DEEMED TO BE WITHDRAWN |
|
| 18D | Application deemed to be withdrawn |
Effective date: 19900903 |
|
| RIN1 | Information on inventor provided before grant (corrected) |
Inventor name: TWIEG, DONALD B. |