CN114008422A - Apparatus, system, and method for non-invasive thermal interrogation - Google Patents
Apparatus, system, and method for non-invasive thermal interrogation Download PDFInfo
- Publication number
- CN114008422A CN114008422A CN202080047820.XA CN202080047820A CN114008422A CN 114008422 A CN114008422 A CN 114008422A CN 202080047820 A CN202080047820 A CN 202080047820A CN 114008422 A CN114008422 A CN 114008422A
- Authority
- CN
- China
- Prior art keywords
- sensor
- heat flux
- temperature
- invasive
- temperature sensor
- Prior art date
- Legal status (The legal status is an assumption and is not a legal conclusion. Google has not performed a legal analysis and makes no representation as to the accuracy of the status listed.)
- Pending
Links
Images


Classifications
-
- G—PHYSICS
- G01—MEASURING; TESTING
- G01K—MEASURING TEMPERATURE; MEASURING QUANTITY OF HEAT; THERMALLY-SENSITIVE ELEMENTS NOT OTHERWISE PROVIDED FOR
- G01K7/00—Measuring temperature based on the use of electric or magnetic elements directly sensitive to heat ; Power supply therefor, e.g. using thermoelectric elements
- G01K7/42—Circuits effecting compensation of thermal inertia; Circuits for predicting the stationary value of a temperature
- G01K7/427—Temperature calculation based on spatial modeling, e.g. spatial inter- or extrapolation
-
- A—HUMAN NECESSITIES
- A61—MEDICAL OR VETERINARY SCIENCE; HYGIENE
- A61B—DIAGNOSIS; SURGERY; IDENTIFICATION
- A61B5/00—Measuring for diagnostic purposes; Identification of persons
- A61B5/01—Measuring temperature of body parts ; Diagnostic temperature sensing, e.g. for malignant or inflamed tissue
- A61B5/015—By temperature mapping of body part
-
- G—PHYSICS
- G01—MEASURING; TESTING
- G01K—MEASURING TEMPERATURE; MEASURING QUANTITY OF HEAT; THERMALLY-SENSITIVE ELEMENTS NOT OTHERWISE PROVIDED FOR
- G01K13/00—Thermometers specially adapted for specific purposes
- G01K13/02—Thermometers specially adapted for specific purposes for measuring temperature of moving fluids or granular materials capable of flow
-
- G—PHYSICS
- G01—MEASURING; TESTING
- G01N—INVESTIGATING OR ANALYSING MATERIALS BY DETERMINING THEIR CHEMICAL OR PHYSICAL PROPERTIES
- G01N25/00—Investigating or analyzing materials by the use of thermal means
- G01N25/18—Investigating or analyzing materials by the use of thermal means by investigating thermal conductivity
-
- A—HUMAN NECESSITIES
- A61—MEDICAL OR VETERINARY SCIENCE; HYGIENE
- A61B—DIAGNOSIS; SURGERY; IDENTIFICATION
- A61B2562/00—Details of sensors; Constructional details of sensor housings or probes; Accessories for sensors
- A61B2562/02—Details of sensors specially adapted for in-vivo measurements
- A61B2562/0271—Thermal or temperature sensors
-
- A—HUMAN NECESSITIES
- A61—MEDICAL OR VETERINARY SCIENCE; HYGIENE
- A61B—DIAGNOSIS; SURGERY; IDENTIFICATION
- A61B2562/00—Details of sensors; Constructional details of sensor housings or probes; Accessories for sensors
- A61B2562/04—Arrangements of multiple sensors of the same type
-
- G—PHYSICS
- G01—MEASURING; TESTING
- G01K—MEASURING TEMPERATURE; MEASURING QUANTITY OF HEAT; THERMALLY-SENSITIVE ELEMENTS NOT OTHERWISE PROVIDED FOR
- G01K2213/00—Temperature mapping
-
- G—PHYSICS
- G01—MEASURING; TESTING
- G01N—INVESTIGATING OR ANALYSING MATERIALS BY DETERMINING THEIR CHEMICAL OR PHYSICAL PROPERTIES
- G01N33/00—Investigating or analysing materials by specific methods not covered by groups G01N1/00 - G01N31/00
- G01N33/48—Biological material, e.g. blood, urine; Haemocytometers
- G01N33/483—Physical analysis of biological material
- G01N33/4833—Physical analysis of biological material of solid biological material, e.g. tissue samples, cell cultures
Abstract
Various non-invasive sensors are adapted to be placed on a surface of an object having a volume with an interior region. The interior region of the object has an interior property indicated by a corresponding interior parameter and an interior temperature distribution that is a function of the interior parameter and the surface thermal signal. Each non-invasive sensor comprises: a heat flux sensor having one or more heat flux sensor output terminals for providing a measured heat transfer signal of the surface of the object; and a temperature sensor having one or more temperature sensor output terminals for providing a measured temperature signal of the surface of the object. A system including one or more sensors performs non-invasive sensing of an object, including accurately and quickly determining an internal temperature distribution of an internal region of the object and one or more other internal properties of the object.
Description
Cross Reference to Related Applications
This application claims priority to U.S. provisional patent application serial No. 62/869208, filed on 1/7/2019, the contents of which are incorporated herein by reference.
Background
Temperature sensors and other thermal sensing systems are important in many different technical fields and applications. Of particular importance are non-invasive temperature sensors and other thermal sensing systems. The technology in this application is directed to non-invasive thermal interrogation devices, systems and methods that provide improved reliability, accuracy, cost, complexity, size, ease of manufacture, ease of use, computation time, required processing power, response time, and applicability across different industries.
Non-invasive thermal interrogation (NITI) provides non-destructive detection and monitoring using thermal sensing. Non-invasive thermal interrogation (NITI) is performed using a simultaneous combination of a surface temperature signal and a surface heat transfer (e.g., heat flux) signal. When measured simultaneously on the surface of an object or system, the surface temperature and surface heat flux signals may be used to non-invasively determine internal parameters (e.g., thermal conductivity, density, heat capacity, convection coefficient, steady state thermal resistance, etc.) and internal temperature distributions (e.g., internal temperature profiles) of the internal region of the object or system. The internal temperature distribution of an object or system is typically a function of internal parameters. Depending on the subject or system in which the NITI and/or the NITI application is being performed, the internal parameters may differ. The internal parameters and internal temperature distributions are defined as internal properties of the object or system.
Since the NITI allows for non-destructive testing and monitoring of a subject or system whenever a thermal signal NITI is present, the NITI may be used in many diverse applications. In the absence of a sufficient thermal signal, a thermal signal may be generated at the object or system surface.
Disclosure of Invention
At least some examples provide a system for non-invasive sensing of an object having a volume with a surface and an interior region. The system includes a non-invasive sensor comprising: a heat flux sensor having one or more heat flux sensor output terminals and a temperature sensor having one or more temperature sensor output terminals. The non-invasive sensor may be placed on or near the surface of the object. The interior region of the object has an interior property indicated by a corresponding interior parameter and an interior temperature distribution. A control circuit coupled to the one or more heat flux sensor output terminals and the one or more temperature sensor output terminals is adapted to: receiving a measured temperature signal from a temperature sensor at one or more specified times; receiving a measured heat flux signal from a heat flux sensor at one or more specified times; determining a measure of heat transfer at the surface out of or into the object based on the measured heat flux signals at one or more specified times; determining a value for each internal parameter at one or more specified times; determining an internal temperature distribution of the internal region of the subject at one or more specified times based on the measured temperature signal, the measured heat flux signal, and the internal parameter value; and generating information indicative of an internal temperature distribution of the internal region of the object at the one or more specified times.
At least some examples provide a system for non-invasive sensing of an object having a volume with a surface and an interior region. The system includes a non-invasive sensor comprising: a heat flux sensor having one or more heat flux sensor output terminals and a temperature sensor having one or more temperature sensor output terminals. The non-invasive sensor is adapted to be placed on or near a surface of the object, and an interior region of the object has an interior property indicated by a corresponding interior parameter and an interior temperature distribution. A control circuit coupled to the one or more heat flux sensor output terminals and the one or more temperature sensor output terminals is adapted to: receiving a measured temperature signal from a temperature sensor at one or more specified times; receiving a measured heat flux signal from a heat flux sensor at one or more specified times; determining an estimate of one or more internal parameters at one or more specified times based on the measured temperature signal and the measured heat flux signal; and generating information indicative of the one or more estimated values determined for the internal parameters at the one or more specified times.
At least some examples provide a system for non-invasive sensing of an object having a volume with a surface and an interior region. The system includes a first non-invasive heat flux sensor-temperature sensor pair and a second non-invasive heat flux sensor-temperature sensor pair. Each of the first and second non-invasive heat flux sensor-temperature sensor pairs includes a heat flux sensor having one or more heat flux sensor output terminals and a temperature sensor having one or more temperature sensor output terminals. The first and second non-invasive heat flux sensor-temperature sensor pairs may be placed at different locations on or near the surface of the object. The interior region of the object has an interior property indicated by a corresponding interior parameter and an interior temperature distribution. Control circuitry coupled to the one or more heat flux sensor output terminals and the one or more temperature sensor output terminals of each of the first and second non-invasive heat flux sensor-temperature sensor pairs is configured to: receiving a first measured temperature signal from a temperature sensor of a first non-invasive heat flux sensor-temperature sensor pair at one or more specified times; receiving a first measured heat flux signal from a heat flux sensor of a first non-invasive heat flux sensor-temperature sensor pair at one or more specified times; receiving a second measured heat flux signal from a heat flux sensor of a second non-invasive heat flux sensor-temperature sensor pair at one or more specified times; determining a value for each internal parameter at one or more specified times; determining an internal temperature profile at one or more specified times based on the measured temperature signals from the temperature sensors of the first and second non-invasive heat flux sensor-temperature sensor pairs at one or more specified times, the measured heat flux signals from the heat flux sensors of the first and second non-invasive heat flux sensor-temperature sensor pairs at one or more specified times, and the internal parameter values at one or more specified times; and generating information indicative of the internal temperature distribution at one or more specified times.
At least some examples provide a system for non-invasive sensing of an object having a volume with a surface and an interior region, including a first non-invasive heat flux sensor-temperature sensor pair and a second non-invasive heat flux sensor-temperature sensor pair. Each of the first and second non-invasive heat flux sensor-temperature sensor pairs includes a heat flux sensor having one or more heat flux sensor output terminals and a temperature sensor having one or more temperature sensor output terminals. The first and second non-invasive heat flux sensor-temperature sensor pairs may be placed at different locations on or near the surface of the object. The interior region of the object has an interior property indicated by a corresponding interior parameter and an interior temperature distribution. Control circuitry coupled to the one or more heat flux sensor output terminals and the one or more temperature sensor output terminals of each of the first and second non-invasive heat flux sensor-temperature sensor pairs is configured to: receiving a first measured temperature signal from a temperature sensor of a first non-invasive heat flux sensor-temperature sensor pair at one or more specified times; receiving a first measured heat flux signal from a heat flux sensor of a first non-invasive heat flux sensor-temperature sensor pair at one or more specified times; receiving a second measured temperature signal from a temperature sensor of a second non-invasive heat flux sensor-temperature sensor pair at one or more specified times; receiving a second measured heat flux signal from a heat flux sensor of a second non-invasive heat flux sensor-temperature sensor pair at one or more specified times; determining an initial value for each internal parameter at one or more specified times; determining one or more internal parameters of the subject at one or more specified times based on the measured temperature signals from the temperature sensors of the first and second non-invasive heat flux sensor-temperature sensor pairs at one or more specified times and the measured heat flux signals from the heat flux sensors of the first and second non-invasive heat flux sensor-temperature sensor pairs at one or more specified times, and the internal parameter values at one or more specified times; and generating information indicative of one or more internal parameters of the object at one or more specified times.
At least some examples provide a non-invasive sensor that can be placed on or near a surface of an object having a volume with an interior region, wherein the interior region of the object has an internal property indicated by a corresponding internal parameter and an internal temperature distribution. The non-invasive sensor includes a non-invasive heat flux sensor-temperature sensor pair including a heat flux sensor having one or more heat flux sensor output terminals to provide a measured heat flux signal of the surface of the object and a temperature sensor having one or more temperature sensor output terminals to provide a measured temperature signal of the surface of the object. The heat flux sensor and the temperature sensor are configured to be subjected to the same thermal conditions.
At least some examples provide a non-invasive sensor that can be placed on or near a surface of an object having a volume with a surface and an interior region. The non-invasive sensor includes a first non-invasive heat flux sensor-temperature sensor pair and a second non-invasive heat flux sensor-temperature sensor pair. Each of the first and second non-invasive heat flux sensor-temperature sensor pairs includes a heat flux sensor having one or more heat flux sensor output terminals and a temperature sensor having one or more temperature sensor output terminals. The first and second non-invasive heat flux sensor-temperature sensor pairs are adapted to be placed at different locations on or near a surface of an object, wherein an interior region of the object has an interior property indicated by a respective interior parameter and interior temperature distribution.
Further aspects, features and advantages of the technology presented in this application will become apparent from the following description of examples, which are to be read in connection with the accompanying drawings.
Drawings
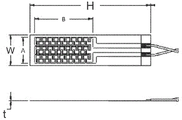
Fig. 1 shows an example heat flux sensor having a thickness t, a width W, and a length H in accordance with an example heat flux sensor embodiment.
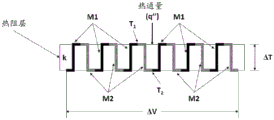
Fig. 2A shows a cross-section of a differential thermopile including a thermal resistance layer according to an example embodiment.
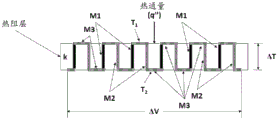
Fig. 2B shows a cross section of a differential thermopile according to an example embodiment, which comprises a thermal resistance layer and which may be easier to manufacture.
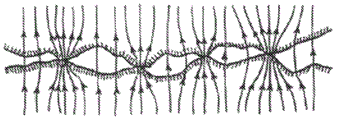
FIG. 3 shows an example where the cross-over head applies heat flux and the heat flux is generally confined to conduction through the contact points.
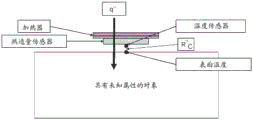
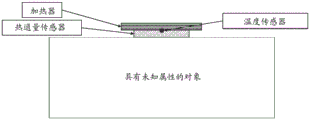
Fig. 4 shows a cross-section of an example CHFT + embodiment that includes a heat flux sensor and a temperature sensor placed on a surface of an object with unknown internal properties, with a heater (external heat device) placed on the heat flux sensor.
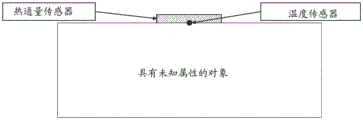
Fig. 5 shows a cross-section of an example CHFT-embodiment that includes a heat flux sensor and a temperature sensor placed on a surface of an object with unknown internal properties.
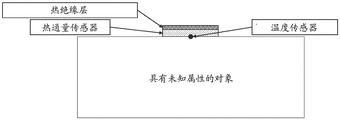
Fig. 6A shows a cross-section of an example CHFT-embodiment that includes a heat flux sensor, a temperature sensor, and a block of insulation over the heat flux sensor and the temperature sensor (i.e., heat flux sensor-temperature sensor pair).
Fig. 6B shows a cross-section of an example CHFT-embodiment that includes a heat flux sensor, a temperature sensor, and a piece of insulation over the heat flux sensor and the temperature sensor (i.e., heat flux sensor-temperature sensor pair) and a portion of the surrounding subject area.
Fig. 6C shows a cross-section of an example CHFT-embodiment that includes a heat flux sensor, a temperature sensor, and a block of insulation on and around the heat flux sensor and the temperature sensor (i.e., heat flux sensor-temperature sensor pair).
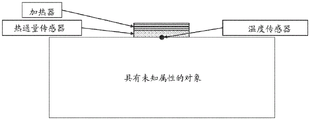
Fig. 7A shows a cross section of an example CHFT + embodiment including a heat flux sensor, a temperature sensor, and an external thermal device (e.g., a heater).
Fig. 7B illustrates a cross-section of an example CHFT + embodiment that includes a heat flux sensor, a temperature sensor, and an external thermal device (e.g., a heater) that provides a thermal event to the heat flux sensor-temperature sensor pair.
Fig. 7C shows an example CHFT + embodiment that includes a temperature sensor, a heat flux sensor, a heater, and corresponding output terminals.
Fig. 7D shows a cross-section of an example CHFT + embodiment that includes a heat flux sensor, a temperature sensor, and an external thermal device (e.g., a heater), where the temperature sensor is located between the heat flux sensor and the external thermal device.
Fig. 7E shows a cross-section of an example CHFT + embodiment that includes a heat flux sensor, a temperature sensor, and an external thermal device (e.g., a heater), where the temperature sensor is located within the heat flux sensor.
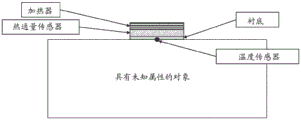
Fig. 7F shows a cross-section of an example CHFT + embodiment that includes a heat flux sensor, a temperature sensor, and an external thermal device (e.g., a heater), where the heat flux sensor and the temperature sensor are separated by a substrate.
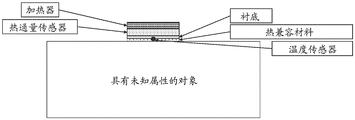
Fig. 7G illustrates a cross-section of an example CHFT + embodiment that includes a heat flux sensor, a temperature sensor, and an external thermal device (e.g., a heater), where the heat flux sensor and the temperature sensor are separated by a substrate, and the temperature sensor is surrounded by a thermally compatible material.
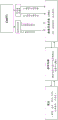
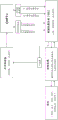
FIG. 8 is a functional block diagram illustrating an example NITI system that performs NITI with CHFT-s.
FIG. 9 is a functional block diagram illustrating an example NITI system that performs NITI with CHFT +.
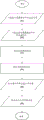
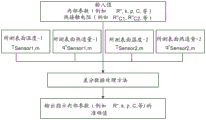
FIG. 10 is a flowchart outlining a non-limiting example process performed by control circuitry in an example NITI system including NITI sensors for determining one or more internal properties of a subject including determining an internal temperature distribution of the subject at one or more specified times using the measured heat flux, the measured temperature and the determined values of the internal parameters of the subject.
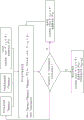
FIG. 11 is a flow chart illustrating an example process for a parameter estimation scheme performed by control circuitry in a NITI system.
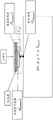
FIG. 12 shows a cross section of an example DUO (parallel sensor pair) CHFT + (with heater) embodiment placed on the surface of an object with unknown internal properties.
FIG. 13 shows a cross-section of an example DUO (parallel sensor pair) CHFT-embodiment with different amounts of thermal insulation on each sensor node.
FIG. 14 shows a cross-section of an example DUO (parallel sensor pair) CHFT-embodiment, where one CHFT-node incorporates thermal insulation and the other CHFT-node is exposed.
FIG. 15 shows a cross section of an example DUO (parallel sensor nodes) CHFT +/-sensing embodiment, with one sensor node incorporating CHFT + and one sensor node incorporating CHFT-.
FIG. 16 shows a cross-section of an example DUO (parallel sensor pair) CHFT-embodiment, where neither sensor node is thermally isolated.
FIG. 17 is a functional block diagram illustrating an example NITI system that performs NITI with two non-invasive heat flux sensor-temperature sensor pairs operating in parallel to determine one or more internal properties of a subject.
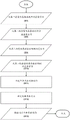
Fig. 18A is a flowchart illustrating an example procedure related to the differential-based data processing method performed by the control circuit.
Fig. 18B is a flow chart illustrating an example process associated with a differential-based data processing method that the control circuit performs under steady-state conditions.
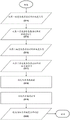
Fig. 19A is a flow chart illustrating an example process associated with a quotient-based data processing method performed by the control circuit.
FIG. 19B is a flow chart illustrating an example process associated with a quotient-based data processing method performed by the control circuit under steady state conditions.
FIG. 20 is a flowchart outlining a non-limiting example process of an example DUO NITI embodiment that uses two non-invasive heat flux sensor-temperature sensor pairs to determine one or more internal parameters of a subject.
FIG. 21 is a flowchart outlining a non-limiting example process of an example DUO NITI embodiment that uses two non-invasive heat flux sensor-temperature sensor pairs to determine the internal temperature distribution of a subject.
Fig. 22 shows an example application of blood perfusion (flow) in tissue.
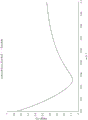
FIG. 23 is a graph illustrating the determination of optimal perfusion when a parameter estimation scheme is used with experimental data (w) A graph of the ability of the values.
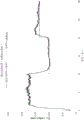
FIG. 24 is a graph illustrating an example of a match between a calculated (output) sensor temperature curve and a measured (input) sensor temperature for an example CHFT + blood perfusion embodiment.
FIG. 25 is a graph illustrating an example of mismatch between a calculated (output) sensor temperature curve and a measured (input) sensor temperature for an example CHFT + blood perfusion embodiment.
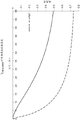
FIG. 26 is a graph illustrating different sensitivities of a calculated (output) sensor temperature profile to internal parameters over time in an example blood perfusion application.
FIG. 27 is a graph showing the results of an example DUO CHFT + embodiment and an example periodic CHFT + embodiment when used to measure perfusion rate for perfusing pseudo-tissue.
FIG. 28 is a graph showing results of an example CHFT + embodiment (active thermometry) when used to measure core temperature of perfused pseudo-tissue.
FIG. 29 is a graph showing the results of an example CHFT-embodiment (passive thermometry) when used to measure the core temperature of perfused pseudo-tissue.
FIG. 30 is a graph showing results of an exemplary CHFT + ZHF embodiment (zero heat flux thermometry) when used to measure core temperature of perfused pseudo-tissue.
Fig. 31 illustrates another application of the technique for determining one or more parameters related to fluid flow in a pipe or other conduit.
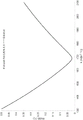
FIG. 32 is a graph illustrating an exemplary correlation developed with experimental measurements of fluid flow in copper tubing.
FIG. 33 is a graph illustrating the ability of a parameter estimation scheme to determine optimal convection coefficient (h) values when used with experimental data.
FIG. 34 is a graph illustrating an example of a match between a calculated (output) sensor temperature profile and a measured (input) sensor temperature for an example CHFT + fluid flow in a copper tubing embodiment.
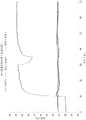
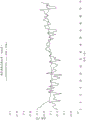
FIG. 35 is a graph showing the results of an example CHFT + embodiment (active thermometry) for measuring the internal temperature of a fluid flow within a copper tube.
FIG. 36 is a graph showing the results of an example DUO CHFT +/-embodiment (one sensor node with a heater and one sensor node without a heater) for measuring the internal temperature of the fluid flow within the copper tube.
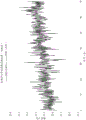
FIG. 37 is a graph showing the results of an example DUO CHFT +/-embodiment (one sensor node with a heater and one sensor node without a heater) for measuring the internal temperature of the fluid flow within the CPVC pipe.
Detailed Description
Some specific examples will be discussed below. It will be appreciated that the invention is not limited to these specific examples.
The following description sets forth example embodiments for the purpose of explanation rather than limitation. However, it will be apparent to one skilled in the art that other example embodiments may be employed other than the specific details. In some instances, detailed descriptions of well-known methods, interfaces, circuits, and devices are omitted so as not to obscure the description with unnecessary detail. Individual blocks are shown in some of the figures. Those skilled in the art will appreciate that the functions of those blocks may be implemented using individual hardware circuits, using software programs and data in conjunction with a suitably programmed digital microprocessor or general purpose computer, and/or using Application Specific Integrated Circuitry (ASIC), and/or using one or more Digital Signal Processors (DSPs). The software program instructions and/or data may be stored on a non-transitory computer-readable storage medium, one or more clouds, one or more servers, and when the instructions are executed by a computer or other suitable processor control, the computer or processor performs the functions associated with those instructions.
The term signal is used herein to encompass any signal that transfers energy and/or information in the form of an electrical, electronic, electromagnetic, magnetic, or mechanical (e.g., ultrasonic signal) from one location or region to another. Signals may be conducted from one location or region to another by electrical or magnetic conductors, but the term signal also includes signals in the form of light and other electromagnetic forms, as well as other signals that are transmitted through non-conductive regions due to electrical, electronic, electromagnetic, magnetic, or elastic effects. The signal includes both analog and digital signals. The analog electrical signal includes information in the form of a continuously variable physical quantity, such as a voltage. The digital electrical signal comprises information in the form of discrete values of a physical property, which may also be, for example, a voltage.
A component, layer, or other structure is thermally or thermally conductive if it sufficiently conducts thermal energy (e.g., thermal energy transferred by conduction, radiation, and/or convection) from one location or region to another location or region where operation may be affected by the thermal energy. The term sensing means acquiring information from a physical stimulus and thus sensing includes actions such as detecting, measuring, etc. Thermal sensing is the sensing of thermal stimuli such as heat, temperature, or random kinetic energy of molecules, atoms, or smaller species components. A thermal sensor is an electronic device that performs thermal sensing and generates a signal related to thermal energy. If the thermal energy includes information, a thermal sensor or combination of thermal sensors that detect the thermal energy may be able to sense the information. Depending on the context, the different forms and/or types of thermal energy and associated thermal signals used in the present application may be considered as heat transfer, heat transfer signals, temperature, and temperature signals.
Unless the context indicates otherwise, the terms circuit and circuit refer to a structure in which one or more electronic components have sufficient electrical connections to operate together or in a related manner. In some instances, a circuit item may include more than one loop. An item of circuitry comprising a processor may sometimes be divided into hardware and software components; in this context, software refers to stored data that controls the operation of, or is accessed by, a processor when operating, and hardware refers to components that store, transfer, and manipulate data. The circuit may be described based on its operation or other characteristics. For example, a circuit that performs a control operation is sometimes referred to as a control circuit, and a circuit that performs a processing operation is sometimes referred to as a processing circuit.
In general, sensors, processors, and other such items may be included in a system that operates automatically or partially automatically. The term system refers to a combination of two or more parts or components that together may perform an operation. A system may be characterized by its operation.
An integrated structure is a structure with electrical components and connections that results from a micromachining or similar process. For example, the integrated structure may be located on or above the substrate or another suitable support structure from which it was created. Other components may be located on the same support structure with integrated structures, such as discrete components produced by other types of processes.
Heat-based sensing and monitoring is typically performed with only temperature sensors and/or temperature signals. For example, to determine the internal temperature of an object or system, an invasive temperature probe is inserted at a prescribed depth of interest. Examples internal flow temperature within a pipe or conduit is measured using an invasive temperature probe inserted into a thermowell. Thermowell placement often requires complex procedures in which the surface of a pipe or conduit is drilled and/or otherwise penetrated in order to place the thermowell in the internal fluid flow. A temperature sensor (e.g., a thermocouple, a Resistance Temperature Device (RTD), a thermistor, a thermometer, etc.) is then inserted into the thermowell, where it is protected from the fluid flow. The response time of the temperature sensor inside the thermowell becomes slow due to the thermal capacity of the thermowell. In addition, the accuracy of the temperature sensor may be negatively affected because the thermocouple well wall may conduct heat away from (or into) the pipe or conduit. Generally, this method of measuring the temperature of a fluid stream is more accurate than measuring the surface temperature measurement of a pipe or conduit, for example. However, due to the invasive nature of such techniques, several design considerations are typically made before they are used. For many applications, these design considerations can be complex and expensive. For example, the material and/or design characteristics of the thermowell may vary based on the application and need to comply with a wide range of standards (e.g., the American Society for Testing and Materials (ASTM) standard). Furthermore, the invasive nature of thermowells results in complex long-term maintenance, for example, due to corrosion and/or prolonged exposure to energetic fluid streams that can cause structural stresses and vibrations.
Another example of heat-based sensing that invasive probes use for temperature measurement inside the subject and/or system is core body temperature measurement. For example, in healthcare, the methods currently used and accepted as accurate methods of real-time core body temperature measurement are, for example, based on temperature measurements of the esophagus, rectum, and pulmonary arteries. All of these methods use invasive and often uncomfortable probes that are placed at different locations within the body. Due to their invasive nature, such methods may lead to infection and/or other complications. The invasive nature of this method also limits the range of when and where measurements can be made. For example, invasive probes are rarely used unless the patient has been subjected to anesthesia or other similar procedures. Invasive probes are also not suitable for wearable technologies or devices.
In view of the limitations of invasive internal temperature measurement techniques, an alternative approach may be to take internal temperature measurements of the object or system based on surface and/or other external temperature readings (e.g., ambient temperature). However, such methods often result in inaccurate measurements and may require complex hardware and software systems in order to determine internal temperature measurements based on such non-invasive temperature measurements. In some embodiments, multiple temperature sensors may be used on or near the surface of the object or system, and/or within a device placed on or near the surface of the object or system. In addition, one or more thermal calibration components (e.g., insulation, precision temperature sensors, etc.) may be required. This further leads to complicated and/or complex measurement systems. Other embodiments may include one or more control systems, one or more heaters, one or more coolers, and/or multiple temperature sensors. For example, these embodiments may be designed to create and determine a zero heat flux environment for internal temperature measurements. Such non-invasive methods are often slow and inaccurate, especially under varying or extreme thermal conditions. Furthermore, in some cases, the placement of sensors and/or devices may be limited to a particular area on the surface of the object or system for accurate internal temperature measurements. For example, with respect to core body temperature measurements, placement of sensors and/or devices may be limited to certain auxiliary locations on the body (e.g., axilla or forehead). Furthermore, embodiments may be associated with a large form factor due to hardware complexity, causing inconvenience for many applications. For example, with respect to core body temperature measurements, a large form factor is impractical for wearable applications. With respect to non-invasive internal pipe or conduit temperature measurements, a large form factor may prevent the sensor and/or device from being installed in certain locations, such as between the pipe surface and the surrounding thermal insulation. Finally, the complexity of such systems may lead to manufacturing difficulties and increased manufacturing costs.
Other heat-based sensing applications may use temperature-based signals to determine internal fluid flow through hot air velocity measurements. This method requires internal probing in order to measure the fluid flow corresponding to the measured temperature signal by means of an established correlation. In contrast, a heat dispersion flow meter is a non-invasive system that uses temperature sensors on the pipe or conduit surfaces between which heaters provide thermal energy to the pipe/conduit surfaces. The temperature difference between temperature sensors placed before and after the heating element is related to the internal fluid flow rate. However, thermal dispersion flow meters do not function properly where the conduits are made of thermally insulating materials. Furthermore, they are prone to inaccuracies when used under different conditions, because the specific amount of thermal energy (i.e., heat transfer) entering the pipe or conduit through the heater is unknown and can only be estimated using basic assumptions. Accordingly, thermal dispersion flow meters are typically calibrated for specific conditions and use cases.
Other heat-based techniques may be used to predict (e.g., analytically determine) surface heat transfer (e.g., heat flux) of an object or system using surface and/or internal temperature measurements. Such techniques may further be used to determine internal properties of an object or system based on predicted surface heat transfer (e.g., heat flux) and surface or internal temperature signals. However, these techniques may have several limitations, such as poor accuracy, low resolution, long processing time, and noise amplification, due to the mathematical integration required in determining heat transfer (e.g., heat flux) from the measured temperature signal.
For example, the determined surface heat transfer (e.g., heat flux) of the object or system may be compared to a measured surface heat transfer (e.g., by a heat flux sensor) to determine internal properties of the object or system. Also, due to limitations of heat transfer (e.g., heat flux) predictions based on temperature measurements, values of object or system internal properties determined by such techniques may be inaccurate and impractical for applications. Furthermore, when such techniques are used, there may be a mismatch between the measured temperature from which the surface heat transfer is determined (e.g., surface temperature) and the measured heat transfer of the object or system (e.g., surface heat flux). For example, a mismatch may occur when the heat transfer (e.g., heat flux) measured at the object or system surface (e.g., by a heat flux sensor) is different than the heat transfer (e.g., heat flux) occurring at the surface temperature sensor location. This may be caused, for example, by a surface temperature sensor located near the heat flux sensor that is not subjected to the same thermal (e.g., heat transfer and/or temperature) conditions as the heat flux sensor is subjected to. In other examples, the temperature sensor may be located on or near the heat flux sensor, but outside the heat flux sensor sensing area, which may also lead to measurement mismatch. Similar problems may arise when using a temperature sensor, e.g. located on or near the heat flux sensor sensing area, but insufficient contact between the heat flux sensor and the object/system surface due to e.g. its design (e.g. thickness) and/or material. In this example, the mismatch occurs because the measured temperature is not an accurate representation of the surface temperature, and/or the measured heat transfer is not a real-world situation that is occurring at the object/system surface and/or experienced by the temperature sensor. In other examples, the materials used to construct the heat flux sensor and the temperature sensor and/or their surroundings may be completely different (e.g., different thermal resistance values) and result in a non-uniform response to uniform thermal conditions. This may also lead to a mismatch between the heat flux sensor and the temperature sensor output.
In another example, a thin-film thermocouple, as an example thin temperature sensor, may be located on a heat flux sensor sensing area where sufficient contact is established between the heat flux sensor and the object/system surface. In this case, although the thin film thermocouple temperature sensor does not produce any of the above-described example problems (e.g., insufficient contact due to thickness), and is subject to the same thermal (e.g., heat transfer and/or temperature) conditions as the heat flux sensor, it may experience thermal shunting, wherein the measured temperature is inaccurate due to thermal energy being conducted to or from the thermocouple junction through the thermocouple material and/or output terminals (e.g., thermocouple leads). In this case, the measured temperature may be lower or higher than the actual temperature experienced at or near the heat flux sensor sensing area. All of these non-limiting and example conditions are potential issues for accurately determining internal properties of an object or system when using thermal-based sensing techniques.
One problem with using heat transfer (e.g., heat flux) measurements in heat-based sensing techniques is inefficiency. Heat transfer is generally understood and interpreted as a result of a temperature gradient. Such conventional methods may result in inefficiencies and inaccuracies in heat transfer (e.g., heat flux) measurement techniques, as well as general confusion between heat transfer (e.g., heat flux) and temperature differences. For example, one way to measure heat transfer may use one or more temperature sensors, such as thermocouples, RTDs, negative or positive temperature coefficient (NTC) sensors, thermistors, etc., on either side of some insulating material (i.e., a thermal resistance layer) to create a layered thermal flux meter, a one-dimensional planar (i.e., flat) gauge. In this example method, measured values (e.g., average values) of absolute temperature on either side of the insulating material are measured, and the difference between them is used to determine the amount of heat transfer occurring through the insulating material with a calibrated or otherwise determined thermal resistance value. In another example method, thermocouples may be placed on either side (e.g., top and bottom) of a calibration insulating material (i.e., a thermal resistance layer) forming thermocouple pairs. The arrangement of the thermocouple pairs may be such that when connected in series, the output of the thermocouple pairs is a differential voltage indicative (e.g. proportional) of the temperature difference across the thermal resistance layer and the heat transfer (e.g. heat flux) occurring through the thermal resistance layer. These example methods may result in slow, inaccurate, high cost, and large heat flux devices (i.e., heat flux channels) that may require multiple calibrations and may be difficult to manufacture.
Another disadvantage of thermal-based sensing techniques is the inability to determine or otherwise account for thermal contact resistance. This can result in erroneous surface temperature measurements, which can affect the accuracy of the heat-based sensing and monitoring. However, modeling and/or determining thermal contact resistance may be difficult and unclear when performing thermal-based sensing. This is due in part to the complexity and inaccuracies associated with determining thermal contact resistance using temperature signals only and/or methods that predict heat transfer based on temperature signals.
The techniques described in this application address these technical problems and provide the following example technical benefits. Most importantly, the techniques described herein provide for the measurement of heat transfer (e.g., heat flux) into or out of the object and/or system surface in addition to the measurement of surface temperature as part of a heat-based sensing and/or monitoring routine (i.e., technique). This heat transfer (e.g., heat flux) measurement is used as a direct input and/or boundary condition in one or more thermal mathematical models, which may vary from application to application. Measurement of heat transfer (e.g., heat flux) as an input and/or direct boundary condition allows for accurate and robust thermal sensing and monitoring (i.e., interrogation) techniques.
The technique is through one or moreA plurality of heat flux sensors perform heat transfer (e.g., heat flux) measurements. For the purposes of this application, the term heat flux sensor refers to a sensor designed to measure heat transfer (e.g., heat flux) using a differential voltage output signal that is a result of the heat transfer (i.e., thermal energy) flowing through the sensor. One non-limiting example of a heat transfer measurement is heat flux, which is defined as the amount of heat energy entering or leaving a surface per unit area per unit time and may be in W/m2Measured in SI units. Heat flux sensors typically have a calibration constant (i.e., sensitivity value) that directly relates the heat flux sensor differential voltage output signal to the heat transfer (e.g., heat flux) occurring therethrough. The calibration constants may vary with sensor operating temperature, the effect of which may be accounted for by a determined calibration curve that specifies the calibration constant based on the sensor operating temperature. For the purposes of this application, it is important to note the distinction between heat flux sensors and heat flux devices, heat flux channels, and the like. Heat flux sensors are typically thin and have fast response times due to their design. This provides example benefits, including increased accuracy, smaller form factor, and robust measurement capabilities that other heat transfer measurement techniques cannot achieve.
Furthermore, the techniques described herein ensure that there is no mismatch between the measured temperature (e.g., surface temperature) and the measured heat transfer (e.g., surface heat flux) of the object or system (i.e., the heat flux sensor and the temperature sensor are subjected to the same thermal conditions) whether or not the temperature sensor is close to the heat flux sensor (e.g., beside, on, near, etc. the heat flux sensor sensing area). For example, where possible, the temperature sensor may be located on or near the heat flux sensor sensing area while maintaining sufficient contact between the heat flux sensor and the object/system surface, and where applicable, designed for possible effects related to thermal shunting and/or thermal homogeneity of the materials used for construction. In other example embodiments, the temperature sensor may be located on or near (e.g., adjacent to) the heat flux sensor and/or the heat flux sensor sensing area and may be surrounded by and/or in contact with a material that ensures the same thermal (e.g., heat transfer and/or temperature) conditions between the heat flux sensor and the temperature sensor.
Another major benefit of the technology in this application is the ability to easily and quickly determine the thermal contact resistance between the temperature sensor and the object or system surface. This improves the accuracy and effectiveness of thermal sensing and monitoring, especially in example applications where the effect of thermal contact resistance is not negligible and/or predictable.
Another major benefit of the technology in this application is non-invasiveness and simplicity of use. For example, extensive design considerations or precautions are not required for invasive techniques. Furthermore, the technique is not limited to applications in which invasiveness is permissible.
Further benefits of the techniques herein include a minimum processing time required and reduced processing power. This benefit is due in part to the use of heat flux boundary conditions and the incorporation of a fast and precise method of determining thermal contact resistance. Another benefit is reduced calibration requirements for sensors designed for heat transfer (e.g., heat flux) measurements. For example, the techniques in the present application typically require only one calibration constant (i.e., sensitivity value) for heat transfer measurements by the heat flux sensor.
The techniques in the present application are based on the use of both heat flux and temperature sensors to determine one or more internal properties of an object and/or system in a non-invasive manner. The object and/or system is not limited to a solid object, but also includes, for example, fluids (e.g., water, air, etc.) or other materials, such as metallurgical powders, epoxies, carbon fiber composites, etc. For simplicity, the term object as used in this application includes a system. For example, a pipe having a fluid flowing therein is an object. The term non-invasive thermal interrogation (NITI) is used herein to refer to sensor technologies based on the simultaneous combination of surface heat flux and surface temperature measurements. When placed on an object, the NITI sensor measures one or more simultaneous combinations of surface heat transfer (e.g., heat flux) and surface temperature signals, which are converted to digital form and processed to determine one or more internal properties of the object. For a given measurement, the term simultaneous combination as used in this application refers to one or more of surface heat transfer (e.g., heat flux) and surface temperature signals measured over a range of time (i.e., over a specified amount of time). The time range may include a single time (i.e., a specified time). For simplicity, the term designated time as used in this application is defined to include a range of times (i.e., within a designated amount of time) as well as a single time.
Non-limiting example applications of the NITI technique include, but are not limited to: measurement of temperature distribution within a subject (e.g., mammal, non-mammal, meat, pipe/conduit, power transformer, wood/lumber, wall, machine, battery, etc.), measurement of internal parameters of a subject (e.g., mammal, non-mammal, meat, pipe/conduit, power transformer, wood/lumber, wall, machine, battery, etc.), measurement of tissue blood perfusion (flow), tissue ulcer prevention and/or monitoring, bleeding detection and/or monitoring, concussion detection and/or monitoring, tissue hydration measurement, metabolic heat production measurement, athlete performance monitoring, caloric expenditure measurement, sleep monitoring, circadian rhythm monitoring, mammalian ovulation prediction and/or detection, sunstroke monitoring and/or prevention, sickle cell anemia detection and/or monitoring, metabolic stress, stress, Cardiovascular health, flap and/or graft monitoring, disease/illness prediction, monitoring and/or detection (e.g., alzheimer's disease, parkinson's disease, cancer, etc.), flow rate measurement in a pipe and/or duct, energy measurement in a pipe and/or duct, pipe/duct freeze protection, pipe/duct thawing, HVAC frost/defrost detection, HVAC system monitoring, HVAC refrigerant level monitoring, leak detection (e.g., pipe/duct water leak, HVAC refrigerant leak, etc.), water heater monitoring, heat exchanger monitoring, corrosion detection and/or measurement (e.g., pipe/duct corrosion, etc.), fouling detection and/or measurement (e.g., pipe/duct fouling, etc.), flow detection, presence and/or motion detection, semiconductor hardware monitoring, radiator performance monitoring, radiation therapy, thermal interface material monitoring, thermal resistance measurement, building insulation measurement, measurement of density, heat capacity, volumetric heat capacity, thermal conductivity, thermal inertia, heat leak rate, thermal diffusivity, etc. of objects and/or materials (e.g., metallurgical powders, epoxies, carbon fiber composites, etc.), hydration/water content measurement, convective heat transfer coefficient measurement, advective heat transfer coefficient measurement, thermal management of buildings, thermal sanitation, thermal processing, thermal comfort, thermal performance, precision agriculture, smart farms, food processing, object freezing, object thawing, metallurgical processing, 3D printing, object quality control, smart construction, efficiency monitoring, prevention of object overheating, fault detection and/or prediction/prevention of objects (e.g., machines, gear boxes, compressors, fans, electromechanical systems, etc.), advanced temperature control, battery performance monitoring (e.g., lithium ion battery health status over time, etc.), etc Battery calorimetry, internet of things (IoT), wearable sensors, predictive analytics, regulatory analytics, descriptive analytics, artificial intelligence, and research and development.
The term internal temperature distribution of an internal region of an object (i.e., internal temperature distribution), as used herein, includes a single temperature at a particular depth of the object at one or more specified times, a plurality of temperatures as a function of depth of the object at one or more specified times, a single average temperature at a particular depth of the object at one or more specified times, a plurality of average temperatures as a function of depth of the object at one or more specified times, a single maximum or minimum temperature within the object at one or more specified times, a plurality of maximum or minimum temperatures within the object at one or more specified times, a single maximum or minimum average temperature within the object at one or more specified times, or a plurality of maximum or minimum average temperatures within the object at one or more specified times. Further, the internal temperature distribution of the internal region of the object is defined to include a measurement of the surface temperature of the object. For example, the internal temperature distribution may be evaluated at one or more specified times at the surface of the object (i.e., depth (x) is 0).
The term internal parameters of an internal region of an object (i.e. internal parameters) as used in this application includes one or more thermal, physical, mechanical, etc. properties of the object. For example, the internal parameters of the object may include thermal conductivity of the object, density of the object, thermal capacity of the object, volumetric thermal capacity of the object, thermal diffusivity of the object, thermal inertia of the object, thermal percolation rate of the object, steady state thermal resistance of the object, internal or external convection coefficient of the object, internal or external advection coefficient of the object, thickness of the object, volume of the object, mass of the object, cross-sectional area of the object, porosity of the object, state of the object (e.g., liquid, solid, gas, etc.), depth of interest of the surface of the object, and the like. Some internal parameters may be based on a combination of internal parameters (e.g., a quotient and/or product of two or more internal parameters). Furthermore, not all internal parameters of the subject may be utilized and/or necessary for the NITI embodiments and/or applications. For simplicity, the term internal parameters as used in this application includes one or more internal parameters (i.e., corresponding internal parameters) that are necessary and/or desirable for a NITI embodiment performed for a subject.
Exemplary embodiment of NITI sensor
An exemplary sensor embodiment of the NITI (i.e., the NITI sensor) includes one or more heat flux sensors and one or more temperature sensors. Heat flux sensors and temperature sensors that are subjected to the same thermal (e.g., heat transfer and/or temperature) conditions and make simultaneous measurements at one or more specified times are referred to as heat flux sensor-temperature sensor pairs (i.e., sensor pairs). The NITI sensor may also include an external thermal device for use with control circuitry intended for the NITI.
In other example sensor embodiments, an optional external thermal device creates a thermal energy source on one side of the NITI sensor that travels through the NITI sensor and into the object being measured. In other example embodiments, the optional external thermal device creates a thermal energy concentrator (i.e., a heat sink) on one side of the NITI sensor that causes heat transfer from the object being measured through the NITI sensor and into the heat sink. The external thermal device may be a heater and/or cooler (e.g., a peltier device) used with control circuitry intended for the NITI to create thermal events (heating and/or cooling) so that simultaneous combinations of different heat transfers (e.g., heat fluxes) and temperature signals may be generated, acquired (e.g., measured) and processed at the surface of the subject. The external thermal device may operate in any manner (steady, periodic, cyclic, etc.). In some example embodiments, an external thermal device may be used to provide periodic (e.g., sinusoidal) temperature and/or heat flux conditions at the surface of the object over time. Further example embodiments use a phase angle determination technique with the one or more NITI techniques to determine one or more internal properties of the subject.
Typically, the external thermal device is adapted to provide a thermal event to an area containing an entire heat flux sensor-temperature sensor pair, wherein at least the entire heat flux sensor sensing area is subjected to the thermal event. In other example embodiments, the external thermal device may be adapted to provide thermal events to an area containing the entire heat flux sensor-temperature sensor pair as well as to an object surface area surrounding the heat flux sensor-temperature sensor pair. In other example embodiments, an external thermal device may provide a thermal event to multiple heat flux sensor-temperature sensor pairs. In other example embodiments, for example, when the object being interrogated has a non-planar (e.g., curved) surface, the external thermal device may be designed to provide thermal events to the area including the heat flux sensor-temperature sensor pair and not to the surrounding object surface.
In other example sensor embodiments, an external thermal device may be used with control circuitry intended for the NITI to eliminate heat transfer occurring between the object and the NITI sensor surface. For example, an external thermal device (e.g., a heater) may apply or remove heat (i.e., thermal energy) from the surface of the object and create a "zero heat flux environment" between the contacting object and the NITI sensor surface. In a zero-heat-flux environment, the heat-flux sensor assembly of the NITI sensor outputs and maintains a minimum voltage (e.g., "0"), and the corresponding surface temperature measured by the NITI sensor at the surface of the subject indicates the internal temperature distribution of the internal region of the subject when in a steady-state condition.
With respect to the example NITI sensor and/or system embodiments described below, CHFT +/-refers to a combination heat flux and temperature sensor (i.e., heat flux sensor-temperature sensor pair), and + or-respectively indicates whether an external thermal device (e.g., heater, peltier device, etc.) is used, which is used with the control circuitry intended for the NITI. DUO NITI refers to NITI sensors and/or system embodiments having multiple (e.g., two) NITI sensors (e.g., CHFT + or CHFT-) operating in parallel. For example, the DUO NITI example embodiments may use differential and/or quotient-based data processing methods to simplify and make more robust NITI measurements. Further, DUO CHFT + refers to a DUO NITI example embodiment that utilizes only two or more parallel CHFT + embodiments. Similarly, DUO CHFT-refers to DUO NITI example embodiments that utilize only two or more parallel CHFT-embodiments. DUO CHFT +/-refers to the DUO NITI exemplary embodiment utilizing at least one CHFT + exemplary embodiment and at least one CHFT-exemplary embodiment operating in parallel. In connection with the present application, CHFT +, CHFT-, DUO CHFT +/-, DUO CHFT +, and DUO CHFT-are non-limiting examples of NITI sensor embodiments that may be used in different NITI systems, some of which are described below.
Although heat flux devices, heat flux channels, etc. may be used for the NITI, heat flux sensors are preferred for the reasons previously described. All of the various heat flux sensors (i.e., heat flux meters, heat flux transducers, heat flux meters, etc.) manufactured using a variety of methods and techniques (e.g., thin film techniques, thick film techniques, thermopile techniques, differential thermopile techniques, thermoelectric techniques, seebeck effect techniques, lateral seebeck effect techniques, butt welding techniques, micro-electromechanical systems (MEMS) based techniques, nano-electromechanical systems (NEMS) based techniques, Complementary Metal Oxide Semiconductor (CMOS) based techniques, additive manufacturing techniques, screen printing techniques, ink jet techniques, textile sensor techniques, wire winding techniques, RTD based techniques, NTC based techniques, thermistor based techniques, semiconductor based techniques, etc.) may be used for NITI. In some example embodiments, the one or more heat flux sensors are based on the differential thermopile technique described in ASTM standard E2684, and discussed further in ASTM standard E2683. A differential thermopile is a passive electronic transducer that converts thermal energy into electrical energy (e.g., voltage and/or current). A differential thermopile usually consists of several thermocouples either in series or (less commonly) in parallel. Typically, thermocouples (i.e., thermocouple junctions) are located on either side of one or more materials (i.e., a thermal resistance layer). A single thermocouple (i.e., a thermocouple junction) measures the temperature difference between its junction point and the point at which the thermocouple voltage output is measured. In series, the voltage output of two thermocouples on either side of the thermal resistance layer (i.e., a differential thermocouple pair or thermocouple pair) is typically a differential voltage that is related (e.g., proportional) to the temperature differential across (e.g., across) the thermal resistance layer and the heat transfer (e.g., heat flux) that occurs through the thermal resistance layer. Adding more thermocouple pairs in series increases the amplitude of the differential voltage output, resulting in a higher sensitivity of the heat flux sensor. The differential voltage output is also affected by the thermocouple (i.e., thermoelectric) material used. Thus, for a given temperature difference across the thermal resistance layer, some thermocouple materials may result in a higher differential voltage output than other materials. Therefore, the choice of thermocouple material also affects the sensitivity of the heat flux sensor. Also, the material and/or thickness used for the thermal resistance layer may affect the heat flux sensor sensitivity and the heat flux sensor response time. The differential thermopile may be constituted by a single thermocouple pair consisting of at least two thermocouple junctions or a plurality of thermocouple pairs. The differential thermopile does not measure absolute temperature, but instead generates a differential voltage output indicative of (e.g., proportional to) a local temperature difference or gradient. As previously described, this temperature gradient is a result of, and thus indicative of, the heat transfer (e.g., heat flux) occurring through the differential thermopile and/or the thermal resistance layer.
One example differential thermopile for heat transfer measurement is constructed using thin film materials and polyimide (i.e., a thermal resistance layer) to create a thin heat flux sensor with accurate readings and fast response times (much less than 1 second). Another example may be a differential thermopile constructed by one or more conductive vias (i.e. vias) in the thermal resistance layer. Other examples may include devices based on differential thermopile technology but designed for converting thermal energy into electrical energy by, for example, thermal energy collection (e.g., thermoelectric generators (TEGs)). In addition to thermal energy collection, these devices may also function as heat flux sensors in that they may output a differential voltage indicative of (e.g., proportional to) the heat transfer (i.e., thermal energy) occurring through the device. However, current TEG technology is typically expensive due to different design criteria and has a large form factor compared to differential thermopiles designed for heat flux sensor applications. Thus, the use of such devices may result in difficult to use and/or inaccurate heat transfer (e.g., heat flux) measurements and slow response times. Another example is a fabric-based heat flux sensor, where the differential thermopile is constructed within a fabric or other material designed to be worn or otherwise in contact with or in proximity to, for example, a human body.
For simplicity, the measurement of heat transfer as measured by a heat flux sensor as used in this application is heat flux in W/m2. This is an example and non-limiting measure of heat transfer that may be used for the NITI and/or associated subject matter (e.g., heat flux sensor design, thermal contact resistance effects, data processing methods, etc.).
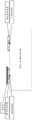
Fig. 1 shows an example of a heat flux sensor based on differential thermopile technology, the sensor having a thickness t, a width W and a length H. The sensing region is defined by a width a and a length B, and the sensor output includes a heat flux output voltage lead (i.e., output lead).
FIG. 2A shows a cross-section of an example differential thermopile including a thermal resistance layer, where k is the thermal conductivity of the thermal resistance layer and T1Is a thermal temperature junction, T2Is a cold temperature junction,. DELTA.T is T1And T2And is equivalent to the temperature difference across the thermal resistance layer, and Δ V is the differential voltage output by the series thermocouple pair and is directly indicative of (e.g., proportional to) Δ T, which is the result of q "(the heat flux occurring through the thermal resistance layer). The greater the number of thermocouple pairs, the higher the sensitivity of the heat flux sensor (the greater the Δ V for a given amount of q ″). In this example, two different thermoelectric materials (e.g., M1 and M2) are coupled through a thermal resistance layer) In series, forming each temperature junction. The different thermoelectric materials may include materials having different seebeck coefficients to generate a thermoelectric voltage (e.g., copper and constantan, copper and nickel, copper and silver, antimony and bismuth telluride, positively and negatively doped materials, p-type and n-type semiconductor materials, etc.).
Fig. 2B shows another example differential thermopile including two different thermoelectric materials (i.e., M1 and M2) and an electrical conductor (M3). In this example embodiment, M3 is used to connect M1 and M2 in series through a thermal resistance layer. Such a configuration of an example differential thermopile has example benefits, including lower manufacturing costs, higher sensitivity, greater design freedom, etc., and may be implemented using one or more manufacturing techniques (e.g., MEMS-based techniques, NEMS-based techniques, CMOS-based techniques, additive-based techniques, etc.). In other example embodiments, where M3 is designed to be the same material as M1 or M2, manufacturing may be further simplified.
When a thermocouple junction is formed by pressing two similar or dissimilar metal materials together, or when a temperature sensor is placed in contact with an object surface, only a small fraction of the nominal surface area actually contacts due to the unevenness and roughness of the contact surface. If a heat flux is applied across the joint and/or contact surfaces, the heat flow (i.e., thermal energy) is generally limited to conduction through the contact points. See the example shown in fig. 3. The limited number and size of the contact points results in an actual contact area that is significantly smaller than the apparent contact area. The presence of such limited contact area and gap can result in a thermal resistance known as contact resistance or thermal contact resistance 。
。
Thermal contact resistance The presence of (b) affects the quality of the temperature measurement. In particular, for example, there is a thermal contact resistance between the temperature sensor of the example NITI embodiment and the object surface
 Leading to inaccurate temperature readings. In other words, even when sufficient contact and thermal shunt design is achieved by, for example, thin film thermocouple technology, the actual surface temperature of the object is different from the temperature measured by the temperature sensor. This inaccuracy and the existing thermal contact resistance
 Is related to the magnitude (usually constant) of the heat flux that occurs through it at a given time. This relationship is mathematically represented as follows:

the heat flux is defined as positive when entering the subject, and wherein:
t is a fixed time, is the measured heat flux at a given time,
 is the surface temperature measured by the sensor (i.e., measured sensor temperature, measured temperature) at a given time, an
 Is the actual surface temperature at a given time. With respect to the present application, unless the context indicates otherwise, the thermal contact resistance between the temperature sensor and the object surface of the example NITI sensor embodiments
 May be referred to as the thermal contact resistance between the NITI sensor and the surface of the object.
FIG. 4 shows an exemplary CHFT + embodiment that includes a heat flux sensor and a temperature sensor placed on a surface of an object having an interior with the objectAn unknown internal property associated with the zone, and wherein a heater (i.e., an external thermal device) is placed on the heat flux sensor. In this example, the heat flux sensor is in contact with a temperature sensor, which is in contact with the object surface. Also, the limited contact area between the temperature sensor and the surface of the object results in a thermal resistance between the temperature sensor and the surface temperature of the object, and is shown as a thermal contact resistance . In addition, layers on the temperature sensor (e.g., due to protective layers, adhesives, etc.) may affect (e.g., increase) the thermal contact resistance present
 The amount of (c). Heat flux (C)
 ) Shown as a vector pointing to the object and defined as positive in that direction. Thus, as in equation [1]]Indicating the actual surface temperature of the object
 Using measured temperature from a temperature sensor
 Measured heat flux from the heat flux sensor(s) ((
 ) And a thermal contact resistor
 To be determined. In some example embodiments, efforts may be made to make thermal contact with a resistor
 Minimized to assume equation [1]]The value of (1) is "0". This may be accomplished, for example, by using a thermally conductive adhesive between the contacting surfaces.
In other example embodiments, to obtain accurate actual surface temperature measurements Thermal contact resistance
 The estimated value of (c) may need to be determined (e.g., measured). In some cases, the estimated thermal contact resistance
 (instant thermal contact resistance)
 ) The value may be determined to be negligible or zero. In other cases, the estimated thermal contact resistance
 The values may be determined using predetermined specifications from, for example, manufacturing specifications for the tape used to mount the NITI sensor.
Example embodiments enable accurate NITI measurements of a subject, whether in steady-state or transient environments. Example embodiments utilize heat flux boundary conditions in their respective thermal mathematical models (heat flux is an input) that are more robust and accurate than temperature-based boundary conditions. Example outputs include accurate values of internal attributes of the object (e.g., an internal temperature distribution of an internal region of the object and/or one or more internal parameters of the object).
Referring to FIG. 5, an example CHFT-embodiment includes a heat flux sensor and a temperature sensor placed on the surface of an object with unknown internal properties. One example application is in situations where some form of external thermal event occurs, such as placing a CHFT-on an engine, where the external thermal event is the heat generated and emitted by the engine. Another application is the placement of CHFT-on the body of humans or other animals, e.g. sportsmen. In this latter example, the combination of body heat dissipation and airflow moving over the CHFT-corresponds to an external thermal event. Other external thermal events may originate from heating lamps, fans, heat sinks, solar radiation, contact with other objects (e.g., metal plates), etc., that are not used with the control circuitry intended for the NITI (i.e., uncontrolled external thermal events).
To limit heat flux noise and sporadic signals from registration due to, for example, small environmental changes and/or other external stimuli, a piece of thermal insulation (i.e., thermal insulation layer or piece) may be placed on top of the CHFT-as shown in fig. 6A. The block insulator acts as a filter and only allows substantial heat flux and temperature signals to be detected by the CHFT-. In addition, the thermal insulation may be used to control (i.e., limit, increase, etc.) the amount of heat flux that occurs through the CHFT-. The thickness, material, form factor and size of the insulation will depend on the application in which the CHFT-is being used, among other factors. In some example embodiments, the thermal insulator may be embedded in a substrate or material on which the heat flux sensor and/or the temperature sensor is mounted. For example, air gaps or other areas of low thermal conductivity may be designed within the printed circuit board (e.g., rigid and/or flexible material) for placement and electrical connection to the heat flux sensor and/or the temperature sensor.
Fig. 6A shows an example in which the thermal insulator is adapted to cover the entire heat flux sensor-temperature sensor pair. In other example embodiments, as shown in fig. 6B, the insulation may also overlap the object surface area around the heat flux sensor-temperature sensor pair. In some example embodiments, such as shown in fig. 6C, a thermal insulator or additional thermal insulator may be designated to surround the heat flux sensor and/or the temperature sensor to minimize heat loss. In some example embodiments, the thermally insulating material may comprise a metal or other thermally conductive material designed to enhance and increase the amount of heat flux generated by the CHFT-. The insulation, filtering, and heat flux control techniques shown in fig. 6A-6C may optionally be used with some or all of the NITI sensor embodiments.
Referring to fig. 7A, an example CHFT + embodiment includes a heat flux sensor, a temperature sensor, and an external thermal device, such as a heater, cooler, fluid flow channel, fan, heat lamp, etc., for use with control circuitry intended for NITI. The CHFT + embodiment is particularly useful when external thermal events do not occur and steady state conditions are maintained in most cases. However, they can also be used in situations where uncontrolled external thermal events are occurring. With external thermal devices, CHFT + can generate controlled thermal events that produce transient responses (i.e., different thermal signals). For example, the external thermal device may cycle power to a heater (i.e., the external thermal device) to provide periodic thermal events at the surface of the subject. If necessary, external thermal devices can be controlled to achieve steady state conditions. In other example embodiments, the CHFT + may include more than one external thermal device. For example, both heaters and peltier coolers can be used as external thermal devices to create a thermal heat source and a thermal heat sink as needed. As another example, a single peltier device may be used as an external thermal device to achieve thermal heating and cooling. In fig. 7A, a heater is illustrated as an example of the external heat device. In this example, the heater (i.e., external thermal device) is designed to provide thermal events to an area containing the entire heat flux sensor-temperature sensor pair and the object surface area surrounding the heat flux sensor-temperature sensor pair. In fig. 7B, another example embodiment is illustrated, where a heater (e.g., an external thermal device) is designed to provide a thermal event only to the area containing the entire heat flux sensor-temperature sensor pair. Fig. 7C shows a top view of an example CHFT + embodiment, including a temperature sensor with output leads (i.e., output terminal connections), a heat flux sensor with output leads (example output terminals), and a heater with power leads (example power terminals) (example external thermal device). In this example, the output and power leads are connected (e.g., soldered) to respective output terminals of each component. In other example embodiments, the output terminals may be connected to other terminals (e.g., conductive pads) designed for surface mount or through-hole devices, for example, by using rigid and/or flexible printed circuit board technology. In other example CHFT + embodiments, the heater may be constructed within, for example, a printed circuit board, with a tracking pattern of controlled resistance, shape, and/or size that is directly connected to a power source within the circuit. This may simplify the manufacturing process in view of the embedded aspect of the design. In some example NITI sensor embodiments, one or more temperature sensor output leads may be connected to a ground terminal and/or a reference resistor that may be used as part of a circuit to make temperature measurements based on a temperature sensor resistance (e.g., a thermistor).
In other example embodiments, such as shown in fig. 7D, the temperature sensors may be located on or near opposite sides of a heat flux sensor sensing region in contact with the object surface. In these example embodiments, it may be assumed that the output of the temperature sensor is the same as that of the temperature sensor configured in fig. 7A. This is particularly true when the heat flux sensor has negligible thermal resistance due to its design (e.g., low thickness, high thermal conductivity, etc.) and/or where zero heat flux conditions are created. In other example embodiments, such as embodiments in which the thermal resistance of the heat flux sensor is not negligible, one or more effects of the thermal resistance of the heat flux sensor may be modeled as a portion of the thermal contact resistance between the temperature sensor and the surface of the object. In other example embodiments, for example, where the number of heat flux sensor joints and the sensitivity of the heat flux sensor are accurately known, the heat flux sensor output may be used to determine the temperature difference across the heat flux sensor in real time, such that the output may be combined with the temperature sensor in fig. 7D to determine the temperature between the heat flux sensor and the surface of the object.
In other example embodiments, such as shown in fig. 7E, a temperature sensor may be embedded within the heat flux sensor and/or heat flux sensor sensing region.
In other example embodiments, such as shown in fig. 7F, the heat flux sensor and the temperature sensor may be located on either side of the substrate while avoiding measurement mismatch. For example, the heat flux sensor and the temperature sensor may be aligned on either side of a substrate (e.g., a flexible printed circuit board) such that the heat flux sensor and/or the heat flux sensor sensing area includes temperature sensors on opposite sides. This can be achieved by, for example, placing heat flux sensors under or on top of the temperature sensors on opposite sides of the substrate. In these example embodiments, the heat flux sensor and/or the temperature sensor may further be surrounded by and/or in contact with other thermally compatible materials (e.g., materials having a thermal resistance close to the temperature/or the heat flux sensor) to ensure a uniform flow of thermal energy (e.g., heat flow) through the heat flux sensor and the temperature sensor. An example embodiment is illustrated in fig. 7G.
The non-limiting features of the example embodiments shown in fig. 7D-7G may be optionally used with any example NITI embodiment, including the example CHFT-embodiment.
One or more heat flux sensor-temperature sensors having means for determining one or more internal properties of an object
System embodiment of the pair
FIG. 8 illustrates an example NITI system that uses CHFT-to perform NITI. CHFT-includes a temperature sensor and a heat flux sensor (i.e., a heat flux sensor-temperature sensor pair). In other example embodiments, the CHFT-may include more than one temperature sensor and/or more than one heat flux sensor (e.g., multiple heat flux sensor-temperature sensor pairs). The arrangement of the temperature sensor and the heat flux sensor relative to each other and the object may be, for example, as shown in any of fig. 5 and 6A-6C. The analog signal outputs from the temperature sensor and the heat flux sensor (corresponding to the measured temperature sensor and the measured heat flux sensor analog signals) are provided over suitable communication paths (e.g., electrical conductors) and converted to digital signals by Data Acquisition (DAQ) circuitry, which may include, for example, one or more analog-to-digital converters (ADCs), microcontrollers, etc. The DAQ circuitry provides the measured temperature sensor and measured heat flux sensor digital signals to the control circuitry over a suitable communication path (e.g., electrical conductors, radio signals, etc.) for processing as described in more detail below. The control circuitry may comprise one or more suitably configured computers, microprocessors, DSPs, FPGAs or other data processors. Suitable configurations of the control circuit may be implemented in hardware, software or a combination. The control circuitry includes or communicates with outputs such as a display, a network, a cloud computer system, a communication device such as a cellular telephone, wearable technology, and the like. The output may also be used for one or more control operations, such as sensor enablement and disablement, remote monitoring, measurement start/stop, data logging, temperature control, energy control, system fault control, preventative maintenance control, diagnostics, system performance, data input, data display, analysis, and the like.
FIG. 9 illustrates an example of a NITI system that performs NITI using CHFT +. Like CHFT-, CHFT + includes a temperature sensor and a heat flux sensor (i.e., a heat flux sensor-temperature sensor pair). In other example embodiments, the CHFT + may include more than one temperature sensor and/or more than one heat flux sensor (e.g., multiple heat flux sensor-temperature sensor pairs). In addition, the CHFT + includes an external thermal device, such as the resistive heater shown. The configuration of the temperature sensor, heat flux sensor and external thermal device relative to each other and the object may be, for example, as shown in any of fig. 7A-7G. In other example embodiments, the CHFT + may include more than one external thermal device (e.g., a heater and a cooler). The analog signal outputs from the temperature sensor and the heat flux sensor (corresponding to the measured temperature sensor and the measured heat flux sensor analog signals) are provided over suitable communication paths (e.g., electrical conductors) and converted to digital signals by Data Acquisition (DAQ) circuitry, which may include, for example, one or more analog-to-digital converters (ADCs), microcontrollers, etc. The DAQ circuitry provides the measured temperature sensor and the measured heat flux sensor digital signals to the control circuitry over a suitable communication path (e.g., electrical conductors, radio signals, etc.) for processing as described in more detail below. The control circuitry may comprise one or more suitably configured computers, microprocessors, DSPs, FPGAs or other data processors. Suitable configurations of the control circuit may be implemented in hardware, software or a combination. The control circuitry includes or communicates with outputs such as a display, a network, a cloud computer system, a communication device such as a cellular telephone, wearable technology, and the like. The output may also be used for one or more control operations, such as sensor enablement and disablement, remote monitoring, measurement start/stop, external thermal device operation, data logging, temperature control, energy control, system fault control, preventative maintenance control, diagnostics, system performance, data input, data display, analysis, and the like. In this non-limiting example, the external thermal device is controlled using a relay (example switch), and the relay is operated by a relay signal from the DAQ, which provides the relay signal based on input from the control circuit.
FIG. 10 is a flowchart outlining an exemplary process performed by control circuitry in a non-limiting and exemplary NITI system including a NITI sensor for determining one or more internal properties of a subject including determining an internal temperature distribution of an internal region of the subject at one or more specified times using a measured heat flux, a measured temperature and a determined value of a parameter internal to the subject. The control circuit receives the measured temperature signal from the temperature sensor at one or more specified times (step S1). The control circuit also receives measured heat flux signals from the measured heat flux sensors at one or more specified times to produce a measurement of heat transfer at the surface away from or into the object (step S2). The control circuit determines values of the internal parameter at one or more specified times in step S3, and determines an internal temperature distribution of the internal region of the subject at one or more specified times based on the measured temperature signal, the measured heat flux signal, and the values of the internal parameter in step S4. The control circuit generates information (e.g., for output) indicating the internal temperature distribution at one or more specified times (step S5). The control circuit also generates information (e.g., for output) indicative of one or more internal parameters at one or more specified times in step S6. The control circuit may optionally perform step S6 before step S5 and/or may optionally not perform step S4, step S5, and/or step S6. The control circuit may optionally perform step S2 before step S1. In some example embodiments, the control circuit may optionally perform step S3 before step S2 and/or step S1.
Additional processes may be used in further example embodiments. For example, a thermal mathematical model (i.e., a thermal model) of the object is determined, and appropriate initial and boundary conditions are specified in order to solve a thermal mathematical solution (i.e., a mathematical solution). For the more general case, thermal mathematical models and corresponding thermal mathematical solutions may be found in the heat transfer literature, while models for the more unique cases may need to be derived and solved. Various methods may be used to derive and/or solve the thermal mathematical model, including, but not limited to, analytical methods, finite difference methods, numerical methods, and the like. The thermal mathematical model may be based on one-dimensional heat transfer or multi-dimensional heat transfer (e.g., two-dimensional).
To obtain a more accurate, robust and consistent NITI, the boundary conditions of the thermal mathematical model are defined to include surface heat flux boundary conditions, resulting in a thermal mathematical solution (e.g., internal temperature distribution) of the subject with the heat flux input. Surface heat flux boundary conditions may be used because the NITI sensor directly measures heat flux using, for example, a heat flux sensor at the surface of the object. Thus, the heat flux can be directly applied to a thermal mathematical model (i.e., a heat flux boundary condition) that results in a heat flux input in a corresponding thermal mathematical solution (i.e., a mathematical solution). Table 1 provides a detailed but still exemplary one-dimensional mathematical model of heat (i.e., thermal model) that includes Partial Differential Equations (PDEs), appropriate boundary conditions, and initial conditions for semi-infinite solids (i.e., semi-infinite media), exemplary objects, and general conditions in the heat transfer literature.
TABLE 1 semi-infinite solid thermal model with heat flux boundary conditions

Constant step heat flux input at the surface for semi-infinite media (objects) The mathematical solution of the thermal model in table 1 is as follows:

wherein Is the constant step heat flux input at the boundary.
Using the Duhamel superposition method (an example mathematical method), the equation [2] for the change in heat flux input over time can be derived, which is a practical case for the output of the NITI sensor:

where m indicates the m-th measurement by the NITI sensor, thereby Refers to the internal temperature of the object with depth x and m-th measurement, which corresponds to a specified time
 。
。
In this example, equation [3] represents the non-limiting and exemplary thermal mathematical solution of the thermal model specified in Table 1, i.e., the mathematical expression for the internal temperature distribution of the internal region of the object.
Evaluation of equation at surface [3] And realize
 :
:

Wherein Is the calculated surface temperature of the example object modeled in table 1. Note that in this example, equation [4]]Is function of surface object temperature under steady state conditionsNumber of
 And is determined, for example, before or after a transient thermal event. Equation [4]]Also surface heat flux measurements at one or more specified times
 And thermal conductivity of the object
 Object density
 And specific heat capacity of the object
 A function of the square root of the product. The internal parameters of the object
 Commonly referred to as thermal inertia (i.e., thermal emissivity).
Equation [4]]The calculated object surface temperature determined in (a) may be used with a data processing method that may include, for example, one or more parameter estimation schemes. For the measured NITI sensor output values (i.e., heat flux and temperature) at one or more specified times, the data processing method may compare the measured sensor temperature to the calculated surface temperature, as in this example using equation [4]]As found. This allows, among other things, to determine an estimate of a respective internal parameter of the object; in this case, the internal parameters of the thermal inertia (i.e. the thermal emissivity) of the object 。
。
In other data processing methods, in this example, the thermal conductivity of the object Object density
 And specific heat capacity of the object
 May be determined separately. For example, for the above case, density
 Specific heat of and
 may be determined from a reference material (e.g., a textbook or manufacturing specification) to allow the data processing method to be based on an estimate of the thermal inertia (i.e., the thermal emissivity) of the object
 Or
Or Determining thermal conductivity
 An estimate of (d). In other examples, different thermal mathematical models may be solved using corresponding thermal mathematics, with equation [4]]Instead, the thermal mathematical solution is deep in the object
 The location of the (e.g.,
 ) A distinction is made between each individual internal parameter at the time of evaluation. This would allow each individual internal parameter to be determined when used with an appropriate data processing method (e.g. for example
 、
、 、
、 Etc.) of the received signal. The control circuitry may also perform further steps to improve the accuracy and/or expand the application of the NITI sensor. For example, as previously described, due to the presence of thermal contact resistance between the temperature sensor and the object surface
 The measured sensor temperature is different from the measurement of the actual surface temperature of the object (e.g., semi-infinite solid). This results in a difference between the actual surface temperature of the object and the measured sensor temperature. Thermal contact resistance
 Possibly due to the material on the temperature sensor of the NITI sensor that may delaminate and the degree of adhesion to the surface of the subject. Smoothness/roughness of the object surface may also affect the thermal contact resistance
 And overall accuracy of the NITI. Therefore, a smooth surface may be preferred. The use of adhesives (e.g., thermal paste, pressure sensitive adhesive, etc.) to mount the sensor may also affect the thermal contact resistance
 . FIG. 4 illustrates a thermal contact resistance
 It relates to an exemplary NITI embodiment.
Mathematically, the measured sensor temperature and the actual surface temperature can be related by equation [1], shown here in index form as:

wherein the heat flux is defined as positive when entering the subject.
In an electrical engineering analogy, thermal contact resistance Can be modeled as a resistor and
 is the current. Therefore, when the current is flowing
 Flow-through resistor
 When this occurs, a voltage drop (difference) occurs. Here, the voltage difference is similar to the temperature difference between the sensor (i.e., measured) and the object (i.e., actual) surface temperature.
In some cases, it may also be desirable to account for thermal effects associated with the materials used to mount the sensors. E.g. thermal conductivity with, e.g. mounting material Mounting material density
 And specific heat capacity of mounting material
 The associated effect or effects may need to be included and accounted for in the thermal mathematical model for the NITI.
To obtain more accurate NITI, the thermal contact resistance Should be taken into account. Will equation [4]]And equation [5]]Used in combination to give equation [6]The expression for the calculated sensor temperature in (1).

Equation [6] may be used in place of equation [4] in the data processing method and, for example, equation [6] is compared to the measured sensor temperature output from the NITI sensor to determine an estimate of one or more internal parameters of the subject. One example and non-limiting way to do this is to define a minimized objective function in the parameter estimation scheme. An example objective function may be defined as the Root Mean Square Error (RMSE) between two different sensor temperature measurements using equation [7 ].

Wherein

Thus, equation [7] can be rewritten as:

wherein Is the total number of measurements taken by the NITI sensor over a period of time (i.e., one or more specified times). It should be noted that, according to an embodiment,
 may not always be as in equation [7]]And equation [9]]Starting with a value of 1. Similarly, number
 And may vary from embodiment to embodiment. For example
 Can use
 Or
Or And (4) replacing. In other exemplary embodiments of the present invention,
 can be replaced by
 、
、 、
、 Etc. which define the objective function for a specified number of measurements after the m-th measurement.
In other data processing methods, for example, based on an objective function (e.g., equation [9]]) The equation for the derivative of (c) may be set equal to zero. Corresponding internal parameters and thermal contact resistance The value that best satisfies this condition is the determined estimate.
As previously mentioned, a major component of an accurate and practical NITI is the thermal contact resistance And (4) determining. For certain conditions, e.g., low heat flux environments (e.g., zero heat flux conditions) or otherwise negligible thermal contact resistance
 Condition, thermal contact resistance
 May be ignored or otherwise determined to have an estimated value of zero. But for many cases this is not an accurate assumption.In these cases, the thermal contact resistance
 The estimated value of (c) may need to be predetermined, for example, by previous measurements, determined as part of a data processing method (e.g., by a parameter estimation scheme), or otherwise determined (e.g., predetermined by a manufacturing specification).
Determining thermal contact resistance One method of estimating the value includes it as an unknown variable in a data processing method that may include a parameter estimation scheme. Corresponding internal parameter values and thermal contact resistance
 The combination of values that produce the best match (i.e., the smallest error) between the calculated sensor temperature and the measured sensor temperature may be considered the determined estimate (i.e., the best output value).
For example, for the general and exemplary semi-infinite object cases introduced above, for Each value of the trial (e.g., guess) is a different series of values
 The value is also tried and input into equation [6]]. For the trial
 And
And for each combination of values, equation [6]]The result of (i.e., the calculated sensor temperature) is compared to the measured sensor temperature (as the output of the NITI sensor). The comparison may be by an objective function (e.g., equation [7]]The objective function defined in (1). In this example, forInternal parameters (e.g.
 ) And a thermal contact resistance
 The combination of values that is attempted to produce the best match (i.e., the smallest error (e.g., the smallest RMSE value)) between the calculated sensor temperature and the measured sensor temperature may be considered the determined estimate (i.e., the best output value). However, such example methods (i.e., brute-force data processing methods) can be time consuming, especially when more accurate results are desired. Thus, this approach makes most NITI applications impractical. While time consuming, this technique is more accurate and faster than brute force data processing methods based on mathematical solutions using temperature-based boundary conditions. This is a result of the complexity and limitations of temperature-based boundary conditions.
Another approach is to determine the corresponding internal parameters by an optimization scheme (e.g. ) And a thermal contact resistance
 An estimate of the value. For example, the optimization scheme may be designed by, for example, internal parameter values (e.g.
 ) And a thermal contact resistance
 Non-linearly varying combinations of values to minimize an objective function (e.g., equation [7]]). This approach may produce faster results when compared to the brute force data processing methods described above, but may be less accurate.
Determining contact thermal resistance A new approach to estimate the value is to determine (e.g., calculate) it based on the internal properties of the object. This greatly shortens the processing time and makes the technique more practical in many applications. The method utilizes a thermal contact resistor
 Is constant with respect to time. Thus, at any given time or any given measurement, the thermal contact resistance
 Equivalent to a specified time or measured thermal contact resistance before or after
 . Mathematically, this can be expressed as:

where N indicates the nth measurement taken by the NITI sensor (N measurements total during a period of time). Accordingly, for purposes of this non-limiting example, . Further, the number n may vary depending on the embodiment. For example, n can be
 Or
Or And (4) replacing.
In view of this consistency, the thermal contact resistance at a given time or measurement The average contact resistance over the entire period of time over which the measurement is made, and can be expressed as:

in addition, equation [5] can be rearranged as:

combining equation [10], equation [11] and equation [12] yields:

with respect to the example data processing method described previously, equation [13] is input to equation [9] (an example objective function for the parameter estimation scheme), with the result that:

it should be noted that according to an example embodiment, n may not always be as in equation [14]]The illustration starts with a value of 1. Similarly, number And may vary from embodiment to embodiment. For example
 Can use
 Or
Or And (4) replacing. In other exemplary embodiments of the present invention,
 can be replaced by
 、
、 、
、 Etc., which define equation [13] for a specified number of measurements after the nth measurement]。
And equation [9]]By contrast, equation [14]This version of the example objective function in (1) is largely independent of thermal contact resistance . Dependent solely on thermal contact resistance
 The item is
 Wherein as equation [5]]As a result of (1), the term is defined as
 . It should be noted that in many cases, the number
 Can be ignored. In case it is not negligible, a better design is needed, and the number is
 May need to be accounted for. An example method to accomplish this is to try (e.g., guess) the thermal contact resistance before doing the parameter estimation scheme in the present data processing method example
 Is started. Regardless of the initial value attempted, the parameter estimation scheme will determine the thermal contact resistance
 Accurate estimated value of and accuracy of internal parameterAnd (6) estimating the value.
Using equation [14] as an objective function in the parameter estimation scheme as part of the data processing method greatly reduces the time required to perform the NITI measurement. To achieve comparable accuracy and using the same computer, the inventors determined that this data processing method could be completed in less than 1 second of processing time, in contrast to approximately 15 minutes using the above-described brute force method based data processing method for the same data set (75 seconds of data-1 HZ sampling frequency).
Finally, another unobvious approach is based on the internal parameters of a given object and the overall steady state thermal resistance Determining thermal contact resistance
 An estimate of (d). Non-limiting examples of the method are described below for example NITI applications.
It should be noted that for thermally contacting the resistors These methods of determination are not limited to a particular data processing method and/or NITI technique. Instead, they can be used as thermal contact resistors
 The general expressions and methods determined regardless of the data processing method employed by the NITI and/or the NITI application.
FIG. 11 is a flow chart illustrating a non-limiting example process of an example data processing method performed by the control circuitry to determine one or more internal properties (i.e., internal properties) of the subject and an estimated thermal contact resistance between the subject and the NITI sensor surface . In this example, the data processing method includes a parameter estimation scheme. At one endThe measured surface temperature of the object (i.e., the measured sensor temperature) at one or more specified times, the measured surface heat flux of the object at one or more specified times, one or more internal parameters of the object (e.g., the measured sensor temperature), and the like
 (steady-state thermal resistance of object),
 、
、 、
、 、
、 Etc.) and the thermal contact resistance
 Is input to a calculated sensor temperature equation (e.g., equation [6]]) To generate calculated sensor temperatures for one or more specified times. In this example, a difference (e.g., error) between the calculated sensor temperature at one or more specified times and the measured sensor temperature at one or more specified times is determined. The difference is compared, for example, to a predetermined threshold value, and if greater than the threshold value, the difference is used to adjust one or more internal parameter values and thermal contact resistance
 The value is obtained. For simplicity, one or more adjusted internal parameter values and one or more other (i.e., non-adjusted) internal parameter values are collectively referred to as update values. Adjustment can be made in a number of different ways. E.g. one or more internal parameters and thermal contact resistance
 May be atWithout taking into account internal parameters and thermal contact resistance previously used
 Any trend or pattern of historical differences (e.g., errors) in the values generated. In other examples, the internal parameters and thermal contact resistance may be based on previous use
 The historical difference (e.g., error) in the values produced adjusts. In a non-limiting example, if
 (e.g. in
 ) Is related to the difference (i.e., error) of 100 and is used for
 (e.g. in
 ) Is associated with an error of 200, provided that greater than that is used
 If the difference (i.e., error) increases, the control circuit may attempt to be less than
 The value of the original value of (a). Once the difference is less than or equal to the threshold or otherwise considered to be a minimum, the control circuit will be used for the internal parameters and the thermal contact resistance
 Is considered to be an accurate and optimal (i.e., output) estimate. Then, by using, for example, equation [3]]The control circuit generates and indicates one or more of an internal temperature distribution of an internal region of the objectThe exact value corresponds to information (e.g., for output). In addition, if desired, the control circuitry generates information (e.g., for output) corresponding to an accurate estimate indicative of one or more internal parameters of the object, e.g., for output
 、
、 、
、 、
、 、
、 Etc., and a thermal contact resistance
 。
。
The method just described is a non-limiting example periodic NITI data processing method performed by a control circuit that can determine subject internal parameters (e.g., thermal flux and temperature signals output by a post-processing from an NITI sensor placed on a subject surface and simultaneously subject to a thermal event) 、
、 、
、 、
、 、
、 Etc.) inThermal contact resistance between temperature sensor and object surface
 Internal temperature distribution of an internal region of an object (e.g., temperature distribution of a target in a target area of a target area
 ) And the like. For CHFT +, the thermal event may be generated by an external thermal device used with the control circuit, for example. While CHFT-is designed to operate, for example, in external thermal event environments such as body heat rejection, engine block heat loss, convective cooling or heating, etc., which are not used with control circuitry. Since the control circuit can perform this process very quickly, data processing can be performed in real time with measuring the heat flux and temperature signals and providing them as inputs to the control circuit. For each additional measurement, the data processing method is re-run, the values of one or more internal properties (i.e., internal properties) of the internal region of the object are determined, and information, for example, for output is generated.
Other methods (i.e., techniques) of NITI may be performed by, for example, modifying a thermophysical solution (e.g., equation [3 ]) to a different form according to an internal attribute of interest. The following provides non-limiting examples of modified arrangements of the thermophysical solution and corresponding NITI method for different applications. Each of these applications has a corresponding thermal mathematical model. Generally, depending on the NITI application and procedure used, different data processing methods may be used to determine estimates of one or more internal properties of the subject. Some of these methods may utilize parameter estimation schemes, while others may not, and instead, for example, be based on calculations.
In other example embodiments, various mathematical operations (e.g., derivative operations, integral operations, etc.) may be performed on, for example, a thermal mathematical solution to determine (e.g., by a data processing method) one or more internal properties of an object.
Having one or more interior portions for determining the objectOne or more parallel heat flux sensor-temperature transfer of properties
System embodiments of a sensor pair
An example NITI system embodiment that acquires subject heat flux and temperature measurements in parallel by multiple (at least two) NITI sensors (e.g., CHFT + or CHFT-) is referred to as a DUO NITI embodiment. In addition to allowing for simpler and more robust NITIs for subjects, the DUO NITI embodiment eliminates the uncertainties that may be associated with the non-limiting example NITI system embodiments and/or methods of the example CHFT + and/or example CHFT-NITI system embodiments described above.
For measurements to be taken in parallel, each NITI sensor in an example DUO NITI embodiment may have a different heat flux value detected by each heat flux sensor, corresponding to the difference in the amount of heat flux occurring at each NITI sensor location (also referred to as a sensor node). This aspect of the exemplary DUO NITI embodiment is referred to as a differential heat flux environment. The following example embodiments may be used to achieve this condition. Typically, the temperature measurements at each sensor node (i.e., node) are also different due to the differential heat flux environment.
One way to create a differential heat flux environment using the example DUO CHFT + embodiment (multiple CHFT + nodes) is to vary the amount of thermal energy provided by each CHFT + external thermal device (e.g., heater). In the case of heaters, this may be accomplished by, for example, differentiating the voltage supplied to each heater, differentiating the resistance of each heater, differentiating the power density of each heater, etc., to create the desired differential heat flux environment. FIG. 12 shows a cross section of an example DUO (parallel NITI sensor node) CHFT + (with heater) embodiment. In this example embodiment, each NITI sensor (i.e., sensor node) contains one heat flux sensor-temperature sensor pair and includes a heater (i.e., external thermal device) as it is the CHFT + node.
Another way to create a differential heat flux environment is to place a different amount of thermal insulator on each sensor node if an external thermal device (e.g., heater) is not an option, not desired, or not used. The insulator may be used to control (i.e., limit, increase, etc.) the amount of heat flux that occurs through the sensor node. Different amounts of thermal insulation may be achieved by different insulation thicknesses and/or materials. The thermal insulator may comprise a metal or other thermally conductive material designed to enhance and increase the amount of heat transfer that occurs through the sensor node. In addition, the insulator may act as a filter and only allow substantial heat flux and temperature signals (e.g., CHFT + or CHFT-) to be detected by the NITI sensor. The insulator may also be used to protect the NITI sensor from external damage and/or external stimuli that may affect the quality of the measurement. FIG. 13 shows a cross-section of an example DUO (parallel NITI sensor node) CHFT-embodiment with a different amount of thermal insulator on each sensor node to facilitate a differential heat flux environment. In the NITI example embodiment, the properties of the thermal insulator used at the sensor node need not be known, experimentally determined, or calibrated to make measurements of one or more subject internal properties.
Alternatively, for example, when signal noise may not be an issue, one CHFT-node may incorporate a thermal insulator while the other CHFT-node is exposed. A cross-section of this exemplary embodiment is shown in fig. 14.
Another example embodiment in FIG. 15 shows a cross section of a DUO CHFT +/-system, with one sensor node incorporating CHFT +, and one sensor node incorporating CHFT-.
Yet another exemplary embodiment of a DUO CHFT-system cross-section is illustrated in FIG. 16. This example embodiment may be applicable where the external thermal event is specific to an individual sensor node. For example, one sensor node is heated with a lamp, while the other sensor node is cooled with a fan.
Another example embodiment of creating a differential heat flux environment includes using materials with different thermal resistances for each heat flux sensor-temperature sensor pair. For example, one sensor node incorporates an example NITI embodiment made of a high thermal resistance material (e.g., CHFT-), and one sensor node incorporates an example NITI embodiment made of a low thermal resistance material (e.g., CHFT-). The difference in total thermal resistance at each sensor node allows for a differential heat flux environment. Different thermal resistances may be introduced into example NITI embodiments through holes/gaps, for example, by electrical conduction or insulation within one or more materials used to adhere, connect, house, and/or contact the heat flux sensor and/or the temperature sensor (e.g., rigid and/or flexible printed circuit boards, adhesives, substrates, etc.). In other example embodiments, the heat flux sensor and/or the temperature sensor of one sensor node may be fabricated using a material with low thermal conductivity and/or a specified thickness, while the heat flux sensor and/or the temperature sensor of another sensor node may be fabricated using a material with high thermal conductivity and/or a different specified thickness.
As a result of one or more parallel sensor nodes incorporated in the example DUO NITI embodiment, innovative signal measurement and data processing methods are possible in addition to performing the example CHFT + and example CHFT-methods described above (in which the sensor nodes operate independently). For purposes of illustration, a general, non-limiting and example data processing method based on difference and quotient when the DUO NITI system is operating in a differential heat flux environment is now described.
In this example, two NITI sensor nodes (i.e., sensor nodes) are modeled as being placed on a given object, where the internal properties of the object are assumed to be uniform at the two sensor node locations in this example. This will yield the following example independent equations at each sensor node (node 1 and node 2):

wherein Is the internal temperature of the object (i.e., internal temperature distribution), an
 Is a response function that accounts for transient heat transfer effects of the object at one or more specified times. In general,
 is derived independently for each thermal model and may be based on one or more internal parameters. Thus, it is generally unique for a given NITI application and corresponding thermal model. In some example DUO NITI embodiments, the response function is derived from
 For related purposes, it may be desirable to determine initial values for one or more internal parameters at one or more specified times. These initial values may be predetermined (e.g., from textbooks, references, etc.), estimated (e.g., by data processing methods), or otherwise determined. In some example embodiments, the initial value does not change and remains constant for one or more specified times. In other example embodiments, the initial value may be updated or otherwise adjusted at one or more specified times.
In steady state form, equations [15] and [16] are reduced to:


note that equation [17 ]]And equation [18 ]]Response function not including accounting for transient heat transfer effects of objects . Thus, they are generally not limited to a particular NITI application and corresponding thermal model.
The general and exemplary differential-based data processing methods of the DUO NITI system include determining the difference between equation [15] and equation [16], which yields:

rearranging:

equations [19] and [20] represent an example general form of a difference-based data processing method for the DUO NITI system, in which transient effects are accounted for and two sensor nodes are used in parallel. Under steady state conditions, equation [20] reduces to:

rearranging:

in this example, the thermal contact resistance of each sensor node When known, equation [20]]And equation [22]]Can be used to determine the steady state thermal resistance of an object
 Which is based on and thus indicates the internal parameters of the object. Thus, if desired, the steady-state thermal resistance of the object when values are determined (e.g., predetermined, estimated, etc.) for one or more other internal parameters
 May be used to determine one or more internal parameters of the object. Non-limiting examples of this are provided below.
If an estimate of the thermal contact resistance at the sensor node is made Unknown, determinable (e.g., by the exemplary CHFT + or CHFT-processes described above) or otherwise determined (e.g., byE.g., using a predetermined value) to determine the estimate.
When the thermal contact resistance of each sensor node Estimated as negligible untidiness, equation [20]The method is simplified as follows:

and equation [22] reduces to:

when the thermal contact resistance at each sensor node is equal Equation [22]]The method is simplified as follows:

wherein Is the total steady state thermal resistance of the subject, and:

the quotient-based general and exemplary data processing method of the DUO NITI system includes determining a quotient between equation [15] and equation [16], which yields:

rearranging:

equations [27] and [28] represent example general forms of DUO NITI system quotient-based data processing methods in which transient effects are accounted for and two sensor nodes are used in parallel. Under steady state conditions, equation [27] reduces to:

rearranging:

in this example data processing method, the thermal contact resistance at each sensor node When known, equation [28]And equation [30]]Can be used for determining the internal temperature distribution of an object
 . If an estimate of the thermal contact resistance at the sensor node is made
 Unknown, the estimate may be determined (e.g., by the example CHFT + or CHFT-processes described above) or otherwise determined (e.g., by a predetermined value).
Thermal contact resistance at each sensor node Estimated as negligible untidiness, equation [28]The method is simplified as follows:

and equation [30] reduces to:

when the thermal contact resistance at each sensor node is equal Equation [32 ]]Is also equation [30]]In the form of (1).
As previously mentioned, in view of the response function The existence of, for example, non-limiting and example transient forms of differential and quotient-based data processing methods are typically unique for each NITI application and thermal model. However, the steady state form of the non-limiting and exemplary data processing method, e.g., difference and quotient based, is generally generic and applicable to almost any NITI application and corresponding thermal model.
FIG. 17 illustrates an example NITI system that performs NITI using a parallel heat flux sensor-temperature sensor pair (i.e., a DUO NITI system) to determine one or more internal properties of a subject. Two NITI sensors (one referred to as "first" and the other as "second" to distinguish them) are shown (although more than two NITI sensors may be used), and each NITI sensor (e.g., CHFT + or CHFT-) includes a temperature sensor and a heat flux sensor (i.e., a heat flux sensor-temperature sensor pair). In other example embodiments, each NITI sensor may include more than one temperature sensor and/or more than one heat flux sensor. The configuration of the temperature sensor and the heat flux sensor of each NITI sensor relative to each other, relative to another NITI sensor, and the subject may be as shown in any of the non-limiting examples shown in fig. 12-16. The analog signal outputs from the temperature sensors and heat flux sensors (corresponding to the measured temperature sensor and measured heat flux sensor analog signals from each NITI sensor) are provided over suitable communication paths (e.g., electrical conductors) and converted to digital signals by Data Acquisition (DAQ) circuitry, which may include, for example, one or more analog-to-digital converters (ADCs), microcontrollers, etc. The DAQ circuitry provides the measured temperature sensor and measured heat flux sensor digital signals to the control circuitry over a suitable communication path (e.g., electrical conductors, radio signals, etc.) for processing as described above and further below. The control circuitry may comprise one or more suitably configured computers, microprocessors, DSPs, FPGAs or other data processors. Suitable configurations of the control circuit may be implemented in hardware, software or a combination. The control circuitry includes or communicates with outputs such as a display, a network, a cloud computer system, a communication device such as a cellular telephone, wearable technology, and the like. The output may also be used for one or more control operations, such as sensor enablement and disablement, remote monitoring, measurement start/stop, external thermal device operation, data logging, temperature control, energy flow control, system fault control, preventative maintenance control, diagnostics, system performance, data input, data display, analysis, and the like. In the present non-limiting example, each external thermal device is controlled using a respective repeater (i.e., switch) as applicable (e.g., when using the CHFT + node), and the repeaters are operated by a repeating signal from the DAQ, which in turn provides a repeating signal according to an input from the control circuit.
FIG. 18A is a flow chart illustrating an example process of a differential-based data processing method executed by control circuitry to determine one or more internal parameters (i.e., internal parameters) of a subject using two parallel NITI sensors (one referred to as "first" and the other as "second" to distinguish between them). The measured surface temperature (i.e., measured sensor temperature) from the temperature sensor in each of the first and second NITI sensors at one or more specified times and the measured surface heat flux from the heat flux sensor in each of the first and second NITI sensors at one or more specified times are input to the control circuit. One or more internal parameters (e.g. of 、
、 、
、 、
、 、
、 Etc.) initial values at one or more specified times and thermal contact resistance values at each sensor node
 Also input to the control circuit. The control circuit then uses a differential-based data processing method, which is based, for example, on equation [20]]One or more internal parameters are determined at one or more specified times. Finally, the control circuitry generates information (e.g., for output) corresponding to one or more accurate values indicative of an internal parameter of the object, e.g.
 、
、 、
、 、
、 、
、 And the like.
FIG. 18B is a flow chart illustrating an example process of a differential-based data processing method performed by the control circuitry to use two NITI sensors (one referred to as a "NITI sensor") under steady state conditionsIs "first" and the other is called "second" to distinguish them) determines the steady state thermal resistance (internal parameter) of the subject. The measured temperature (i.e., measured sensor temperature) from the temperature sensor in each of the first and second NITI sensors at one or more specified times and the measured heat flux from the heat flux sensor in each of the first and second NITI sensors at one or more specified times are input to the control circuit. Thermal contact resistance value at each sensor node Also input to the control circuit. The control circuit then uses a differential-based data processing method, which is based, for example, on equation [22]]The steady state thermal resistance (internal parameter) of the subject is determined at one or more specified times. Finally, the control circuit generates information (e.g., for output) corresponding to an accurate value indicative of the subject steady-state thermal resistance. Further, if desired, the control circuitry may generate information (e.g., for output) corresponding to one or more accurate values indicative of one or more other internal parameters of the subject, e.g., for output, based on the determined subject steady-state thermal resistance and one or more determined (e.g., predetermined, estimated, etc.) internal parameters
 、
、 、
、 、
、 And the like.
FIG. 19A is a flow chart illustrating an example process of a quotient-based data processing method performed by control circuitry to determine an interior of a subject using two parallel NITI sensors (one referred to as "first" and the other as "second" to distinguish between them)The internal temperature distribution of the region (i.e., internal temperature distribution). The measured temperature (i.e., measured sensor temperature) from the temperature sensor in each of the first and second NITI sensors at one or more specified times and the measured heat flux from the heat flux sensor in each of the first and second NITI sensors at one or more specified times are input to the control circuit. One or more internal parameters (e.g. of 、
、 、
、 、
、 、
、 Etc.) values at one or more specified times and values of thermal contact resistance at each sensor node
 Also input to the control circuit. The control circuit then uses a quotient-based data processing method, which is based, for example, on equation [30]]An internal temperature distribution of an internal region of the object is determined at one or more specified times. Finally, the control circuit generates information (e.g., for output) corresponding to one or more accurate values indicative of the internal temperature distribution of the internal region of the object.
FIG. 19B is a flow chart illustrating an example process of a quotient-based data processing method executed by the control circuitry to determine an internal temperature distribution (i.e., an internal temperature distribution) of an internal region of a subject under steady-state conditions using two parallel NITI sensors (one referred to as "first" and the other as "second" to distinguish between them). Will come from the first and second at one or more specified timesThe measured temperature of the temperature sensor in each of the two NITI sensors (i.e., the measured sensor temperature) and the measured heat flux from the heat flux sensor in each of the first and second NITI sensors at one or more specified times are input to the control circuit. Thermal contact resistance value at each sensor node Also input to the control circuit. The control circuit then uses a quotient-based data processing method, which is based, for example, on equation [32 ]]An internal temperature distribution of an internal region of the object is determined at one or more specified times. Finally, the control circuit generates information (e.g., for output) corresponding to one or more accurate values indicative of the internal temperature distribution of the internal region of the object.
FIG. 20 is a flowchart outlining an exemplary process performed by control circuitry in a non-limiting and exemplary NITI system including a parallel NITI sensor node (i.e., DUO NITI system) based NITI sensor and a differential based data processing method for determining one or more internal parameters of a subject at one or more specified times. The control circuit receives a first measured temperature signal from a temperature sensor of a first non-invasive heat flux sensor-temperature sensor pair at one or more specified times (step S7). The control circuit receives a first measured heat flux signal from a heat flux sensor of the first non-invasive heat flux sensor-temperature sensor pair at one or more specified times to determine a measure of heat transfer at the surface away from or into the object at the one or more specified times (step S8). The control circuit receives a second measured temperature signal from a temperature sensor of a second non-invasive heat flux sensor-temperature sensor pair at one or more specified times (step S9). The control circuit receives a second measured heat flux signal from a heat flux sensor of a second non-invasive heat flux sensor-temperature sensor pair to determine a measure of heat transfer at the surface away from or into the object at one or more specified times (step S10). The control circuit determines an initial value of each internal parameter at one or more specified times (step S11). The control circuit then determines one or more internal parameters of the subject at one or more specified times based on the measured temperature signals from the temperature sensors of the first and second non-invasive heat flux sensor-temperature sensor pairs at one or more specified times, the measured heat flux signals from the first and second non-invasive heat flux sensor-temperature sensor pairs at one or more specified times, and the initial values of the internal parameters at one or more specified times (step S12). The control circuit generates information (e.g., for output) indicative of one or more internal parameters of the object at one or more specified times (step S13). In subsequent processes performed by the control circuit (i.e., at one or more future designated times), the control circuit may determine initial values of the one or more internal parameters in step S11 based on the values of the one or more internal parameters previously determined in step S12 (i.e., at the one or more designated times). Further, the control circuit may perform steps S7 through S11 in any order and is not limited to the order specified in this non-limiting process example. In a steady state condition, the control circuit may optionally not perform step S11 and/or not use the initial values of the internal parameters in step S12. The control circuitry may further perform steps to determine and account for one or more effects associated with thermal contact resistance between a temperature sensor of the first non-invasive heat flux sensor-temperature sensor pair and the surface of the object, and/or one or more effects associated with thermal contact resistance between a temperature sensor of the second non-invasive heat flux sensor-temperature sensor pair and the surface of the object.
FIG. 21 is a flowchart outlining an exemplary process performed by control circuitry in a non-limiting and exemplary NITI system including a parallel NITI sensor node-based (i.e., DUO NITI system) NITI sensor and a quotient-based data processing method for determining an internal temperature distribution of an internal region of a subject at one or more designated times. The control circuit receives a first measured temperature signal from a temperature sensor of a first non-invasive heat flux sensor-temperature sensor pair at one or more specified times (step S14). The control circuit receives a first measured heat flux signal from a heat flux sensor of the first non-invasive heat flux sensor-temperature sensor pair at one or more specified times to determine a measure of heat transfer at the surface away from or into the object at the one or more specified times (step S15). The control circuit receives a second measured temperature signal from a temperature sensor of a second non-invasive heat flux sensor-temperature sensor pair at one or more specified times (step S16). The control circuit receives a second measured heat flux signal from a heat flux sensor of the second non-invasive heat flux sensor-temperature sensor pair measured at one or more specified times to determine a measure of heat transfer at the surface away from or into the object at the one or more specified times (step S17). The control circuit determines the value of each internal parameter at one or more specified times (step S18). The control circuit then determines an internal temperature distribution of the internal region of the subject at one or more specified times based on the measured temperature signals from the temperature sensors of the first and second non-invasive heat flux sensor-temperature sensor pairs at the one or more specified times, the measured heat flux signals in the first and second non-invasive heat flux sensor-temperature sensor pairs at the one or more specified times, and the internal parameter values at the one or more specified times (step S19). The control circuit generates information (e.g., for output) indicating the internal temperature distribution of the internal region of the object at one or more specified times (step S20). Further, the control circuit may perform steps S14-S18 in any order and is not limited to the order specified in this non-limiting process example. In steady state conditions, the control circuit may optionally not perform step S18 and/or not use the values of the internal parameters in step S19. The control circuitry may further perform steps to determine and account for one or more effects associated with thermal contact resistance between a temperature sensor of the first non-invasive heat flux sensor-temperature sensor pair and the surface of the object, and/or one or more effects associated with thermal contact resistance between a temperature sensor of the second non-invasive heat flux sensor-temperature sensor pair and the surface of the object.
Additional example processes performed by control circuitry in the non-limiting and example NITI system that includes the parallel NITI sensor node-based NITI sensor may include one or more data processing methods. For example, the NITI system may include both a differential-based data processing method and a quotient-based data processing method for determining (e.g., calculating) one or more internal parameters of the subject and determining (e.g., calculating) an internal temperature distribution of an internal region of the subject, respectively. For example, the NITI system may perform multiple data processing methods subsequently or simultaneously. In other example embodiments, the data processing method may determine the one or more internal attributes based on a combination of a plurality of data processing methods.
Example DUO NITI embodiments may utilize control circuitry to maintain prescribed heat flux and temperature conditions. For example, the control circuit may be used to maintain a steady state condition by adjusting the power provided to an external thermal device (e.g., a heater). In other example embodiments, the control circuit may adjust the amount and/or temperature of heat flux occurring at one sensor node to a constant multiple of the heat flux and/or temperature occurring at another sensor node.
Similar conditions can further be achieved without a control circuit. For example, a specified amount of thermal insulation on each sensor node may also be used to adjust the heat flux or temperature occurring at each sensor node to, for example, a constant multiple of another sensor node.
Creating an environment in which heat flux and/or temperature occurring at a sensor node passes through, for example, a constant multiple To allow further simplification of the DUO NITI system and data processing method.
For example, if control circuitry and/or thermal insulators are used to maintain the following relationship between the heat fluxes occurring at each sensor node:

equation [27] can be rewritten as:

this is simplified as:

assuming negligible or equivalent thermal contact resistance at each sensor node :
:

In this example, equation [35 ]]And equation [36 ]]Simplified real-time internal temperature applicable to a given object Measured against transient heat transfer effects over time (e.g. by response function)
 ) And/or internal parameters of the object without any consideration.
Example applications
Example embodiments are now described for different example applications and methods of NITI. Some of these examples have experimental data results based on tests performed by the inventors. This is not meant to be an exhaustive list of applications or methods, but rather to illustrate exemplary NITI methods that may be used. Furthermore, the example NITI methods are not limited to the applications and/or example embodiments listed below, and may be used and/or used as a basis for other example NITI methods of different applications and/or example embodiments.
Experimental data results are based on an example NITI sensor embodiment that includes one or more heat flux sensors based on differential thermopile technology and one or more temperature sensors based on thin film thermocouple technology. However, similar results can be obtained regardless of the type of heat flux sensor or temperature sensor used (e.g., RTD temperature sensor, fiber optic temperature sensor, NTC temperature sensor, thermistor, thermopile, etc.).
Blood perfusion measurement applications
One application is blood perfusion (flow) in tissue, as shown in the example embodiment depicted in fig. 22. The NITI sensor (CHFT +) is shown in contact with tissue. The tissue (i.e., the subject) includes a number of internal parameters, including blood perfusion Thermal conductivity of tissue
 Tissue density
 And tissue heat capacity
 . With tissue depth
 Increasing, internal temperature distribution of tissue
 Near core blood temperature
 . In this example application, core blood temperature is given by the fact that most living tissue consists of blood
 Assumed to be equal to core tissue temperature (I.e., in thermal equilibrium therewith).
Table 2 below sets forth an exemplary thermal mathematical model of biological heat transfer, which includes the effects of blood perfusion in tissue.
TABLE 2 mathematical model of tissue heat with heat flux boundary conditions (based on the Pennes Biothermal equation)

When evaluating on tissue surfaces TABLE 2 solution of the thermal mathematical model (internal temperature distribution)
 ) The method comprises the following steps:

wherein the initial tissue surface temperature is:

and wherein the heat flux is defined as positive when entering the tissue.
Rewrite equation [37] according to NITI sensor output]And includes a thermal contact resistance between the NITI sensor and the tissue surface The influence of (a) to obtain:

wherein Is a groupSteady state thermal resistance of fabric
 。
。
In this non-limiting example, the core blood temperature It is assumed to be constant and invariant over time. However, if the core blood temperature
 Not constant, the influence may be related to an internal parameter (e.g. blood perfusion)
 ) The effect of the variation correlation is different. This is due to differences in one or more of the effects of these changes. For example, in some cases, perfuse with blood
 The effect related to the change of (b) can be realized, for example, by a change of the surface temperature, which in this case is the equation [39]]The result of the non-linear expression of (c). However, with core blood temperature
 Can be realized, for example, by a change in surface temperature, which in this example is the equation [38]]And equation [39]]The results of the linear expressions found in the combination. The difference in linear and non-linear effects allows for differences in root cause (e.g., core blood temperature)
 Or changes in internal parameters). In addition, other thermal mathematical models can be derived to account for core blood temperature
 And in this non-limiting example is assumedCore blood temperature
 Constant relative, which varies with time.
Blood perfusion-periodic measurement embodiment Using parameter estimation
For example NITI sensor embodiments (e.g., CHFT + or CHFT-) used with periodic data processing methods, equation [39] may be used in a parameter estimation scheme]To determine blood perfusion Internal parameter of (2), core blood (i.e. tissue) temperature
 And/or thermal contact resistance between the NITI sensor and the tissue surface
 . This is similar to the general case given as an example of an embodiment of the NITI system, with one or more heat flux sensor-temperature sensor pairs in the above section, but with different thermal models for different NITI applications. In this example, tissue thermal conductivity is used
 Tissue density
 And tissue heat capacity
 Is predetermined constant value. In this example application, an example objective function to be minimized is:

wherein:

and wherein:

example CHFT + embodiments (with heater) were tested on a biopsy simulator capable of creating a controlled water perfusion and temperature environment in the pseudo tissue. This simulator is referred to as a phantom tissue system or phantom. CHFT + was placed on the pseudo-tissue at different flow rates (perfusion rates) and measured as follows:
Heater on for about 65 seconds, resulting in CHFT + tissue transient thermal response as measured by surface heat flux and surface temperature signals.
-the whole data is processed by a periodic data processing method comprising a parameter estimation scheme in less than 1 second, resulting in perfusion Core water temperature
 And thermal contact resistance between CHFT + and the surface of the pseudo tissue
 To output of (c).
Table 3 results of an example blood perfusion CHFT + embodiment with a periodic parameter estimation data processing method

As can be seen from table 3, perfusion was paired using the exemplary CHFT + example And 15 with the estimated value of
 And 20
 Phantom CFD models (i.e., phantoms) of flow rate are very consistent. 10
 And 25
 Subject to a difference of 21.94% and 12.47%, respectively. This may be because it is difficult to maintain 10 when the inventors perform experimental data collection
 And 25
 The flow rate. When these flow rates are set, the flow rates will typically be greater than expected and will result in higher flow measurements compared to the phantom model. Note blood perfusion
 Is expressed as
 Wherein a measurement of the blood flow rate (e.g., milliliters of insufflation flow per second) through a volume of tissue (e.g., millimeter tissue) is provided. In these example embodiments tested on a phantom tissue system, blood perfusion is instead designated as perfusion and the blood flow rate is instead the water flow rate.
In some exemplary embodiments, blood perfusion Can be further simplified into
 . In other exemplary embodiments, blood perfusion
 May be combined with the density values to provide a blood flow rate measurement through a given mass of tissue (e.g., 100 grams).
In addition, the perfusion The estimated value of (c) increases with increasing flow rate. In addition, the thermal contact resistance
 Relatively constant, which indicates its consistency throughout the experimental measurement, as expected. Estimated core temperature of perfusion water
 With recording of the temperature of the irrigation water in phantom using an immersed bead thermocouple
 The matching is good. The largest difference occurs at about 25
 0.24 of (C)
 。
。
To demonstrate the determination of optimal perfusion in this data processing method when used with experimental data Capability of parameter estimation scheme used in value, equation [40]Example objective function (i.e., RMSE) of (1) and (15)
 Under the condition of pouring
 The relationship between them is shown in fig. 23. The graph in FIG. 23 illustrates this relationship in perfusion
 With a global minimum at value 0.0360 s-1. This corresponds to 15
 The estimated values of perfusion in the cases are shown in table 3.
For 15 In this case, fig. 24 is a graph illustrating an example of matching between the calculated (output) sensor temperature profile and the measured (input) sensor temperature profile. Matching between two temperature curves indicates an internal parameter value
 And for passing equation [41 ]]Constructing thermal contact resistance of calculated (output) sensor temperature profile
 The values are the same as the actual values occurring in the tissue (i.e., the object). Incorrect values may result in a poor match, as shown for example in fig. 25.
As previously mentioned, in this example, tissue thermal conductivity Tissue density
 And tissue heat capacity
 As constant values in the above-described exemplary data processing method for perfusion measurementInput to determine internal parameters of tissue thermal inertia
 . Another method of determining tissue thermal inertia is, for example, through one or more parameter estimation schemes as part of the data processing method.
One example method of estimating the thermal inertia of the tissue may be to define different objective functions for different time periods during which surface measurements are taken. This is possible because the calculated (output) sensor temperature profile has different internal parameter sensitivities over time, and thus each internal parameter (e.g., the output temperature profile) has a different sensitivity And
And ) The effect of (c) can be resolved. Thus, the internal parameter values can be estimated individually. Fig. 26 shows different sensitivities of the calculated (output) sensor temperature profile to internal parameters. In particular, thermal conductivity to tissue during an initial period of time
 Tissue density
 And tissue heat capacity
 Greater sensitivity to blood perfusion
 Is initially minimal but increases over time. Thus, for example, in a data processing method that may include a parameter estimation scheme, the determination is designed
 The objective function of the estimated value of (a) can be defined asIncluding an initial period of time, designed to determine
 The objective function of the value of (a) may be defined to include the following time period. Further, the objective function may be defined to operate simultaneously or in a prescribed order (e.g., one after the other).
Another method for determining tissue thermal conductivity Tissue density
 And tissue heat capacity
 Is after tissue thermal conductivity has been used
 Tissue density
 And tissue heat capacity
 Is determined by a predetermined value of
 After the values, they are calculated. For example, once the tissue thermal conductivity, for example, has been used
 Tissue density
 And tissue heat capacity
 Determines the optimal blood flowPerfusion
 Value, quantity
 For example, equation [43 ] can be used]The calculation is as follows:

wherein the right blood perfusion When using the thermal conductivity of the tissue
 Tissue density
 And tissue heat capacity
 Determined at a predetermined (i.e. previous) value of
 The value is obtained.
Based on, for example, equation [43]Can be used in a variety of methods to determine tissue thermal conductivity Tissue density
 And tissue heat capacity
 The product of (a). For example, there may be a single or multiple indices
 The measurement is performed. In the case of multiple indices, for example, the average of the result values may be used as the determination value. If it is desired that,
 can update the previously determined values and be used to re-estimate blood perfusion
 The value is obtained. The more this routine is practiced, the thermal inertia of the tissue
 And blood perfusion
 The more accurate the determination value can become. The non-limiting example NITI method may be used for some or all of the example NITI embodiments and/or applications.
Blood perfusion-real-time measurement embodiment Using parameter estimation
In an example blood perfusion-periodic measurement embodiment using parameter estimation, data processing by the control circuitry begins after all measurements are taken. Thus, in the experimental phantom test above, the measurement results are output in a periodic manner approximately every 75 seconds. NITI sensor (e.g., CHFT + or CHFT-) data can alternatively be processed in real-time to provide blood perfusion Core body temperature
 And/or thermal contact resistance between the NITI sensor and the tissue surface
 Real-time output of (2). More data points are added to the surface heat flux and surface processed in real time by the data processing method over timeIn the temperature profile, the data processing method includes a parameter estimation scheme and outputs values in less than 1 second.
Blood perfusion-real-time measurement embodiment without parameter estimation
Equation [39] can be rearranged as:

wherein:

combining equation [44] and equation [45 ]:

thermal contact resistance between NITI sensors (e.g., CHFT + or CHFT-) and tissue surface Known and tissue thermal conductivity
 Tissue density
 And tissue heat capacity
 When the typical value of (A) is entered, when the blood perfusion is present
 Equation [46] with typical values of]Can be used for real-time blood perfusion measurement. In some exemplary embodiments, for example, when blood perfusion
 When changes in (2) are of interest, the number
 May be assumed at one or more specified times. In other example embodiments, the number
 May be determined, for example, by using an additional temperature sensor; the output of which is indicative of the tissue surface and/or core (i.e., internal) tissue temperature.
Although the calculated blood perfusion on the left side The values will not be precise but will still be sufficient to make accurate quantitative and/or qualitative measurements. In addition, to obtain the most accurate results, the right side blood perfuses
 Is updatable to reflect the value of (c) by equation [46]The latest and/or accurate value calculated. In other methods, blood perfusion is left or right sided
 The values may be determined simultaneously, thereby providing an accurate quantitative measurement. This may omit the right side entry of a typical blood perfusion
 The value requirement. If the thermal contact resistance is
 The value is unknown, it may be determined (e.g., by the NITI process described above) or otherwise determined and accounted for. In some cases, the thermal contact resistance
 May be estimated to be negligible.
Furthermore, under steady state conditions, equation [46] reduces to:

equation [47 ]]The right side no longer requires typical blood perfusion The value is obtained. The steady state condition can be achieved in a variety of ways, including by a control circuit that regulates the heat flux and/or temperature occurring at the tissue surface via an external thermal device (e.g., heater, cooler, etc.).
Blood perfusion-DUO NITI sensor embodiment
For an example DUO NITI sensor embodiment when first and second parallel NITI sensor nodes (each node having a heat flux sensor-temperature sensor pair) are used, two independent equations are formed:

using the example difference-based data processing method, equations [48] -49 result in:

when tissue thermal conductivity is input on the right Tissue density
 Specific heat capacity of tissue
 And blood perfusion
 When it is, theThe transient equations are the result of the DUO NITI sensor configuration and allow real-time blood perfusion
 Measuring regardless of core blood temperature
 How is it done.
Although the calculated blood perfusion on the left side The values will not be exact but will nevertheless be very close enough to make accurate quantitative and/or qualitative measurements. Furthermore, in order to obtain the most accurate results, blood perfusion
 May be updated to reflect the passing equation [50]The latest and/or accurate value calculated. In other methods, blood perfusion is left or right sided
 The values may be determined simultaneously, thereby providing an accurate quantitative measurement. This may omit the right side input of a typical blood perfusion
 The value requirement.
Thermal contact resistance between each NITI sensor (e.g., CHFT + or CHFT-) and the tissue surface May be determined (e.g., by the NITI process described above) or otherwise determined. In some cases, the thermal contact resistance
 May be estimated to be negligible.
Under steady state conditions, equation [50] reduces to:

wherein the right side no longer requires a typical blood perfusion The value is obtained. The steady state condition can be achieved in a number of ways, including control circuitry that regulates the heat flux and/or temperature occurring at the tissue surface via external thermal devices (heaters, coolers, etc.).
FIG. 27 is a graph showing a flow rate profile for different flow rates 30 、20
、20 、10
、10 Measuring perfusion of pseudo-tissue on a phantom
 A graph illustrating the results of the DUO CHFT + embodiment. The graph shows that an example DUO CHFT + embodiment can be used initially at 30
 (perfusion)
 A rate of about 0.035
 ) Determining perfusion of pseudo-tissue on phantom when turned on
 . Subsequently, after about 10 minutes, when the phantom flow rate was adjusted to 10
 (perfusion)
 At a rate of about 0.020
 ) And later increased to 20
 (perfusion)
 At a rate of about 0.027
 ) Time, example DUO CHFT + example perfusion was determined in real time
 Wherein the experimental measurement ends after about 10 minutes. To illustrate the accuracy and consistency of the example DUO CHFT + method in real-time, a different example NITI method for perfusion measurement (CHFT + periodic method) was also used to determine the perfusion rate at each specified flow rate. The agreement between the two measurements indicates that the two methods are determining tissue perfusion
 The effectiveness in terms of rate.
Application of measurement of tissue hydration
All of the exemplary methods and embodiments described above for blood perfusion measurement may also be used for determining Which is the tissue steady state thermal resistance defined in these example methods
 . Tissue steady state thermal resistance
 Can be an accurate and reliable indicator of tissue hydration. For example, correlations can be developed and used as a means to gauge tissue hydration and dehydration levels based on, for example, tissue steady-state thermal resistance. Indicating blood perfusion
 Or other independent values of internal parameters, may also be used to gauge tissue hydration and dehydration levels.
Tissue core temperature measurement applications
Combining equation [37] and equation [38 ]:

rewrite equation [52 ] according to NITI sensor output]And including thermal contact resistance between the NITI sensor and the tissue surface The influence of (a):

rearrangement and recognition Dependent on the value (measurement index (m))

Equation [54]]Is the core tissue temperature Example equations for the measurements are used in the example embodiments below. For some of these example embodiments, tissue thermal conductivity
 Tissue density
 Specific heat capacity of tissue
 Thermal contact resistance between NITI sensor and tissue surface
 And/or blood perfusion
 The value of (c) needs to be determined. This may be achieved by, for example, determining these values (e.g., by the CHFT + or CHFT-methods described previously) or by, for example, using predetermined values (e.g., values from textbooks).
Tissue core temperature-CHFT + (active thermometry) embodiment
The CHFT + embodiment uses an integrated external thermal device (e.g., heater) to create a thermal event (i.e., heat transfer) that can be used to perform the NITI. For core tissue temperature Measuring, the heater can be operated in any way (steady, periodic, cyclic, etc.) and, in this example, when blood perfusion is input on the right side
 Thermal conductivity of tissue
 Tissue density
 Tissue heat capacity
 And estimated thermal contact resistance
 When the value of (c) is equal to (4)]Will output the core tissue temperature accurately and in real time
 . These values may be determined or otherwise determined and accounted for, for example, using data processing methods (e.g., which include parameter estimation schemes). In some cases, the thermal contact resistance
 May be estimated to be negligible. Although not required, it may be beneficial to cover the CHFT + with an insulating material to prevent false signals from external stimuli (e.g., operation, contact, etc.).
FIG. 28 is a graph showing a method for operating a switch at 2 Flow rate measurement phantom for pseudo-tissue core temperature
 The results of the CHFT + embodiment (with integrated heater) are illustrated. In this graph, it is shown that an example CHFT + embodiment is able to determine the pseudo tissue core temperature on a phantom
 (i.e. (internal) measurement) regardless of the surface temperature conditions. Specifically, the surface temperature initially increases due to the integrated heater being turned on. Subsequently, after a period of time, the surface temperature decreases due to external fan (i.e., thermal disturbance) blowing air on the exemplary CHFT + embodiment. Despite these sudden and unexpected changes in ambient thermal conditions, the example CHFT + embodiments measure the core temperature of the pseudo-tissue in close agreement with an internal probe placed within the phantom and under the pseudo-tissue
 。
。
Tissue core temperature-CHFT- (Passive thermometry) example
CHFT-embodiments use external thermal events (such as, for example, mammalian body heat dissipation) to perform NITI. For example, when subjected to an external thermal event, when blood perfusion is infused on the right side Thermal conductivity of tissue
 Tissue density
 Tissue heat capacity
 And estimated thermal contact resistance
 Equation [54]]Will output the core tissue temperature accurately and in real time
 . These values may be determined or otherwise determined and accounted for, for example, using data processing methods (e.g., including parameter estimation schemes). In some cases, the thermal contact resistance
 May be estimated to be negligible. Although not required, it may be beneficial to cover the CHFT-with an insulating material to prevent false signals from external stimuli (e.g., operation, contact, etc.).
FIG. 29 is a chart showing a method for operating the system at 2 Flow rate of flowRate measurement of pseudo-tissue core temperature on phantom
 The results of the CHFT-example are illustrated. In this graph, an example CHFT-embodiment is shown that is capable of determining the pseudo tissue core temperature on a phantom
 (i.e. (internal) measurement) regardless of the surface temperature conditions. Specifically, while the surface temperature is initially stable, the external fan (i.e., thermal perturbation) cycles (i.e., turns on and off) to blow on the exemplary CHFT-embodiment and the dummy tissue. Despite these sudden and unexpected changes in ambient thermal conditions, the example CHFT-embodiments measure the core temperature of the pseudo-tissue in close agreement with an internal probe placed within the phantom and under the pseudo-tissue
 。
。
Tissue core temperature-CHFT + (periodic measurement) example
In addition to the example real-time methods and embodiments described above for tissue core temperature measurement, the core tissue temperature may also be performed using a NITI sensor (e.g., CHFT + or CHFT-) while operating under different steady-state conditions Is measured periodically. For example, thermal events
 Previous steady state measurements may be associated with thermal events
 The steady state measurements at, after, or at the end of the period are compared to determine the core tissue temperature using the following equation
 :
:

Both the CHFT + and/or CHFT-example embodiments may experience different steady state conditions over time. However, the CHFT + embodiment is preferred due to increased operational control of one or more external thermal devices that may be used to create different steady state conditions.
Core temperature-CHFT + (zero Heat flux thermometry) example
Using the control circuitry, the example CHFT + embodiments can be used to create a zero heat flux environment in which no heat transfer occurs between the tissue and the sensor surface, i.e., in which the heat flux sensor measures no heat entering or exiting the tissue (minimum voltage output, i.e., "zero"). Under steady state conditions, a zero heat flux environment reduces equation [54] to:

wherein the measured sensor temperature Corresponding to the core temperature of the tissue
 。
。
One advantage of this approach is that once a steady state zero heat flux environment is achieved, the core tissue temperature Measurement and internal parameter values (e.g. blood perfusion)
 Tissue thermal inertia (
 ) Etc.) and thermal contact resistance
 Is irrelevant. From measured sensor temperature
 The amount of time determined to be required to reach such steady state conditions is output, varies according to the example embodiment used, and is a common limitation of existing zero-heat-flux techniques that do not utilize the NITI technique. Prior to obtaining a steady-state zero-heat-flux environment, the example NITI zero-heat-flux thermometry embodiments may utilize other example embodiments, such as the example active thermometry embodiments for core temperature measurement of tissue, to perform core tissue temperature
 Accurate measurement of.
FIG. 30 is a graph showing a method for operating a switch at 2 Flow rate measurement phantom for pseudo-tissue core temperature
 The results of the CHFT + Zero Heat Flux (ZHF) example are illustrated. The figure shows that the exemplary CHFT + ZHF embodiment is able to determine the pseudo tissue core temperature on the phantom without delay and regardless of the surface temperature conditions
 . Specifically, although the surface temperature takes about 8 minutes to achieve the indication of the pseudo-tissue core temperature
 When compared to an internal probe placed inside the phantom and under the tissue, the exemplary CHFT + ZHF embodiment measures the pseudo-tissue core temperature with close consistency from the start
 。
。
Core temperature-DUO NITI (Dual temperature measurement) embodiment
For the example DUO NITI embodiment, when first and second parallel NITI sensor nodes (each having a heat flux sensor-temperature sensor pair) are used, two independent equations are formed:

using a quotient-based data processing method, equation [57 ]/equation [58] yields:

rearranging:

the transient equation is the result of the DUO NITI configuration and when the tissue thermal conductivity is input on the right Tissue density
 Specific heat capacity of tissue
 And blood perfusion
 Typical value of (a) allows real-time core tissue temperature
 And (6) measuring.
Thermal contact resistance between each NITI sensor node (e.g., CHFT + or CHFT-) and the tissue surface The estimated value of (a) may be determined (e.g., by the NITI process described above) or otherwise determined and accounted for. In some cases, the thermal contact resistance
 May be estimated to be negligible.
Under steady state conditions, and or
or And
And equation [60 ] with negligible estimation]The method is simplified as follows:

wherein tissue thermal conductivity is no longer required on the right Tissue density
 Specific heat capacity of tissue
 And blood perfusion
 Typical values of (a). The steady state condition can be achieved in a variety of ways, including control circuitry that regulates the heat flux and/or temperature occurring at the tissue surface via external thermal devices (e.g., heaters, coolers, etc.).
Pipeline parameter determination applications
FIG. 31 illustrates another application of the NITI technique for determining one or more internal parameters associated with fluid flow in a pipe or other conduit. In this example, a heater (example CHFT + embodiment) is used, but in other examples, a heater (i.e., external thermal device) is optional.
An example thermal mathematical solution for a pipe or other conduit (e.g., copper pipe) having an internal flow when subjected to a surface heat flux is:

wherein the initial pipe surface temperature is:

wherein the heat flux is defined as positive when entering the pipe/conduit, and wherein Is the thermal time constant (i.e. time constant) of the pipe/conduit,
 is the density of the pipe/conduit and,
 is the specific heat capacity of the pipe/conduit,
 is the wall thickness of the pipe/conduit,
 is the internal convective heat transfer coefficient (i.e. convection coefficient) of the tube/conduit and is related to the internal flow velocity (i.e. flow velocity) of the tube/conduit,
 is the pipe/conduit surface temperature, and
 is the core (i.e., internal) fluid temperature.
Rewrite equation [62] according to NITI sensor output]And includes thermal contact resistance between the NITI sensor and the pipe/conduit surface The effect of (a) is obtained:

wherein Steady state thermal resistance being convective internal flow rate
 。
。
Equations [62] and [64] are valid for pipes or conduits made of high thermal conductivity materials. For other materials, such as PVC, different thermal models and corresponding solutions may need to be developed. Other thermal models and solutions may also be developed for materials with high thermal conductivity.
In this example, the flow rate The larger the heat convection coefficient
 The larger.
 And
And the relationship between is generally not linear except at low (e.g., laminar) flow rates, and thus the correlation function between the two variables is a sumAs desired. Such a correlation function can be found, for example, by experimental tests. One relevant example of experimental findings when CHFT + was run on L-shaped copper tubing having microspheres of (0.01905 m) internal diameter and 0.05 "(0.00127 m) wall thickness was:

rearranging:

therefore, the convection coefficient And rate of flow
 An example general form of correlation between may be as follows:

wherein And
And is the correlation value.
Other forms of correlation may be developed depending on the mathematical technique used (e.g., logarithmic function, exponential, etc.).
FIG. 32 is a chart showing how example correlations may be developed through experimental measurements. In this example, the correlation was found by plotting the experimental results measured at different flow rates. After a sufficient number of measurements at different flow rates, the best-fit curve (e.g., trend line) can be used to find the convection coefficient that will be measured And rate of flow
 Correlation (i.e., equation) of a correlation (or vice versa).
In other example embodiments, correlation functions and/or other convective heat transfer coefficients And rate of flow
 The methods of correlation (or vice versa) may be determined using machine learning methods (e.g., neural networks, etc.).
Pipeline application-periodic measurement embodiment using parameter estimation
For example NITI sensor embodiments using a periodic data processing method (e.g., CHFT + or CHFT-), equation [64] may be used in the parameter estimation scheme]To determine the convection coefficient Core (i.e. internal) fluid temperature
 And/or thermal contact resistance between the NITI sensor and the surface of the pipe/conduit
 Internal parameters of (2). This is similar to the general case presented as an example, such as the above section's NITI system embodiments with one or more heat flux sensor-temperature sensor pairs, but with different thermal models for different NITI applications. In this example, the pipe density
 Heat capacity of pipeline
 And pipe wall thickness
 Is used. In this example, the predetermined value is obtained from the pipeline manufacturer specifications. In this example application, an example objective function to be minimized is:

wherein:

and wherein:

the exemplary CHFT + examples (with heater) were tested on L-shaped copper tubing having an inner diameter of microspheres "(0.01905 m) and a wall thickness of 0.05" (0.00127 m) through which water flowed at various flow rates and temperatures. CHFT + was attached to the pipe surface and measured as follows:
The heater was turned on for about 65 seconds, resulting in CHFT + transient thermal response of the tube wall as measured by surface heat flux and surface temperature signals.
-the whole data is processed by a periodic data processing method comprising a parameter estimation scheme in less than 1 second, resulting in convection coefficients Core water temperature
 And the thermal contact resistance between the CHFT + and the pipe surface
 。
。
Once convection coefficient After determination, it is used in a correlation equation (e.g., equation [66 ]]) To determine flow rates associated with fluid mass flow rates and velocities (e.g., kg/s and m/s). The results are tabulated in table 4 below.
Table 4 pipe parameter determination results (exemplary CHFT + embodiment with periodic parameter estimation)


To demonstrate that the parameter estimation scheme used in the data processing method when used with experimental data is determining the optimal convection coefficient Ability in value, 10
 Equation in the case [68]Example objective function (i.e., RMSE) and convection coefficient of (1)
 The relationship between them is shown in fig. 33. The graph in FIG. 33 illustrates this relationship in terms of convection coefficient
 Value 1690
 Has a global minimum. This is shown in Table 4 at 10
 The estimated values in the case correspond.
For 10 In this case, fig. 34 is a graph illustrating an example of matching between the calculated (output) sensor temperature profile and the measured (input) sensor temperature profile. An indication of a match between the two temperature profiles is used by equation [69 ]]Constructing internal parameter values of a calculated (output) sensor temperature curve
 And a thermal contact resistance
 The value is the same as the actual value occurring in the pipe (i.e., object).
As previously mentioned, in this example, the pipe density Heat capacity of pipeline
 And pipe wall thickness
 Is determined using copper tubing manufacturer specifications and is input as a constant in the example data processing method performed for the pipe parameter determination. Although it is determined as part of the data processing method in this example, the estimated thermal contact resistance
 The value of (c) may also be input as a predetermined value in advance and still achieve a similar result. In this example embodiment, regardless of the thermal contact resistance
 Whether the predetermined value of (2) is accurate, flow rate
 The resulting output can be accurate because of the thermal contact resistance
 The effect of any inaccuracies in the predetermined values of (a) are compensated by correlations developed later.
Defining and determining thermal contact resistance By using a general definition of the heat transfer coefficient
 Wherein:


thus, the thermal contact resistance Can be defined as:

and replaceEquation [70 ]]. To use equation [73]It is often necessary to determine The value of (c). Some determinations
 (i.e. the
 ) Example methods of (a) are described below. In other exemplary embodiments of the present invention,
 it may be assumed or determined in other ways, for example using surface mounted temperature sensors which may be insulated.
Another determination The example method of (a) uses measurements taken under different steady state conditions (e.g., before, at the end of, or after a thermal event):

wherein And
And representing heat flux and surface temperature measurements taken under steady state conditions at the end of a thermal event.
It should be noted that equation [74] requires different steady state conditions, which may be obtained, for example, by taking measurements before and after generating thermal events, for example, by external thermal devices.
Using equation [74] and equation [71 ]:

a method including a parameter estimation scheme and a flow rate The data processing method of the correlation can also be used without distinguishing the convection heat transfer coefficient
 And a thermal contact resistance
 Is performed in the case of (1). Instead, the data processing method may be based on using the total heat transfer coefficient
 Pyrolysis of the expression, e.g. as in equation [76 ]]Shown in the figure:

wherein Using the total heat transfer coefficient
 The calculated (output) temperature profile found. Further, an example objective function in this example embodiment may be:

when estimated thermal contact resistance This approach is particularly useful where the minimum or otherwise estimated negligible uncertainty is present.
Pipeline application-real-time measurement embodiment using parameter estimation
In an example pipeline application-periodic measurement embodiment using parameter estimation, data processing by the control circuitry begins after all measurements are taken. Therefore, in the above experimental pipeline test, the measurement results are output in a periodic manner approximately every 75 seconds. NITI sensor (e.g., CHFT + or CHFT-) data can alternatively be processed in real-time to provide convection coefficients Core fluid temperature
 And/or the thermal contact resistance between the NITI sensor and the tube/conduit surface
 Real-time output of (2). More data points are added to the surface heat flux and surface temperature curves processed in real time by a data processing method including a parameter estimation scheme and outputting values in less than 1 second over time.
Pipeline application-real-time measurement embodiment without parameter estimation
Equation [64] can be rearranged as:

wherein:

combining equation [78] and equation [79 ]:

when the NITI sensor (e.g., CHFT + or CHFT-) is attached to the surface of a conduit/catheterThermal contact resistance between When known, the thermal time constant is input on the right side
 Typical value of (1), equation [80]]Can be used for real-time convection coefficient
 The measurement of (2). Thermal time constant, as described above
 Is convection coefficient
 As a function of (c). Therefore, it is necessary to determine the convection coefficient
 Typical values of (a). In some example embodiments, such as when convection coefficients
 When changes in (2) are of interest, the number
 May be assumed at one or more specified times. In other example embodiments, the number
 May be determined, for example, by using an additional temperature sensor; the output of which is indicative of the pipe surface and/or core (i.e., internal) fluid temperature.
Albeit the calculated convection coefficient on the left The values will not be precise but will still be sufficient to make accurate quantitative and/or qualitative measurements. In addition, to obtain the most accurate results, the right side and the hot time are oftenNumber of
 Coefficient of related convection
 May be updated over time to reflect the passage of equation [80]]The latest and/or accurate value calculated. In other methods, the convection coefficients of the left and right sides
 Can be determined simultaneously, thereby providing an accurate quantitative measurement. This may omit inputting typical convection coefficients at the right side
 The value requirement. If the thermal contact resistance is
 The value is unknown, which may be determined (e.g., by the NITI process described above) or otherwise determined and accounted for. In some cases, the thermal contact resistance
 May be estimated to be negligible.
Convection coefficient to be determined Value from equation [80]]Input to a correlation equation (e.g., equation [66 ]]) Generating corresponding flow rates in real time
 The value is obtained.
Furthermore, under steady state conditions, equation [80] reduces to:

equation [80]]No more typical heat is needed on the right sideTime constant The value is obtained. The steady state condition may be achieved in a variety of ways, including by a control circuit that regulates the heat flux and/or temperature occurring at the surface via external thermal devices (e.g., heaters, coolers, etc.).
For equation [76 ]]Similar rearrangements may also be made wherein the overall heat transfer coefficient Is utilized and results in:

and under steady state conditions:

plumbing application-DUO NITI sensor embodiment
For an example DUO NITI sensor embodiment when first and second parallel NITI sensor nodes (each node having a heat flux sensor-temperature sensor pair) are used, two independent equations are formed:

using an example data processing method based on differences, equation [84] -equation [85] yields:

the transient equation is the result of the DUO NITI sensor configuration and when the convection coefficient is lateral on the right Function of (2) input thermal time constant
 Is allowed to be independent of the core fluid temperature
 In the case of performing real-time convection coefficients
 And (6) measuring.
Albeit the calculated convection coefficient on the left The values will not be precise but will still be sufficient to make accurate quantitative and/or qualitative measurements. Furthermore, to obtain the most accurate results, the right side and thermal time constants
 Coefficient of related convection
 May be updated over time to reflect the passage of equation 86]The latest and/or accurate value calculated. In other methods, the convection coefficients of the left and right sides
 Can be determined simultaneously, thereby providing an accurate quantitative measurement. This may omit inputting typical convection coefficients at the right side
 The value requirement.
Thermal contact resistance between each NITI sensor node (e.g., CHFT + or CHFT-) and the pipe/conduit surface May be determined (e.g., by the above-described NITI process)A program) or otherwise determined and accounted for. In some cases, the thermal contact resistance
 May be estimated to be negligible.
Under steady state conditions, equation [86] reduces to:

where the typical thermal time constant is no longer required on the right The value is obtained. The steady state condition may be maintained in a number of ways, including by a control circuit that regulates the heat flux and/or temperature occurring at each sensor node surface through external thermal devices (e.g., heaters, coolers, etc.).
An exemplary DUO CHFT +/-embodiment was tested on an L-shaped copper tube having an inner diameter of (0.01905 m) and a wall thickness of 0.05 "(0.00127 m), with one sensor node having a heater (CHFT +), and the other sensor node having no heater (CHFT-), with water flowing through the copper tube at different flow rates and temperatures. The DUO CHFT +/-device was attached to the pipe surface and the measurements were compared to the example CHFT + example and the in-line flow meter.
Table 5 illustrates the results of DUO CHFT +/-example

For equation [76 ]]Similar rearrangements may also be made wherein the overall heat transfer coefficient Is utilized and results in:

and at steady state:

except for the flow rate And core fluid temperature
 This NITI application (i.e., pipe parameter determination) may be capable of determining the thermal energy transferred by the pipe internal flow, i.e., pipe internal flow
 And
And as a function of (c).
Corrosion/fouling detection applications
All of the above exemplary methods and exemplary embodiments for pipe parameter determination determine Or
Or Then input into a correlation function to determine the flow rate
 . Independently monitoring
 Or
Or And may also be used to determine corrosion or fouling of the pipe/conduit over time. This is because
 Or
Or The values of (d) should be consistent for a given flow rate amount occurring in the pipeline. When corrosion or fouling occurs, the value begins to change and thus corrosion or fouling can be detected. Monitoring the thermal time constant of pipes/conduits, e.g. made of a high thermal conductivity material
 Similar capabilities are also obtained. For example, in this example application, the thermal time constant
 Is a pipe/conduit attribute (including density)
 Specific heat capacity
 And wall thickness
 ) As a function of (c). The values of these properties are affected by corrosion or fouling, which consequently affects the thermal time constant of the pipe/conduit
 。
。
Internal temperature measurement applications for pipes or conduits
Combining equation [62] and equation [63 ]:

rewrite equation [90 ] according to NITI sensor output]And includes a thermal contact resistance between the NITI sensor and the surface of the pipe/conduit The influence of (a):

rearrangement and recognition: dependent on the value (measurement index) over time
 ):
):

Equation [92]]The core fluid temperature being carried out in a pipe or conduit having a high thermal conductivity, e.g. copper Example equations of measurements, and used in the following example embodiments below. For some of these example embodiments, it is desirable to determine the convection coefficient
 Estimated thermal contact resistance between NITI sensor and pipe/catheter surface
 And/or thermal time constant
 The value of (c). This may be done, for example, by determining these values (e.g., by the CHFT + or CHFT-methods described previously) or by inputting predetermined values (e.g., values from textbooks).
Example embodiments similar to those below may be compared to equation [76 ]]Together, wherein the total heat transfer coefficient Is used instead of using convection coefficients
 And thermal contact resistance between the NITI sensor and the surface of the pipe/conduit
 Combinations of (a) and (b).
Pipe internal temperature-CHFT + (active temperature measurement) embodiment
The CHFT + embodiment uses an integrated external thermal device (e.g., heater) to create a thermal event (i.e., heat transfer) that can be used to perform the NITI. For core fluid temperature Measured, the heater can operate in any manner (steady, periodic, cyclic, etc.) and in this example, when the convection coefficient is input on the right
 Thermal time constant
 And estimated thermal contact resistance
 When the value of (c) is equal to (2)]Will accurately output the core fluid temperature in real time
 . These values may be determined or otherwise determined and accounted for, for example, using data processing methods (e.g., including parameter estimation schemes). In some cases, the thermal contact resistance
 May be estimated to be negligible. Although not required, with insulationIt may be beneficial for the material to cover the CHFT + to prevent false signals from external stimuli (e.g., environmental changes, contact, etc.).
Table 6 provides the core fluid temperatures at different flow rates for L-shaped copper tubing having microspheres "(0.01905 m) with an inner diameter and a wall thickness of 0.05" (0.00127 m) Experimental results for the time-example CHFT + embodiment (with integrated heater) in which core fluid temperature measurements
 The measurements of (a) are averaged over time:
table 6 example CHFT + example results for internal pipe temperatures


FIG. 354 is a graph showing microspheres measuring the internal diameter "(0.01905 m), wall thickness 0.05" (0.00127 m), and history 15 Core fluid temperature of L-shaped copper tube of fluid flow
 The results of the CHFT + embodiment (with integrated and controlled heater) are illustrated. In this figure, the example CHFT + embodiments enable determination of the core fluid temperature of a pipe regardless of surface temperature conditions
 . Specifically, in this example, the surface temperature increases over time as the integrated heater is turned on. This irrespective of the surface temperature over timeWith continued rise, the exemplary CHFT + embodiments measure core fluid temperature within the copper pipe in close conformity with internal probes placed inside the pipe and within the pipe flow
 。
。
CHFT (Passive temperature measurement) embodiment of temperature inside pipeline
CHFT-embodiments use external thermal events (e.g., heat dissipation from the environment by the pipeline) to perform NITI. When subjected to an external thermal event, when convection coefficients are input on the right side Thermal time constant
 And estimated thermal contact resistance
 When the value of (c) is equal to (2)]E.g. to output core fluid temperature accurately and in real time
 . These values may be determined or otherwise determined and accounted for, for example, using data processing methods (e.g., which include parameter estimation schemes). In some cases, the thermal contact resistance
 May be estimated to be negligible. Although not required, it may be beneficial to cover the CHFT-with an insulating material to prevent false signals from external stimuli (e.g., environmental changes, contacts, etc.).
Pipe internal temperature-CHFT + (periodic measurement) example
In addition to the example real-time methods and example embodiments described above for pipe or catheter internal temperature measurement, the NITI sensor may also be used to measure core fluid temperature while operating under different steady-state conditionsDegree of rotation Periodic measurements are made. For example, thermal events
 Previous steady state measurements may be associated with thermal events
 The steady state measurements at the time, after, or at the end of the period are compared to determine the core fluid temperature using the following equation
 :
:

Both the CHFT + and/or CHFT-example embodiments may experience different steady state conditions over time. However, the CHFT + example embodiment is preferred due to increased operational control of one or more thermal event devices that may be used to create different steady state conditions.
Pipe internal temperature-CHFT + (zero Heat flux thermometry) example
Using the control circuitry, the example CHFT + embodiments can be used to create a zero heat flux environment in which no heat transfer occurs between the pipe and the sensor surface, i.e., in which no heat is measured by the heat flux sensor into or out of the pipe (minimum voltage output, i.e., "zero").
Under steady state conditions, a zero heat flux environment reduces equation [92] to:

wherein the measured sensor temperature Corresponding to the nucleusTemperature of heart fluid
 . The method has the advantages that: core fluid temperature once a steady state zero heat flux environment is achieved
 Measurement and internal parameter values (e.g. convection coefficient)
 Thermal time constant
 Etc.) and thermal contact resistance
 Is irrelevant. Other embodiments, such as active thermometry for pipe or conduit internal temperature measurements, may be utilized to measure core fluid temperature before a steady state zero heat flux environment is achieved
 And carrying out accurate measurement. By measured sensor temperature
 The amount of time required to reach such steady state conditions determined by the output varies depending on the example embodiment used and is a common limitation of existing zero-heat-flux techniques that do not utilize the NITI technique. Before a steady-state zero-heat-flux environment is achieved, example zero-heat-flux thermometry embodiments may utilize other example NITI embodiments, such as example active thermometry embodiments for pipe interior temperature measurements, to measure core fluid temperature
 And carrying out accurate measurement.
Pipe internal temperature-DUO NITI (Dual temperature measurement) embodiment
For an example DUO NITI sensor embodiment when using first and second parallel NITI sensor nodes (each node having a heat flux sensor-temperature sensor pair), two independent equations are formed when placed on a pipe/conduit made of a material with high thermal conductivity:

using a quotient-based data processing method, equation [95 ]/equation [96] yields:

rearranging:

the transient equation is the result of the DUO NITI configuration and when the convection coefficients are input on the right side And thermal time constant
 Typical value of (a) allows real-time core fluid temperature
 And (6) measuring.
Thermal contact resistance between each NITI sensor node (e.g., CHFT + or CHFT-) and the pipe/conduit surface May be determined (e.g., by the NITI process described above) or otherwise determined and accounted for. In some cases, the thermal contact resistance
 Can be covered withEstimated to be negligible.
Under steady state conditions, and in Or
Or And
And estimated to be negligible, equation [98 ]]The method is simplified as follows:

in which the convection coefficient is no longer required on the right And thermal time constant
 Typical values of (a). This means that, under steady state conditions, regardless of pipe/conduit material, wall thickness, etc., equation [99 ]]May be used for pipes/conduits. The steady state condition can be achieved in a variety of ways, including by a control circuit that regulates the heat flux and/or temperature occurring at the tissue surface via an external thermal device (e.g., heater, cooler, etc.).
FIG. 36 is a graph showing microspheres having an inner diameter of "(0.01905 m), a wall thickness of 0.05" (0.00127 m), and a history of 15 Internal temperature of the L-shaped copper tube of the fluid flow of (d) results for the example DUO CHFT +/-embodiment (one sensor node with heater and one sensor node without heater). In this example, both sensor nodes are covered by an insulator to prevent sporadic heat transfer and temperature signals from affecting the measurement quality. This example is performed under both steady state and transient conditions. As shown, an example DUO CHFThere is close consistency between the T +/-embodiment and the internal probe (placed within the pipe and within the pipe flow).
FIG. 37 is a graph showing a history of 50 for measuring an inner diameter of 1.939 "(0.0492506 m), a wall thickness of 0.218" (0.0055372 m) Internal temperature of 80-grade CPVC pipe of fluid stream DUO CHFT +/-results of the embodiment (one sensor node with heater and one without). In this example, neither sensor node is covered by an insulator. This example was performed under steady state conditions, where accurate measurements of internal parameters of the pipe were not required. As shown, there is close conformance between the example DUO CHFT +/-embodiment and the internal probe (placed within the pipe and within the pipe flow). However, there are more sporadic measurements since the sensor nodes are not covered with insulators.
Although various example embodiments have been illustrated and described in detail, the claims are not limited to any particular embodiment or example. Further, the above example embodiments use thermal signals (e.g., heat transfer and temperature signals) in combination with analytical solutions based on a thermal mathematical model to determine one or more internal properties of an object. Other example embodiments may utilize other methods, including but not limited to empirical methods, machine learning methods (e.g., neural networks), regression-based methods, artificial intelligence-based methods, moving average-based methods, etc., to determine one or more internal properties of an object from thermal signals measured at the surface of the object.
In other example embodiments, the output of other non-NITI-based devices may be used in conjunction with NITI techniques to determine one or more internal properties of an internal region of a subject. For example, the output of an internal temperature probe within the pipe may be used with a surface mounted NITI sensor to determine the flow rate within the pipe.
In this application, the word "configured … …" is used to mean that an element of an apparatus has a configuration capable of performing the defined operation. "configuration" may also refer to an arrangement or manner of hardware or software interconnections. For example, the apparatus may have dedicated hardware providing the defined operations, or a processor or other processing device may be programmed to perform the functions. "configured to" does not mean that the device elements need to be modified in any way in order to provide defined operation.
None of the above description should be read as implying that any particular element, step, range, or function is essential. All structural and functional equivalents to the elements of the above-described embodiments that are known to those of ordinary skill in the art are incorporated herein by reference and are intended to be encompassed. Furthermore, no embodiment, feature, component, or step in this specification is intended to be dedicated to the public.
Although illustrative embodiments have been described in detail herein with reference to the accompanying drawings, it is to be understood that the invention is not limited to those precise embodiments, and that various changes and modifications can be effected therein by one skilled in the art without departing from the scope of the appended claims.
Claims (119)
1. A system for non-invasive sensing of an object having a volume with a surface and an interior region, comprising:
a non-invasive sensor, comprising:
a heat flux sensor having one or more heat flux sensor output terminals;
a temperature sensor having one or more temperature sensor output terminals,
wherein the non-invasive sensor is adapted to be placed on or near a surface of an object, wherein an interior region of the object has an interior property indicated by a corresponding interior parameter and an interior temperature distribution,
control circuitry coupled to the one or more heat flux sensor output terminals and the one or more temperature sensor output terminals to:
receiving a measured temperature signal from a temperature sensor at one or more specified times;
receiving a measured heat flux signal from a heat flux sensor at one or more specified times;
determining a value for each internal parameter at one or more specified times;
determining an internal temperature distribution of the internal region of the subject at one or more specified times based on the measured temperature signal, the measured heat flux signal, and the internal parameter value; and
information indicative of an internal temperature distribution of an internal region of the object at one or more specified times is generated.
2. The system of claim 1, wherein the control circuitry is configured to determine a measure of heat transfer at the surface out of or into the object based on the measured heat flux signal.
3. The system of claim 1, wherein the control circuitry is configured to generate information indicative of one or more values determined for the internal parameter at one or more specified times.
4. The system of claim 1, wherein the control circuitry is configured to determine the internal temperature distribution of the internal region of the subject at one or more specified times based on the measured temperature signal, the measured heat flux signal, the value of the internal parameter, and one or more effects associated with the estimated thermal contact resistance between the temperature sensor and the surface of the subject.
5. The system of claim 4, wherein the control circuitry is configured to generate information in less than 1 second from the specified time, the information generated to indicate an internal temperature distribution of the internal region of the object at the specified time.
6. The system of claim 3, wherein the control circuitry is configured to generate information in less than 1 second from the specified time, the information generated to indicate the one or more values determined for the internal parameter at the specified time.
7. The system of claim 1, wherein the control circuitry is configured to use predetermined values of the one or more internal parameters at specified times.
8. The system of claim 1, wherein the control circuitry is configured to use the estimated values of the one or more internal parameters at a specified time.
9. The system of claim 1, wherein the control circuitry is configured to:
based on the measured temperature signal, the measured heat flux signal, and the estimated thermal contact resistance between the temperature sensor and the surface of the object, an estimated value of one or more internal parameters is determined.
10. The system of claim 9, wherein the control circuitry is configured to:
determining a calculated sensor temperature at one or more specified times based on the measured temperature signal, the measured heat flux signal, the one or more estimated internal parameter values, the one or more remaining internal parameter values when present, and the one or more effects associated with the estimated thermal contact resistance; and
the calculated sensor temperature is compared to a measured temperature based on the measured temperature signal to determine a difference.
11. The system of claim 10, wherein the control circuitry is configured to:
adjusting values of one or more internal parameters and the estimated thermal contact resistance based on the difference to produce updated values of the internal parameters and the thermal contact resistance; and
an internal temperature distribution of the internal region of the subject is determined based on the measured temperature signal, the measured heat flux signal, and the internal parameter and the estimated updated value of the thermal contact resistance.
12. The system of claim 10, wherein the control circuitry is configured to adjust the one or more internal parameters and the estimated value of the thermal contact resistance to reduce the difference, and
wherein when the difference is less than a threshold amount or otherwise determined to be minimal, the value of the internal parameter and the value of the thermal contact resistance are at optimal updated values, and the control circuitry is configured to generate information indicative of the optimal updated values of the internal parameter and the thermal contact resistance.
13. The system of claim 10, wherein the control circuitry is configured to adjust the values of the one or more internal parameters and the thermal contact resistance using one or more optimization techniques to reduce the difference.
14. The system of claim 10, wherein the control circuitry is configured to adjust the values of the one or more internal parameters and the thermal contact resistance using one or more machine learning techniques to reduce the difference.
15. The system of claim 9, wherein the control circuitry is configured to determine the estimated value of the thermal contact resistance independently of the value of the internal parameter.
16. The system of claim 9, wherein the control circuitry is configured to determine the estimated value of the thermal contact resistance based on the value of the internal parameter.
17. The system of claim 9, wherein the control circuitry is configured to determine the estimate of the thermal contact resistance based on a total steady state thermal resistance of the subject.
18. The system of claim 10, wherein the control circuitry is configured to adjust the values of the one or more internal parameters and the estimated thermal contact resistance in real-time to reduce the difference.
19. The system of claim 1, wherein the control circuitry is configured to determine the internal temperature distribution of the internal region of the subject at one or more specified times based on the measured temperature signal and the measured heat flux signal using one or more machine learning techniques.
20. The system of claim 1, wherein the control circuitry is configured to determine the internal temperature distribution of the internal region of the object at one or more specified times using one or more thermal mathematical models of the object based on one or more surface heat flux boundary conditions.
21. The system of claim 20, wherein the thermal mathematical model has a transient temperature solution defined as a function of initial temperature distribution, heat flux, time, space, and internal parameters.
22. The system of claim 20, wherein the thermal mathematical model comprises one or more steady state conditions.
23. The system of claim 21, wherein the initial temperature profile is based on a steady state temperature profile.
24. The system of claim 1, wherein the internal parameters comprise one or more parameters from a list comprising:


25. The system of claim 1, wherein the non-invasive sensor comprises a thermal insulator to reduce measured signal noise.
26. The system of claim 1, wherein the non-invasive sensor comprises a thermally insulating layer to control an amount of heat transfer that occurs through the non-invasive sensor.
27. The system of claim 1, wherein the temperature sensor is a thin film thermocouple, a thin temperature sensor, a resistive temperature sensor, or a fiber optic temperature sensor.
28. The system of claim 1, wherein the heat flux sensor is based on differential thermopile technology.
29. The system of claim 1, wherein the heat flux sensor is based on thin film technology.
30. The system of claim 1, wherein the heat flux sensor is a thin heat flux sensor.
31. The system of claim 1, wherein the heat flux sensor is a flexible heat flux sensor.
32. The system of claim 1, wherein the heat flux sensor is based on one or more thermoelectric devices.
33. The system of claim 1, further comprising one or more external thermal devices for heating or cooling the non-invasive sensor.
34. The system of claim 1, wherein the control circuitry controls one or more external thermal devices for heating or cooling the non-invasive sensor.
35. The system of claim 1, wherein the control circuit controls one or more external thermal devices for heating or cooling the non-invasive sensor to maintain the measured heat flux signal and/or the temperature signal.
36. The system of claim 1, wherein the temperature sensor is located on or near a heat flux sensor sensing area.
37. The system of claim 1, wherein the temperature sensor is between the object and the heat flux sensor.
38. The system of claim 1, wherein the heat flux sensor is between the object and the temperature sensor.
39. A system for non-invasive sensing of an object having a volume with a surface and an interior region, comprising:
a non-invasive sensor, comprising:
a heat flux sensor having one or more heat flux sensor output terminals;
a temperature sensor having one or more temperature sensor output terminals,
wherein the non-invasive sensor is adapted to be placed on or near a surface of an object, wherein an interior region of the object has an interior property indicated by a corresponding interior parameter and an interior temperature distribution,
control circuitry coupled to the one or more heat flux sensor output terminals and the one or more temperature sensor output terminals to:
receiving a measured temperature signal from a temperature sensor at one or more specified times;
receiving a measured heat flux signal from a heat flux sensor at one or more specified times;
determining an estimate of one or more internal parameters at one or more specified times based on the measured temperature signal and the measured heat flux signal; and
information indicative of one or more estimated values determined for the internal parameters at one or more specified times is generated.
40. The system of claim 39, wherein the control circuitry is configured to determine a measure of heat transfer at the surface out of or into the object based on the measured heat flux signal.
41. The system of claim 39, wherein the control circuitry is configured to include one or more effects related to an estimated thermal contact resistance between the temperature sensor and the surface of the object.
42. The system of claim 39, wherein the control circuitry is configured to:
determining estimated values of one or more internal parameters at one or more specified times based on the measured temperature signal, the measured heat flux signal, the estimated thermal contact resistance between the temperature sensor and the surface of the subject, and the internal property values determined for the one or more internal properties of the internal region of the subject at the one or more specified times; and
information indicative of at least one estimated value determined for the internal parameter is generated.
43. The system of claim 39, wherein the control circuitry is configured to generate information in less than 1 second from the specified time, the information generated to indicate one or more estimated values determined for the internal parameter at the specified time.
44. The system of claim 42, wherein the control circuitry is configured to generate information in less than 1 second from the specified time, the information generated to indicate one or more estimated values determined for the internal parameter at the specified time.
45. The system of claim 42, wherein the control circuitry is configured to use predetermined values of one or more internal attributes.
46. The system of claim 42, wherein the control circuitry is configured to use the estimated value of the one or more internal properties.
47. The system of claim 42, wherein the control circuitry is configured to:
determining a calculated sensor temperature at one or more specified times based on the measured temperature signal, the measured heat flux signal, the one or more estimated internal parameter values, the one or more internal property values, and the one or more effects associated with the estimated thermal contact resistance; and
the calculated sensor temperature is compared to a measured temperature based on the measured temperature signal to determine a difference.
48. The system of claim 47, wherein the control circuitry is configured to adjust values of the one or more internal parameters and the estimated thermal contact resistance based on the difference to produce updated values of the internal parameters and the thermal contact resistance.
49. The system of claim 47, wherein the control circuitry is configured to adjust one or more internal parameters and the estimated value of the thermal contact resistance to reduce the difference, and
wherein when the difference is less than a threshold amount or otherwise determined to be minimal, the value of the internal parameter and the value of the thermal contact resistance are at optimal updated values, and the control circuitry is configured to generate information indicative of the optimal updated values of the internal parameter and the thermal contact resistance.
50. The system of claim 47, wherein the control circuitry is configured to adjust the values of the one or more internal parameters and the thermal contact resistance using one or more optimization techniques to reduce the difference.
51. The system of claim 47, wherein the control circuitry is configured to adjust the values of the one or more internal parameters and the thermal contact resistance using one or more machine learning techniques to reduce the difference.
52. The system of claim 41, wherein the control circuitry is configured to determine the estimated value of the thermal contact resistance independently of a value of an internal parameter.
53. The system of claim 41, wherein the control circuitry is configured to determine the estimated value of the thermal contact resistance based on a value of an internal parameter.
54. The system of claim 41, wherein the control circuitry is configured to determine a value of the estimated thermal contact resistance based on a total steady state thermal resistance of the subject.
55. The system of claim 47, wherein the control circuitry is configured to adjust the values of the one or more internal parameters and the estimated thermal contact resistance in real-time to reduce the variance.
56. The system of claim 39, wherein the control circuitry is configured to determine the estimated value of the one or more internal parameters based on the measured temperature signal and the measured heat flux signal using one or more machine learning techniques.
57. The system of claim 37, wherein the control circuitry is configured to determine the estimated value of the one or more internal parameters using one or more thermal mathematical models of the object based on the one or more surface heat flux boundary conditions.
58. The system of claim 57, wherein the thermal mathematical model has a transient temperature solution defined as a function of initial temperature distribution, heat flux, time, space, and internal parameters.
59. The system of claim 57, wherein the thermal mathematical model comprises one or more steady state conditions.
60. The system of claim 58, wherein the initial temperature profile is based on a steady-state temperature profile.
61. The system of claim 39, wherein the internal parameters comprise one or more parameters from a list comprising:


62. The system of claim 39, wherein the non-invasive sensor comprises a thermal insulator to reduce measured signal noise.
63. The system of claim 39, wherein the non-invasive sensor comprises a thermal insulator to control an amount of heat transfer that occurs through the non-invasive sensor.
64. The system of claim 39, wherein the temperature sensor is a thin film thermocouple, a thin temperature sensor, a resistive temperature sensor, or a fiber optic temperature sensor.
65. The system of claim 39, wherein the heat flux sensor is based on differential thermopile technology.
66. The system of claim 39, wherein the heat flux sensor is based on thin film technology.
67. The system of claim 39, wherein the heat flux sensor is a thin heat flux sensor.
68. The system of claim 39, wherein the heat flux sensor is a flexible heat flux sensor.
69. The system of claim 39, wherein the heat flux sensor is based on one or more thermoelectric devices.
70. The system of claim 39, further comprising one or more external thermal devices for heating or cooling the non-invasive sensor.
71. The system of claim 39, wherein the control circuitry controls one or more external thermal devices for heating or cooling the non-invasive sensor.
72. The system of claim 39, wherein the control circuitry controls one or more external thermal devices for heating or cooling the non-invasive sensor to maintain the measured heat flux signal and/or the temperature signal.
73. The system of claim 39, wherein the temperature sensor is located on or near a heat flux sensor sensing area.
74. The system of claim 39, wherein the temperature sensor is between the object and the heat flux sensor.
75. The system of claim 39, wherein the heat flux sensor is between the object and the temperature sensor.
76. A system for non-invasive sensing of an object having a volume with a surface and an interior region, comprising:
a first non-invasive heat flux sensor-temperature sensor pair;
a second non-invasive heat flux sensor-temperature sensor pair;
each of the first and second non-invasive heat flux sensor-temperature sensor pairs comprises:
a heat flux sensor having one or more heat flux sensor output terminals;
a temperature sensor having one or more temperature sensor output terminals,
wherein the first and second non-invasive heat flux sensor-temperature sensor pairs are adapted to be placed at different locations on or near the surface of the object, and wherein the interior region of the object has an interior property indicated by the respective interior parameter and interior temperature distribution,
a control circuit coupled to the one or more heat flux sensor output terminals and the one or more temperature sensor output terminals of each of the first and second non-invasive heat flux sensor-temperature sensor pairs and configured to:
receiving a first measured temperature signal from a temperature sensor of a first non-invasive heat flux sensor-temperature sensor pair at one or more specified times;
receiving a first measured heat flux signal from a heat flux sensor of a first non-invasive heat flux sensor-temperature sensor pair at one or more specified times;
receiving a second measured temperature signal from a temperature sensor of a second non-invasive heat flux sensor-temperature sensor pair at one or more specified times;
receiving a second measured heat flux signal from a heat flux sensor of a second non-invasive heat flux sensor-temperature sensor pair at one or more specified times;
determining a value for each internal parameter at one or more specified times;
determining an internal temperature profile at one or more specified times based on the measured temperature signals from the temperature sensors of the first and second non-invasive heat flux sensor-temperature sensor pairs at one or more specified times, the measured heat flux signals from the heat flux sensors of the first and second non-invasive heat flux sensor-temperature sensor pairs at one or more specified times, and the internal parameter values at one or more specified times; and
information indicative of the internal temperature distribution at one or more specified times is generated.
77. The system of claim 76, in which each respective temperature sensor is between the object and its corresponding heat flux sensor.
78. The system of claim 76, in which the control circuitry is configured to determine, at one or more specified times, measurements of heat transfer occurring through the first non-invasive heat flux sensor-temperature sensor pair and exiting or entering the object at the surface based on the first measured heat flux signal.
79. The system of claim 76, in which the control circuitry is configured to determine, at one or more specified times, measurements of heat transfer occurring through the second non-invasive heat flux sensor-temperature sensor pair and exiting or entering the object at the surface based on the second measured heat flux signal.
80. The system of claim 76, wherein the control circuitry is configured to initially use predetermined values of the internal parameters.
81. The system of claim 76, wherein the control circuitry is configured to initially use the estimated values of the internal parameters.
82. The system of claim 76, in which the first and second non-invasive heat flux sensor-temperature sensor pairs are subjected to a differential heat flux environment.
83. The system of claim 76, in which the control circuitry is configured to account for one or more effects associated with an estimated thermal contact resistance between a temperature sensor of the first non-invasive heat flux sensor-temperature sensor pair and the surface of the object.
84. The system of claim 76, in which the control circuitry is configured to account for one or more effects associated with an estimated thermal contact resistance between a temperature sensor of the second non-invasive heat flux sensor-temperature sensor pair and the surface of the object.
85. The system of claim 76, wherein the control circuitry, in a steady state condition, is configured to:
an internal temperature profile is determined at one or more specified times based on measured temperature signals from temperature sensors of the first and second non-invasive heat flux sensor-temperature sensor pairs at one or more specified times and measured heat flux signals from heat flux sensors of the first and second non-invasive heat flux sensor-temperature sensor pairs at one or more specified times.
86. A system for non-invasive sensing of an object having a volume with a surface and an interior region, comprising:
a first non-invasive heat flux sensor-temperature sensor pair;
a second non-invasive heat flux sensor-temperature sensor pair,
each of the first and second non-invasive heat flux sensor-temperature sensor pairs comprises:
a heat flux sensor having one or more heat flux sensor output terminals;
a temperature sensor having one or more temperature sensor output terminals,
wherein the first and second non-invasive heat flux sensor-temperature sensor pairs are adapted to be placed at different locations on or near the surface of the object, and wherein the interior region of the object has an interior property indicated by the respective interior parameter and interior temperature distribution,
a control circuit coupled to the one or more heat flux sensor output terminals and the one or more temperature sensor output terminals of each of the first and second non-invasive heat flux sensor-temperature sensor pairs and configured to:
receiving a first measured temperature signal from a temperature sensor of a first non-invasive heat flux sensor-temperature sensor pair at one or more specified times;
receiving a first measured heat flux signal from a heat flux sensor of a first non-invasive heat flux sensor-temperature sensor pair at one or more specified times;
receiving a second measured temperature signal from a temperature sensor of a second non-invasive heat flux sensor-temperature sensor pair at one or more specified times;
receiving a second measured heat flux signal from a heat flux sensor of a second non-invasive heat flux sensor-temperature sensor pair at one or more specified times;
determining an initial value for each internal parameter at one or more specified times;
determining one or more internal parameters of the subject at one or more specified times based on the measured temperature signals from the temperature sensors of the first and second non-invasive heat flux sensor-temperature sensor pairs at one or more specified times and the measured heat flux signals from the heat flux sensors of the first and second non-invasive heat flux sensor-temperature sensor pairs at one or more specified times, and the initial values of the internal parameters at one or more specified times; and
information is generated that indicates one or more internal parameters of the object at one or more specified times.
87. The system of claim 86, wherein the control circuitry is configured to determine, at one or more specified times, measurements of heat transfer occurring through the first non-invasive heat flux sensor-temperature sensor pair and exiting or entering the object at the surface based on the first measured heat flux signal.
88. The system of claim 86, wherein the control circuitry is configured to determine, at one or more specified times, measurements of heat transfer occurring through the second non-invasive heat flux sensor-temperature sensor pair and exiting or entering the object at the surface based on the second measured heat flux signal.
89. The system of claim 86, wherein each respective temperature sensor is between the object and its corresponding heat flux sensor.
90. The system of claim 86, wherein the control circuitry is configured to initially use predetermined values of the internal parameters.
91. The system of claim 86, wherein the control circuitry is configured to initially use the estimated value of the internal parameter.
92. The system of claim 86, wherein the first and second non-invasive heat flux sensor-temperature sensor pairs are subjected to a differential heat flux environment.
93. The system of claim 86, wherein the control circuitry is configured to account for one or more effects associated with an estimated thermal contact resistance between a temperature sensor of the first non-invasive heat flux sensor-temperature sensor pair and the surface of the object.
94. The system of claim 86, wherein the control circuitry is configured to account for one or more effects associated with an estimated thermal contact resistance between a temperature sensor of the second non-invasive heat flux sensor-temperature sensor pair and the surface of the object.
95. The system of claim 86, wherein the control circuitry, in a steady state condition, is configured to:
one or more internal parameters of the subject are determined based on the measured temperature signals from the temperature sensors of the first and second non-invasive heat flux sensor-temperature sensor pairs at one or more specified times and the measured heat flux signals from the heat flux sensors of the first and second non-invasive heat flux sensor-temperature sensor pairs at one or more specified times.
96. A non-invasive sensor adapted to be placed on or near a surface of an object having a volume with an interior region, wherein the interior region of the object has an internal property indicated by a corresponding internal parameter and an internal temperature distribution, the non-invasive sensor comprising:
a non-invasive heat flux sensor-temperature sensor pair;
a non-invasive heat flux sensor-temperature sensor pair comprising:
a heat flux sensor having one or more heat flux sensor output terminals to provide a measured heat flux signal of a surface of an object, and
a temperature sensor having one or more temperature sensor output terminals to provide a measured temperature signal of the surface of the object,
wherein the heat flux sensor and the temperature sensor are configured to be subjected to the same thermal conditions.
97. The non-invasive sensor according to claim 96, further comprising one or more external thermal devices for heating or cooling the non-invasive sensor.
98. The non-invasive sensor of claim 97, wherein the one or more external thermal devices comprise a heater or a cooler.
99. The non-invasive sensor of claim 96, wherein the heat flux sensor is arranged to generate a differential voltage indicative of heat transfer occurring at the object surface through the heat flux sensor.
100. The heat flux sensor of claim 99, wherein the differential voltage is related to heat transfer through the heat flux sensor and occurring at the surface of the object by a calibration constant or a sensitivity constant associated with the heat flux sensor.
101. The heat flux sensor of claim 99, wherein the differential voltage is related to heat transfer through the heat flux sensor and occurring at the surface of the object by a calibration curve or sensitivity curve associated with the heat flux sensor.
102. The non-invasive sensor of claim 96, wherein the heat flux sensor is based on thin film differential thermopile technology.
103. The non-invasive sensor of claim 96, wherein the heat flux sensor includes two or more thermocouple junctions connected in series to provide a voltage output indicative of the temperature difference across a given thermal resistance.
104. The non-invasive sensor of claim 96, wherein the temperature sensor is based on thermocouple or thermistor technology.
105. The non-invasive sensor of claim 96, wherein the thickness of the temperature sensor is less than or equal to the thickness of the heat flux sensor.
106. The non-invasive sensor according to claim 96, wherein the heat flux sensor is of the kind described in ASTM standard E2683.
107. The non-invasive sensor according to claim 96, wherein the heat flux sensor is of the kind described in ASTM standard E2684.
108. A non-invasive sensor adapted to be placed on or near a surface of an object having a volume with a surface and an interior region, the non-invasive sensor comprising:
a first non-invasive heat flux sensor-temperature sensor pair;
a second non-invasive heat flux sensor-temperature sensor pair;
each of the first and second non-invasive heat flux sensor-temperature sensor pairs comprises:
a heat flux sensor having one or more heat flux sensor output terminals;
a temperature sensor having one or more temperature sensor output terminals,
wherein the first and second non-invasive heat flux sensor-temperature sensor pairs are adapted to be placed at different locations on or near a surface of an object, wherein an interior region of the object has an interior property indicated by the respective interior parameter and interior temperature distribution.
109. The non-invasive sensor of claim 108, further comprising one or more external thermal devices for heating or cooling the first non-invasive heat flux sensor-temperature sensor pair.
110. The non-invasive sensor of claim 108, further comprising one or more external thermal devices for heating or cooling the second non-invasive heat flux sensor-temperature sensor pair.
111. The non-invasive sensor of claim 108, wherein each heat flux sensor of the first and second non-invasive heat flux sensor-temperature sensor pairs is arranged to produce a differential voltage indicative of heat transfer occurring through the first and second non-invasive heat flux sensor-temperature sensor pairs, respectively.
112. The heat flux sensor of claim 111, wherein the differential voltage generated by each heat flux sensor of the first and second non-invasive heat flux sensor-temperature sensor pairs is related to the heat transfer occurring through the corresponding heat flux sensor-temperature sensor pair by a calibration constant or a sensitivity constant associated with the heat flux sensor.
113. The heat flux sensor of claim 111, wherein the differential voltage generated by each heat flux sensor of the first and second non-invasive heat flux sensor-temperature sensor pairs is related to the heat transfer occurring through the corresponding heat flux sensor-temperature sensor pair by a calibration curve or sensitivity curve associated with the heat flux sensor.
114. The non-invasive sensor of claim 108, wherein the heat flux sensor is based on thin film differential thermopile technology.
115. The non-invasive sensor of claim 108, wherein the heat flux sensor comprises two or more thermocouple junctions connected in series to provide a voltage output indicative of the temperature difference across a given thermal resistance.
116. The non-invasive sensor of claim 108, wherein the temperature sensor is based on thermocouple or thermistor technology.
117. The non-invasive sensor of claim 107, wherein the thickness of the temperature sensor is less than or equal to the thickness of the heat flux sensor.
118. The heat flux sensor of claim 108, wherein the heat flux sensor is of the kind described in ASTM standard E2683.
119. The heat flux sensor of claim 108, wherein the heat flux sensor is of the kind described in ASTM standard E2684.
Applications Claiming Priority (3)
| Application Number | Priority Date | Filing Date | Title |
|---|---|---|---|
| US201962869208P | 2019-07-01 | 2019-07-01 | |
| US62/869,208 | 2019-07-01 | ||
| PCT/US2020/040266 WO2021003140A1 (en) | 2019-07-01 | 2020-06-30 | Apparatus, systems, and methods for non-invasive thermal interrogation |
Publications (1)
| Publication Number | Publication Date |
|---|---|
| CN114008422A true CN114008422A (en) | 2022-02-01 |
Family
ID=74101277
Family Applications (1)
| Application Number | Title | Priority Date | Filing Date |
|---|---|---|---|
| CN202080047820.XA Pending CN114008422A (en) | 2019-07-01 | 2020-06-30 | Apparatus, system, and method for non-invasive thermal interrogation |
Country Status (10)
| Country | Link |
|---|---|
| US (2) | US11686626B2 (en) |
| EP (1) | EP3994435A4 (en) |
| JP (1) | JP2022532435A (en) |
| KR (2) | KR102630649B1 (en) |
| CN (1) | CN114008422A (en) |
| AU (2) | AU2020300996B2 (en) |
| BR (1) | BR112021024367A2 (en) |
| CA (1) | CA3142176C (en) |
| MX (1) | MX2021015697A (en) |
| WO (1) | WO2021003140A1 (en) |
Cited By (1)
| Publication number | Priority date | Publication date | Assignee | Title |
|---|---|---|---|---|
| CN116859831A (en) * | 2023-05-15 | 2023-10-10 | 广东思创智联科技股份有限公司 | Industrial big data processing method and system based on Internet of things |
Families Citing this family (11)
| Publication number | Priority date | Publication date | Assignee | Title |
|---|---|---|---|---|
| JP2019174223A (en) * | 2018-03-28 | 2019-10-10 | 三菱重工業株式会社 | Temperature monitoring device, temperature monitoring method, and manufacturing method of composite material |
| EP3855146A1 (en) * | 2020-01-21 | 2021-07-28 | Vorwerk & Co. Interholding GmbH | Supply unit for generating electrical energy, kitchen utensil and kitchen system |
| EP4295144A1 (en) * | 2021-02-16 | 2023-12-27 | Omega Engineering, Inc. | Non-invasive measurement and calculation system |
| KR20240024182A (en) * | 2021-06-24 | 2024-02-23 | 아이에프디 테크놀로지스 인코포레이티드 | Apparatus and method for non-invasively detecting the internal temperature of a fluid contained within a housing |
| US20220412815A1 (en) * | 2021-06-25 | 2022-12-29 | Rosemount Inc. | Heat flow-based process fluid temperature estimation system with thermal time response improvement |
| GB2602857A (en) * | 2021-08-07 | 2022-07-20 | Leslie Kelly Andrew | An intelligent fire & occupant safety system & method |
| GB2612787A (en) * | 2021-11-10 | 2023-05-17 | Imperial College Innovations Ltd | Transient thermal characterisation of bodies |
| KR20230111442A (en) * | 2022-01-18 | 2023-07-25 | 숙명여자대학교산학협력단 | Temperature measuring device |
| WO2024006326A1 (en) * | 2022-07-01 | 2024-01-04 | Lam Research Corporation | Systems and methods for wafer temperature measurement |
| WO2024020670A1 (en) * | 2022-07-27 | 2024-02-01 | National Research Council Of Canada | Systems for non-destructive in-situ determination of r-values of materials and methods thereof |
| DE102022209906A1 (en) * | 2022-09-20 | 2024-03-21 | Hahn-Schickard-Gesellschaft für angewandte Forschung e.V. | Sensor arrangement |
Family Cites Families (62)
| Publication number | Priority date | Publication date | Assignee | Title |
|---|---|---|---|---|
| NL7902313A (en) | 1979-03-23 | 1980-09-25 | Kema Nv | HEAT QUANTITY METER. |
| JPS55149025A (en) | 1979-05-11 | 1980-11-20 | Shisaka Kenkyusho:Kk | Internal temperature measuring method |
| IL120758A (en) | 1997-05-01 | 2000-02-29 | Medisim Ltd | High speed accurate temperature measuring device |
| US6278051B1 (en) * | 1997-10-09 | 2001-08-21 | Vatell Corporation | Differential thermopile heat flux transducer |
| US6558036B2 (en) | 2000-11-29 | 2003-05-06 | Weatherford/Lamb, Inc. | Non-intrusive temperature sensor for measuring internal temperature of fluids within pipes |
| JP4310962B2 (en) | 2001-04-11 | 2009-08-12 | オムロンヘルスケア株式会社 | Electronic thermometer |
| EP1249691A1 (en) * | 2001-04-11 | 2002-10-16 | Omron Corporation | Electronic clinical thermometer |
| US6886978B2 (en) | 2001-06-18 | 2005-05-03 | Omron Corporation | Electronic clinical thermometer |
| JP4798280B2 (en) * | 2004-09-15 | 2011-10-19 | セイコーエプソン株式会社 | Thermometer, electronic device having thermometer, and body temperature measuring method |
| JP4600170B2 (en) | 2004-09-15 | 2010-12-15 | セイコーエプソン株式会社 | Thermometer and electronic device having thermometer |
| DE102005004933B3 (en) | 2005-02-03 | 2006-08-31 | Dräger Safety AG & Co. KGaA | Device for measuring the body temperature of a living being |
| CN101636105B (en) | 2007-03-15 | 2012-02-08 | 皇家飞利浦电子股份有限公司 | Methods and devices for measuring core body temperature |
| CN101632008A (en) | 2007-03-15 | 2010-01-20 | 皇家飞利浦电子股份有限公司 | Apparatuses and methods for measuring and controlling thermal insulation |
| US8136983B2 (en) | 2009-01-01 | 2012-03-20 | Mahmoud Razzaghi | Sensor and control system |
| WO2010082102A2 (en) | 2009-01-19 | 2010-07-22 | Koninklijke Philips Electronics, N.V. | Zero heat flux sensor and method of use |
| JP5433026B2 (en) | 2009-03-13 | 2014-03-05 | コーニンクレッカ フィリップス エヌ ヴェ | Zero heat flow temperature detector |
| CN102378905A (en) | 2009-04-06 | 2012-03-14 | 皇家飞利浦电子股份有限公司 | A temperature sensor for body temperature measurement |
| EP2419004B1 (en) | 2009-04-15 | 2017-07-19 | 3M Innovative Properties Company | Deep tissue temperature probe constructions |
| US8292495B2 (en) | 2010-04-07 | 2012-10-23 | Arizant Healthcare Inc. | Zero-heat-flux, deep tissue temperature measurement devices with thermal sensor calibration |
| US8449181B2 (en) | 2010-08-26 | 2013-05-28 | Rosemount Inc. | Process fluid temperature measurement |
| JP5578029B2 (en) | 2010-10-29 | 2014-08-27 | セイコーエプソン株式会社 | Temperature measuring apparatus and temperature measuring method |
| US8573843B2 (en) | 2010-11-05 | 2013-11-05 | Citizen Holdings Co., Ltd. | Temperature measuring device |
| JP2012112767A (en) | 2010-11-24 | 2012-06-14 | Citizen Holdings Co Ltd | Temperature measuring device |
| EP2676110A1 (en) | 2011-02-16 | 2013-12-25 | Arizant Healthcare Inc. | Zero-heat-flux temperature measurement devices with peripheral skin temperature measurement |
| DE102011114620B4 (en) | 2011-09-30 | 2014-05-08 | Dräger Medical GmbH | Apparatus and method for determining body core temperature |
| JP6337416B2 (en) | 2013-03-12 | 2018-06-06 | セイコーエプソン株式会社 | Temperature measuring device |
| DE102013005900A1 (en) | 2013-04-05 | 2014-10-09 | Dräger Medical GmbH | Body core temperature sensor |
| DE102013007631A1 (en) | 2013-05-02 | 2014-11-06 | Dräger Medical GmbH | Method and device for determining a core temperature of a body |
| JP6349713B2 (en) | 2013-12-13 | 2018-07-04 | オムロン株式会社 | Internal temperature sensor |
| WO2015092627A1 (en) * | 2013-12-18 | 2015-06-25 | Koninklijke Philips N.V. | Continuous temperature profiling and control during surgery |
| US9360377B2 (en) | 2013-12-26 | 2016-06-07 | Rosemount Inc. | Non-intrusive temperature measurement assembly |
| DE102014103430A1 (en) | 2014-03-13 | 2015-09-17 | Endress + Hauser Flowtec Ag | Converter device and thus formed measuring system |
| DE102014012086A1 (en) | 2014-08-14 | 2016-02-18 | Abb Technology Ag | Apply temperature sensor device for autonomously measuring the temperature of a container |
| JP2016057199A (en) | 2014-09-10 | 2016-04-21 | セイコーエプソン株式会社 | Temperature measurement device and temperature measurement method |
| DE102014019365B4 (en) | 2014-12-22 | 2021-02-18 | Abb Schweiz Ag | Device for measuring the temperature of a medium through a wall |
| JP6380168B2 (en) * | 2015-03-02 | 2018-08-29 | 株式会社Soken | Thermal flow sensor |
| EP3106852A1 (en) * | 2015-06-18 | 2016-12-21 | ETH Zurich | Heat flux sensor and system with a heat flux sensor |
| US10190968B2 (en) | 2015-06-26 | 2019-01-29 | Rosemount Inc. | Corrosion rate measurement with multivariable sensor |
| WO2017031129A1 (en) | 2015-08-19 | 2017-02-23 | Mc10, Inc. | Wearable heat flux devices and methods of use |
| EP3156774B1 (en) | 2015-10-13 | 2018-04-11 | Koninklijke Philips N.V. | System and method for core body temperature measurement |
| US10393598B1 (en) | 2015-12-03 | 2019-08-27 | FluxTeq LLC | Heat flux gage |
| JP6763142B2 (en) * | 2015-12-28 | 2020-09-30 | セイコーエプソン株式会社 | Internal temperature measuring device, wrist-mounted device and internal temperature measuring method |
| RU2689280C1 (en) | 2016-01-25 | 2019-05-24 | Роузмаунт Инк. | Non-intrusive process medium temperature calculation system |
| US11141076B1 (en) | 2016-02-16 | 2021-10-12 | Thomas Eugene Diller | Thermally activated non-invasive blood perfusion measurement systems |
| DE102016105949A1 (en) | 2016-03-31 | 2017-10-05 | Abb Schweiz Ag | Non-intrusive temperature measuring device |
| US20190175024A1 (en) | 2016-06-12 | 2019-06-13 | Nokia Technologies Oy | Method and Apparatus for Estimating a Body Temperature |
| US11067520B2 (en) | 2016-06-29 | 2021-07-20 | Rosemount Inc. | Process fluid temperature measurement system with improved process intrusion |
| WO2018033795A2 (en) | 2016-08-19 | 2018-02-22 | Thalman Health Ltd. | System and method for monitoring core body temperature |
| US10317295B2 (en) | 2016-09-30 | 2019-06-11 | Rosemount Inc. | Heat flux sensor |
| CH713267A1 (en) | 2016-12-21 | 2018-06-29 | Greenteg Ag | Sensor unit for a portable computer system and integration of the sensor unit in the housing of the computer system. |
| WO2018180800A1 (en) * | 2017-03-31 | 2018-10-04 | 日本電気株式会社 | Thermal diffusion coefficient measuring device, and deep-body thermometer, deep-body temperature measuring device, and deep-body temperature measuring method using same |
| DE102017116505A1 (en) | 2017-07-21 | 2019-01-24 | Endress+Hauser Conducta Gmbh+Co. Kg | Sensor of process automation technology and method for determining the temperature of a medium |
| EP3688430B1 (en) | 2017-09-27 | 2023-01-18 | ABB Schweiz AG | Temperature measuring device and method for determining temperature |
| WO2019133601A1 (en) | 2017-12-28 | 2019-07-04 | Robert Bosch Gmbh | Body core temperature sensor with two tegs |
| US10976204B2 (en) | 2018-03-07 | 2021-04-13 | Rosemount Inc. | Heat flux sensor with improved heat transfer |
| EP3537124B1 (en) | 2018-03-08 | 2021-01-27 | ABB Schweiz AG | Method and system for non-intrusive determining of a temperature of a fluid flowing through a conduit section |
| US10760742B2 (en) | 2018-03-23 | 2020-09-01 | Rosemount Inc. | Non-intrusive pipe wall diagnostics |
| US20210244285A1 (en) | 2018-05-02 | 2021-08-12 | 3M Innovative Properties Company | Combined core temperature and skin temperature sensor |
| DE102018119857A1 (en) | 2018-08-15 | 2020-02-20 | Abb Schweiz Ag | Temperature measuring device and method for temperature determination |
| US11073429B2 (en) | 2018-09-24 | 2021-07-27 | Rosemount Inc. | Non-invasive process fluid temperature indication for high temperature applications |
| CN112771357A (en) | 2018-09-28 | 2021-05-07 | 罗斯蒙特公司 | Error reduced non-invasive process fluid temperature indication |
| US20200103293A1 (en) | 2018-09-28 | 2020-04-02 | Rosemount Inc. | Non-invasive process fluid temperature indication |
-
2020
- 2020-06-30 US US17/624,207 patent/US11686626B2/en active Active
- 2020-06-30 KR KR1020217043288A patent/KR102630649B1/en active IP Right Grant
- 2020-06-30 KR KR1020247002829A patent/KR20240016453A/en active Application Filing
- 2020-06-30 EP EP20835336.7A patent/EP3994435A4/en active Pending
- 2020-06-30 JP JP2021576264A patent/JP2022532435A/en active Pending
- 2020-06-30 MX MX2021015697A patent/MX2021015697A/en unknown
- 2020-06-30 BR BR112021024367A patent/BR112021024367A2/en unknown
- 2020-06-30 AU AU2020300996A patent/AU2020300996B2/en active Active
- 2020-06-30 CN CN202080047820.XA patent/CN114008422A/en active Pending
- 2020-06-30 CA CA3142176A patent/CA3142176C/en active Active
- 2020-06-30 WO PCT/US2020/040266 patent/WO2021003140A1/en active Search and Examination
-
2022
- 2022-08-19 AU AU2022218630A patent/AU2022218630A1/en active Pending
-
2023
- 2023-04-10 US US18/132,508 patent/US20230251144A1/en active Pending
Cited By (2)
| Publication number | Priority date | Publication date | Assignee | Title |
|---|---|---|---|---|
| CN116859831A (en) * | 2023-05-15 | 2023-10-10 | 广东思创智联科技股份有限公司 | Industrial big data processing method and system based on Internet of things |
| CN116859831B (en) * | 2023-05-15 | 2024-01-26 | 广东思创智联科技股份有限公司 | Industrial big data processing method and system based on Internet of things |
Also Published As
| Publication number | Publication date |
|---|---|
| KR20220027090A (en) | 2022-03-07 |
| CA3142176C (en) | 2023-02-07 |
| JP2022532435A (en) | 2022-07-14 |
| CA3142176A1 (en) | 2021-01-07 |
| AU2020300996A1 (en) | 2022-01-06 |
| AU2020300996B2 (en) | 2022-05-26 |
| EP3994435A4 (en) | 2022-08-24 |
| KR102630649B1 (en) | 2024-01-30 |
| BR112021024367A2 (en) | 2022-01-11 |
| WO2021003140A1 (en) | 2021-01-07 |
| KR20240016453A (en) | 2024-02-06 |
| EP3994435A1 (en) | 2022-05-11 |
| AU2022218630A1 (en) | 2022-09-15 |
| MX2021015697A (en) | 2022-02-21 |
| US11686626B2 (en) | 2023-06-27 |
| US20230251144A1 (en) | 2023-08-10 |
| US20220390292A1 (en) | 2022-12-08 |
Similar Documents
| Publication | Publication Date | Title |
|---|---|---|
| AU2020300996B2 (en) | Apparatus, systems, and methods for non-invasive thermal interrogation | |
| US11920987B2 (en) | Fast response temperature sensors | |
| JP7151607B2 (en) | Temperature measuring device and temperature measuring method | |
| US20220000370A1 (en) | Core body temperature sensor system based on flux measurement | |
| CN110375883B (en) | Thermometer based on active heat flow control and temperature measuring method thereof | |
| CN107607229A (en) | Method for the temperature calibration instrument and progress temperature correction of thermosphere analysis probe | |
| CN111141420A (en) | Object deep temperature measuring method and device based on heat flow method | |
| Taberner et al. | Characterization of a flow-through microcalorimeter for measuring the heat production of cardiac trabeculae | |
| Žužek et al. | Calibration of Air Thermometers in a Climatic Chamber and Liquid Baths | |
| CN111741709A (en) | Body core temperature sensor with two TEGs | |
| JP2005140693A (en) | Method and apparatus for identifying thermophysical property values | |
| Addabbo et al. | Development of a non-invasive thermometric system for fluids in pipes | |
| Assaad et al. | Thin-film heat flux sensor for measuring the film coefficient of rubber components of a rolling tire | |
| Bezuidenhout et al. | Heat flux determination using surface and backface temperature histories and inverse methods | |
| Liang et al. | Microfabricated thermal conductivity sensor: a high resolution tool for quantitative thermal property measurement of biomaterials and solutions | |
| RU2762534C1 (en) | Method for determining heat transfer coefficient of materials and device for its implementation | |
| Suleiman | Alternative fitting procedures to enhance the performance of resistive sensors for thermal transient measurements | |
| JP2018140048A (en) | Heat output control device | |
| Husain et al. | Development of Test Rig System for Calibration of Temperature Sensing Fabric | |
| Diller | Practical Heat Flux Measurement | |
| Saito et al. | Estimating surface temperature of a calibration apparatus for contact surface thermometers from its internal temperature profile | |
| Liu et al. | A novel temperature based flat-plate heat flux sensor for high accuracy measurement | |
| CN116698909A (en) | Thermophysical parameter measurement system and method based on heat flux | |
| Astarita et al. | Heat flux sensors | |
| Cousin et al. | A portable heat flux sensor |
Legal Events
| Date | Code | Title | Description |
|---|---|---|---|
| PB01 | Publication | ||
| PB01 | Publication | ||
| SE01 | Entry into force of request for substantive examination | ||
| SE01 | Entry into force of request for substantive examination | ||
| REG | Reference to a national code |
Ref country code: HK Ref legal event code: DE Ref document number: 40067262 Country of ref document: HK |