CN111500718A - NANO46 gene and method for predicting breast cancer outcome - Google Patents
NANO46 gene and method for predicting breast cancer outcome Download PDFInfo
- Publication number
- CN111500718A CN111500718A CN201911216650.9A CN201911216650A CN111500718A CN 111500718 A CN111500718 A CN 111500718A CN 201911216650 A CN201911216650 A CN 201911216650A CN 111500718 A CN111500718 A CN 111500718A
- Authority
- CN
- China
- Prior art keywords
- expression
- breast cancer
- intrinsic
- tumor
- sample
- Prior art date
- Legal status (The legal status is an assumption and is not a legal conclusion. Google has not performed a legal analysis and makes no representation as to the accuracy of the status listed.)
- Pending
Links
- 108090000623 proteins and genes Proteins 0.000 title claims abstract description 115
- 206010006187 Breast cancer Diseases 0.000 title claims abstract description 110
- 208000026310 Breast neoplasm Diseases 0.000 title claims abstract description 110
- 238000000034 method Methods 0.000 title claims abstract description 90
- 230000014509 gene expression Effects 0.000 claims abstract description 131
- 238000011282 treatment Methods 0.000 claims abstract description 21
- 239000003153 chemical reaction reagent Substances 0.000 claims abstract description 16
- 230000004044 response Effects 0.000 claims abstract description 4
- 239000000523 sample Substances 0.000 claims description 201
- 206010028980 Neoplasm Diseases 0.000 claims description 104
- 101001012157 Homo sapiens Receptor tyrosine-protein kinase erbB-2 Proteins 0.000 claims description 41
- 102100030086 Receptor tyrosine-protein kinase erbB-2 Human genes 0.000 claims description 41
- 108010038795 estrogen receptors Proteins 0.000 claims description 29
- 210000001165 lymph node Anatomy 0.000 claims description 19
- 230000035755 proliferation Effects 0.000 claims description 19
- 230000004083 survival effect Effects 0.000 claims description 19
- 102000003998 progesterone receptors Human genes 0.000 claims description 16
- 108090000468 progesterone receptors Proteins 0.000 claims description 16
- -1 ME L K Proteins 0.000 claims description 15
- KIAPWMKFHIKQOZ-UHFFFAOYSA-N 2-[[(4-fluorophenyl)-oxomethyl]amino]benzoic acid methyl ester Chemical compound COC(=O)C1=CC=CC=C1NC(=O)C1=CC=C(F)C=C1 KIAPWMKFHIKQOZ-UHFFFAOYSA-N 0.000 claims description 7
- 108700020472 CDC20 Proteins 0.000 claims description 7
- 101150023302 Cdc20 gene Proteins 0.000 claims description 7
- 102100027047 Cell division control protein 6 homolog Human genes 0.000 claims description 7
- 102100038099 Cell division cycle protein 20 homolog Human genes 0.000 claims description 7
- 102100023344 Centromere protein F Human genes 0.000 claims description 7
- 102100031219 Centrosomal protein of 55 kDa Human genes 0.000 claims description 7
- 101710092479 Centrosomal protein of 55 kDa Proteins 0.000 claims description 7
- 102100029075 Exonuclease 1 Human genes 0.000 claims description 7
- 102100037858 G1/S-specific cyclin-E1 Human genes 0.000 claims description 7
- 101000914465 Homo sapiens Cell division control protein 6 homolog Proteins 0.000 claims description 7
- 101000907941 Homo sapiens Centromere protein F Proteins 0.000 claims description 7
- 101000918264 Homo sapiens Exonuclease 1 Proteins 0.000 claims description 7
- 101000738568 Homo sapiens G1/S-specific cyclin-E1 Proteins 0.000 claims description 7
- 101001050567 Homo sapiens Kinesin-like protein KIF2C Proteins 0.000 claims description 7
- 101001112162 Homo sapiens Kinetochore protein NDC80 homolog Proteins 0.000 claims description 7
- 101000590482 Homo sapiens Kinetochore protein Nuf2 Proteins 0.000 claims description 7
- 101000837581 Homo sapiens Ubiquitin-conjugating enzyme E2 T Proteins 0.000 claims description 7
- 102100023424 Kinesin-like protein KIF2C Human genes 0.000 claims description 7
- 102100023890 Kinetochore protein NDC80 homolog Human genes 0.000 claims description 7
- 102100032431 Kinetochore protein Nuf2 Human genes 0.000 claims description 7
- 101100010298 Schizosaccharomyces pombe (strain 972 / ATCC 24843) pol2 gene Proteins 0.000 claims description 7
- 102100028705 Ubiquitin-conjugating enzyme E2 T Human genes 0.000 claims description 7
- 101000945496 Homo sapiens Proliferation marker protein Ki-67 Proteins 0.000 claims description 6
- 102100034836 Proliferation marker protein Ki-67 Human genes 0.000 claims description 6
- 101000575639 Homo sapiens Ribonucleoside-diphosphate reductase subunit M2 Proteins 0.000 claims description 5
- 101000809797 Homo sapiens Thymidylate synthase Proteins 0.000 claims description 5
- 102100026006 Ribonucleoside-diphosphate reductase subunit M2 Human genes 0.000 claims description 5
- 102100038618 Thymidylate synthase Human genes 0.000 claims description 5
- 239000003550 marker Substances 0.000 claims description 5
- 101001087372 Homo sapiens Securin Proteins 0.000 claims description 4
- 101000807354 Homo sapiens Ubiquitin-conjugating enzyme E2 C Proteins 0.000 claims description 4
- 102100033004 Securin Human genes 0.000 claims description 4
- 102100037256 Ubiquitin-conjugating enzyme E2 C Human genes 0.000 claims description 4
- 239000000178 monomer Substances 0.000 claims description 3
- 230000001575 pathological effect Effects 0.000 claims description 3
- 238000002360 preparation method Methods 0.000 claims description 3
- 102100038595 Estrogen receptor Human genes 0.000 claims 6
- WVAKRQOMAINQPU-UHFFFAOYSA-N 2-[4-[2-[5-(2,2-dimethylbutyl)-1h-imidazol-2-yl]ethyl]phenyl]pyridine Chemical compound N1C(CC(C)(C)CC)=CN=C1CCC1=CC=C(C=2N=CC=CC=2)C=C1 WVAKRQOMAINQPU-UHFFFAOYSA-N 0.000 claims 3
- 102100029631 Actin-related protein 3B Human genes 0.000 claims 3
- 102100037152 BAG family molecular chaperone regulator 1 Human genes 0.000 claims 3
- 102100036167 CXXC-type zinc finger protein 5 Human genes 0.000 claims 3
- 102100024153 Cadherin-15 Human genes 0.000 claims 3
- 102100037579 D-3-phosphoglycerate dehydrogenase Human genes 0.000 claims 3
- 102000012199 E3 ubiquitin-protein ligase Mdm2 Human genes 0.000 claims 3
- 108050002772 E3 ubiquitin-protein ligase Mdm2 Proteins 0.000 claims 3
- 102100027844 Fibroblast growth factor receptor 4 Human genes 0.000 claims 3
- 102100029283 Hepatocyte nuclear factor 3-alpha Human genes 0.000 claims 3
- 101000728742 Homo sapiens Actin-related protein 3B Proteins 0.000 claims 3
- 101000740062 Homo sapiens BAG family molecular chaperone regulator 1 Proteins 0.000 claims 3
- 101000947154 Homo sapiens CXXC-type zinc finger protein 5 Proteins 0.000 claims 3
- 101000762242 Homo sapiens Cadherin-15 Proteins 0.000 claims 3
- 101000714553 Homo sapiens Cadherin-3 Proteins 0.000 claims 3
- 101000739890 Homo sapiens D-3-phosphoglycerate dehydrogenase Proteins 0.000 claims 3
- 101000882584 Homo sapiens Estrogen receptor Proteins 0.000 claims 3
- 101000917134 Homo sapiens Fibroblast growth factor receptor 4 Proteins 0.000 claims 3
- 101001062353 Homo sapiens Hepatocyte nuclear factor 3-alpha Proteins 0.000 claims 3
- 101000614436 Homo sapiens Keratin, type I cytoskeletal 14 Proteins 0.000 claims 3
- 101000998027 Homo sapiens Keratin, type I cytoskeletal 17 Proteins 0.000 claims 3
- 101001056473 Homo sapiens Keratin, type II cytoskeletal 5 Proteins 0.000 claims 3
- 101000891579 Homo sapiens Microtubule-associated protein tau Proteins 0.000 claims 3
- 101000857740 Homo sapiens Probable G-protein coupled receptor 160 Proteins 0.000 claims 3
- 102100040445 Keratin, type I cytoskeletal 14 Human genes 0.000 claims 3
- 102100033511 Keratin, type I cytoskeletal 17 Human genes 0.000 claims 3
- 102100025756 Keratin, type II cytoskeletal 5 Human genes 0.000 claims 3
- 102100040243 Microtubule-associated protein tau Human genes 0.000 claims 3
- 102100025346 Probable G-protein coupled receptor 160 Human genes 0.000 claims 3
- 108010061477 Securin Proteins 0.000 claims 3
- 102000012152 Securin Human genes 0.000 claims 3
- 102000052116 epidermal growth factor receptor activity proteins Human genes 0.000 claims 3
- 108700015053 epidermal growth factor receptor activity proteins Proteins 0.000 claims 3
- YOHYSYJDKVYCJI-UHFFFAOYSA-N n-[3-[[6-[3-(trifluoromethyl)anilino]pyrimidin-4-yl]amino]phenyl]cyclopropanecarboxamide Chemical compound FC(F)(F)C1=CC=CC(NC=2N=CN=C(NC=3C=C(NC(=O)C4CC4)C=CC=3)C=2)=C1 YOHYSYJDKVYCJI-UHFFFAOYSA-N 0.000 claims 3
- 102100021084 Forkhead box protein C1 Human genes 0.000 claims 2
- 101000818310 Homo sapiens Forkhead box protein C1 Proteins 0.000 claims 2
- 101000662026 Homo sapiens Ubiquitin-like modifier-activating enzyme 7 Proteins 0.000 claims 2
- 102100037938 Ubiquitin-like modifier-activating enzyme 7 Human genes 0.000 claims 2
- 102220266487 rs1327516147 Human genes 0.000 claims 2
- 101100281516 Caenorhabditis elegans fox-1 gene Proteins 0.000 claims 1
- 101100518413 Caenorhabditis elegans orc-2 gene Proteins 0.000 claims 1
- 238000003556 assay Methods 0.000 abstract description 39
- 238000004422 calculation algorithm Methods 0.000 abstract description 19
- 238000004393 prognosis Methods 0.000 abstract description 8
- 238000002493 microarray Methods 0.000 abstract description 7
- 239000000203 mixture Substances 0.000 abstract description 4
- 238000003753 real-time PCR Methods 0.000 abstract 1
- 238000012360 testing method Methods 0.000 description 58
- 108091032973 (ribonucleotides)n+m Proteins 0.000 description 57
- 210000001519 tissue Anatomy 0.000 description 40
- 238000009396 hybridization Methods 0.000 description 37
- 102000015694 estrogen receptors Human genes 0.000 description 26
- 108700039887 Essential Genes Proteins 0.000 description 22
- 238000004458 analytical method Methods 0.000 description 22
- 208000026534 luminal B breast carcinoma Diseases 0.000 description 21
- 210000004027 cell Anatomy 0.000 description 16
- 108020004999 messenger RNA Proteins 0.000 description 16
- 239000012472 biological sample Substances 0.000 description 15
- 239000013074 reference sample Substances 0.000 description 15
- 201000011510 cancer Diseases 0.000 description 14
- 238000006243 chemical reaction Methods 0.000 description 13
- 238000010606 normalization Methods 0.000 description 13
- NKANXQFJJICGDU-QPLCGJKRSA-N Tamoxifen Chemical compound C=1C=CC=CC=1C(/CC)=C(C=1C=CC(OCCN(C)C)=CC=1)/C1=CC=CC=C1 NKANXQFJJICGDU-QPLCGJKRSA-N 0.000 description 12
- 230000004913 activation Effects 0.000 description 12
- 210000000481 breast Anatomy 0.000 description 12
- 239000013642 negative control Substances 0.000 description 12
- 201000010099 disease Diseases 0.000 description 11
- 208000037265 diseases, disorders, signs and symptoms Diseases 0.000 description 11
- 239000013641 positive control Substances 0.000 description 11
- 238000000746 purification Methods 0.000 description 11
- 238000012549 training Methods 0.000 description 11
- 108020004414 DNA Proteins 0.000 description 10
- 230000022131 cell cycle Effects 0.000 description 10
- 101100314454 Caenorhabditis elegans tra-1 gene Proteins 0.000 description 9
- 239000013614 RNA sample Substances 0.000 description 9
- 230000000875 corresponding effect Effects 0.000 description 9
- 238000010586 diagram Methods 0.000 description 9
- 238000003199 nucleic acid amplification method Methods 0.000 description 9
- 239000000758 substrate Substances 0.000 description 9
- 238000002123 RNA extraction Methods 0.000 description 8
- 238000001514 detection method Methods 0.000 description 8
- 238000003384 imaging method Methods 0.000 description 8
- 238000000338 in vitro Methods 0.000 description 8
- 150000007523 nucleic acids Chemical class 0.000 description 8
- 239000013615 primer Substances 0.000 description 8
- 230000008569 process Effects 0.000 description 8
- 238000012545 processing Methods 0.000 description 8
- 101150029707 ERBB2 gene Proteins 0.000 description 7
- 230000003321 amplification Effects 0.000 description 7
- 230000027455 binding Effects 0.000 description 7
- 238000001574 biopsy Methods 0.000 description 7
- 238000013145 classification model Methods 0.000 description 7
- 238000013480 data collection Methods 0.000 description 7
- 230000005484 gravity Effects 0.000 description 7
- 102000039446 nucleic acids Human genes 0.000 description 7
- 108020004707 nucleic acids Proteins 0.000 description 7
- 230000007170 pathology Effects 0.000 description 7
- 239000000047 product Substances 0.000 description 7
- 102000001301 EGF receptor Human genes 0.000 description 6
- 108060006698 EGF receptor Proteins 0.000 description 6
- 102000011782 Keratins Human genes 0.000 description 6
- 108010076876 Keratins Proteins 0.000 description 6
- 239000011324 bead Substances 0.000 description 6
- 239000000872 buffer Substances 0.000 description 6
- 238000009261 endocrine therapy Methods 0.000 description 6
- 229940034984 endocrine therapy antineoplastic and immunomodulating agent Drugs 0.000 description 6
- 238000010438 heat treatment Methods 0.000 description 6
- 108091008039 hormone receptors Proteins 0.000 description 6
- 239000000243 solution Substances 0.000 description 6
- 229960001603 tamoxifen Drugs 0.000 description 6
- 238000012546 transfer Methods 0.000 description 6
- 108091034117 Oligonucleotide Proteins 0.000 description 5
- 210000001124 body fluid Anatomy 0.000 description 5
- 102000040430 polynucleotide Human genes 0.000 description 5
- 108091033319 polynucleotide Proteins 0.000 description 5
- 239000002157 polynucleotide Substances 0.000 description 5
- 238000003908 quality control method Methods 0.000 description 5
- 230000002829 reductive effect Effects 0.000 description 5
- YBJHBAHKTGYVGT-ZKWXMUAHSA-N (+)-Biotin Chemical compound N1C(=O)N[C@@H]2[C@H](CCCCC(=O)O)SC[C@@H]21 YBJHBAHKTGYVGT-ZKWXMUAHSA-N 0.000 description 4
- 201000009030 Carcinoma Diseases 0.000 description 4
- WSFSSNUMVMOOMR-UHFFFAOYSA-N Formaldehyde Chemical compound O=C WSFSSNUMVMOOMR-UHFFFAOYSA-N 0.000 description 4
- 206010027476 Metastases Diseases 0.000 description 4
- 108010090804 Streptavidin Proteins 0.000 description 4
- 238000003491 array Methods 0.000 description 4
- 238000003149 assay kit Methods 0.000 description 4
- 239000000090 biomarker Substances 0.000 description 4
- 229960002685 biotin Drugs 0.000 description 4
- 239000011616 biotin Substances 0.000 description 4
- 210000004369 blood Anatomy 0.000 description 4
- 239000008280 blood Substances 0.000 description 4
- 238000003745 diagnosis Methods 0.000 description 4
- 238000012757 fluorescence staining Methods 0.000 description 4
- 210000002751 lymph Anatomy 0.000 description 4
- 238000005259 measurement Methods 0.000 description 4
- 230000009401 metastasis Effects 0.000 description 4
- 238000003757 reverse transcription PCR Methods 0.000 description 4
- 239000007787 solid Substances 0.000 description 4
- 230000009897 systematic effect Effects 0.000 description 4
- 238000002560 therapeutic procedure Methods 0.000 description 4
- 239000003155 DNA primer Substances 0.000 description 3
- 108020004711 Nucleic Acid Probes Proteins 0.000 description 3
- 108091028043 Nucleic acid sequence Proteins 0.000 description 3
- 239000002202 Polyethylene glycol Substances 0.000 description 3
- 239000000427 antigen Substances 0.000 description 3
- 108091007433 antigens Proteins 0.000 description 3
- 102000036639 antigens Human genes 0.000 description 3
- 238000013459 approach Methods 0.000 description 3
- 238000002512 chemotherapy Methods 0.000 description 3
- 230000000295 complement effect Effects 0.000 description 3
- 238000004590 computer program Methods 0.000 description 3
- 239000000975 dye Substances 0.000 description 3
- 230000005684 electric field Effects 0.000 description 3
- 238000005516 engineering process Methods 0.000 description 3
- 238000010195 expression analysis Methods 0.000 description 3
- 239000000017 hydrogel Substances 0.000 description 3
- 238000012744 immunostaining Methods 0.000 description 3
- 239000007788 liquid Substances 0.000 description 3
- 230000007774 longterm Effects 0.000 description 3
- 239000002853 nucleic acid probe Substances 0.000 description 3
- 239000002773 nucleotide Substances 0.000 description 3
- 125000003729 nucleotide group Chemical group 0.000 description 3
- 239000012188 paraffin wax Substances 0.000 description 3
- 229920001223 polyethylene glycol Polymers 0.000 description 3
- 238000000513 principal component analysis Methods 0.000 description 3
- 238000011002 quantification Methods 0.000 description 3
- 238000012552 review Methods 0.000 description 3
- 238000003860 storage Methods 0.000 description 3
- 230000009466 transformation Effects 0.000 description 3
- 238000000844 transformation Methods 0.000 description 3
- 238000010200 validation analysis Methods 0.000 description 3
- 102000040650 (ribonucleotides)n+m Human genes 0.000 description 2
- 101150078635 18 gene Proteins 0.000 description 2
- 108010058546 Cyclin D1 Proteins 0.000 description 2
- 238000008157 ELISA kit Methods 0.000 description 2
- 102100024165 G1/S-specific cyclin-D1 Human genes 0.000 description 2
- 101000819111 Homo sapiens Trans-acting T-cell-specific transcription factor GATA-3 Proteins 0.000 description 2
- 102100033421 Keratin, type I cytoskeletal 18 Human genes 0.000 description 2
- 102100023972 Keratin, type II cytoskeletal 8 Human genes 0.000 description 2
- 108010066327 Keratin-18 Proteins 0.000 description 2
- 108010070511 Keratin-8 Proteins 0.000 description 2
- 238000003657 Likelihood-ratio test Methods 0.000 description 2
- 101150096336 PGR gene Proteins 0.000 description 2
- 238000010802 RNA extraction kit Methods 0.000 description 2
- 102100021386 Trans-acting T-cell-specific transcription factor GATA-3 Human genes 0.000 description 2
- 239000007983 Tris buffer Substances 0.000 description 2
- 239000002313 adhesive film Substances 0.000 description 2
- 230000008901 benefit Effects 0.000 description 2
- 235000020958 biotin Nutrition 0.000 description 2
- 238000004364 calculation method Methods 0.000 description 2
- 238000007621 cluster analysis Methods 0.000 description 2
- 230000002596 correlated effect Effects 0.000 description 2
- 230000002950 deficient Effects 0.000 description 2
- 230000009977 dual effect Effects 0.000 description 2
- 229940011871 estrogen Drugs 0.000 description 2
- 239000000262 estrogen Substances 0.000 description 2
- 238000001704 evaporation Methods 0.000 description 2
- 230000008020 evaporation Effects 0.000 description 2
- 238000000605 extraction Methods 0.000 description 2
- 230000006870 function Effects 0.000 description 2
- 239000000499 gel Substances 0.000 description 2
- 239000011521 glass Substances 0.000 description 2
- 230000036541 health Effects 0.000 description 2
- 208000027706 hormone receptor-positive breast cancer Diseases 0.000 description 2
- 206010073095 invasive ductal breast carcinoma Diseases 0.000 description 2
- 201000010985 invasive ductal carcinoma Diseases 0.000 description 2
- 208000026535 luminal A breast carcinoma Diseases 0.000 description 2
- 239000011159 matrix material Substances 0.000 description 2
- 238000012986 modification Methods 0.000 description 2
- 230000004048 modification Effects 0.000 description 2
- 210000002445 nipple Anatomy 0.000 description 2
- 230000003287 optical effect Effects 0.000 description 2
- 102000004169 proteins and genes Human genes 0.000 description 2
- 238000011084 recovery Methods 0.000 description 2
- 238000011160 research Methods 0.000 description 2
- 230000004043 responsiveness Effects 0.000 description 2
- 210000003296 saliva Anatomy 0.000 description 2
- 238000007790 scraping Methods 0.000 description 2
- 238000012216 screening Methods 0.000 description 2
- 238000010186 staining Methods 0.000 description 2
- 238000004448 titration Methods 0.000 description 2
- 238000013518 transcription Methods 0.000 description 2
- 230000035897 transcription Effects 0.000 description 2
- 238000011269 treatment regimen Methods 0.000 description 2
- LENZDBCJOHFCAS-UHFFFAOYSA-N tris Chemical compound OCC(N)(CO)CO LENZDBCJOHFCAS-UHFFFAOYSA-N 0.000 description 2
- 210000002700 urine Anatomy 0.000 description 2
- HSTOKWSFWGCZMH-UHFFFAOYSA-N 3,3'-diaminobenzidine Chemical compound C1=C(N)C(N)=CC=C1C1=CC=C(N)C(N)=C1 HSTOKWSFWGCZMH-UHFFFAOYSA-N 0.000 description 1
- TVZRAEYQIKYCPH-UHFFFAOYSA-N 3-(trimethylsilyl)propane-1-sulfonic acid Chemical compound C[Si](C)(C)CCCS(O)(=O)=O TVZRAEYQIKYCPH-UHFFFAOYSA-N 0.000 description 1
- 101150031143 46 gene Proteins 0.000 description 1
- 238000000018 DNA microarray Methods 0.000 description 1
- 102000016928 DNA-directed DNA polymerase Human genes 0.000 description 1
- 108010014303 DNA-directed DNA polymerase Proteins 0.000 description 1
- 206010061819 Disease recurrence Diseases 0.000 description 1
- 241001125671 Eretmochelys imbricata Species 0.000 description 1
- 238000012413 Fluorescence activated cell sorting analysis Methods 0.000 description 1
- 102100032340 G2/mitotic-specific cyclin-B1 Human genes 0.000 description 1
- 108700031843 GRB7 Adaptor Proteins 0.000 description 1
- 101150052409 GRB7 gene Proteins 0.000 description 1
- 102100033107 Growth factor receptor-bound protein 7 Human genes 0.000 description 1
- 101000868643 Homo sapiens G2/mitotic-specific cyclin-B1 Proteins 0.000 description 1
- 206010073099 Lobular breast carcinoma in situ Diseases 0.000 description 1
- 208000007433 Lymphatic Metastasis Diseases 0.000 description 1
- 239000004594 Masterbatch (MB) Substances 0.000 description 1
- 241001465754 Metazoa Species 0.000 description 1
- 239000000020 Nitrocellulose Substances 0.000 description 1
- 238000000636 Northern blotting Methods 0.000 description 1
- 108020005187 Oligonucleotide Probes Proteins 0.000 description 1
- 238000010222 PCR analysis Methods 0.000 description 1
- 102000035195 Peptidases Human genes 0.000 description 1
- 108091005804 Peptidases Proteins 0.000 description 1
- 206010034960 Photophobia Diseases 0.000 description 1
- RJKFOVLPORLFTN-LEKSSAKUSA-N Progesterone Chemical class C1CC2=CC(=O)CC[C@]2(C)[C@@H]2[C@@H]1[C@@H]1CC[C@H](C(=O)C)[C@@]1(C)CC2 RJKFOVLPORLFTN-LEKSSAKUSA-N 0.000 description 1
- 239000004365 Protease Substances 0.000 description 1
- 108010066717 Q beta Replicase Proteins 0.000 description 1
- 102000006382 Ribonucleases Human genes 0.000 description 1
- 108010083644 Ribonucleases Proteins 0.000 description 1
- 206010039491 Sarcoma Diseases 0.000 description 1
- 108010002687 Survivin Proteins 0.000 description 1
- 102000000763 Survivin Human genes 0.000 description 1
- 229940123237 Taxane Drugs 0.000 description 1
- JLCPHMBAVCMARE-UHFFFAOYSA-N [3-[[3-[[3-[[3-[[3-[[3-[[3-[[3-[[3-[[3-[[3-[[5-(2-amino-6-oxo-1H-purin-9-yl)-3-[[3-[[3-[[3-[[3-[[3-[[5-(2-amino-6-oxo-1H-purin-9-yl)-3-[[5-(2-amino-6-oxo-1H-purin-9-yl)-3-hydroxyoxolan-2-yl]methoxy-hydroxyphosphoryl]oxyoxolan-2-yl]methoxy-hydroxyphosphoryl]oxy-5-(5-methyl-2,4-dioxopyrimidin-1-yl)oxolan-2-yl]methoxy-hydroxyphosphoryl]oxy-5-(6-aminopurin-9-yl)oxolan-2-yl]methoxy-hydroxyphosphoryl]oxy-5-(6-aminopurin-9-yl)oxolan-2-yl]methoxy-hydroxyphosphoryl]oxy-5-(6-aminopurin-9-yl)oxolan-2-yl]methoxy-hydroxyphosphoryl]oxy-5-(6-aminopurin-9-yl)oxolan-2-yl]methoxy-hydroxyphosphoryl]oxyoxolan-2-yl]methoxy-hydroxyphosphoryl]oxy-5-(5-methyl-2,4-dioxopyrimidin-1-yl)oxolan-2-yl]methoxy-hydroxyphosphoryl]oxy-5-(4-amino-2-oxopyrimidin-1-yl)oxolan-2-yl]methoxy-hydroxyphosphoryl]oxy-5-(5-methyl-2,4-dioxopyrimidin-1-yl)oxolan-2-yl]methoxy-hydroxyphosphoryl]oxy-5-(5-methyl-2,4-dioxopyrimidin-1-yl)oxolan-2-yl]methoxy-hydroxyphosphoryl]oxy-5-(6-aminopurin-9-yl)oxolan-2-yl]methoxy-hydroxyphosphoryl]oxy-5-(6-aminopurin-9-yl)oxolan-2-yl]methoxy-hydroxyphosphoryl]oxy-5-(4-amino-2-oxopyrimidin-1-yl)oxolan-2-yl]methoxy-hydroxyphosphoryl]oxy-5-(4-amino-2-oxopyrimidin-1-yl)oxolan-2-yl]methoxy-hydroxyphosphoryl]oxy-5-(4-amino-2-oxopyrimidin-1-yl)oxolan-2-yl]methoxy-hydroxyphosphoryl]oxy-5-(6-aminopurin-9-yl)oxolan-2-yl]methoxy-hydroxyphosphoryl]oxy-5-(4-amino-2-oxopyrimidin-1-yl)oxolan-2-yl]methyl [5-(6-aminopurin-9-yl)-2-(hydroxymethyl)oxolan-3-yl] hydrogen phosphate Polymers Cc1cn(C2CC(OP(O)(=O)OCC3OC(CC3OP(O)(=O)OCC3OC(CC3O)n3cnc4c3nc(N)[nH]c4=O)n3cnc4c3nc(N)[nH]c4=O)C(COP(O)(=O)OC3CC(OC3COP(O)(=O)OC3CC(OC3COP(O)(=O)OC3CC(OC3COP(O)(=O)OC3CC(OC3COP(O)(=O)OC3CC(OC3COP(O)(=O)OC3CC(OC3COP(O)(=O)OC3CC(OC3COP(O)(=O)OC3CC(OC3COP(O)(=O)OC3CC(OC3COP(O)(=O)OC3CC(OC3COP(O)(=O)OC3CC(OC3COP(O)(=O)OC3CC(OC3COP(O)(=O)OC3CC(OC3COP(O)(=O)OC3CC(OC3COP(O)(=O)OC3CC(OC3COP(O)(=O)OC3CC(OC3COP(O)(=O)OC3CC(OC3CO)n3cnc4c(N)ncnc34)n3ccc(N)nc3=O)n3cnc4c(N)ncnc34)n3ccc(N)nc3=O)n3ccc(N)nc3=O)n3ccc(N)nc3=O)n3cnc4c(N)ncnc34)n3cnc4c(N)ncnc34)n3cc(C)c(=O)[nH]c3=O)n3cc(C)c(=O)[nH]c3=O)n3ccc(N)nc3=O)n3cc(C)c(=O)[nH]c3=O)n3cnc4c3nc(N)[nH]c4=O)n3cnc4c(N)ncnc34)n3cnc4c(N)ncnc34)n3cnc4c(N)ncnc34)n3cnc4c(N)ncnc34)O2)c(=O)[nH]c1=O JLCPHMBAVCMARE-UHFFFAOYSA-N 0.000 description 1
- 238000011481 absorbance measurement Methods 0.000 description 1
- 208000009956 adenocarcinoma Diseases 0.000 description 1
- 238000009260 adjuvant endocrine therapy Methods 0.000 description 1
- 238000009098 adjuvant therapy Methods 0.000 description 1
- 230000002411 adverse Effects 0.000 description 1
- 238000001261 affinity purification Methods 0.000 description 1
- 239000011543 agarose gel Substances 0.000 description 1
- 229960002932 anastrozole Drugs 0.000 description 1
- YBBLVLTVTVSKRW-UHFFFAOYSA-N anastrozole Chemical compound N#CC(C)(C)C1=CC(C(C)(C#N)C)=CC(CN2N=CN=C2)=C1 YBBLVLTVTVSKRW-UHFFFAOYSA-N 0.000 description 1
- 229940045799 anthracyclines and related substance Drugs 0.000 description 1
- 108010068991 arginyl-threonyl-prolyl-prolyl-prolyl-seryl-glycine Proteins 0.000 description 1
- 239000003886 aromatase inhibitor Substances 0.000 description 1
- 229940046844 aromatase inhibitors Drugs 0.000 description 1
- 239000013584 assay control Substances 0.000 description 1
- 208000010572 basal-like breast carcinoma Diseases 0.000 description 1
- 230000029918 bioluminescence Effects 0.000 description 1
- 238000005415 bioluminescence Methods 0.000 description 1
- 239000003914 blood derivative Substances 0.000 description 1
- 239000010839 body fluid Substances 0.000 description 1
- 201000005389 breast carcinoma in situ Diseases 0.000 description 1
- AIYUHDOJVYHVIT-UHFFFAOYSA-M caesium chloride Chemical compound [Cl-].[Cs+] AIYUHDOJVYHVIT-UHFFFAOYSA-M 0.000 description 1
- 239000007795 chemical reaction product Substances 0.000 description 1
- 239000003795 chemical substances by application Substances 0.000 description 1
- 238000007635 classification algorithm Methods 0.000 description 1
- 238000003776 cleavage reaction Methods 0.000 description 1
- 239000002299 complementary DNA Substances 0.000 description 1
- 238000002790 cross-validation Methods 0.000 description 1
- 238000005520 cutting process Methods 0.000 description 1
- 238000007405 data analysis Methods 0.000 description 1
- 230000007423 decrease Effects 0.000 description 1
- 238000000432 density-gradient centrifugation Methods 0.000 description 1
- 238000002224 dissection Methods 0.000 description 1
- 238000011143 downstream manufacturing Methods 0.000 description 1
- 208000028715 ductal breast carcinoma in situ Diseases 0.000 description 1
- 238000006911 enzymatic reaction Methods 0.000 description 1
- 150000002148 esters Chemical class 0.000 description 1
- 201000007281 estrogen-receptor positive breast cancer Diseases 0.000 description 1
- 238000011156 evaluation Methods 0.000 description 1
- 238000007387 excisional biopsy Methods 0.000 description 1
- 230000007717 exclusion Effects 0.000 description 1
- 230000001747 exhibiting effect Effects 0.000 description 1
- 238000002474 experimental method Methods 0.000 description 1
- 210000000416 exudates and transudate Anatomy 0.000 description 1
- 239000000835 fiber Substances 0.000 description 1
- 239000000834 fixative Substances 0.000 description 1
- 239000012530 fluid Substances 0.000 description 1
- 238000003633 gene expression assay Methods 0.000 description 1
- 238000011223 gene expression profiling Methods 0.000 description 1
- 238000007429 general method Methods 0.000 description 1
- 230000002068 genetic effect Effects 0.000 description 1
- 238000009499 grossing Methods 0.000 description 1
- 238000010562 histological examination Methods 0.000 description 1
- 230000001900 immune effect Effects 0.000 description 1
- 230000002055 immunohistochemical effect Effects 0.000 description 1
- 238000012151 immunohistochemical method Methods 0.000 description 1
- 238000003364 immunohistochemistry Methods 0.000 description 1
- 230000006872 improvement Effects 0.000 description 1
- 238000007901 in situ hybridization Methods 0.000 description 1
- 238000011534 incubation Methods 0.000 description 1
- 230000000977 initiatory effect Effects 0.000 description 1
- 238000007689 inspection Methods 0.000 description 1
- 208000030776 invasive breast carcinoma Diseases 0.000 description 1
- 208000024312 invasive carcinoma Diseases 0.000 description 1
- 206010073096 invasive lobular breast carcinoma Diseases 0.000 description 1
- 230000003447 ipsilateral effect Effects 0.000 description 1
- 238000002955 isolation Methods 0.000 description 1
- 238000002372 labelling Methods 0.000 description 1
- 238000007834 ligase chain reaction Methods 0.000 description 1
- 208000013469 light sensitivity Diseases 0.000 description 1
- 201000011059 lobular neoplasia Diseases 0.000 description 1
- 238000002595 magnetic resonance imaging Methods 0.000 description 1
- 230000036210 malignancy Effects 0.000 description 1
- 230000003211 malignant effect Effects 0.000 description 1
- 210000005075 mammary gland Anatomy 0.000 description 1
- 238000009607 mammography Methods 0.000 description 1
- 238000012067 mathematical method Methods 0.000 description 1
- 238000013178 mathematical model Methods 0.000 description 1
- 238000000133 mechanosynthesis reaction Methods 0.000 description 1
- 239000012528 membrane Substances 0.000 description 1
- 238000002156 mixing Methods 0.000 description 1
- 238000012544 monitoring process Methods 0.000 description 1
- 201000010879 mucinous adenocarcinoma Diseases 0.000 description 1
- 238000000491 multivariate analysis Methods 0.000 description 1
- 238000013188 needle biopsy Methods 0.000 description 1
- 229920001220 nitrocellulos Polymers 0.000 description 1
- 230000009871 nonspecific binding Effects 0.000 description 1
- 238000002966 oligonucleotide array Methods 0.000 description 1
- 239000002751 oligonucleotide probe Substances 0.000 description 1
- 239000013307 optical fiber Substances 0.000 description 1
- 239000005304 optical glass Substances 0.000 description 1
- 230000036961 partial effect Effects 0.000 description 1
- 230000037361 pathway Effects 0.000 description 1
- 238000003909 pattern recognition Methods 0.000 description 1
- 210000002381 plasma Anatomy 0.000 description 1
- 239000013612 plasmid Substances 0.000 description 1
- 229920000642 polymer Polymers 0.000 description 1
- 238000010837 poor prognosis Methods 0.000 description 1
- 238000002600 positron emission tomography Methods 0.000 description 1
- 108090000765 processed proteins & peptides Proteins 0.000 description 1
- 239000000583 progesterone congener Substances 0.000 description 1
- 230000001681 protective effect Effects 0.000 description 1
- 102000005962 receptors Human genes 0.000 description 1
- 108020003175 receptors Proteins 0.000 description 1
- 230000010076 replication Effects 0.000 description 1
- 238000005096 rolling process Methods 0.000 description 1
- 230000007017 scission Effects 0.000 description 1
- 238000012163 sequencing technique Methods 0.000 description 1
- 210000002966 serum Anatomy 0.000 description 1
- NLJMYIDDQXHKNR-UHFFFAOYSA-K sodium citrate Chemical compound O.O.[Na+].[Na+].[Na+].[O-]C(=O)CC(O)(CC([O-])=O)C([O-])=O NLJMYIDDQXHKNR-UHFFFAOYSA-K 0.000 description 1
- 239000001509 sodium citrate Substances 0.000 description 1
- 239000012192 staining solution Substances 0.000 description 1
- 239000007858 starting material Substances 0.000 description 1
- 238000013179 statistical model Methods 0.000 description 1
- 210000001562 sternum Anatomy 0.000 description 1
- 230000001502 supplementing effect Effects 0.000 description 1
- 238000001356 surgical procedure Methods 0.000 description 1
- 230000002459 sustained effect Effects 0.000 description 1
- 208000024891 symptom Diseases 0.000 description 1
- 230000002194 synthesizing effect Effects 0.000 description 1
- DKPFODGZWDEEBT-QFIAKTPHSA-N taxane Chemical class C([C@]1(C)CCC[C@@H](C)[C@H]1C1)C[C@H]2[C@H](C)CC[C@@H]1C2(C)C DKPFODGZWDEEBT-QFIAKTPHSA-N 0.000 description 1
- 230000008542 thermal sensitivity Effects 0.000 description 1
- 210000000779 thoracic wall Anatomy 0.000 description 1
- 210000004881 tumor cell Anatomy 0.000 description 1
- 238000001262 western blot Methods 0.000 description 1
Images


Classifications
-
- C—CHEMISTRY; METALLURGY
- C12—BIOCHEMISTRY; BEER; SPIRITS; WINE; VINEGAR; MICROBIOLOGY; ENZYMOLOGY; MUTATION OR GENETIC ENGINEERING
- C12Q—MEASURING OR TESTING PROCESSES INVOLVING ENZYMES, NUCLEIC ACIDS OR MICROORGANISMS; COMPOSITIONS OR TEST PAPERS THEREFOR; PROCESSES OF PREPARING SUCH COMPOSITIONS; CONDITION-RESPONSIVE CONTROL IN MICROBIOLOGICAL OR ENZYMOLOGICAL PROCESSES
- C12Q1/00—Measuring or testing processes involving enzymes, nucleic acids or microorganisms; Compositions therefor; Processes of preparing such compositions
- C12Q1/68—Measuring or testing processes involving enzymes, nucleic acids or microorganisms; Compositions therefor; Processes of preparing such compositions involving nucleic acids
- C12Q1/6876—Nucleic acid products used in the analysis of nucleic acids, e.g. primers or probes
- C12Q1/6883—Nucleic acid products used in the analysis of nucleic acids, e.g. primers or probes for diseases caused by alterations of genetic material
- C12Q1/6886—Nucleic acid products used in the analysis of nucleic acids, e.g. primers or probes for diseases caused by alterations of genetic material for cancer
-
- C—CHEMISTRY; METALLURGY
- C12—BIOCHEMISTRY; BEER; SPIRITS; WINE; VINEGAR; MICROBIOLOGY; ENZYMOLOGY; MUTATION OR GENETIC ENGINEERING
- C12Q—MEASURING OR TESTING PROCESSES INVOLVING ENZYMES, NUCLEIC ACIDS OR MICROORGANISMS; COMPOSITIONS OR TEST PAPERS THEREFOR; PROCESSES OF PREPARING SUCH COMPOSITIONS; CONDITION-RESPONSIVE CONTROL IN MICROBIOLOGICAL OR ENZYMOLOGICAL PROCESSES
- C12Q2600/00—Oligonucleotides characterized by their use
- C12Q2600/118—Prognosis of disease development
-
- C—CHEMISTRY; METALLURGY
- C12—BIOCHEMISTRY; BEER; SPIRITS; WINE; VINEGAR; MICROBIOLOGY; ENZYMOLOGY; MUTATION OR GENETIC ENGINEERING
- C12Q—MEASURING OR TESTING PROCESSES INVOLVING ENZYMES, NUCLEIC ACIDS OR MICROORGANISMS; COMPOSITIONS OR TEST PAPERS THEREFOR; PROCESSES OF PREPARING SUCH COMPOSITIONS; CONDITION-RESPONSIVE CONTROL IN MICROBIOLOGICAL OR ENZYMOLOGICAL PROCESSES
- C12Q2600/00—Oligonucleotides characterized by their use
- C12Q2600/158—Expression markers
Abstract
The present invention relates to a NANO46 gene and methods for predicting breast cancer outcome. In particular, the present application provides methods for classifying and for evaluating the prognosis of a subject with breast cancer. The method includes predicting breast cancer subtype using a supervised algorithm trained to stratify subjects on the basis of breast cancer intrinsic subtype. The prediction model is based on the gene expression profiles of the intrinsic genes listed in table 1. Further provided are compositions and methods for predicting the outcome or response to treatment of a subject diagnosed with or suspected of having breast cancer. These methods can be used to guide or determine treatment options for subjects with breast cancer. The methods of the invention further include means for evaluating gene expression profiles, including microarrays and quantitative polymerase chain reaction assays, as well as kits comprising reagents for performing the methods of the invention.
Description
The application is a divisional application of a Chinese patent application 'NANO 46 gene and method for predicting breast cancer result' filed in 2013, 5 and 22.
Cross reference to related applications
The present application claims the benefit of U.S. provisional application No.61/650,209 filed on day 22,5, 2012 and U.S. provisional application No.61/753,673 filed on day 17, 1, 2013. The contents of each of these applications are incorporated herein by reference in their entirety.
Technical Field
The present disclosure relates generally to the field of cancer biology, and specifically to the field of detection and identification of specific cancer cell phenotypes and correlation with appropriate treatment.
Background
Current methods of treating early breast cancer, including adjuvant therapy, have indeed improved survival and reduced recurrence. However, the risk of relapse may be underestimated in some patients, but overestimated in others.
Although the risk of relapse certainly decreases over time, sustained risk is observed in many studies, some of which involve tens of thousands of patients with breast cancer. Indeed, in these studies, some patients who experienced relapse after five years were previously considered "low risk" -for example, their cancer had not spread to the lymph nodes at the time of their initial diagnosis, or their estrogen receptor status was positive. In one of these studies, a number of relapses occurred more than five years after treatment. Thus, there is a need in the art to determine the risk of relapse and to determine treatments that reduce this risk and improve overall survival.
Disclosure of Invention
The present invention provides a method of predicting an outcome (outome) in a subject having breast cancer, comprising providing a tumor sample from the subject, determining expression of genes in an intrinsic gene list of NANO46 of Table 1 in the tumor sample, measuring similarity of the tumor sample to the intrinsic subtype based on expression of genes in an intrinsic gene list of NANO46, wherein the intrinsic subtype consists of at least Basal-like, luminal A (L columnar A), luminal B (L columnar B), or HER2-enriched (HER2-enriched), determining a proliferation score based on expression of a subset of proliferation genes in the gene list within NANO46, determining the size of the tumor, calculating a recurrence risk score using a weighted sum of the intrinsic subtype, proliferation score, and tumor size, and determining whether the subject has a low or high risk of recurrence based on the recurrence score.
In some embodiments, the methods of the invention may comprise determining the expression of at least one, a combination, or each of the NANO46 intrinsic genes described in Table 1. in some embodiments, the methods of the invention may comprise determining the expression of at least one, a combination, or each of the NANO46 intrinsic genes selected from AN L N, CCNE1, CDC20, CDC6, CDCA1, CENPF, CEP55, EXO1, KIF2C, KNTC2, ME L K, MKI67, ORC 6L, PTTG1, RRM2, TYMS, UBE2C, and/or UBE2T Analysis system (
 Analysis system)) determined the expression of members of the gene list intrinsic to NANO 46.
The method of the invention may comprise determining at least one, a combination or each of the following: tumor size, tumor grade, lymph node status, intrinsic subtype, estrogen receptor expression, progestin receptor expression, and HER2/ERBB2 expression.
The sample may be a cell or tissue sample. The sample may be a tumor. Tissue may be obtained from a biopsy. The sample may be a bodily fluid sample. The body fluid may be blood, lymph, urine, saliva or nipple aspirate.
While the present disclosure has been described in conjunction with the detailed description thereof, the foregoing description is intended to illustrate and not limit the scope of the disclosure, which is defined by the scope of the appended claims. Other aspects, advantages, and modifications are within the scope of the following claims.
The patent and scientific literature referred to herein establishes knowledge available to those skilled in the art. All U.S. patents and published or unpublished U.S. patent applications cited herein are incorporated herein by reference. All published foreign patents and patent applications cited herein are incorporated by reference. The Genbank and NCBI submissions identified by accession numbers cited herein are incorporated herein by reference. All other published references, documents, manuscripts and scientific literature cited herein are incorporated by reference.
While the present disclosure has been particularly shown and described with reference to preferred embodiments thereof, it will be understood by those skilled in the art that various changes in form and details may be made therein without departing from the scope of the disclosure encompassed by the appended claims.
Drawings
FIG. 1 is a hot spot diagram of the intrinsic subtypes and intrinsic genes of breast cancer of Table 1.
FIG. 2 shows the Kaplan Meier survival curves from an untreated breast cancer patient cohort (cohort).
Figure 3 shows Kaplan Meier survival curves from node negative, ER + breast cancer patients treated with tamoxifen.
Figure 4 shows the 10-year event probability as a function of ROR score in ER +, lymph node negative breast cancer patients treated with tamoxifen. The figure shows that the subtype of the sub population in this population is either luminal a or B. RFS-relapse free survival; DSS is disease-specific survival.
FIG. 5 is a schematic diagram of an intrinsic subtype typing assay for breast cancer.
Fig. 6 is a schematic diagram of an algorithmic process.
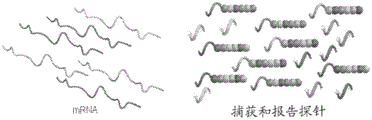
FIG. 7 is a diagram showing the hybridization of CodeSet with mRNA.
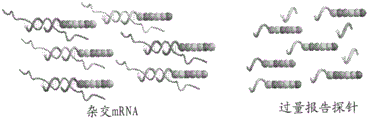
FIG. 8 is a diagram showing removal of excess reporter probes (excess reporters).
FIG. 9 is a diagram showing binding of a reporter probe to the surface of a cartridge (cartridge).
FIG. 10 is a diagram showing reporter probe immobilization and alignment.
FIG. 11 is a graphical representation of data collection.
FIG. 12 is a graphical representation of the nCounter analysis System Breast cancer test assay procedure.
FIG. 13 is a diagram of an nCounter Prep workstation.
FIG. 14 is a schematic representation of an nCounter Digital Analyzer.
Detailed Description
The present disclosure presents a method of predicting an outcome of a subject having breast cancer comprising providing a tumor sample from the subject, determining expression of genes in an intrinsic gene list within NANO46 of Table 1 in the tumor sample, determining an intrinsic subtype of the tumor sample based on the expression of genes in an intrinsic gene list of NANO46, wherein the intrinsic subtype consists of at least Basal-like, luminal A (L umanal A), luminal B (L umanal B), or HER2-enriched (HER2-enriched), determining a proliferation score based on the expression of a subset of proliferation genes in the intrinsic gene list within NANO46, determining a tumor size, calculating a recurrence risk score using a weighted sum of the intrinsic subtype, proliferation score, and tumor size, and determining whether the subject has a low or high recurrence risk of recurrence based on the recurrence score.
Intrinsic gene screening can be used to classify breast cancer into five molecularly distinct intrinsic subtypes, luminal a (L umA), luminal B (L umB), HER2-enriched (HER-2-e), basal-like, and Normal-like (Normal-like) (Perou et al Nature, 406 (6797): 747-52 (2000); PNAS of soie et al, 98 (19): 10869-74 (2001)).
The NANO46 gene expression assay described herein allows for the identification of intrinsic subtypes from biological samples, such as standard formalin-fixed paraffin-embedded tumor tissue. The method classifies a subject sample according to the breast cancer intrinsic subtype using a supervised algorithm. This algorithm, referred to herein as the NANO46 classification model, is based on gene expression profiles of a defined subset of the intrinsic genes, which subset has been identified herein as superior for classifying breast cancer intrinsic subtypes. The subset of genes, as well as the primer target-specific sequences for their detection, are provided in table 1. Table 1A provides the sequences of the target-specific probe sequences used to detect each of the genes used in table 1. The sequences provided in table 1A are representative only and are not intended to limit the present invention. The skilled artisan can detect any of the genes (or each of these genes) in table 1 using any target sequence-specific probe.
TABLE 1


TABLE 1a probes for detecting NANO46 Gene


Table 2 provides selection sequences for the NANO46 genes of table 1.
TABLE 2


At least 40, at least 41, at least 42, at least 43, at least 44, at least 46, or all 46 genes from table 1 can be used in the methods of the invention. Preferably, the expression of each of the 46 genes is determined in the biological sample. Prototype gene expression profiles (i.e., centroids) of four intrinsic subtypes were predefined from a training set of FFPE breast tumor samples using systematic cluster analysis of gene expression data. A hotspot graph of the prototype gene expression profiles (i.e., centroids) of these four subtypes is shown in fig. 1, where the levels of expression are illustrated by the hotspot graph. Table 3 shows the actual values.
Table 3.

After a Breast Cancer Intrinsic subtype typing (Breast Cancer Intrinsic subtype) test using a test Breast Cancer tumor sample and a reference sample provided as part of the test kit, a calculation algorithm based on Pearson's correlation compares the normalized (normalized) and scaled (scaled) gene expression profiles of the NANO46 Intrinsic gene set of the test sample with the prototype expression profiles of the four Breast Cancer Intrinsic subtypes the Intrinsic subtype analysis is determined by determining the expression of the NANO50 gene set, which is determining the expression of the NANO46 gene set and further including determining the expression of MYB L, BIRC5, GRB7 and CCNB1, and the risk of relapse is determined using the NANO46 gene set ("ROR. specific score"), the Intrinsic subtype score is calculated by comparing the expression of the NANO50 gene set in the biological sample with the expected expression profiles of the four Intrinsic subtypes, the probability score is calculated by comparing the biological sample with the expected expression profile of the four Intrinsic subtypes, preferably the likelihood score of the tumor is calculated by comparing the expression of the aforementioned remote tumor sample with the expected tumor size of the physiological subtype, the physiological score calculated by comparing the expression of the four NANO50 gene sets with the expected tumor samples, the expected tumor subtype score of the physiological variables, preferably the likelihood score calculated by comparing the remote expression of the patient, the remote subtype score calculated by comparing the remote expression of the three different tumor, preferably by using the remote expression of the three related genes, the remote subtype, the remote expression of the three related genes, the three different tumor, preferably the three, the remote expression of the three different tumor, the remote subtype.
FIG. 6 provides a schematic diagram of specific algorithmic transformations (specific algorithmic transformations). The subtype with the greatest positive correlation with the sample was assigned to the tumor sample. The Kaplan Meier survival curve generated from the training set of untreated breast cancer patients demonstrates that the intrinsic subtype is a prognostic indicator for Relapse Free Survival (RFS) in this test population, which includes both estrogen receptor positive/negative and HER2 positive/negative patients, fig. 2.
Independent testing of a cohort of node-negative, estrogen receptor-positive patients treated with tamoxifen showed patients with predominantly luminal a and B subtypes, with luminal a patients presenting better results than luminal B patients, fig. 3. The results of luminal a patients are expected to be even further improved using clinical trial specimens with more modern treatment regimens (i.e. aromatase inhibitors) and better adherence to treatment.
A training set of FFPE breast tumor samples with well-defined clinical characteristics and clinical outcome data was used to determine a continuous relapse Risk (Risk of Recurrence (ROR)) score. The scores were calculated using coefficients from a Cox model that included correlation with each intrinsic subtype, proliferation score (mean gene expression for a subset of 18 out of 46 genes), and tumor size, table 4.

The test variables in Table 4 were multiplied by the corresponding coefficients and summed to give a risk score ("ROR-PT").
ROR-PT formula-0.0067 a + 0.4317B + -0.3172C + 0.4894D + 0.1981E + 0.1133F
In previous studies, ROR scores provided a continuous estimate of the risk of relapse in ER-positive, lymph node-negative patients treated with tamoxifen for 5 years (Nielsen et al, clin. cancer res., 16 (21): 5222-5232 (2009)). This result was confirmed in ER-positive, lymph node-negative patients from the same cohort, fig. 4. Based on the determination of RFS in the test population, ROR scores also show statistically significant improvement for clinical models, which provides further evidence for an increase in accuracy of the decision tool when compared to traditional clinical pathology measures (Nielsen et al, clin.
The methods of the invention may comprise determining the expression of at least one, combination or each of the 18-gene subsets of intrinsic genes within NANO46 selected from AN L N, CCNE1, CDC20, CDC6, CDCA1, CENPF, CEP55, EXO1, KIF2C, KNTC2, ME L K, MKI67, ORC 6L, PTTG1, RRM2, TYMS, UBE2C and/or UBE2T preferably the expression of each of the 18-gene subsets of the NANO46 gene set is determined to provide a proliferation score the expression of one or more of these genes in the sample may be determined and averaged to generate a proliferation signature index for the sample by supplementing the normalized expression estimates of one or more of these genes in the sample with the high proliferation signature, moderate/moderate proliferation signature, low proliferation signature or low proliferation signature determination in the sample's 5232. the methods described in Nielsen et al, incorporated herein by reference (see 5232).
Description of the intrinsic subtype biology
Luminal subtypes the most common subtypes of breast cancer are luminal subtypes, luminal a and luminal B previous studies showed luminal a to account for approximately 30% to 40% of all breast cancers, while luminal B accounts for approximately 20%, but they represent more than 90% of hormone receptor positive breast cancers (Nielsen et al clin cancer res., 16 (21): 5222 and 5232(2009)) the pattern of Gene expression of these subtypes is similar to the luminal epithelial component of the breast. these tumors are characterized by high expression of Estrogen Receptors (ER), Progesterone Receptors (PR), and genes associated with ER activation, such as L IV 2, GATA3, and cyclin D1, as well as expression of luminal cytokeratin 8 and 18 (L isa Carey & Charles Perou per (2009).
Luminal a: luminal a (L umA) breast cancers exhibit low expression of genes associated with cell cycle activation and ERBB2 cluster, which results in a better prognosis compared to luminal B.
Luminal B (L umB) breast cancer also expresses ER and ER-associated genes associated with cell cycle activation are highly expressed, and this tumor type can be HER2(+) (-20%) or HER2 (-). poor prognosis compared to L umA (despite the expression of ER) and generally reduced responsiveness to endocrine therapy.
HER 2-enriched: the HER2-enriched subtype is generally ER-negative and HER 2-positive in most cases with high expression of the ERBB2 cluster, including ERBB2 and GRB 7. Genes associated with cell cycle activation are highly expressed and these tumors have adverse consequences.
Substrate pattern: basal-like subtypes are usually ER-negative, almost always clinically HER 2-negative, and express a range of "basal" biomarkers including basal epithelial Cytokeratin (CK) and Epidermal Growth Factor Receptor (EGFR). Genes associated with cell cycle activation are highly expressed.
Clinical variables
The NANO46 classification model described herein may be further combined with information of clinical variables to generate predictors of risk of relapse (ROR) on a continuous basis. As described herein, a number of clinical and prognostic breast cancer factors are known in the art and are used to predict treatment outcome and the likelihood of disease recurrence. Such factors include, for example, lymph node metastasis, tumor size, pathological grade, estrogen and progestin receptor status, HER-2 levels, and tumor ploidy. In one embodiment, a risk of recurrence (ROR) score is provided for a subject diagnosed with or suspected of having breast cancer. This score uses the NANO46 classification model in combination with clinical factors for lymph node status (N) and tumor size (T). The evaluation of clinical variables was based on the breast Cancer staging standardization system of the American Joint Committee on Cancer (AJCC). In this system, primary tumor sizes were classified in the range of 0-4 (TO: no evidence of primary tumor; T1: < 2 cm; T2: > 2 cm-5 cm; T3: > 5 cm; T4: tumors of any size that spread directly TO the chest wall or skin). Lymph node status was classified as N0-N3 (NO: NO metastasis in regional lymph nodes; N1: metastasis to one or more axillary lymph nodes on the same side that are mobile; N2: metastasis to one or more lymph nodes on the same side that are fixed to each other or to other structures; N3: metastasis to the ipsilateral lymph node below the sternum). Methods for identifying breast cancer patients and staging the disease are well known and may include manual examination, biopsy, examination of patient history and/or family history, and imaging techniques such as mammography, Magnetic Resonance Imaging (MRI), and Positron Emission Tomography (PET).
Sample source
In one embodiment of the present disclosure, breast cancer subtypes are assessed by assessing the expression pattern or profile of the intrinsic genes listed in table 1 in one or more subject samples. For the purposes of this discussion, the term subject, or subject sample, refers to an individual, regardless of its health and/or disease state. A subject may be a subject, a study participant, a control subject, a screening subject, or any other class of individual from which a sample is obtained and evaluated in the context of the present disclosure. Accordingly, a subject may be diagnosed as having breast cancer, may present with one or more symptoms of breast cancer, or may be undergoing treatment (treatment) or therapy (therapy) for breast cancer, or the like, for example, as a causative factor for breast cancer, such as a family (genetic) or medical history (medical) factor. Alternatively, the subject may be healthy with respect to any of the above factors or criteria. It should be understood that the term "healthy" as used herein is with respect to breast cancer status, as the term "healthy" cannot be defined as corresponding to any absolute assessment or status. Thus, for any particular disease or disease criteria, an individual defined as healthy may be diagnosed as having, or exhibiting, virtually any other disease or diseases criteria, including one or more cancers other than breast cancer. However, the healthy control preferably does not have any cancer.
In particular embodiments, a method of predicting an intrinsic subtype of breast cancer includes collecting a biological sample comprising cancer cells or tissue, such as a breast tissue sample or a primary breast tumor tissue sample. By "biological sample" is meant any sample of cells, tissues, or bodily fluids in which intrinsic gene expression can be detected. Examples of such biological samples include, but are not limited to, biopsies and smears. Bodily fluids useful in the present disclosure include blood, lymph, urine, saliva, nipple aspirates, gynecological fluids, or any other bodily exudate or derivative thereof. Blood may include whole blood, plasma, serum or any blood derivative. In some embodiments, the biological sample comprises breast cells, particularly breast tissue from a biopsy, such as a breast tumor tissue sample. Biological samples can be obtained from a subject by a variety of techniques, including, for example, by scraping (scraping) or swababing (swabbing) an area, by aspiration of cells or bodily fluids using a needle, or by removal of a tissue sample (i.e., biopsy). Methods for collecting various biological samples are well known in the art. In some embodiments, the breast tissue sample is obtained by, for example, a fine needle aspiration biopsy, a needle biopsy, or an excisional biopsy. Fixatives and staining solutions may be applied to cells or tissues to preserve the sample and facilitate examination. Biological samples, particularly breast tissue samples, can be transferred to a slide for magnified viewing. In one embodiment, the biological sample is a formalin-fixed, paraffin-embedded breast tissue sample, particularly a primary breast tumor sample. In various embodiments, the tissue sample is obtained from a pathologist-guided tissue core sample (pathologist-guided tissue core sample).
Expression profiling
In various embodiments, the present disclosure provides methods of classifying, predicting, or monitoring breast cancer in a subject, in which data obtained from intrinsic gene expression analysis is evaluated using one or more pattern recognition algorithms, such an analysis method may be used to construct a predictive model, which may be used to classify test data.
Another approach is called "supervised" in which a mathematical model is generated using a training set of samples with known classifications or outcomes, and then evaluated using a separate validation dataset. Here, a "training set" of intrinsic gene expression data is used to construct a statistical model that correctly predicts the "subtype" of each sample. The training set is then tested with independent data (referred to as a test or validation set) to determine the robustness of a computer-based model. These models are sometimes referred to as "expert systems," but may be based on a series of different mathematical methods. Supervised methods may use datasets of reduced dimensions (e.g., the first few principal components), but typically use data of all dimensions that is not reduced. In all cases, the method allows for the quantitative delineation of multivariate boundaries that characterize and separate each subtype according to its intrinsic gene expression profile. It is also possible to obtain any predictive confidence interval, e.g. the probability level placed on the goodness of fit. Cross-validation can also be used to check the robustness of the predictive model by omitting selected samples from the analysis.
The NANO46 classification model described herein was based on gene expression profiles of multiple subject samples using the intrinsic genes listed in table 1. The plurality of samples includes a sufficient number of samples from subjects belonging to each subtype class. As used herein, "sufficient sample" or "representative amount" refers to the amount of sample from each subtype that is sufficient to construct a classification model that reliably distinguishes each subtype from all other subtypes in the group. Supervised predictive algorithms were developed based on an objectively selected prototype sample profile for the "training" algorithm. Samples were selected and subtypized using the amplified internal gene set according to the methods disclosed in international patent publication No. WO 2007/061876 and U.S. patent publication No. 2009/0299640, both of which are incorporated herein by reference in their entirety. Alternatively, the sample may be subtypized according to any known assay for classifying breast cancer subtypes. After the training samples were stratified according to subtype, centroids were constructed based on the expression profiles of the internal gene sets described in table 1 using a centroid-based prediction algorithm.
In one embodiment, the predictive algorithm is a combination of narshiman and Chu (2002) PNAS 99: 6567 the related closest center of gravity method described in 6572, which is incorporated herein by reference in its entirety. In the present disclosure, the method used calculates the normalized center of gravity for each subtype. The center of gravity is the mean gene expression of each gene in each subtype (or "class") divided by the standard deviation of the gene in the class. Recent barycentric classification takes gene expression profiles of new samples and compares them to each of the barycenters of these classes. Prediction of the subtype was done by calculating the spearman rank correlation of each test case with five centroids and assigning a certain subtype to the sample based on the nearest centroid.
Detection of intrinsic gene expression
Any art-available method for detecting the expression of the intrinsic genes listed in table 1 is included herein. By "detecting expression" is meant determining the amount or presence of an RNA transcript of an intrinsic gene or an expression product thereof. Methods of detecting intrinsic gene expression, i.e., gene expression profiling, of the present disclosure include polynucleotide hybridization analysis based methods, polynucleotide sequencing based methods, immunohistochemical methods, and proteomics based methods. These methods typically detect the expression products (e.g., mRNA) of the intrinsic genes listed in Table 1. In a preferred embodiment, PCR-based methods such as reverse transcription PCR (RT-PCR) (Weis et al, TIG 8: 263-64, 1992) and array-based methods such as microarrays are used (Schena et al, Science 270: 467-70, 1995). "microarray" refers to an ordered arrangement of hybridizable array elements, such as, for example, polynucleotide probes, on a substrate. The term "probe" refers to a molecule that is capable of binding selectively to a specifically intended target biomolecule, such as a nucleotide transcript or protein encoded by or corresponding to an intrinsic gene. Probes may be synthesized by one skilled in the art, or may be derived from a suitable biological preparation. Probes can be specifically designed to label them. Examples of molecules that can be used as probes include, but are not limited to, RNA, DNA, proteins, antibodies, and organic molecules.
Many expression detection methods use isolated RNA. The starting material is typically total RNA isolated from a biological sample, e.g. from a tumor or tumor cell line, respectively, and a corresponding normal tissue or cell line. If the source of the RNA is a primary tumor, RNA (e.g., mRNA) can be extracted from a frozen or preserved paraffin-embedded and fixed (e.g., formalin-fixed) tissue sample (e.g., a pathologist-directed tissue core sample).
General methods for RNA extraction are well known in the art and are described in standard textbooks of Molecular Biology, including Ausubel et al, ed., Current Protocols in Molecular Biology, John Wiley&Methods for extracting RNA from paraffin-embedded tissue as disclosed in Sons, New York1987-1999 methods for extracting RNA from paraffin-embedded tissue are disclosed in, for example, Rupp and L ocker, L abinvest.56: A67, (1987); and De Andres et al Biotechniques 18: 42-44, (1995); in particular, RNA isolation can be performed using purification kits, buffer sets and proteases from commercial manufacturers, such as Qiagen (Vavalen, Calif.), following the manufacturer's instructionsIts commercially available RNA isolation kit includes MasterPURETMComplete DNA and RNA purification kits (Epicentre, Madison, Wis.) and Paraffin Block RNA isolation kits (Ambion, Austin, TX). For example, RNA Stat-60(Tel-Test, Friendshood, TX) can be used to isolate total RNA from tissue samples. For example, total RNA can be isolated from FFPE using a high purity FFPE RNA Microkit, cat # 04823125001(Roche Applied Science, Indianapolis, Ind.). For example, RNA prepared from tumors can be isolated by cesium chloride density gradient centrifugation. In addition, large numbers of tissue samples can be readily processed by using techniques well known to those skilled in the art, such as, for example, the single step RNA isolation process of Chomczynski (U.S. Pat. No.4,843,155).
The isolated RNA can be used in hybridization or amplification assays, including, but not limited to, PCR analysis and probe arrays. One method for detecting the level of RNA involves contacting the isolated RNA with a nucleic acid molecule (probe) that hybridizes to the mRNA encoded by the gene being detected. The nucleic acid probe can be, for example, a full-length cDNA, or a portion thereof, such as an oligonucleotide of at least 7, 15, 30, 60, 100, 250, or 500 nucleotides in length and sufficient to specifically hybridize under stringent conditions to an internal gene of the present disclosure, or any derived DNA or RNA. Hybridization of the mRNA to the probe indicates that the intrinsic gene is being expressed.
In one embodiment, the mRNA is immobilized on a solid surface and contacted with the probe, for example by running the isolated mRNA on an agarose gel and transferring the mRNA from the gel to a membrane, for example, nitrocellulose. In an alternative embodiment, the probes are immobilized on a solid surface and the mRNA is contacted with the probes, for example, in Agilent's gene chip array. The skilled artisan can readily adapt known mRNA detection methods to be suitable for detecting the expression levels of the intrinsic genes of the present disclosure.
Alternative methods for determining the level of endogenous gene expression products in a sample include nucleic acid amplification methods such as by RT-PCR (U.S. Pat. No.4,683,202), ligase chain reaction (Barany, PNAS USA 88: 189-93, (1991)), self-sustained sequence replication (Guatelli et al, Proc. Natl. Acad. Sci USA 87: 1874-78, (1990)), transcription amplification systems (Kwoh et al, Proc. Natl. Acad. Sc L USA 86: 1173-77, (1989)), Q-Beta replicase (L izardi et al, Bio/Technology 6: 1197, (1988)), rolling circle amplification (U.S. Pat. No.5,854,033), or any other nucleic acid amplification method, and then detecting the amplified molecules using techniques well known to those skilled in the art.
In a particular aspect of the disclosure, intrinsic gene expression is assessed by quantitative RT-PCR. Many different PCR or QPCR protocols are known in the art and exemplified below, and can be applied directly or modified to suit the use of the presently described compositions for the detection and/or quantification of the intrinsic genes listed in Table 1. Typically, in PCR, a reaction is performed to amplify a target nucleotide sequence using at least one oligonucleotide primer or a pair of oligonucleotide primers. One or more primers hybridize to a complementary region of the target nucleic acid, and a DNA polymerase extends the one or more primers to amplify the target sequence. A single size nucleic acid fragment predominates in the reaction product (the target polynucleotide sequence, which is the amplification product) under conditions sufficient to provide a polymerase-based nucleic acid amplification product. The amplification cycle is repeated to increase the concentration of a single target polynucleotide sequence. The reaction may be carried out in any thermal cycler commonly used for PCR. Preferred, however, are cyclers with real-time fluorescence measurement capability, e.g., (Cepheid,Sunnyvale,CA)、ABI PRISM
 (AppliedBiosystems,Foster City,Calif.)、ROTOR-GENETM(Corbett Research,Sydney,Australia)、
 (Roche Diagnostics Corp,Indianapolis,Ind.)、
 (Biorad L organisms, Hercules, Calif.) and
 (Stratagene,LaJolla,Calif.)。
in another embodiment of the present disclosure, expression profiling is performed using a microarray. Microarrays are particularly suitable for this purpose due to reproducibility between different experiments. DNA microarrays provide a means for simultaneous measurement of the levels of expression of a large number of genes. Each array consists of a reproducible pattern of capture probes attached to a solid support. The labeled RNA or DNA is hybridized to complementary probes on the array and then detected by laser scanning. The hybridization intensity of each probe on the array is determined and converted to a quantitative value representing the relative gene expression level. See, for example, U.S. patent nos.6,040,138, 5,800,992 and 6,020,135, 6,033,860, and 6,344,316. High density oligonucleotide arrays are particularly useful for determining gene expression profiles of large numbers of RNAs in a sample.
In a preferred embodiment, use is made of The assay system detects intrinsic gene expression.
 The basis of the assay system is the unique code assigned to each nucleic acid target to be assayed (International patent application publication No. WO 08/124847, U.S. Pat. No. 8,415,102, and Geiss et al Nature Biotechnology.2008.26 (3): 317-. The code consists of an ordered series of colored fluorescent spots that create a unique barcode for each target to be assayed. For each DNA or RNA target a pair of probes, a biotinylated capture probe and a reporter probe carrying a fluorescent barcode are designed. This system is also referred to in the text as the naroreporter coding system.
Specific reporter and capture probes were synthesized for each target. Briefly, sequence-specific DNA oligonucleotide probes are linked to a code-specific reporter molecule. Preferably, each sequence-specific reporter probe comprises a target-specific sequence capable of hybridizing to no more than one of the NANO46 genes of table 1, and optionally comprises at least two, at least three, or at least four marker linker regions comprising one or more marker monomers that emit light. The capture probes are prepared by ligating the second sequence-specific DNA oligonucleotide of each target to a universal oligonucleotide containing biotin. Both the reporter and capture probes are combined in a hybridization mixture, a "probe library". Preferably, the probe library comprises probe pairs (capture probes and reporter probes) of each of the NANO46 genes in table 1.
The relative abundance of each target was measured in a single multiplex hybridization reaction. The method comprises contacting the biological sample with a library of probes comprising probe pairs of the NANO46 gene in table 1, such that the presence of a target in the sample produces a probe pair-target complex. The complex is then purified. More specifically, the sample is bound to a library of probes and hybridization occurs in solution. After hybridization, the triple hybridization complex (probe pair and target) is purified in a two-step procedure using magnetic beads attached to oligonucleotides complementary to the universal sequences present on the capture and reporter probes. This dual purification process allows the hybridization reaction to be driven to completion with a large excess of target-specific probes, since they are eventually removed and therefore do not interfere with sample binding and imaging. All post-hybridization steps were mechanically operated on a custom-made liquid handling robot (Prep workstation), NanoString Technologies).
The purification reaction is placed in a single flow cell of the cartridge from the Prep station, bound to the streptavidin-coated surface by the capture probes, electrophoresed to extend the reporter probes, and immobilized. Following these procedures, the sample cartridges were transferred to a fully automated imaging and data collection apparatus (digital analyzer, NanoString Technologies). The expression level of the target is measured by imaging each sample and counting the number of times the target is detected. The data is output in a simple spreadsheet format, where the number of counts per target, per sample is listed.
The system can be used with nanoreporters. Additional disclosures of nanoreporters can be found in international publication numbers WO 07/076129 and WO 07/076132, and U.S. patent publication numbers 2010/0015607 and 2010/0261026, which are incorporated herein by reference in their entirety. Further, the terms nucleic acid probe and nanoreporters may include rationally designed sequences (e.g., synthetic sequences) as described in international publication No. WO 2010/019826 and U.S. patent publication No. 2010/0047924, which are incorporated herein by reference in their entirety.
Data processing
Multivariate projection methods, such as Principal Component Analysis (PCA) and partial least squares analysis (P L S), are so-called scaling sensitive methods.
Missing data, such as gaps in column values, should be avoided if possible. However, if necessary, such missing data may be represented by, for example, column averages ("average padding"); random values ("random padding"); or replaced or "padded" based on the values of the principal component analysis ("principal component padding").
Examples of such transformations include normalization and mean centering, examples of which may be used to remove variations from sample to sample, for microarray data the goal of the normalization process is to remove systematic errors by balancing the fluorescence intensities of the two marker dyes, deviations of the dyes may come from different sources, including differences in dye labeling efficiency, thermal sensitivity and light sensitivity, and scanner settings for scanning dual channels some commonly used methods for calculating normalization factors include (i) global normalization using all genes on the array, (ii) housekeeping gene normalization using constantly expressed housekeeping/invariant genes, and (iii) internal control normalization using known amounts of exogenous control genes added during hybridization (quekenbunat. genet.32, Suppl.,. 496-501 (2002)). in one embodiment, the intrinsic genes disclosed herein may be normalized to control the housekeeping genes, for example, U.S. patent publication No. 2008/0032293 (incorporated in its entirety into the housekeeping genes) may be used by any of the methods disclosed herein for normalization of several known proprietary genes, including tfrp, spc, spf 3, spf, sp.
In one embodiment, the microarray data is normalized using the L OWESS method, the L OWESS method is a global locally weighted scatter plot smoothing normalization function.
"mean centering" may also be used to simplify the explanation. Typically, for each descriptor, the average of that descriptor for all samples is subtracted. In this way, the average of the descriptors is consistent with the starting point, and all descriptors are "centered" to zero. In "unit variance ratioing," the data may be ratioed to equal variance (equivalent variance). Typically, the value of each descriptor is scaled by 1/StDev, where StDev is the standard deviation of that descriptor for all samples. "Pareto scaling", in a sense, is between mean centering and unit variance scaling. In pareto scaling, the value of each descriptor is multiplied by l/sqrt (StDev) scaling, where StDev is the standard deviation of that descriptor for all samples. In this way, the variance of each descriptor is numerically the same as its initial standard deviation. pareto scaling can be performed on, for example, raw data or mean-centered data.
"logarithmic scaling" may be used to aid in interpretation when the data has a positive bias and/or when the data covers a large range, e.g., several orders of magnitude. Typically, for each descriptor, the value is replaced by the logarithm of the value. In "equivalent range scaling", each descriptor is divided by the range of that descriptor for all samples. In this way, all descriptors have the same range, i.e. 1. However, this approach is sensitive to outliers. In "auto scaling", each data vector is mean-centered and scaled by unit variance. This technique is very useful because each descriptor is then weighted equally, and both large and small values are reprocessed. This may be important for genes that are expressed at very low, but still detectable levels.
In one embodiment, data for one or more test samples is collected and classified using the NANO46 classification model described herein. When comparing data from multiple analyses (e.g., comparing expression profiles of one or more test samples to centroids constructed from samples collected and analyzed in separate studies), it is necessary to normalize the data of these data sets. In one embodiment, these datasets are combined using Distance Weighted Discrimination (DWD) (Benito et al (2004) Bioinformatics 20 (1): 105-. DWD is a multivariate analysis tool that can identify systematic deviations present in individual datasets and then make global adjustments to compensate for these deviations; essentially, each individual set is a multi-dimensional cloud (multi-dimensional cloud) of data points, and the DWD takes two point clouds and moves one to better overlap the other.
The methods described herein may be performed and/or results recorded using any device capable of performing the methods and/or recording the results. Examples of devices that may be used include, but are not limited to, electronic computing devices, including computers of all types. When the methods described herein are implemented and/or recorded on a computer, a computer program that can be used to configure a computer to perform the steps of the methods can be embodied in any computer-readable medium that can contain the computer program. Examples of computer readable media that can be used include, but are not limited to, diskettes, CD-ROMs, DVDs, ROMs, RAMs, and other memory and computer storage devices. Computer programs usable to configure a computer to perform the steps of the method and/or record the results may also be provided over an electronic network, such as the internet, an intranet, or other network.
Calculation of Risk of recurrence
Provided herein are methods of predicting breast cancer outcome in the context of intrinsic subtype and optionally other clinical variables. Results may refer to overall or disease-specific survival, event-free survival, or the result of a response to a particular treatment (treatment) or therapy (therapy). In particular, the method can be used to predict the likelihood of long-term, disease-free survival. "predicting the likelihood of survival of a breast cancer patient" refers to assessing the risk of death of a patient due to underlying breast cancer. By "long-term, disease-free survival" is meant that the patient does not die of a recurrence of underlying breast cancer or does not suffer from a recurrence of breast cancer for a period of at least five years, or at least ten years or more, after the first diagnosis or treatment.
In one embodiment, the outcome is predicted based on classification of the subject according to subtype. In addition to providing subtype assignments, the NANO46 bioinformatic model provides a measure of the similarity of test samples to all four subtypes, which is translated into a Risk of relapse (ROR) score that can be used for any patient population regardless of their disease state and treatment options. The intrinsic subtype and ROR are also valuable in predicting complete remission of the pathology in women treated with, for example, neoadjuvant taxane and anthracycline chemotherapy (Rouzier et al, JClin Oncol 23: 8331-9(2005), incorporated herein by reference in its entirety). Thus, in various embodiments of the present disclosure, a risk of recurrence (ROR) model is used to predict outcome. Using these risk models, subjects can be divided into low, medium and high risk groups for recurrence. Calculation of ROR also provides prognostic information to guide treatment decisions and/or monitor response to treatment.
In some embodiments described herein, prognostic performance of the NANO 46-defined intrinsic subtype and/or other clinical parameters is assessed using Cox proportional risk Model Analysis (Cox proportional hazards Model Analysis), a regression method for survival data that provides an estimate of the risk ratio and its confidence interval. The Cox model is a well-established statistical technique for exploring the relationship between patient survival and specific variables. This statistical approach allows the assessment of the risk (i.e., risk) of an individual given its prognostic variable (e.g., intrinsic gene expression profile, with or without other clinical factors, as described herein). "hazard ratio" is the risk of death at any given point in time for a patient showing a particular prognostic variable. See generally Spruance et al, Antimicrob.Agents & Chemo.48: 2787-92(2004).
The NANO46 classification model described herein may be trained for risk of relapse using subtype distance (or correlation) alone, or using subtype distance and clinical variables as discussed above. In one embodiment, the risk score for a test sample is calculated using the individual intrinsic gene subtype distances using the following formula:
ROR 0.05 × base +0.1 l × Her2+ -0.25 × L umA +0.07 × L umB + -0.1 l × normal, wherein the variables "base", "Her 2", "L umA", "L umB", and "normal" are the distance of each respective classification from the center of gravity when the Expression profile of the test sample is compared to the center of gravity constructed using Gene Expression data deposited in a Gene Expression integrated database (Gene Expression Omnibus (GEO)).
Risk scores can also be calculated using a combination of breast cancer subtypes and clinical variables tumor size (T) and lymph node status (N) using the formula ROR (complete) ═ 0.05 × basal +0.1 × Her2+ -0.19 × L umA +0.05 × L umB + -0.09 × normal +0.16 × T +0.08 × N, also when the test expression profile is compared to the centroid constructed using gene expression data deposited at GEO accession number GSE 2845.
In another embodiment, the intrinsic subtype distance alone is used to calculate a risk score for the test sample by the following formula:
ROR-S0.05 bases +0.12 Her2+ -0.34 Her L umA + 0.0.23L umB, wherein the variables "bases", "Her 2", "L umA", "L umB" are as described above and the test expression profile is compared to the center of gravity constructed using gene expression data deposited as GEO with accession number GSE2845 in another embodiment, the risk score is calculated using the breast cancer subtype and clinical variables tumor size (T) using the formula (wherein the variables are as described above): ROR-C0.05 bases +0.1 l Her2+ -0.23L umA + 0.09L umB + 0.17T.
In another embodiment, the risk score for a test sample is calculated using the intrinsic subtype distance in combination with the proliferation signature ("Prolif") using the following formula:
ROR-P ═ 0.001 × base +0.7 × Her2+ -0.95 × L umA +0.49 × L umB +0.34 × Prolif, where the variables "base", "Her 2", "L umA", "L umB" and "Prolif" are as described above, and the test expression profile was compared to the centroid constructed using gene expression data deposited at GEO, accession number GSE 2845.
In another embodiment, a risk score may also be calculated using a combination of breast cancer subtype, proliferation profile and clinical variables tumor size (T) using ROR-PT as described in table 3 above.
Subtype detection
Immunohistochemistry of Estrogen (ER), progestin (PgR), HER2 and Ki67 was performed simultaneously on serial sections using the standard streptavidin-biotin complex method using 3, 3' -diaminobenzidine as chromophore. Staining for ER, PgR and HER2 readings can be performed as described previously (Cheng et al, Clin Cancer Res.2008; 14 (5): 1368-.
For example, Ki67 antibody (clone SP 6; Thermoscientific, Fremont, CA) diluted 1: 200 may be used for 32 minutes, followed by a Ventana Benchmark Autoimmunostainer (Ventana, Tucson AZ) standard Cell regulator 1(Cell Conditioner 1, CC1, a proprietary buffer) protocol at 98 ℃ for 30 minutes incubation for 10 minutes after 8 minutes microwave antigen retrieval in 10mM sodium citrate (pH 6.0) may be used with a ready-to-use PR antibody (clone SP 1; ThermoFisher Scientific, Fremont CA) according to the CC1 protocol described above for 10 minutes after antigen retrieval in 0.05M Tris buffer (pH 10.0) and heating in a steam generator to 95 ℃ for 30 minutes, with a Ready PR antibody (clone 1E 2; Ventana) may be used for antigen retrieval in 0.05M Tris buffer (pH 10.0) and a fluorescence staining with a FISCE 3 (thermal) antibody (thermal) diluted 1: 100, and the fluorescence staining of the two probes developed for the fluorescence staining of the biomarker II probe (Bioluminescence) and the probe may be carried out on the fluorescence staining of the ELISA kit (ELISA).
Tumors were considered to be ER or PR positive if immunostaining was observed in more than 1% of the tumor nuclei, as previously described. Tumors are considered to be HER2 positive if the immunostaining score is 3+ according to the Herceptest criteria and the amplification ratio of fluorescence in situ hybridization of 2.0 or higher is the truncation point (score 2+) used to isolate immunohistochemical suspected tumors (Yaziji, et al, JAMA, 291 (16): 1972-1977 (2004)). Ki67 was scored visually by two pathologists for the percentage of tumor nuclei with positive immunostaining over background level.
These techniques include E L ISA, Western blot, Northern blot, or FACS analysis.
Reagent kit
The present disclosure also describes kits that can be used to classify the intrinsic subtype of breast cancer and/or provide prognostic information to identify the risk of relapse. These kits comprise a set of capture probes and/or primers specific for the intrinsic genes listed in table 1. The kit may also include a computer readable medium.
In one embodiment of the disclosure, the capture probes are immobilized on an array. "array" refers to a solid support or matrix having peptide or nucleic acid probes attached to the support or matrix. Arrays typically comprise a plurality of different capture probes coupled to a substrate surface at different, known sites. The arrays of the present disclosure comprise a substrate having a plurality of capture probes that can specifically bind to an intrinsic gene expression product. The number of capture probes on the substrate will vary depending on the intended purpose of the array. The array may be a low density array or a high density array and may contain 4 or more, 8 or more, 12 or more, 16 or more, 32 or more addressing (addresses), but minimally contains capture probes for the 46 intrinsic genes listed in table 1.
Techniques for synthesizing these arrays using mechanosynthesis methods are described, for example, in U.S. Pat. No.5,384,261, which is incorporated by reference herein in its entirety for all purposes. The array can be mounted on a surface of almost any shape or even multiple surfaces. The array may be a probe (e.g., a nucleic acid binding probe) on a bead, gel, polymer surface, fiber such as an optical fiber, glass, or any other suitable substrate, see U.S. Pat. Nos. 5,770,358, 5,789,162, 5,708,153, 6,040,193, and 5,800,992, each of which is incorporated herein by reference in its entirety for all purposes. The array may be packaged in such a way as to allow diagnostic or other operations to be performed on the device. See, for example, U.S. Pat. nos. 5,856,174 and 5,922,591, which are incorporated herein by reference.
In another embodiment, the kit comprises a set of oligonucleotide primers sufficient to detect and/or quantify each of the intrinsic genes listed in table 1. The oligonucleotide primers may be provided in lyophilized or reconstituted (reconstituted) form, or may be provided as a set of nucleotide sequences. In one embodiment, the primers are provided in the form of a microplate (microplate), wherein each primer set occupies a well (or wells, as in the case of a replicate) in the microplate. The microplate may further comprise primers sufficient to detect one or more housekeeping genes as described below. The kit may further comprise reagents and instructions sufficient to amplify the expression products of the genes listed in table 1.
To facilitate quick access, for example, for comparison, review, recovery, and/or modification, the molecular signatures/expression profiles are typically recorded in a database. Most typically, the database is a relational database accessible by computer equipment, although other forms may be used, such as manually accessed index files as profiles for photographs, analog or digital imaging readings, spreadsheets, and the like. Whether the expression pattern originally recorded is analog or digital in nature, the expression pattern, expression profile (collective expression pattern), and molecular signature (correlated expression pattern) are stored in digital form and accessed through a database. Typically, the database is compiled and maintained at a central facility, and can be accessed locally and/or remotely.
Apparatus and test
General purposeThe NanoString nCounter assay system provides direct, multiplexed measurement of gene expression by digital readout of the relative abundance of hundreds of mRNA transcripts. The nCounter assay system uses pairs of gene-specific probes that are mixed together to form a single reagent called CodeSet (fig. 7). The probe pair hybridizes directly to the mRNA sample in solution, eliminating any enzymatic reactions that might bias the results.
After hybridization, all sample processing steps were performed automatically on the nCounter Prep workstation. First, excess capture and reporter probes are removed (FIG. 8), and then the probe-target complexes are bound to random sites on the nCounter cassette surface via streptavidin-biotin linkages (FIG. 9).
Finally, the probe/target complexes are aligned and immobilized (FIG. 10) in an nCounter cassette. The reporter probe carries a fluorescent signal; the capture probes allow for immobilization of the complex for data collection. Up to 800 pairs of probes, each specific for a particular gene, can be combined with a series of internal controls to form a CodeSet.
After sample processing was complete, the cartridge was placed in an nCounter digital analyzer for data collection. Each target molecule of interest is identified by a "color code" created by the presence of six ordered fluorescent spots on the reporter probe. The reporter probes on the cassette surface were then counted and tabulated for each target molecule (FIG. 11).
Reagents and test ComponentsBreast cancer test the expression levels of NANO46 plus eight housekeeping genes were measured simultaneously in one hybridization reaction using nCounter CodeSet specifically designed for these genes. Each assay also included a positive assay control consisting of a linear titration of in vitro transcribed RNA transcripts and corresponding probes, and a set of probes without sequence homology to human RNA sequences used as a negative control. Each assay run also included a reference sample consisting of in vitro transcribed RNA of the target and housekeeping genes for normalization purposes. The normalized gene expression profile of the breast tumor sample correlates with the prototypical gene expression profiles of the four breast cancer intrinsic subtypes (luminal a, luminal B, HER-enriched, or basal patterns) identified by the breast tumor training set. The gene expression profile, in combination with the selected clinical variables, is used as part of a training algorithm as a prognostic indicator of risk of distant recurrence of breast cancer.
Figure 12 shows the assay procedure associated with the nCounter analysis system breast cancer test.
FFPE tissue extractionBreast cancer testing will use RNA extracted from formalin fixed, paraffin embedded (FFPE) tissues diagnosed as breast infiltrating carcinomas. The pathologist first performed H on tumor sections mounted on slides&E staining to identify viable, infiltrating breast cancer regions containing tumor content above a minimum threshold. Pathologist at H&The area is circled on the slide E. The pathologist then will stain the unstained groupThe tissue sections were mounted on slides and the area of the slide containing the infiltrated tumor was marked. For larger tumors (H)&> 100mm on E slides2Surviving invasive carcinoma), only a single 10 μm section is required for testing. For smaller tumors (< 100 mm)2) The test requires 3 slices. Macroscopic-isolated cleavage of viable, infiltrated breast cancer regions identified on the slides with sufficient tumor content was performed prior to RNA extraction. The step of transporting the FFPE tissue slide from the collection site to the testing site will be defined as part of the method.
After extraction of total RNA and removal of genomic DNA, optical densities were measured at wavelengths of 260nm and 280nm to determine yield and purity. The assay requires an input range of 125-500ng total RNA for the subsequent hybridization step. The NanoString program verified that the input range of the RNA was sufficient to be reproducible for the assay on the nCounter assay system. In addition, the RNA quality was measured using OD260/280 readings, with a target ratio of not less than 1.7 and an upper limit of 2.5. Methods of storing RNA will be provided to the user so that downstream processing can be performed at a later point in time, if desired.
Requirements for yield and purity were measured with spectrophotometer after RNA extractionIsolation of RNA from FFPE samples to a final sample volume of 30 μ L this volume is too small for nucleic acid abundance quantification by using absorbance measurements in a cuvette type UV-Vis spectrophotometer, so the NanoString protocol involves the use of a low volume spectrophotometer such as NanoDropTMAnd (3) quantifying total RNA by a spectrophotometer. NanoString will define performance specifications for the spectrophotometer such that the range of RNA input recommended for testing is above the detection limit of a low volume spectrophotometer and is repeatable.
Hybridization ofFor each set of up to 10 RNA samples, the user pipettes a specific amount of RNA into a separate tube in a 12-reaction strip tube (12 reaction strip tube) and adds CodeSet and hybridization buffer. The reference sample was pipetted into the remaining two tubes containing CodeSet and hybridization buffer. CodeSet is generated by probes for each gene targeted, additionally for endogenous "sees"probes for normalization genes and positive and negative controls". The probes in the CodeSet associated with each of the four sets of genes (target gene, housekeeping gene, and positive and negative controls) are each assigned a unique code and are therefore individually identifiable in each run. The reference sample consists of in vitro transcribed RNA of the target gene and the housekeeping gene. Once the hybridization reagents are added to each tube, the user transfers the tube to a hot lid heating module and maintains it at the set temperature for a specified period of time.
Requirement of heating Module with Hot lid for hybridization step-nCounter assay comprises overnight hybridization under isothermal conditions. Because small volumes of overnight hybridization are performed at elevated temperatures, care must be taken to avoid evaporation. Many commercially available PCR thermal cyclers are equipped with a thermal lid to prevent evaporation of small amounts of liquid.
Any heating module with a programmable thermal cap and a module sized to fit into the NanoString tube can be used for the NanoString assay, as the assay does not require any fine control of the temperature ramp. The NanoString program provides a specification of the heating module for meeting the assay requirements.
Purification and binding on Prep workstationsAfter completion of the hybridization, the user then transfers the strip tube containing the 10 assay sets and 2 reference samples to the nCounterPrep station, along with the required pre-filled reagents and disposables described in table 1. The Prep plate contains the necessary reagents for purification of excess probes and binding to the cassette (see section IIIC below for a detailed description of the purification process). The Prep plate was centrifuged in a bucket centrifuge before being placed on the Prep station shelf. The automated purification process then removes excess capture and reporter probes through two successive hybridization-driven magnetic bead capture steps. The nCounter prep station then transfers the purified target/probe complexes to the nCounter cassette for capture onto glass slides. After the run is complete, the user removes the cartridge from the Prep station and seals it with an adhesive film.
Imaging and analysis on a digital analyzer-then inserting the sealed cassette into an nCounter digital analyzer for each substrate captured on the slideThe number of probes thus counted corresponds to the number of targets in the solution. The automated software then checks the threshold values for the housekeeping genes, reference samples, and positive and negative controls to determine whether each assay is acceptable and to ensure that the procedure is performed correctly. The housekeeping gene provides a measure of RNA integrity and the threshold value indicates that the RNA sample being tested is too degraded to be analyzed by the test due to incorrect manipulation or incorrect storage of tissue or RNA (e.g., incorrect tumor fixation, FFPE unit storage, RNA manipulation to introduce RNase). Positive and negative assay controls indicate a failure of the assay process (e.g., an error in assay settings, e.g., mixing of sample with CodeSet, or sample processing such as temperature). The signal for each sample was then normalized using a housekeeping gene to control the input sample quality. This signal is then normalized to the reference sample in each run to control lot-to-lot variation. The resulting normalized data was entered in the Breast Cancer Intrinsic subtype typing (Breast Cancer subtype) algorithm to determine the tumor Intrinsic subtype, recurrence risk score, and risk classification.
Instrument for measuring the position of a moving objectThe nCounter analysis system consists of two instruments, an nCounter Prep station for post-hybridization processing, and a digital analyzer for data collection and analysis.
nCounter Prep workstationThe nCounter Prep workstation (fig. 13) is an automated liquid handling robot that processes post-hybridization samples in preparation for data collection on nCounter digital analyzers. Total RNA extracted from FFPE (formalin fixed, paraffin embedded) tissue samples was hybridized with NanoString reporter and capture probes according to the nCounter protocol described above prior to processing on the Prep station.
Hybridization to target RNA is driven by excess NanoString probe. To accurately analyze these hybrid molecules, they are first purified from the excess probe remaining in the hybridization reaction. The Prep station separates the hybridized mRNA molecules from the excess reporter and capture probes by two successive magnetic bead purification steps. These affinity purifications utilize custom oligonucleotide-modified magnetic beads that retain only the ternary complexes of mRNA molecules bound to both the capture and reporter probes.
Next, a solution of the triple complex was flushed through the flow cell in the NanoString sample cartridge. One surface of the flow cell was coated with a polyethylene glycol (PEG) hydrogel filled with dense covalently bound streptavidin. As the solution passes through the flow cell, the ternary complex binds to the streptavidin in the hydrogel via the biotin molecules incorporated into each capture probe. The role of the PEG hydrogel is not only to provide a dense streptavidin surface to which the triple complex can specifically bind, but also to inhibit non-specific binding of any remaining excess reporter probe.
After the complexes are bound to the flow cell surface, an electric field is applied along the length of each sample cartridge flow cell to facilitate optical identification and alignment of the fluorescent spots that make up each reporter probe. Because the reporter probes are charged nucleic acids, the application of a voltage exerts a force on them that causes them to stretch and orient in unison in the direction of the electric field. While applying the voltage, the Prep station adds an immobilized reagent such that the reporter probe is locked into an elongated configuration after the electric field is removed. Once the reporter probe is immobilized, the cartridge can be transferred to an nCounter digital analyzer for data collection. All consumable components and reagents required for sample processing on the Prep workstation are provided in the nCounter Master Kit. These reagents can be loaded immediately onto the deck of the nCounter Prep station, which can process up to 10 samples and 2 reference samples in about 2.5 hours per run.
nCounter digital analyzer-nCounter digital analyzer (fig. 14) collects data by taking images of immobilized fluorescent reporter probes in the sample cartridge through the microscope objective lens with a CCD camera. Because the fluorescent reporter probe is a small single molecule barcode characterized by a wavelength less than visible light, the digital analyzer uses high magnification, diffraction limited imaging to resolve the sequence of spots in the fluorescent barcode.
The digital analyzer captures hundreds of continuous fields of view (fovs), each of which may contain hundreds or thousands of discrete reporter probes. Each FOV is a combination of four monochromatic images grabbed at different wavelengths. The resulting overlay can be thought of as a four color image of blue, green, yellow, and red. Each 4-color FOV is processed in real-time to provide a "count" of each fluorescent barcode in the sample. Because each barcode specifically identifies a single mRNA molecule, the data obtained from the digital analyzer is an accurate measure of the relative abundance of each mRNA of interest in a biological sample.
SoftwareThe user is guided through the process by step-by-step instructions on the Prep workstation and the digital analyzer.
As the samples are processed, the system software tracks the user account number and reagent lot for each sample in the centralized data repository. After the digital analyzer obtains the expression data for the sample, it is first analyzed to ensure compliance with all of the predefined quality control standards. Qualified data was then processed by the locked PAM50 algorithm to generate reports containing intrinsic subtype and risk of recurrence (ROR) scores. The sample report is transferred to a central repository where it can be securely accessed and downloaded by a properly authorized user.
Breast cancer intrinsic subtype typing algorithmThe classifier algorithm using 50 genes originally called PAM50 (Parker J.S., et al Supervised Risk Predictor of Breast Cancer base on IntraicSubtypes. journal of Clinical Oncology, 27: 1160-In the subtype. The gene expression profile will assign breast cancer to one of four molecular categories or intrinsic subtypes: basal patterns, luminal a, luminal B, and HER 2-enriched. A brief description of each subtype is provided below.
Luminal subtypes: among the hormone receptor positive populations, the most common subtypes of breast cancer are luminal subtypes, luminal a and luminal B. Previous studies have shown that luminal a accounts for approximately 30% to 40% of breast cancer and luminal B accounts for approximately 20%2And comprises more than 90% hormone receptor positive breast cancer. The pattern of gene expression of these subtypes is similar TO that of the luminal epithelial component of the mammary gland (Nielsen, TO et al A composition of PAM50 expression with immunological chemistry and clinical protective factors in tamoxifen-clinical diagnostic Cancer, clinical Cancer Research, 16: 5222-5232 (2010)). These tumors are characterized by Estrogen Receptors (ER), Progesterone Receptors (PR), and genes associated with ER activation2Such as L IV1, GATA3, and cyclin D1, as well as luminal cytokeratin 8 and 18.
Luminal a: luminal a (L umA) breast cancers exhibit low expression of genes associated with cell cycle activation and ERBB2 cluster, which results in a better prognosis compared to luminal B.
Luminal B-type (L umB) breast cancer expresses ER and ER-associated genes to a lesser extent than L umA genes associated with cell cycle activation are highly expressed, and this tumor type may be HER2(+) or HER2 (-). prognosis is poor (despite the expression of ER) and responsiveness to endocrine therapy is generally reduced compared to L umA.
Substrate pattern: basal-like subtypes are usually ER-negative, almost always clinically HER 2-negative, and express a range of "basal" biomarkers including basal epithelial Cytokeratin (CK) and Epidermal Growth Factor Receptor (EGFR). Genes associated with cell cycle activation are highly expressed.
HER 2-enriched: the HER2-enriched subtype is generally ER-negative and HER 2-positive in most cases with high expression of the ERBB2 cluster, including ERBB2 and GRB 7. Genes associated with cell cycle activation are highly expressed and these tumors have poor outcomes.
The cut-off points of the intrinsic subtype classification algorithm are predefined according to a training set, which defines: 1) intrinsic subtype centroids (i.e., the prototypical gene expression profile for each subtype), 2) recurrence risk (ROR) score coefficients, and 3) risk classification (low/medium/high). The preserved clinical representative set of FFPE breast tumor samples collected from multiple sites was used to train the intrinsic subtype barycenter (luminal a, luminal B, Her2 enriched, basal pattern). Systematic cluster analysis of gene expression data from FFPE breast tumor samples was combined with breast tumor biology (i.e., gene expression of previously defined intrinsic subtypes) to define a prototypic expression profile (i.e., center of gravity) for each subtype. The computational algorithm correlated the expression profiles of 50 genes from a normalized unknown breast cancer tumor sample with each of the prototypical expression signatures of the four breast cancer intrinsic subtypes. The tumor sample was assigned the subtype with the greatest positive correlation to the sample.
304 unique tumor samples with well-defined clinical characteristics and clinical outcome data were used to establish ROR scores. ROR scores were calculated using coefficients from the Cox model, including pearson correlation (R), proliferation score (P), and tumor size (T) with each of the intrinsic subtypes, as shown in the following formulas.
ROR=aRLumA+bRLumB+cRHer2e+dRSubstrate+eP+fT
In order to classify tumor samples into specific risk groups (low risk/medium risk/high risk) based on their calculated ROR scores, truncation points were set based on the probability of relapse free survival in a patient population consisting of hormone receptor positive, postmenopausal patients treated with endocrine therapy alone.
Prospective application of NanoString breast cancer test in clinical practiceOncologists currently use a series of tests to study the treatment regime for breast cancer patients. Including IHC/FISH-tests such as ER/PR IHC and HER2 IHC/FISH, and Agendia Assay and Genomic Health Oncotype
 And (6) testing. These tests provide the oncologist with additional information about the patient's prognosis and recommended treatment regimen.
ER, PgR and Her2 tests are performed locally by pathologists and reference laboratories, but there are many documents that can demonstrate the challenges of the extensive standardization of IHC and FISH tests (L ester, J et al Association of Tissue Etrogen and Progesterone Receptor L animals: A Survey of Current practice, Techniques, and quantification methods the Breast Journal, 6: 189-196 (2000); Wolff, A et al Amcanc Society of Clinical Oncology/College of American Pathology guidelines standardization recovery for Human epimamol Growth Receptor 2 test in Breacer, 18. the test is only available as a cryo-assisted chemotherapy test for tumor recurrence prediction test, FDA-18 test for tumor prognosis, FDA-7 tumor diagnosis, FDA-7-FDA 23, FDA-7-FDA 23-7-FDA test, but not for tumor recurrence prediction by the Freeze test, FDA-7-FDA test, FDA-7, FDA-7-A, FDA, and FDA, MRA, MR.
NanoString envisioned a model that would have breast cancer testing used in conjunction with other sources of clinical data currently available to oncologists for prognosis of breast cancer in selected patient fractions. Breast cancer tests would be an additional source of prognostic information, adding significant value to the established clinical parameters used by oncologists (i.e., tumor size, lymph node status) in managing patients with breast cancer.
Methods, assays and kits
The methods, assays and kits of the invention comprise a series of quality control standards that are automatically applied to each sample during the analysis process. These criteria evaluate the efficacy of the assay to determine if the results fall within expected values. After successful analysis of these quality control criteria, the measurements gave the following results:

intrinsic subtype
The intrinsic subtype of breast cancer tumors has been shown to correlate with the prognosis of early breast cancer. On average, patients with luminal a tumors had significantly better results than patients with luminal B, HER2-enriched, or basal-like tumors.
The intrinsic subtypes are identified by comparing the gene expression profiles of 50 genes in an unknown sample with the expected expression profiles of four intrinsic subtypes. The subtype with the most similar profile was assigned to the unknown sample.
The most common subtypes of breast cancer are luminal subtypes, luminal a (L umA) and luminal B (L umB). previous studies indicate that luminal a accounts for approximately 30% to 40% of all breast cancers while luminal B accounts for approximately 20%, but more than 90% of hormone receptor positive patients have luminal tumors.
Previous studies have shown that HER2-enriched subtype (HER2E) accounts for approximately 20% of breast cancers. However, the HER2-enriched subtype is generally ER-negative, and therefore only 5% of the population of tested ER-positive patients are found to have HER2-enriched breast cancer. Regardless of their ER-status, HER2-enriched tumors were HER 2-positive in most cases with high expression of ERBB2 cluster, including ERBB2 and GRB 7. Genes associated with cell cycle activation are also highly expressed.
Published data indicate that basal-like subtypes account for approximately 20% of breast cancer. However, basal-like subtypes are usually ER-negative, and therefore only 1% of hormone receptor positive patients tested have basal-like breast cancer. Basal-like subtypes are almost always clinically HER 2-negative and express a range of "basal" biomarkers, including basal epithelial Cytokeratin (CK) and Epidermal Growth Factor Receptor (EGFR). Genes associated with cell cycle activation are highly expressed.
ROR score
The ROR score is an integer value in the range of 0-100, which correlates to the probability of distant recurrence for a single patient within 10 years in a defined population of intended applications. The ROR score was calculated by comparing the expression profiles of 46 genes in the unknown sample with the expected profiles of the four intrinsic subtypes as described above, calculating four different correlation values. These correlation values were then combined with the proliferation score and tumor size to calculate the ROR score.
Probability of 10-year distant recurrence
ROR scores for postmenopausal female cohorts with early breast cancer that were hormone receptor positive were compared to surgery and 5 years of adjuvant endocrine therapy followed by 5 years of observation for survival without distant recurrence. The study obtained a model correlating ROR scores in this test patient population with distant recurrence probability, including a 95% confidence interval.
Risk classification
Risk classification is also provided to allow interpretation of ROR scores in a test patient population by using cutoff points associated with clinical outcomes.
Risk classification by ROR range and lymph node status

Quality control
All kit level items were tracked in batches, and the important components contained in each kit were tested together and distributed as a Master batch (Master L ot).
The assay kit included a series of internal controls for evaluating the quality of each run as a whole and each individual sample. These controls are listed below.
Batch control group: in vitro transcribed RNA reference sample
A synthetic RNA reference sample was included in the assay kit as a control. The reference sample included RNA targets from in vitro transcription of 50 algorithms and 8 housekeeping genes. In each assay run, duplicate reference samples were processed in 12 reaction zone tubes along with a set of up to 10 unknown breast tumor RNA samples. The signal from the reference sample is analyzed against a predetermined threshold to qualify the run.
The signal from each of the 50 algorithm genes of the breast tumor RNA sample was normalized to the corresponding gene of the reference sample.
Positive control group: in vitro transcribed RNA targets and corresponding capture and reporter probes
The synthetic RNA target was used as a Positive Control (PC) for the assay. The PC target sequence is derived from an External RNA Control Consortium (ERCC) DNA sequence library. The RNA target is transcribed in vitro from a DNA plasmid. Six RNA targets and corresponding capture and reporter probes were included in the assay kit in a 4-fold titration series (final concentration in hybridization reactions between 128 and 0.125 fM). PC was added to each breast tumor RNA sample tested with the Prosigna assay and to the reference RNA sample. If the signal intensity from the PC does not meet the predefined threshold, the sample is determined to be unacceptable for further analysis.
Negative control group: exogenous probes without target
Negative Control (NC) target sequences were from a library of ERCC DNA sequences. The assay kit includes as part thereof probes designed to detect these target sequences, but does not include the corresponding target sequences. Negative Controls (NC) were added as quality control measures to each breast tumor RNA sample and reference RNA sample tested with the Prosigna assay. If the signal intensity from the NC does not meet a predefined threshold, the sample is determined to be unacceptable for further analysis.
RNA integrity control group: housekeeping gene
Capture and reporter probes designed to detect 8 housekeeping genes and 50 algorithm genes are included as part of the kit. The expression levels of the 8 housekeeping genes were analyzed to determine the quality of RNA extracted from FFPE tissue samples and input into the assay. If the expression level of the housekeeping gene is below a predefined threshold, the sample is judged to be rejected for further analysis.
The housekeeping gene can also be used to normalize for any differences in the amount of intact RNA in the sample prior to normalization to the reference sample.
Definition of
For purposes of this disclosure, "breast cancer" includes, for example, those conditions classified as malignant pathologies by biopsy or histology clinical descriptions of breast cancer diagnosis are well known in the medical arts one of skill in the art will know that breast cancer refers to any malignancy of breast tissue, including, for example, carcinoma and sarcoma specific embodiments of breast cancer include Ductal Carcinoma In Situ (DCIS), lobular carcinoma in situ (L CIS), or mucinous carcinoma breast cancer also refers to Invasive Ductal Carcinoma (IDC) or invasive lobular carcinoma (I L C) in most embodiments of the disclosure, the subject of interest is a human patient suspected of having, or actually diagnosed with, breast cancer.
The articles "a" and "an" as used herein mean that the grammatical object of the article is intended to be one or more than one (i.e., at least one). For example, an "element" refers to one or more elements.
Throughout this specification, the word "comprise", or variations such as "comprises" or "comprising", will be understood to imply the inclusion of a stated element, integer or step, or group of elements, integers or steps, but not the exclusion of any other element, integer or step, or group of elements, integers or steps.
Examples
Example 1 NANO46 subtype typing test
The relevant assay procedure for breast cancer intrinsic subtype typing tests is given in FIG. 5 RNA isolation, which uses nCounter CodeSet specifically designed for those genes to measure the expression levels of 46 target genes plus eight housekeeping genes simultaneously in one hybridization reaction, for example, the housekeeping genes described in U.S. patent publication No. 2008/0032293, the entire contents of which are incorporated herein by reference, can be used for normalization.
Examination/acquisition and RNA extraction of FFPE tissue: breast cancer intrinsic subtyping tests will use RNA extracted from formalin-fixed, paraffin-embedded (FFPE) tissue that has been diagnosed as breast infiltrating carcinoma. The pathologist examines the H & E stained slides to identify tissue regions containing sufficient tumor tissue content for testing. Unstained slide-mounted tissue sections were processed by macroscopic dissection of the identified tumor area on each slide to remove adjacent normal tissue. RNA is then isolated from the tumor tissue and DNA is removed from the sample.
Assay setup and initiation of hybridization: for each batch of up to 10 RNA samples isolated from breast tumors, the user can set up a run using nCounter analysis x5 system software that tracks sample processing, reagent lot numbers, and results for each sample. To begin the assay, the user pipettes a specific amount of RNA into a separate one of the 12 reaction zone tubes and adds CodeSet and hybridization buffer. The reference sample is pipetted into the remaining two tubes containing CodeSet and hybridization buffer. CodeSet consists of probes for each targeted gene, additional probes for endogenous "housekeeping" normalization genes, and positive and negative controls incorporated into the assay. The reference sample consists of in vitro transcribed RNA of the targeted gene and the housekeeping gene. Once the hybridization reagents are added to each tube, the user transfers the strip tube to a heating module with a thermal cap, at a set temperature for a prescribed period of time.
Purification and binding on Prep station: after completion of the hybridization, the user transfers the strip tube containing the 10 assays and 2 reference sample sets and the required pre-loaded reagents and disposables to the nCounterPrep station. The automated purification process then removes excess capture and reporter probes through two successive hybridization-driven magnetic bead capture steps. The nCounterPrep workstation then transfers the purified target/probe complexes to an nCounter cassette for capture to a glass slide. After completing this run, the user removes the cartridge from the Prep station and seals it with an adhesive film.
Imaging and analysis were performed on a digital analyzer: the cassette was sealed and inserted into an nCounter digital analyzer which counted the number of probes for each gene captured on the slide, which corresponds to the number of targets in solution. The automated software then checks the threshold values for the housekeeping genes, reference samples, and positive and negative controls to determine whether each assay is acceptable and to ensure that the procedure is performed correctly. The signal for each sample was then normalized using a housekeeping gene to control the input sample quality. This signal is then normalized to the reference sample in each run to control lot-to-lot variation. The resulting normalized data was entered in the Breast Cancer Intrinsic subtype typing (Breast Cancer subtype) algorithm to determine the tumor Intrinsic subtype and recurrence risk score.
Example 2: clinical validation of NANO46 Risk of relapse (ROR) score to predict early breast with HR +
Residual risk of Distant Recurrence (DR) after endocrine therapy in cancer (EBC) postmenopausal women: absscsg study.
The objective of this study was to evaluate the efficacy of the ROR score in predicting distant recurrence in (HR + EBC) postmenopausal patients with hormone receptor positive early breast cancer treated with tamoxifen or treated with tamoxifen followed by anastrozole when tested in the routine hospital pathology laboratory with a NANO 46. Is ROR Score increased in all patients by prognostic information (distal RFS) beyond Clinical Treatment Score (CTS includes: lymph node, grade, tumor size, age, Treatment)? Is the ROR-based risk group classified in all patients for prognostic information (distal RFS) that exceeds the clinical treatment Score?
For review of the study: 3,714 patients participated in ABCSG 8. Patients were postmenopausal women with HR + EBC (node negative and note positive), primary or secondary, previously untreated. 1,671 patients again agreed to long-term follow-up or death. The median follow-up period was 11 years. 1,620 FFPE blocks are collected. The carcinomas in 25 blocks were deficient in pathway inspection (path review), 73 included RNAs were deficient, and 44 QC specifications were not suitable for NanoString devices. 1,478 patients (91.2%) were analyzed by NANO 46.
The method comprises the following steps: three unstained 10 micron sections and 1H & E slide from each patient were sent to a separate academic pathology laboratory in BCCA where histological examination, manual macroscopic cutting and RNA extraction were performed. Then 250ng of the extracted RNA was analyzed by NANO46 using a NanoString nCounter analysis system; both intrinsic subtype and ROR scores were calculated.
Results ROR score increased statistically significant prognostic information (far-end RFS) beyond CTS in all patients (likelihood ratio test Δ L R χ)2Risk group based on ROR increased statistically significant prognostic information (far-end RFS) beyond CTS in all patients (likelihood ratio test Δ L R χ)234.1, p < 0.0001). The difference between luminal a and luminal B increased statistically significant prognostic information (distal RFS) beyond CTS in all patients (luminal B versus type a: HR ═ 2.38, 95% CI; 1.69-3.35, p < 0.0001). The results in the lymph node negative and lymph node positive subgroups were similar to the results reported for all patients in this study.
And (4) conclusion: the results indicate that both ROR scores and ROR-based risk groups increase statistically significant prognostic information beyond clinical treatment scores. The results demonstrate that complex, multi-gene expression tests can be performed in a hospital pathology laboratory and meet the same quality standards as a central reference laboratory. Together, the results of the TransATAC and abcgs 8 studies provide primary evidence for the clinical effectiveness of the NANO46 test for predicting the risk of distant recurrence in postmenopausal women with HR + EBC treated with endocrine therapy alone. The results also indicate that luminal a subtypes have better results than luminal B subtypes in postmenopausal women with HR + EBC treated with endocrine therapy alone.


Claims (12)
1. Use of a kit for determining the result of expression of each of ACTR3B, AN L N, BAG1, BC L2, B L VRA, CCNE1, CDC20, CDC6, CDCA1, CDH3, CENPF, CEP55, CXXC5, EGFR, ERBB2, ESR1, EXO1, FGFR4, FOXA1, FOXC1, GPR160, HSPC150(UBE2T), KIF2C, KNTC2, KRT14, KRT17, KRT5, MAPT, MDM2, ME L K, MIA, MKI67, M67 PH, MMP 67, MYC, NAT 67, ORC 67, PGR, PHGDH, PTTG 67, RRM 67, sf3672, S67C 39a 67, TMEM45, tyem 67, ms, UBE2 67 in a method for the preparation of a prediction of breast cancer in a subject having said method comprising:
determining expression of ACTR3B, AN L N, BAG1, BC L2, B L VRA, CCNE1, CDC20, CDC6, CDCA1, CDH3, CENPF, CEP55, CXXC5, EGFR, ERBB2, ESR1, EXO1, FGFR4, FOXA1, fox 1, GPR160, HSPC150(UBE2T), KIF2C, KNTC2, KRT14, KRT17, KRT5, MAPT, MDM2, ME L K, MIA, MKI67, M67 PH, MMP 67, MYC, NAT 67, ORC 67, PGR, PHGDH, PTTG 67, RRM 67, sf3672, S67C 39a 67, TMEM 3645, tyem 67, UBE2 and UBE 72 in a tumor sample obtained from the subject;
determining the intrinsic tumor type of a sample based on the expression of ACTR3B, AN L N, BAG1, BC L2, B L VRA, CCNE1, CDC20, CDC6, CDCA1, CDH3, CENPF, CEP55, CXXC5, EGFR, ERBB2, ESR1, EXO1, FGFR4, FOXA1, FOXC1, GPR160, HSPC150(UBE2T), KIF2C, KNTC2, KRT14, KRT17, KRT5, MAPT, MDM2, ME 2K, MIA, MKI 2, M2 PH, MMP 2, MYC, NAT 2, ORC 2, PGR, PHGDH, PTTG 2, RRM2, sf3672, S2C 39a 2, TMEM45, TYMS and UBE 2B 2, wherein the intrinsic tumor type is enriched in at least one of the basal subtype selected from the group consisting of luminal, basal-like, basal-type, and luminal-type, or luminal-type;
determining a proliferation score based on the expression of AN L N, CCNE1, CDC20, CDC6, CDCA1, CENPF, CEP55, EXO1, KIF2C, KNTC2, ME L K, MKI67, ORC 6L, PTTG1, RRM2, TYMS, UBE2C, and UBE 2T;
calculating a relapse risk score using a weighted sum of the intrinsic subtype, proliferation score, and optionally one or more clinical pathological variables such as tumor size, lymph node status, or histological grade, wherein the relapse risk score is calculated using the following formula:
and determining whether the subject has a low risk of relapse or a high risk of relapse based on the relapse risk score.
2. The use of claim 1, further comprising determining at least one of: tumor grade, tumor ploidy, lymph node status, estrogen receptor expression, progesterone receptor expression, and HER2/ERBB2 expression.
3. The use of claim 1, further comprising determining each of: tumor grade, tumor ploidy, lymph node status, estrogen receptor expression, progesterone receptor expression, and HER2/ERBB2 expression.
4. The use of claim 1, wherein the outcome is breast cancer specific survival, event-free survival or response to treatment.
5. Use according to claim 1, wherein the Nanoreporter coding System (b) is used An analytical system) determined the expression of members of the list of intrinsic genes within NANO 46.
6. A kit comprising a plurality of probes for use in a method of predicting outcome in a subject having breast cancer, the probes for determining the expression of each of the NANO46 intrinsic genes selected from AN L N, CCNE1, CDC20, CDC6, CDCA1, CENPF, CEP55, EXO1, KIF2C, KNTC2, ME L K, MKI67, ORC 6L, PTTG1, RRM2, TYMS, UBE2C, and UBE 2T.
7. The kit of claim 6, wherein the kit comprises a plurality of probes of Table 1A.
8. The kit of claim 7, wherein the kit comprises each of the probes of table 1A.
9. The kit of claim 6, wherein each probe of said plurality of probes comprises a target-specific sequence capable of hybridizing to no more than one of the inherent genes of NANO46 listed in Table 1, and optionally comprises at least two marker linking regions comprising one or more luminescent marker monomers.
10. The kit of claim 7, wherein the plurality of probes comprises probe pairs to detect the NANO46 intrinsic genes listed in Table 1, wherein each probe of a probe pair comprises a target-specific sequence that is capable of hybridizing to no more than one NANO46 intrinsic gene listed in Table 1, and wherein the target-specific sequences bind to different regions of the same NANO46 intrinsic gene.
11. The kit of claim 10, wherein one probe of a probe pair further comprises at least two label junction regions comprising one or more luminescent label monomers.
12. The kit of claim 6, further comprising one or more reagents for determining one or more clinical pathological variables of a tumor sample, such as tumor size, tumor grade, tumor ploidy, lymph node status, estrogen receptor expression, progesterone receptor expression, and HER2/ERBB2 expression.
Applications Claiming Priority (5)
| Application Number | Priority Date | Filing Date | Title |
|---|---|---|---|
| US201261650209P | 2012-05-22 | 2012-05-22 | |
| US61/650209 | 2012-05-22 | ||
| US201361753673P | 2013-01-17 | 2013-01-17 | |
| US61/753673 | 2013-01-17 | ||
| CN201380038875.4A CN104704128A (en) | 2012-05-22 | 2013-05-22 | NANO46 genes and methods to predict breast cancer outcome |
Related Parent Applications (1)
| Application Number | Title | Priority Date | Filing Date |
|---|---|---|---|
| CN201380038875.4A Division CN104704128A (en) | 2012-05-22 | 2013-05-22 | NANO46 genes and methods to predict breast cancer outcome |
Publications (1)
| Publication Number | Publication Date |
|---|---|
| CN111500718A true CN111500718A (en) | 2020-08-07 |
Family
ID=49624503
Family Applications (2)
| Application Number | Title | Priority Date | Filing Date |
|---|---|---|---|
| CN201380038875.4A Pending CN104704128A (en) | 2012-05-22 | 2013-05-22 | NANO46 genes and methods to predict breast cancer outcome |
| CN201911216650.9A Pending CN111500718A (en) | 2012-05-22 | 2013-05-22 | NANO46 gene and method for predicting breast cancer outcome |
Family Applications Before (1)
| Application Number | Title | Priority Date | Filing Date |
|---|---|---|---|
| CN201380038875.4A Pending CN104704128A (en) | 2012-05-22 | 2013-05-22 | NANO46 genes and methods to predict breast cancer outcome |
Country Status (12)
| Country | Link |
|---|---|
| US (3) | US20130337444A1 (en) |
| EP (1) | EP2852689B1 (en) |
| JP (1) | JP6325530B2 (en) |
| CN (2) | CN104704128A (en) |
| AU (1) | AU2013266419B2 (en) |
| BR (1) | BR112014029300A2 (en) |
| CA (1) | CA2874492C (en) |
| ES (1) | ES2763931T3 (en) |
| IL (1) | IL235795B (en) |
| IN (1) | IN2014MN02418A (en) |
| MX (1) | MX369628B (en) |
| WO (1) | WO2013177245A2 (en) |
Cited By (1)
| Publication number | Priority date | Publication date | Assignee | Title |
|---|---|---|---|---|
| WO2023117807A1 (en) * | 2021-12-20 | 2023-06-29 | Reveal Genomics S.L | Development and validation of an in vitro method for the prognosis of patients suffering from her2-positive breast cancer |
Families Citing this family (25)
| Publication number | Priority date | Publication date | Assignee | Title |
|---|---|---|---|---|
| EP2664679B1 (en) | 2008-05-30 | 2017-11-08 | The University of North Carolina At Chapel Hill | Gene expression profiles to predict breast cancer outcomes |
| CA2830240A1 (en) | 2011-03-15 | 2012-09-20 | The University Of North Carolina At Chapell Hill | Methods of treating breast cancer with anthracycline therapy |
| GB201106254D0 (en) | 2011-04-13 | 2011-05-25 | Frisen Jonas | Method and product |
| EP2785873A4 (en) | 2011-11-30 | 2015-11-11 | Univ North Carolina | Methods of treating breast cancer with taxane therapy |
| CA2912445A1 (en) * | 2013-05-13 | 2014-11-20 | Nanostring Technologies, Inc. | Methods to predict risk of recurrence in node-positive early breast cancer |
| US9868979B2 (en) | 2013-06-25 | 2018-01-16 | Prognosys Biosciences, Inc. | Spatially encoded biological assays using a microfluidic device |
| JP2016537010A (en) * | 2013-09-09 | 2016-12-01 | ブリティッシュ コロンビア キャンサー エージェンシー ブランチ | Method and kit for predicting prognosis, and method and kit for treating breast cancer using radiation therapy |
| SG11201704098VA (en) | 2014-11-21 | 2017-06-29 | Nanostring Technologies Inc | Enzyme- and amplification-free sequencing |
| AU2015353747B2 (en) * | 2014-11-24 | 2021-02-25 | Nanostring Technologies, Inc. | Methods and apparatuses for gene purification and imaging |
| WO2016091880A1 (en) * | 2014-12-09 | 2016-06-16 | King's College London | Breast cancer treatment with taxane therapy |
| ES2955916T3 (en) | 2015-04-10 | 2023-12-11 | Spatial Transcriptomics Ab | Multiplex analysis of biological specimens of spatially distinguished nucleic acids |
| WO2017014694A1 (en) * | 2015-07-23 | 2017-01-26 | National University Of Singapore | Wbp2 as a co-prognostic factor with her2 for stratification of patients for treatment |
| CN109715825B (en) | 2016-05-16 | 2023-01-06 | 纳米线科技公司 | Method for detecting target nucleic acid in sample |
| EP3472359B1 (en) | 2016-06-21 | 2022-03-16 | 10X Genomics, Inc. | Nucleic acid sequencing |
| WO2018074865A2 (en) * | 2016-10-21 | 2018-04-26 | 서울대학교병원 | Composition and method for breast cancer prognosis prediction |
| SG10202100951SA (en) | 2016-11-21 | 2021-03-30 | Nanostring Technologies Inc | Chemical compositions and methods of using same |
| KR101950717B1 (en) * | 2016-11-23 | 2019-02-21 | 주식회사 젠큐릭스 | Methods for predicting effectiveness of chemotherapy for breast cancer patients |
| US11978535B2 (en) * | 2017-02-01 | 2024-05-07 | The Translational Genomics Research Institute | Methods of detecting somatic and germline variants in impure tumors |
| CA3078158A1 (en) | 2017-10-06 | 2019-04-11 | Cartana Ab | Rna templated ligation |
| KR102071491B1 (en) * | 2017-11-10 | 2020-01-30 | 주식회사 디시젠 | Breast cancer prognosis prediction method and system based on machine learning using next generation sequencing |
| CA3099909A1 (en) | 2018-05-14 | 2019-11-21 | Nanostring Technologies, Inc. | Chemical compositions and methods of using same |
| CN113302313A (en) * | 2018-11-05 | 2021-08-24 | 拜恩科技诊断有限责任公司 | Method for predicting breast cancer |
| CA3139791A1 (en) | 2019-05-31 | 2020-12-03 | 10X Genomics, Inc. | Method of detecting target nucleic acid molecules |
| JP7352937B2 (en) * | 2019-07-19 | 2023-09-29 | 公立大学法人福島県立医科大学 | Differential marker gene set, method and kit for differentiating or classifying breast cancer subtypes |
| EP3945136A1 (en) * | 2020-07-28 | 2022-02-02 | Hospital Clínic de Barcelona | In vitro method for the prognosis of patients suffering from her2-positive breast cancer |
Citations (2)
| Publication number | Priority date | Publication date | Assignee | Title |
|---|---|---|---|---|
| US20100015607A1 (en) * | 2005-12-23 | 2010-01-21 | Nanostring Technologies, Inc. | Nanoreporters and methods of manufacturing and use thereof |
| US20110145176A1 (en) * | 2008-05-30 | 2011-06-16 | Perou Charles M | Gene expression profiles to predict breast cancer outcomes |
Family Cites Families (22)
| Publication number | Priority date | Publication date | Assignee | Title |
|---|---|---|---|---|
| US6040138A (en) | 1995-09-15 | 2000-03-21 | Affymetrix, Inc. | Expression monitoring by hybridization to high density oligonucleotide arrays |
| US5800992A (en) | 1989-06-07 | 1998-09-01 | Fodor; Stephen P.A. | Method of detecting nucleic acids |
| CA2118806A1 (en) | 1991-09-18 | 1993-04-01 | William J. Dower | Method of synthesizing diverse collections of oligomers |
| US5384261A (en) | 1991-11-22 | 1995-01-24 | Affymax Technologies N.V. | Very large scale immobilized polymer synthesis using mechanically directed flow paths |
| ATE262374T1 (en) | 1991-11-22 | 2004-04-15 | Affymetrix Inc | COMBINATORY STRATEGIES FOR POLYMER SYNTHESIS |
| US5856174A (en) | 1995-06-29 | 1999-01-05 | Affymetrix, Inc. | Integrated nucleic acid diagnostic device |
| EP0880598A4 (en) | 1996-01-23 | 2005-02-23 | Affymetrix Inc | Nucleic acid analysis techniques |
| JP2001521753A (en) | 1997-10-31 | 2001-11-13 | アフィメトリックス インコーポレイテッド | Expression profiles in adult and fetal organs |
| US6020135A (en) | 1998-03-27 | 2000-02-01 | Affymetrix, Inc. | P53-regulated genes |
| US6750015B2 (en) * | 2000-06-28 | 2004-06-15 | Kathryn B. Horwitz | Progesterone receptor-regulated gene expression and methods related thereto |
| US20020168639A1 (en) * | 2000-09-22 | 2002-11-14 | Muraca Patrick J. | Profile array substrates |
| ES2488845T5 (en) * | 2003-06-24 | 2017-07-11 | Genomic Health, Inc. | Prediction of the probability of cancer recurrence |
| EP1671121A4 (en) * | 2003-09-29 | 2007-12-19 | Pathwork Diagnostics Inc | Systems and methods for detecting biological features |
| WO2006010150A2 (en) | 2004-07-15 | 2006-01-26 | University Of Utah Research Foundation | Housekeeping genes and methods for identifying the same |
| CN101061480A (en) * | 2004-09-22 | 2007-10-24 | 三路影像公司 | Methods and computer program products for analysis and optimization of marker candidates for cancer prognosis |
| CA2630974A1 (en) | 2005-11-23 | 2007-05-31 | University Of Utah Research Foundation | Methods and compositions involving intrinsic genes |
| US8986926B2 (en) | 2005-12-23 | 2015-03-24 | Nanostring Technologies, Inc. | Compositions comprising oriented, immobilized macromolecules and methods for their preparation |
| EP2155899A2 (en) | 2007-04-10 | 2010-02-24 | Nanostring Technologies, Inc. | Methods and computer systems for identifying target-specific sequences for use in nanoreporters |
| WO2008150512A2 (en) * | 2007-06-04 | 2008-12-11 | University Of Louisville Research Foundation, Inc. | Methods for identifying an increased likelihood of recurrence of breast cancer |
| ES2618353T3 (en) * | 2007-09-06 | 2017-06-21 | Biotheranostics, Inc. | Classification of tumors and prognosis of breast cancer |
| JP5836803B2 (en) | 2008-08-14 | 2015-12-24 | ナノストリング テクノロジーズ, インコーポレイテッド | Stable nanoreporter |
| PL2845911T3 (en) * | 2010-03-31 | 2017-01-31 | Sividon Diagnostics Gmbh | Method for breast cancer recurrence prediction under endocrine treatment |
-
2013
- 2013-05-22 MX MX2014014275A patent/MX369628B/en active IP Right Grant
- 2013-05-22 ES ES13794236T patent/ES2763931T3/en active Active
- 2013-05-22 CA CA2874492A patent/CA2874492C/en active Active
- 2013-05-22 CN CN201380038875.4A patent/CN104704128A/en active Pending
- 2013-05-22 BR BR112014029300A patent/BR112014029300A2/en not_active Application Discontinuation
- 2013-05-22 JP JP2015514143A patent/JP6325530B2/en active Active
- 2013-05-22 US US13/899,656 patent/US20130337444A1/en not_active Abandoned
- 2013-05-22 WO PCT/US2013/042157 patent/WO2013177245A2/en active Application Filing
- 2013-05-22 EP EP13794236.3A patent/EP2852689B1/en active Active
- 2013-05-22 IN IN2418MUN2014 patent/IN2014MN02418A/en unknown
- 2013-05-22 CN CN201911216650.9A patent/CN111500718A/en active Pending
- 2013-05-22 AU AU2013266419A patent/AU2013266419B2/en active Active
-
2014
- 2014-11-20 IL IL235795A patent/IL235795B/en active IP Right Grant
-
2020
- 2020-02-14 US US16/792,051 patent/US20200332368A1/en not_active Abandoned
-
2022
- 2022-09-29 US US17/936,745 patent/US20230272476A1/en active Pending
Patent Citations (2)
| Publication number | Priority date | Publication date | Assignee | Title |
|---|---|---|---|---|
| US20100015607A1 (en) * | 2005-12-23 | 2010-01-21 | Nanostring Technologies, Inc. | Nanoreporters and methods of manufacturing and use thereof |
| US20110145176A1 (en) * | 2008-05-30 | 2011-06-16 | Perou Charles M | Gene expression profiles to predict breast cancer outcomes |
Cited By (1)
| Publication number | Priority date | Publication date | Assignee | Title |
|---|---|---|---|---|
| WO2023117807A1 (en) * | 2021-12-20 | 2023-06-29 | Reveal Genomics S.L | Development and validation of an in vitro method for the prognosis of patients suffering from her2-positive breast cancer |
Also Published As
| Publication number | Publication date |
|---|---|
| WO2013177245A2 (en) | 2013-11-28 |
| CN104704128A (en) | 2015-06-10 |
| AU2013266419A1 (en) | 2014-12-11 |
| CA2874492C (en) | 2021-10-19 |
| MX369628B (en) | 2019-11-14 |
| WO2013177245A3 (en) | 2015-01-29 |
| CA2874492A1 (en) | 2013-11-28 |
| IL235795B (en) | 2020-02-27 |
| JP2015518724A (en) | 2015-07-06 |
| BR112014029300A2 (en) | 2017-07-25 |
| MX2014014275A (en) | 2015-07-06 |
| AU2013266419B2 (en) | 2018-09-27 |
| IN2014MN02418A (en) | 2015-08-14 |
| US20130337444A1 (en) | 2013-12-19 |
| JP6325530B2 (en) | 2018-05-16 |
| US20230272476A1 (en) | 2023-08-31 |
| EP2852689B1 (en) | 2019-12-11 |
| EP2852689A2 (en) | 2015-04-01 |
| IL235795A0 (en) | 2015-01-29 |
| EP2852689A4 (en) | 2016-05-11 |
| US20200332368A1 (en) | 2020-10-22 |
| ES2763931T3 (en) | 2020-06-01 |
Similar Documents
| Publication | Publication Date | Title |
|---|---|---|
| US20230272476A1 (en) | Nano46 genes and methods to predict breast cancer outcome | |
| JP5971769B2 (en) | Methods of treating breast cancer using anthracycline therapy | |
| US9181588B2 (en) | Methods of treating breast cancer with taxane therapy | |
| JP2015530072A (en) | Breast cancer treatment with gemcitabine therapy | |
| US20140154681A1 (en) | Methods to Predict Breast Cancer Outcome | |
| US20160115551A1 (en) | Methods to predict risk of recurrence in node-positive early breast cancer | |
| US20150072021A1 (en) | Methods and Kits for Predicting Outcome and Methods and Kits for Treating Breast Cancer with Radiation Therapy | |
| WO2009037090A1 (en) | Molecular markers for tumor cell content in tissue samples | |
| EP2278026A1 (en) | A method for predicting clinical outcome of patients with breast carcinoma | |
| WO2013079188A1 (en) | Methods for the diagnosis, the determination of the grade of a solid tumor and the prognosis of a subject suffering from cancer | |
| US20160160293A1 (en) | Breast cancer treatment with taxane therapy | |
| Ta et al. | Molecular subtyping of diffuse large B-cell lymphoma using a novel quantitative RT-PCR assay |
Legal Events
| Date | Code | Title | Description |
|---|---|---|---|
| PB01 | Publication | ||
| PB01 | Publication | ||
| SE01 | Entry into force of request for substantive examination | ||
| SE01 | Entry into force of request for substantive examination |