EP2852689B1 - Nano46 genes and methods to predict breast cancer outcome - Google Patents
Nano46 genes and methods to predict breast cancer outcome Download PDFInfo
- Publication number
- EP2852689B1 EP2852689B1 EP13794236.3A EP13794236A EP2852689B1 EP 2852689 B1 EP2852689 B1 EP 2852689B1 EP 13794236 A EP13794236 A EP 13794236A EP 2852689 B1 EP2852689 B1 EP 2852689B1
- Authority
- EP
- European Patent Office
- Prior art keywords
- expression
- genes
- intrinsic
- breast cancer
- risk
- Prior art date
- Legal status (The legal status is an assumption and is not a legal conclusion. Google has not performed a legal analysis and makes no representation as to the accuracy of the status listed.)
- Active
Links
- 108090000623 proteins and genes Proteins 0.000 title claims description 124
- 206010006187 Breast cancer Diseases 0.000 title claims description 111
- 208000026310 Breast neoplasm Diseases 0.000 title claims description 110
- 238000000034 method Methods 0.000 title claims description 88
- 230000014509 gene expression Effects 0.000 claims description 128
- 206010028980 Neoplasm Diseases 0.000 claims description 90
- 108091032973 (ribonucleotides)n+m Proteins 0.000 claims description 62
- 208000026535 luminal A breast carcinoma Diseases 0.000 claims description 47
- 101001012157 Homo sapiens Receptor tyrosine-protein kinase erbB-2 Proteins 0.000 claims description 44
- 102100030086 Receptor tyrosine-protein kinase erbB-2 Human genes 0.000 claims description 44
- 208000026534 luminal B breast carcinoma Diseases 0.000 claims description 44
- 102100038595 Estrogen receptor Human genes 0.000 claims description 36
- 108010038795 estrogen receptors Proteins 0.000 claims description 33
- 238000004458 analytical method Methods 0.000 claims description 30
- 230000035755 proliferation Effects 0.000 claims description 21
- 230000004083 survival effect Effects 0.000 claims description 21
- 102000003998 progesterone receptors Human genes 0.000 claims description 16
- 108090000468 progesterone receptors Proteins 0.000 claims description 16
- 101150029707 ERBB2 gene Proteins 0.000 claims description 15
- 238000002560 therapeutic procedure Methods 0.000 claims description 9
- 101000837581 Homo sapiens Ubiquitin-conjugating enzyme E2 T Proteins 0.000 claims description 7
- 102100028705 Ubiquitin-conjugating enzyme E2 T Human genes 0.000 claims description 7
- 230000004044 response Effects 0.000 claims description 7
- 102100033393 Anillin Human genes 0.000 claims description 6
- 108700020472 CDC20 Proteins 0.000 claims description 6
- 101150023302 Cdc20 gene Proteins 0.000 claims description 6
- 102100027047 Cell division control protein 6 homolog Human genes 0.000 claims description 6
- 102100038099 Cell division cycle protein 20 homolog Human genes 0.000 claims description 6
- 102100023344 Centromere protein F Human genes 0.000 claims description 6
- 102100031219 Centrosomal protein of 55 kDa Human genes 0.000 claims description 6
- 101710092479 Centrosomal protein of 55 kDa Proteins 0.000 claims description 6
- 102100037858 G1/S-specific cyclin-E1 Human genes 0.000 claims description 6
- 101000732632 Homo sapiens Anillin Proteins 0.000 claims description 6
- 101000914465 Homo sapiens Cell division control protein 6 homolog Proteins 0.000 claims description 6
- 101000907941 Homo sapiens Centromere protein F Proteins 0.000 claims description 6
- 101000738568 Homo sapiens G1/S-specific cyclin-E1 Proteins 0.000 claims description 6
- 101001050567 Homo sapiens Kinesin-like protein KIF2C Proteins 0.000 claims description 6
- 101001112162 Homo sapiens Kinetochore protein NDC80 homolog Proteins 0.000 claims description 6
- 101000590482 Homo sapiens Kinetochore protein Nuf2 Proteins 0.000 claims description 6
- 101000721146 Homo sapiens Origin recognition complex subunit 6 Proteins 0.000 claims description 6
- 101000945496 Homo sapiens Proliferation marker protein Ki-67 Proteins 0.000 claims description 6
- 101000575639 Homo sapiens Ribonucleoside-diphosphate reductase subunit M2 Proteins 0.000 claims description 6
- 101001087372 Homo sapiens Securin Proteins 0.000 claims description 6
- 101000809797 Homo sapiens Thymidylate synthase Proteins 0.000 claims description 6
- 101000807354 Homo sapiens Ubiquitin-conjugating enzyme E2 C Proteins 0.000 claims description 6
- 102100023424 Kinesin-like protein KIF2C Human genes 0.000 claims description 6
- 102100023890 Kinetochore protein NDC80 homolog Human genes 0.000 claims description 6
- 102100032431 Kinetochore protein Nuf2 Human genes 0.000 claims description 6
- 102100024299 Maternal embryonic leucine zipper kinase Human genes 0.000 claims description 6
- 101710154611 Maternal embryonic leucine zipper kinase Proteins 0.000 claims description 6
- 102100025201 Origin recognition complex subunit 6 Human genes 0.000 claims description 6
- 102100034836 Proliferation marker protein Ki-67 Human genes 0.000 claims description 6
- 102100026006 Ribonucleoside-diphosphate reductase subunit M2 Human genes 0.000 claims description 6
- 101100010298 Schizosaccharomyces pombe (strain 972 / ATCC 24843) pol2 gene Proteins 0.000 claims description 6
- 102100033004 Securin Human genes 0.000 claims description 6
- 102100038618 Thymidylate synthase Human genes 0.000 claims description 6
- 102100037256 Ubiquitin-conjugating enzyme E2 C Human genes 0.000 claims description 6
- 101150078635 18 gene Proteins 0.000 claims description 4
- KIAPWMKFHIKQOZ-UHFFFAOYSA-N 2-[[(4-fluorophenyl)-oxomethyl]amino]benzoic acid methyl ester Chemical compound COC(=O)C1=CC=CC=C1NC(=O)C1=CC=C(F)C=C1 KIAPWMKFHIKQOZ-UHFFFAOYSA-N 0.000 claims description 4
- 102100029075 Exonuclease 1 Human genes 0.000 claims description 4
- 101000918264 Homo sapiens Exonuclease 1 Proteins 0.000 claims description 4
- 241001609030 Brosme brosme Species 0.000 claims 1
- 241000023320 Luma <angiosperm> Species 0.000 claims 1
- OSWPMRLSEDHDFF-UHFFFAOYSA-N methyl salicylate Chemical compound COC(=O)C1=CC=CC=C1O OSWPMRLSEDHDFF-UHFFFAOYSA-N 0.000 claims 1
- 239000000523 sample Substances 0.000 description 176
- 238000012360 testing method Methods 0.000 description 59
- 210000001519 tissue Anatomy 0.000 description 44
- 238000003556 assay Methods 0.000 description 42
- 238000009396 hybridization Methods 0.000 description 42
- 108700039887 Essential Genes Proteins 0.000 description 32
- 238000004422 calculation algorithm Methods 0.000 description 21
- 239000013074 reference sample Substances 0.000 description 21
- 238000010606 normalization Methods 0.000 description 20
- 239000012472 biological sample Substances 0.000 description 18
- NKANXQFJJICGDU-QPLCGJKRSA-N Tamoxifen Chemical compound C=1C=CC=CC=1C(/CC)=C(C=1C=CC(OCCN(C)C)=CC=1)/C1=CC=CC=C1 NKANXQFJJICGDU-QPLCGJKRSA-N 0.000 description 16
- 210000004027 cell Anatomy 0.000 description 16
- 108020004999 messenger RNA Proteins 0.000 description 16
- 239000003153 chemical reaction reagent Substances 0.000 description 15
- 230000004913 activation Effects 0.000 description 14
- 201000011510 cancer Diseases 0.000 description 14
- 238000006243 chemical reaction Methods 0.000 description 14
- 238000001514 detection method Methods 0.000 description 14
- 238000011282 treatment Methods 0.000 description 14
- 238000004393 prognosis Methods 0.000 description 13
- 210000000481 breast Anatomy 0.000 description 12
- 201000010099 disease Diseases 0.000 description 12
- 208000037265 diseases, disorders, signs and symptoms Diseases 0.000 description 12
- 239000013642 negative control Substances 0.000 description 12
- 230000008569 process Effects 0.000 description 12
- 230000022131 cell cycle Effects 0.000 description 11
- 239000013641 positive control Substances 0.000 description 11
- 238000012545 processing Methods 0.000 description 11
- 238000000746 purification Methods 0.000 description 11
- 108020004414 DNA Proteins 0.000 description 10
- RJKFOVLPORLFTN-LEKSSAKUSA-N Progesterone Chemical compound C1CC2=CC(=O)CC[C@]2(C)[C@@H]2[C@@H]1[C@@H]1CC[C@H](C(=O)C)[C@@]1(C)CC2 RJKFOVLPORLFTN-LEKSSAKUSA-N 0.000 description 10
- 238000000338 in vitro Methods 0.000 description 10
- 238000003199 nucleic acid amplification method Methods 0.000 description 10
- 239000013615 primer Substances 0.000 description 10
- 102000001301 EGF receptor Human genes 0.000 description 9
- 108060006698 EGF receptor Proteins 0.000 description 9
- 238000002123 RNA extraction Methods 0.000 description 9
- 239000013614 RNA sample Substances 0.000 description 9
- 230000003321 amplification Effects 0.000 description 9
- 238000003491 array Methods 0.000 description 9
- 230000027455 binding Effects 0.000 description 9
- 210000001165 lymph node Anatomy 0.000 description 9
- 150000007523 nucleic acids Chemical class 0.000 description 9
- 238000012549 training Methods 0.000 description 9
- 239000000872 buffer Substances 0.000 description 8
- 230000000875 corresponding effect Effects 0.000 description 8
- 238000013480 data collection Methods 0.000 description 8
- 238000009261 endocrine therapy Methods 0.000 description 8
- 229940034984 endocrine therapy antineoplastic and immunomodulating agent Drugs 0.000 description 8
- 238000003384 imaging method Methods 0.000 description 8
- 102000039446 nucleic acids Human genes 0.000 description 8
- 108020004707 nucleic acids Proteins 0.000 description 8
- 238000012552 review Methods 0.000 description 8
- 229960001603 tamoxifen Drugs 0.000 description 8
- 238000012546 transfer Methods 0.000 description 8
- 238000001574 biopsy Methods 0.000 description 7
- 238000013145 classification model Methods 0.000 description 7
- 108091008039 hormone receptors Proteins 0.000 description 7
- 238000002493 microarray Methods 0.000 description 7
- 239000000047 product Substances 0.000 description 7
- 239000000758 substrate Substances 0.000 description 7
- 102100023144 Zinc transporter ZIP6 Human genes 0.000 description 6
- 239000011324 bead Substances 0.000 description 6
- 238000002509 fluorescent in situ hybridization Methods 0.000 description 6
- 238000005259 measurement Methods 0.000 description 6
- 102000040430 polynucleotide Human genes 0.000 description 6
- 108091033319 polynucleotide Proteins 0.000 description 6
- 239000002157 polynucleotide Substances 0.000 description 6
- 239000000243 solution Substances 0.000 description 6
- 108091034117 Oligonucleotide Proteins 0.000 description 5
- 238000013459 approach Methods 0.000 description 5
- 239000000090 biomarker Substances 0.000 description 5
- 210000004369 blood Anatomy 0.000 description 5
- 239000008280 blood Substances 0.000 description 5
- 210000001124 body fluid Anatomy 0.000 description 5
- 230000007170 pathology Effects 0.000 description 5
- 239000000186 progesterone Substances 0.000 description 5
- 229960003387 progesterone Drugs 0.000 description 5
- 238000003908 quality control method Methods 0.000 description 5
- YBJHBAHKTGYVGT-ZKWXMUAHSA-N (+)-Biotin Chemical compound N1C(=O)N[C@@H]2[C@H](CCCCC(=O)O)SC[C@@H]21 YBJHBAHKTGYVGT-ZKWXMUAHSA-N 0.000 description 4
- 108700031843 GRB7 Adaptor Proteins 0.000 description 4
- 101150052409 GRB7 gene Proteins 0.000 description 4
- 102100033107 Growth factor receptor-bound protein 7 Human genes 0.000 description 4
- 206010027476 Metastases Diseases 0.000 description 4
- 238000003149 assay kit Methods 0.000 description 4
- 229960002685 biotin Drugs 0.000 description 4
- 239000011616 biotin Substances 0.000 description 4
- 238000002512 chemotherapy Methods 0.000 description 4
- 230000002349 favourable effect Effects 0.000 description 4
- 239000011521 glass Substances 0.000 description 4
- 238000003364 immunohistochemistry Methods 0.000 description 4
- 230000009401 metastasis Effects 0.000 description 4
- 238000003757 reverse transcription PCR Methods 0.000 description 4
- 239000007787 solid Substances 0.000 description 4
- 238000003860 storage Methods 0.000 description 4
- WVAKRQOMAINQPU-UHFFFAOYSA-N 2-[4-[2-[5-(2,2-dimethylbutyl)-1h-imidazol-2-yl]ethyl]phenyl]pyridine Chemical compound N1C(CC(C)(C)CC)=CN=C1CCC1=CC=C(C=2N=CC=CC=2)C=C1 WVAKRQOMAINQPU-UHFFFAOYSA-N 0.000 description 3
- 102100029511 26S proteasome regulatory subunit 6B Human genes 0.000 description 3
- 102100028104 39S ribosomal protein L19, mitochondrial Human genes 0.000 description 3
- 102100029631 Actin-related protein 3B Human genes 0.000 description 3
- 102100021569 Apoptosis regulator Bcl-2 Human genes 0.000 description 3
- 101100208111 Arabidopsis thaliana TRX5 gene Proteins 0.000 description 3
- 102100037152 BAG family molecular chaperone regulator 1 Human genes 0.000 description 3
- 108091012583 BCL2 Proteins 0.000 description 3
- 102100026031 Beta-glucuronidase Human genes 0.000 description 3
- 102100035752 Biliverdin reductase A Human genes 0.000 description 3
- 102100036167 CXXC-type zinc finger protein 5 Human genes 0.000 description 3
- 102100024153 Cadherin-15 Human genes 0.000 description 3
- 108010058546 Cyclin D1 Proteins 0.000 description 3
- 102100037579 D-3-phosphoglycerate dehydrogenase Human genes 0.000 description 3
- 239000003155 DNA primer Substances 0.000 description 3
- 108050002772 E3 ubiquitin-protein ligase Mdm2 Proteins 0.000 description 3
- 102000012199 E3 ubiquitin-protein ligase Mdm2 Human genes 0.000 description 3
- -1 EXOl Proteins 0.000 description 3
- 102100027844 Fibroblast growth factor receptor 4 Human genes 0.000 description 3
- 102100021084 Forkhead box protein C1 Human genes 0.000 description 3
- 102100024165 G1/S-specific cyclin-D1 Human genes 0.000 description 3
- 102100029283 Hepatocyte nuclear factor 3-alpha Human genes 0.000 description 3
- 101001125524 Homo sapiens 26S proteasome regulatory subunit 6B Proteins 0.000 description 3
- 101001079803 Homo sapiens 39S ribosomal protein L19, mitochondrial Proteins 0.000 description 3
- 101000756632 Homo sapiens Actin, cytoplasmic 1 Proteins 0.000 description 3
- 101000728742 Homo sapiens Actin-related protein 3B Proteins 0.000 description 3
- 101000884385 Homo sapiens Arylamine N-acetyltransferase 1 Proteins 0.000 description 3
- 101000740062 Homo sapiens BAG family molecular chaperone regulator 1 Proteins 0.000 description 3
- 101000933465 Homo sapiens Beta-glucuronidase Proteins 0.000 description 3
- 101000802825 Homo sapiens Biliverdin reductase A Proteins 0.000 description 3
- 101000947154 Homo sapiens CXXC-type zinc finger protein 5 Proteins 0.000 description 3
- 101000762242 Homo sapiens Cadherin-15 Proteins 0.000 description 3
- 101000714553 Homo sapiens Cadherin-3 Proteins 0.000 description 3
- 101000739890 Homo sapiens D-3-phosphoglycerate dehydrogenase Proteins 0.000 description 3
- 101000882584 Homo sapiens Estrogen receptor Proteins 0.000 description 3
- 101001034811 Homo sapiens Eukaryotic translation initiation factor 4 gamma 2 Proteins 0.000 description 3
- 101000917134 Homo sapiens Fibroblast growth factor receptor 4 Proteins 0.000 description 3
- 101000818310 Homo sapiens Forkhead box protein C1 Proteins 0.000 description 3
- 101001062353 Homo sapiens Hepatocyte nuclear factor 3-alpha Proteins 0.000 description 3
- 101000614436 Homo sapiens Keratin, type I cytoskeletal 14 Proteins 0.000 description 3
- 101000998027 Homo sapiens Keratin, type I cytoskeletal 17 Proteins 0.000 description 3
- 101001056473 Homo sapiens Keratin, type II cytoskeletal 5 Proteins 0.000 description 3
- 101001055386 Homo sapiens Melanophilin Proteins 0.000 description 3
- 101000891579 Homo sapiens Microtubule-associated protein tau Proteins 0.000 description 3
- 101000857740 Homo sapiens Probable G-protein coupled receptor 160 Proteins 0.000 description 3
- 101000616974 Homo sapiens Pumilio homolog 1 Proteins 0.000 description 3
- 101100420560 Homo sapiens SLC39A6 gene Proteins 0.000 description 3
- 101000864743 Homo sapiens Secreted frizzled-related protein 1 Proteins 0.000 description 3
- 101000639975 Homo sapiens Sodium-dependent noradrenaline transporter Proteins 0.000 description 3
- 101000707546 Homo sapiens Splicing factor 3A subunit 1 Proteins 0.000 description 3
- 101000577877 Homo sapiens Stromelysin-3 Proteins 0.000 description 3
- 101000819111 Homo sapiens Trans-acting T-cell-specific transcription factor GATA-3 Proteins 0.000 description 3
- 101000835093 Homo sapiens Transferrin receptor protein 1 Proteins 0.000 description 3
- 101000831862 Homo sapiens Transmembrane protein 45B Proteins 0.000 description 3
- 102100040445 Keratin, type I cytoskeletal 14 Human genes 0.000 description 3
- 102100033511 Keratin, type I cytoskeletal 17 Human genes 0.000 description 3
- 102100025756 Keratin, type II cytoskeletal 5 Human genes 0.000 description 3
- 102100026158 Melanophilin Human genes 0.000 description 3
- 102100040243 Microtubule-associated protein tau Human genes 0.000 description 3
- 108020004711 Nucleic Acid Probes Proteins 0.000 description 3
- 108091028043 Nucleic acid sequence Proteins 0.000 description 3
- 239000002202 Polyethylene glycol Substances 0.000 description 3
- 102100025346 Probable G-protein coupled receptor 160 Human genes 0.000 description 3
- 102100021672 Pumilio homolog 1 Human genes 0.000 description 3
- 108091006938 SLC39A6 Proteins 0.000 description 3
- 102100030058 Secreted frizzled-related protein 1 Human genes 0.000 description 3
- 102100033929 Sodium-dependent noradrenaline transporter Human genes 0.000 description 3
- 102100031713 Splicing factor 3A subunit 1 Human genes 0.000 description 3
- 108010090804 Streptavidin Proteins 0.000 description 3
- 102100028847 Stromelysin-3 Human genes 0.000 description 3
- 102100021386 Trans-acting T-cell-specific transcription factor GATA-3 Human genes 0.000 description 3
- 102100026144 Transferrin receptor protein 1 Human genes 0.000 description 3
- 102100024181 Transmembrane protein 45B Human genes 0.000 description 3
- 230000000295 complement effect Effects 0.000 description 3
- 238000004590 computer program Methods 0.000 description 3
- 238000003745 diagnosis Methods 0.000 description 3
- 238000010790 dilution Methods 0.000 description 3
- 239000012895 dilution Substances 0.000 description 3
- 239000000975 dye Substances 0.000 description 3
- 238000005516 engineering process Methods 0.000 description 3
- 229940011871 estrogen Drugs 0.000 description 3
- 239000000262 estrogen Substances 0.000 description 3
- 102000006602 glyceraldehyde-3-phosphate dehydrogenase Human genes 0.000 description 3
- 108020004445 glyceraldehyde-3-phosphate dehydrogenase Proteins 0.000 description 3
- 230000036541 health Effects 0.000 description 3
- 239000000017 hydrogel Substances 0.000 description 3
- 238000012744 immunostaining Methods 0.000 description 3
- 208000030776 invasive breast carcinoma Diseases 0.000 description 3
- 230000007774 longterm Effects 0.000 description 3
- 239000002853 nucleic acid probe Substances 0.000 description 3
- 239000012188 paraffin wax Substances 0.000 description 3
- 229920001223 polyethylene glycol Polymers 0.000 description 3
- 238000000513 principal component analysis Methods 0.000 description 3
- 238000005070 sampling Methods 0.000 description 3
- 238000013519 translation Methods 0.000 description 3
- 238000010200 validation analysis Methods 0.000 description 3
- 101150052384 50 gene Proteins 0.000 description 2
- 102100040881 60S acidic ribosomal protein P0 Human genes 0.000 description 2
- WSFSSNUMVMOOMR-UHFFFAOYSA-N Formaldehyde Chemical compound O=C WSFSSNUMVMOOMR-UHFFFAOYSA-N 0.000 description 2
- 101000673456 Homo sapiens 60S acidic ribosomal protein P0 Proteins 0.000 description 2
- 238000003657 Likelihood-ratio test Methods 0.000 description 2
- 238000008149 MammaPrint Methods 0.000 description 2
- 238000010802 RNA extraction kit Methods 0.000 description 2
- 239000002313 adhesive film Substances 0.000 description 2
- 239000000427 antigen Substances 0.000 description 2
- 108091007433 antigens Proteins 0.000 description 2
- 102000036639 antigens Human genes 0.000 description 2
- 235000020958 biotin Nutrition 0.000 description 2
- 238000004364 calculation method Methods 0.000 description 2
- 230000003292 diminished effect Effects 0.000 description 2
- 230000005684 electric field Effects 0.000 description 2
- 201000007281 estrogen-receptor positive breast cancer Diseases 0.000 description 2
- 238000011156 evaluation Methods 0.000 description 2
- 238000001704 evaporation Methods 0.000 description 2
- 230000008020 evaporation Effects 0.000 description 2
- 238000010195 expression analysis Methods 0.000 description 2
- 239000000835 fiber Substances 0.000 description 2
- 239000012530 fluid Substances 0.000 description 2
- 230000006870 function Effects 0.000 description 2
- 239000000499 gel Substances 0.000 description 2
- 238000007417 hierarchical cluster analysis Methods 0.000 description 2
- 208000027706 hormone receptor-positive breast cancer Diseases 0.000 description 2
- 230000000977 initiatory effect Effects 0.000 description 2
- 206010073096 invasive lobular breast carcinoma Diseases 0.000 description 2
- 238000002372 labelling Methods 0.000 description 2
- 210000002751 lymph Anatomy 0.000 description 2
- 239000000463 material Substances 0.000 description 2
- 238000013178 mathematical model Methods 0.000 description 2
- 239000000203 mixture Substances 0.000 description 2
- 238000012986 modification Methods 0.000 description 2
- 230000004048 modification Effects 0.000 description 2
- 238000000491 multivariate analysis Methods 0.000 description 2
- 210000002445 nipple Anatomy 0.000 description 2
- 239000002773 nucleotide Substances 0.000 description 2
- 125000003729 nucleotide group Chemical group 0.000 description 2
- 210000004940 nucleus Anatomy 0.000 description 2
- 238000003909 pattern recognition Methods 0.000 description 2
- 102000004169 proteins and genes Human genes 0.000 description 2
- 230000010076 replication Effects 0.000 description 2
- 238000011160 research Methods 0.000 description 2
- 230000004043 responsiveness Effects 0.000 description 2
- 210000003296 saliva Anatomy 0.000 description 2
- 238000012216 screening Methods 0.000 description 2
- 238000010186 staining Methods 0.000 description 2
- 238000007619 statistical method Methods 0.000 description 2
- 230000009897 systematic effect Effects 0.000 description 2
- 238000004448 titration Methods 0.000 description 2
- 238000011269 treatment regimen Methods 0.000 description 2
- 210000004881 tumor cell Anatomy 0.000 description 2
- 210000002700 urine Anatomy 0.000 description 2
- 102000040650 (ribonucleotides)n+m Human genes 0.000 description 1
- 101150084750 1 gene Proteins 0.000 description 1
- HSTOKWSFWGCZMH-UHFFFAOYSA-N 3,3'-diaminobenzidine Chemical compound C1=C(N)C(N)=CC=C1C1=CC=C(N)C(N)=C1 HSTOKWSFWGCZMH-UHFFFAOYSA-N 0.000 description 1
- TVZRAEYQIKYCPH-UHFFFAOYSA-N 3-(trimethylsilyl)propane-1-sulfonic acid Chemical compound C[Si](C)(C)CCCS(O)(=O)=O TVZRAEYQIKYCPH-UHFFFAOYSA-N 0.000 description 1
- FWBHETKCLVMNFS-UHFFFAOYSA-N 4',6-Diamino-2-phenylindol Chemical compound C1=CC(C(=N)N)=CC=C1C1=CC2=CC=C(C(N)=N)C=C2N1 FWBHETKCLVMNFS-UHFFFAOYSA-N 0.000 description 1
- 238000012935 Averaging Methods 0.000 description 1
- 102100027161 BRCA2-interacting transcriptional repressor EMSY Human genes 0.000 description 1
- 102100021663 Baculoviral IAP repeat-containing protein 5 Human genes 0.000 description 1
- 101100314454 Caenorhabditis elegans tra-1 gene Proteins 0.000 description 1
- 201000009030 Carcinoma Diseases 0.000 description 1
- CMSMOCZEIVJLDB-UHFFFAOYSA-N Cyclophosphamide Chemical compound ClCCN(CCCl)P1(=O)NCCCO1 CMSMOCZEIVJLDB-UHFFFAOYSA-N 0.000 description 1
- 238000000018 DNA microarray Methods 0.000 description 1
- 102000016928 DNA-directed DNA polymerase Human genes 0.000 description 1
- 108010014303 DNA-directed DNA polymerase Proteins 0.000 description 1
- 206010061819 Disease recurrence Diseases 0.000 description 1
- 238000002965 ELISA Methods 0.000 description 1
- 238000012413 Fluorescence activated cell sorting analysis Methods 0.000 description 1
- GHASVSINZRGABV-UHFFFAOYSA-N Fluorouracil Chemical compound FC1=CNC(=O)NC1=O GHASVSINZRGABV-UHFFFAOYSA-N 0.000 description 1
- 102100032340 G2/mitotic-specific cyclin-B1 Human genes 0.000 description 1
- 101001057996 Homo sapiens BRCA2-interacting transcriptional repressor EMSY Proteins 0.000 description 1
- 101000868643 Homo sapiens G2/mitotic-specific cyclin-B1 Proteins 0.000 description 1
- 101000593405 Homo sapiens Myb-related protein B Proteins 0.000 description 1
- FBOZXECLQNJBKD-ZDUSSCGKSA-N L-methotrexate Chemical compound C=1N=C2N=C(N)N=C(N)C2=NC=1CN(C)C1=CC=C(C(=O)N[C@@H](CCC(O)=O)C(O)=O)C=C1 FBOZXECLQNJBKD-ZDUSSCGKSA-N 0.000 description 1
- 206010073099 Lobular breast carcinoma in situ Diseases 0.000 description 1
- 102100034670 Myb-related protein B Human genes 0.000 description 1
- 239000000020 Nitrocellulose Substances 0.000 description 1
- 238000000636 Northern blotting Methods 0.000 description 1
- 208000035327 Oestrogen receptor positive breast cancer Diseases 0.000 description 1
- 108020005187 Oligonucleotide Probes Proteins 0.000 description 1
- 108700020796 Oncogene Proteins 0.000 description 1
- 108091005804 Peptidases Proteins 0.000 description 1
- 206010034960 Photophobia Diseases 0.000 description 1
- 239000004365 Protease Substances 0.000 description 1
- 108010066717 Q beta Replicase Proteins 0.000 description 1
- 238000011529 RT qPCR Methods 0.000 description 1
- 101001122448 Rattus norvegicus Nociceptin receptor Proteins 0.000 description 1
- 102100037486 Reverse transcriptase/ribonuclease H Human genes 0.000 description 1
- 102000006382 Ribonucleases Human genes 0.000 description 1
- 108010083644 Ribonucleases Proteins 0.000 description 1
- 206010039491 Sarcoma Diseases 0.000 description 1
- 108010002687 Survivin Proteins 0.000 description 1
- 229940123237 Taxane Drugs 0.000 description 1
- 206010057040 Temperature intolerance Diseases 0.000 description 1
- 239000007983 Tris buffer Substances 0.000 description 1
- JLCPHMBAVCMARE-UHFFFAOYSA-N [3-[[3-[[3-[[3-[[3-[[3-[[3-[[3-[[3-[[3-[[3-[[5-(2-amino-6-oxo-1H-purin-9-yl)-3-[[3-[[3-[[3-[[3-[[3-[[5-(2-amino-6-oxo-1H-purin-9-yl)-3-[[5-(2-amino-6-oxo-1H-purin-9-yl)-3-hydroxyoxolan-2-yl]methoxy-hydroxyphosphoryl]oxyoxolan-2-yl]methoxy-hydroxyphosphoryl]oxy-5-(5-methyl-2,4-dioxopyrimidin-1-yl)oxolan-2-yl]methoxy-hydroxyphosphoryl]oxy-5-(6-aminopurin-9-yl)oxolan-2-yl]methoxy-hydroxyphosphoryl]oxy-5-(6-aminopurin-9-yl)oxolan-2-yl]methoxy-hydroxyphosphoryl]oxy-5-(6-aminopurin-9-yl)oxolan-2-yl]methoxy-hydroxyphosphoryl]oxy-5-(6-aminopurin-9-yl)oxolan-2-yl]methoxy-hydroxyphosphoryl]oxyoxolan-2-yl]methoxy-hydroxyphosphoryl]oxy-5-(5-methyl-2,4-dioxopyrimidin-1-yl)oxolan-2-yl]methoxy-hydroxyphosphoryl]oxy-5-(4-amino-2-oxopyrimidin-1-yl)oxolan-2-yl]methoxy-hydroxyphosphoryl]oxy-5-(5-methyl-2,4-dioxopyrimidin-1-yl)oxolan-2-yl]methoxy-hydroxyphosphoryl]oxy-5-(5-methyl-2,4-dioxopyrimidin-1-yl)oxolan-2-yl]methoxy-hydroxyphosphoryl]oxy-5-(6-aminopurin-9-yl)oxolan-2-yl]methoxy-hydroxyphosphoryl]oxy-5-(6-aminopurin-9-yl)oxolan-2-yl]methoxy-hydroxyphosphoryl]oxy-5-(4-amino-2-oxopyrimidin-1-yl)oxolan-2-yl]methoxy-hydroxyphosphoryl]oxy-5-(4-amino-2-oxopyrimidin-1-yl)oxolan-2-yl]methoxy-hydroxyphosphoryl]oxy-5-(4-amino-2-oxopyrimidin-1-yl)oxolan-2-yl]methoxy-hydroxyphosphoryl]oxy-5-(6-aminopurin-9-yl)oxolan-2-yl]methoxy-hydroxyphosphoryl]oxy-5-(4-amino-2-oxopyrimidin-1-yl)oxolan-2-yl]methyl [5-(6-aminopurin-9-yl)-2-(hydroxymethyl)oxolan-3-yl] hydrogen phosphate Polymers Cc1cn(C2CC(OP(O)(=O)OCC3OC(CC3OP(O)(=O)OCC3OC(CC3O)n3cnc4c3nc(N)[nH]c4=O)n3cnc4c3nc(N)[nH]c4=O)C(COP(O)(=O)OC3CC(OC3COP(O)(=O)OC3CC(OC3COP(O)(=O)OC3CC(OC3COP(O)(=O)OC3CC(OC3COP(O)(=O)OC3CC(OC3COP(O)(=O)OC3CC(OC3COP(O)(=O)OC3CC(OC3COP(O)(=O)OC3CC(OC3COP(O)(=O)OC3CC(OC3COP(O)(=O)OC3CC(OC3COP(O)(=O)OC3CC(OC3COP(O)(=O)OC3CC(OC3COP(O)(=O)OC3CC(OC3COP(O)(=O)OC3CC(OC3COP(O)(=O)OC3CC(OC3COP(O)(=O)OC3CC(OC3COP(O)(=O)OC3CC(OC3CO)n3cnc4c(N)ncnc34)n3ccc(N)nc3=O)n3cnc4c(N)ncnc34)n3ccc(N)nc3=O)n3ccc(N)nc3=O)n3ccc(N)nc3=O)n3cnc4c(N)ncnc34)n3cnc4c(N)ncnc34)n3cc(C)c(=O)[nH]c3=O)n3cc(C)c(=O)[nH]c3=O)n3ccc(N)nc3=O)n3cc(C)c(=O)[nH]c3=O)n3cnc4c3nc(N)[nH]c4=O)n3cnc4c(N)ncnc34)n3cnc4c(N)ncnc34)n3cnc4c(N)ncnc34)n3cnc4c(N)ncnc34)O2)c(=O)[nH]c1=O JLCPHMBAVCMARE-UHFFFAOYSA-N 0.000 description 1
- 208000009956 adenocarcinoma Diseases 0.000 description 1
- 239000002671 adjuvant Substances 0.000 description 1
- 238000009260 adjuvant endocrine therapy Methods 0.000 description 1
- 238000009098 adjuvant therapy Methods 0.000 description 1
- 238000001261 affinity purification Methods 0.000 description 1
- 239000011543 agarose gel Substances 0.000 description 1
- 229960002932 anastrozole Drugs 0.000 description 1
- YBBLVLTVTVSKRW-UHFFFAOYSA-N anastrozole Chemical compound N#CC(C)(C)C1=CC(C(C)(C#N)C)=CC(CN2N=CN=C2)=C1 YBBLVLTVTVSKRW-UHFFFAOYSA-N 0.000 description 1
- 229940045799 anthracyclines and related substance Drugs 0.000 description 1
- 230000003466 anti-cipated effect Effects 0.000 description 1
- 239000003886 aromatase inhibitor Substances 0.000 description 1
- 229940046844 aromatase inhibitors Drugs 0.000 description 1
- 208000010572 basal-like breast carcinoma Diseases 0.000 description 1
- 230000015572 biosynthetic process Effects 0.000 description 1
- 210000003103 bodily secretion Anatomy 0.000 description 1
- AIYUHDOJVYHVIT-UHFFFAOYSA-M caesium chloride Chemical compound [Cl-].[Cs+] AIYUHDOJVYHVIT-UHFFFAOYSA-M 0.000 description 1
- 210000002230 centromere Anatomy 0.000 description 1
- 239000007795 chemical reaction product Substances 0.000 description 1
- 239000003795 chemical substances by application Substances 0.000 description 1
- 239000002299 complementary DNA Substances 0.000 description 1
- 230000001276 controlling effect Effects 0.000 description 1
- 230000002596 correlated effect Effects 0.000 description 1
- 238000002790 cross-validation Methods 0.000 description 1
- 229960004397 cyclophosphamide Drugs 0.000 description 1
- 238000007405 data analysis Methods 0.000 description 1
- 238000013479 data entry Methods 0.000 description 1
- 238000000432 density-gradient centrifugation Methods 0.000 description 1
- 230000001419 dependent effect Effects 0.000 description 1
- 230000004069 differentiation Effects 0.000 description 1
- 229940079593 drug Drugs 0.000 description 1
- 239000003814 drug Substances 0.000 description 1
- 230000009977 dual effect Effects 0.000 description 1
- 208000028715 ductal breast carcinoma in situ Diseases 0.000 description 1
- 238000006911 enzymatic reaction Methods 0.000 description 1
- 208000037828 epithelial carcinoma Diseases 0.000 description 1
- 238000007387 excisional biopsy Methods 0.000 description 1
- 230000007717 exclusion Effects 0.000 description 1
- 230000001747 exhibiting effect Effects 0.000 description 1
- 238000002474 experimental method Methods 0.000 description 1
- 239000000834 fixative Substances 0.000 description 1
- 229960002949 fluorouracil Drugs 0.000 description 1
- 238000003500 gene array Methods 0.000 description 1
- 238000003633 gene expression assay Methods 0.000 description 1
- 238000011223 gene expression profiling Methods 0.000 description 1
- 238000007429 general method Methods 0.000 description 1
- 230000002068 genetic effect Effects 0.000 description 1
- 238000009499 grossing Methods 0.000 description 1
- 238000010438 heat treatment Methods 0.000 description 1
- 230000002962 histologic effect Effects 0.000 description 1
- 210000005260 human cell Anatomy 0.000 description 1
- 238000012308 immunohistochemistry method Methods 0.000 description 1
- 230000006872 improvement Effects 0.000 description 1
- 238000011534 incubation Methods 0.000 description 1
- 238000007834 ligase chain reaction Methods 0.000 description 1
- 239000007788 liquid Substances 0.000 description 1
- 238000002595 magnetic resonance imaging Methods 0.000 description 1
- 230000036210 malignancy Effects 0.000 description 1
- 230000003211 malignant effect Effects 0.000 description 1
- 238000009607 mammography Methods 0.000 description 1
- 239000012528 membrane Substances 0.000 description 1
- 229960000485 methotrexate Drugs 0.000 description 1
- 238000001531 micro-dissection Methods 0.000 description 1
- 238000002156 mixing Methods 0.000 description 1
- 238000012544 monitoring process Methods 0.000 description 1
- 239000000178 monomer Substances 0.000 description 1
- 201000010879 mucinous adenocarcinoma Diseases 0.000 description 1
- 238000013188 needle biopsy Methods 0.000 description 1
- 229920001220 nitrocellulos Polymers 0.000 description 1
- 230000009871 nonspecific binding Effects 0.000 description 1
- 238000002966 oligonucleotide array Methods 0.000 description 1
- 239000002751 oligonucleotide probe Substances 0.000 description 1
- 230000003287 optical effect Effects 0.000 description 1
- 230000002611 ovarian Effects 0.000 description 1
- 230000001575 pathological effect Effects 0.000 description 1
- 238000012567 pattern recognition method Methods 0.000 description 1
- 210000002381 plasma Anatomy 0.000 description 1
- 239000013612 plasmid Substances 0.000 description 1
- 238000002600 positron emission tomography Methods 0.000 description 1
- 238000002360 preparation method Methods 0.000 description 1
- 108090000765 processed proteins & peptides Proteins 0.000 description 1
- 238000013442 quality metrics Methods 0.000 description 1
- 238000011002 quantification Methods 0.000 description 1
- 238000011084 recovery Methods 0.000 description 1
- 230000002441 reversible effect Effects 0.000 description 1
- 238000005096 rolling process Methods 0.000 description 1
- 238000007790 scraping Methods 0.000 description 1
- 238000012163 sequencing technique Methods 0.000 description 1
- 210000002966 serum Anatomy 0.000 description 1
- NLJMYIDDQXHKNR-UHFFFAOYSA-K sodium citrate Chemical compound O.O.[Na+].[Na+].[Na+].[O-]C(=O)CC(O)(CC([O-])=O)C([O-])=O NLJMYIDDQXHKNR-UHFFFAOYSA-K 0.000 description 1
- 239000001509 sodium citrate Substances 0.000 description 1
- 239000012192 staining solution Substances 0.000 description 1
- 239000007858 starting material Substances 0.000 description 1
- 238000013179 statistical model Methods 0.000 description 1
- 210000001562 sternum Anatomy 0.000 description 1
- 230000000153 supplemental effect Effects 0.000 description 1
- 238000001356 surgical procedure Methods 0.000 description 1
- 230000002459 sustained effect Effects 0.000 description 1
- 208000024891 symptom Diseases 0.000 description 1
- 238000001308 synthesis method Methods 0.000 description 1
- 238000003786 synthesis reaction Methods 0.000 description 1
- DKPFODGZWDEEBT-QFIAKTPHSA-N taxane Chemical class C([C@]1(C)CCC[C@@H](C)[C@H]1C1)C[C@H]2[C@H](C)CC[C@@H]1C2(C)C DKPFODGZWDEEBT-QFIAKTPHSA-N 0.000 description 1
- 230000001225 therapeutic effect Effects 0.000 description 1
- 210000000779 thoracic wall Anatomy 0.000 description 1
- 230000002103 transcriptional effect Effects 0.000 description 1
- 230000009466 transformation Effects 0.000 description 1
- 238000000844 transformation Methods 0.000 description 1
- LENZDBCJOHFCAS-UHFFFAOYSA-N tris Chemical compound OCC(N)(CO)CO LENZDBCJOHFCAS-UHFFFAOYSA-N 0.000 description 1
- 238000001262 western blot Methods 0.000 description 1
Images


Classifications
-
- C—CHEMISTRY; METALLURGY
- C12—BIOCHEMISTRY; BEER; SPIRITS; WINE; VINEGAR; MICROBIOLOGY; ENZYMOLOGY; MUTATION OR GENETIC ENGINEERING
- C12Q—MEASURING OR TESTING PROCESSES INVOLVING ENZYMES, NUCLEIC ACIDS OR MICROORGANISMS; COMPOSITIONS OR TEST PAPERS THEREFOR; PROCESSES OF PREPARING SUCH COMPOSITIONS; CONDITION-RESPONSIVE CONTROL IN MICROBIOLOGICAL OR ENZYMOLOGICAL PROCESSES
- C12Q1/00—Measuring or testing processes involving enzymes, nucleic acids or microorganisms; Compositions therefor; Processes of preparing such compositions
- C12Q1/68—Measuring or testing processes involving enzymes, nucleic acids or microorganisms; Compositions therefor; Processes of preparing such compositions involving nucleic acids
- C12Q1/6876—Nucleic acid products used in the analysis of nucleic acids, e.g. primers or probes
- C12Q1/6883—Nucleic acid products used in the analysis of nucleic acids, e.g. primers or probes for diseases caused by alterations of genetic material
- C12Q1/6886—Nucleic acid products used in the analysis of nucleic acids, e.g. primers or probes for diseases caused by alterations of genetic material for cancer
-
- C—CHEMISTRY; METALLURGY
- C12—BIOCHEMISTRY; BEER; SPIRITS; WINE; VINEGAR; MICROBIOLOGY; ENZYMOLOGY; MUTATION OR GENETIC ENGINEERING
- C12Q—MEASURING OR TESTING PROCESSES INVOLVING ENZYMES, NUCLEIC ACIDS OR MICROORGANISMS; COMPOSITIONS OR TEST PAPERS THEREFOR; PROCESSES OF PREPARING SUCH COMPOSITIONS; CONDITION-RESPONSIVE CONTROL IN MICROBIOLOGICAL OR ENZYMOLOGICAL PROCESSES
- C12Q2600/00—Oligonucleotides characterized by their use
- C12Q2600/118—Prognosis of disease development
-
- C—CHEMISTRY; METALLURGY
- C12—BIOCHEMISTRY; BEER; SPIRITS; WINE; VINEGAR; MICROBIOLOGY; ENZYMOLOGY; MUTATION OR GENETIC ENGINEERING
- C12Q—MEASURING OR TESTING PROCESSES INVOLVING ENZYMES, NUCLEIC ACIDS OR MICROORGANISMS; COMPOSITIONS OR TEST PAPERS THEREFOR; PROCESSES OF PREPARING SUCH COMPOSITIONS; CONDITION-RESPONSIVE CONTROL IN MICROBIOLOGICAL OR ENZYMOLOGICAL PROCESSES
- C12Q2600/00—Oligonucleotides characterized by their use
- C12Q2600/158—Expression markers
Definitions
- This disclosure relates generally to the field of cancer biology, and specifically, to the fields of detection and identification of specific cancer cell phenotypes and correlation with appropriate therapies.
- WO2009/158143 and Parker Joel S et al. "Supervised risk predictor of breast cancer based on intrinsic subtypes", J. of Clinincal Oncology, Americal Soc. of Clinical Oncology, 27: 8, pp. 1160-1167, 10 March 2019 describe methods for classifying and for evaluating the prognosis of a subject having breast cancer.
- the prediction model is based on a the gene expression profile of a specific set of genes.
- EP1641810 A2 provides gene sets, the expression of which is important in the diagnosis and/or prognosis of cancer, in particular of breast cancer.
- "Affymetrix Genechip Human Genome U133 Array Set HG-U133A” GEO provides probes for all the coding genes of the human cell on a microarray.
- the method of the present invention can include determining at least one of, a combination of, or each of, the following: tumor grade, tumor ploidy, estrogen receptor expression, progesterone receptor expression, and HER2/ERBB2 expression.
- the risk may be breast cancer specific survival, event-free survival, or response to therapy.
- RNA expression of the members of the NANO46 intrinsic gene list may be determined using the nanoreporter code system (nCounter® Analysis system).
- the method may utilise a sampling of cells or tissues.
- the sample can be a tumor.
- the tissue can be obtained from a biopsy.
- the sample can be a sampling of bodily fluids.
- the bodily fluid can be blood, lymph, urine, saliva or nipple aspirate.
- the disclosure presents a method of predicting outcome in a subject having breast cancer comprising: providing a tumor sample from the subject; determining the expression of the genes in the NANO46 intrinsic gene list of Table 1 in the tumor sample; determining the intrinsic subtype of the tumor sample based on the expression of the genes in the NANO46 intrinsic gene list, wherein the intrinsic subtype consists of at least Basal-like, Luminal A, Luminal B or HER2-enriched; determining a proliferation score based on the expression of a subset of proliferation genes in the NANO46 intrinsic gene list; determining the size of the tumor, calculating a risk of recurrence score using a weighted sum of said intrinsic subtype, proliferation score and tumor size; and determining whether the subject has a low or high risk of recurrence based on the recurrence score.
- a low score indicates a more favorable outcome and high score indicates a less favorable outcome.
- Intrinsic genes are statistically selected to have low variation in expression between biological sample replicates from the same individual and high variation in expression across samples from different individuals. Thus, intrinsic genes are used as classifier genes for breast cancer classification. Although clinical information was not used to derive the breast cancer intrinsic subtypes, this classification has proved to have prognostic significance. Intrinsic gene screening can be used to classify breast cancers into five molecular distinct intrinsic subtypes, Luminal A (LumA), Luminal B (LumB), HER2-enriched (Her-2-E), Basal-like, and Normal-like ( Perou et al. Nature, 406(6797):747-52 (2000 ); Sorlie et al. PNAS, 98(19):10869-74 (2001 )).
- a NANO46 gene expression assay can identify intrinsic subtype from a biological sample, e.g., a standard formalin fixed paraffin embedded tumor tissue.
- the methods utilize a supervised algorithm to classify subject samples according to breast cancer intrinsic subtype.
- This algorithm referred to herein as the NANO46 classification model, is based on the gene expression profile of a defined subset of intrinsic genes that has been identified herein as superior for classifying breast cancer intrinsic subtypes.
- the subset of genes, along with primers target-specific sequences utilized for their detection, is provided in Table 1.
- Table 1A provides the sequences of target specific probe sequences for detecting each gene utilized in Table 1. The sequences provided in Table 1A are merely representative.
- Table 1 GENE REPRESENTATIVE GENBANK ACCESSION NUMBER FORWARD PRIMER SEQ ID NO: REVERSE PRIMER SEQ ID NO: ACTR3B NM_020445 1 47 NM_001040135 ANLN NM_018685 2 48 BAG1 NM_004323 3 49 BCL2 NM_000633 4 50 BLVRA BX647539 5 51 CCNE1 BC035498 6 52 CDC20 BG256659 7 53 CDC6 NM_001254 8 54 CDCA1 NM_031423 9 55 CDH3 BC041846 10 56 CENPF NM_016343 11 57 CEP55 AB091343 12 58 CXXC5 BC006428 13 59 EGFR NM_005228 14 60 ERBB2 NM_001005862 15 61 ESR1 NM_001122742 16
- Probes for detecting NANO46 genes Gene Name RefSeq Accession Target Sequence SEQ ID NO: ACTR3B NM_001040135.1 140 ANLN NM_018685.2 141 BAG1 NM_004323.3 142 BCL2 NM_000633.2 143 BLVRA NM_000712.3 144 CCNE1 NM_001238.1 145 CDC20 NM_001255.1 146 CDC6 NM_001254.3 147 CDCA1 NM_145697.1 148 CDH3 NM_001793.3 149 CENPF NM_016343.3 150 CEP55 NM_018131.3 151 CXXC5 NM_016463.5 152 EGFR NM_005228.3 153 ERBB2 NM_004448.2 154 ESR1 NM_000125.2 155 EXO1 NM_006027.3 156 FGFR4 NM_002011.3 157 FOXA1 NM_004496.2
- Table 2 provides select sequences for the NANO46 genes of Table 1.
- Table 2 GENBANK ACCESSION NUMBER SEQUENCE SEQ ID NO: NM_020445 93 NM_001040135 94 NM_018685 95 NM_004323 96 NM_000633 97 BX647539 98 BC035498 99 BG256659 100 NM_001254 101 NM_031423 102 BC041846 103 NM_016343 104 AB091343 105 BC006428 106 NM_005228 107 NM_001005862 108 NM_001122742 109 NM_130398 110 AB209631 111 NM_004496 112 NM_001453 113 AJ249248 114 NM_014176 115 NM_006845 116 NM_006101 117 BC042437 118 AK095281 119 M21389 120 NM_001123066 121 M92
- At least 40, at least 41, at least 42, at least 43, at least 44, at least 46 or all 46 of the genes in Table 1 can be utilized in the methods of the disclosure.
- the expression of each of the 46 genes is determined in a biological sample.
- the prototypical gene expression profiles (i.e . centroid) of the four intrinsic subtypes were pre-defined from a training set of FFPE breast tumor samples using hierarchical clustering analysis of gene expression data.
- a heatmap of the prototypical gene expression profiles (i.e . centroids) of these four subtypes is shown in Figure 1 , where the level of expression is illustrated by the heatmap. Table 3 shows the actual values. Table 3.
- a computational algorithm based on a Pearson's correlation compares the normalized and scaled gene expression profile of the NANO46 intrinsic gene set of the test sample to the prototypical expression signatures of the four breast cancer intrinsic subtypes.
- the intrinsic subtype analysis is determined by determining the expression of a NANO50 set of genes (which is determining the expression of the NANO46 set of genes and further includes determining the expression of MYBL2, BIRC5, GRB7 and CCNB1) and the risk of recurrence (“ROR”) is determined using the NANO46 set of genes).
- the intrinsic subtype is identified by comparing the expression of the NANO50 set of genes in the biological sample with the expected expression profiles for the four intrinsic subtypes.
- the subtype with the most similar expression profile is assigned to the biological sample.
- the ROR score is an integer value on a 0-100 scale that is related to an individual patient's probability of distant recurrence within 10 years for the defined intended use population.
- the ROR score is calculated by comparing the expression profiles of the NANO46 genes in the biological sample with the expected profiles for the four intrinsic subtypes, as described above, to calculate four different correlation values. These correlation values are then combined with a proliferation score (and optionally one or more clinicopathological variables, such as tumor size) to calculate the ROR score.
- the ROR score is calculated by comparing only the expression profiles of the NANO46 genes.
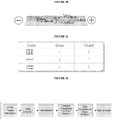
- Figure 6 provides a schematic of the specific algorithm transformations.
- the tumor sample is assigned the subtype with the largest positive correlation to the sample.
- Kaplan Meier survival curves generated from a training set of untreated breast cancer patients demonstrate that the intrinsic subtypes are a prognostic indicator of recurrence free survival (RFS) in this test population, which includes both estrogen receptor positive/negative and HER2 positive/negative patients, Figure 2 .
- RFS recurrence free survival
- Luminal A patients Independent testing on a cohort of node negative, estrogen receptor positive patients treated with tamoxifen shows predominantly Luminal A and B subtype patients with Luminal A patients exhibiting better outcome than Luminal B patients, Figure 3 .
- the outcome of Luminal A patients is expected to improve even further using clinical trial specimens that use more modern treatment regimens ( i.e . aromatase inhibitors) and have better adherence to therapy which will improve outcome
- ROR Risk of Recurrence
- the score is calculated using coefficients from a Cox model that includes correlation to each intrinsic subtype, a proliferation score (mean gene expression of a subset of 18 of the 46 genes), and tumor size, Table 4.
- Table 4. Coefficients to calculate ROR-PT (equation 1) Test Variables Coefficient Basal-like Pearson's correlation (A) - 0.0067 Her2-enriched Pearson's correlation (B) 0.4317 Luminal A Pearson's correlation (C) - 0.3172 Luminal B Pearson's correlation (D) 0.4894 Proliferation Score (E) 0.1981 Tumor Size (F) 0.1133
- ROR-PT a risk score
- the ROR score provided a continuous estimate of the risk of recurrence for ER-positive, node-negative patients who were treated with tamoxifen for 5 years ( Nielsen et al. Clin. Cancer Res., 16(21):5222-5232 (2009 )). This result was verified on ER-positive, node-negative patients from the same cohort, Figure 4 .
- the ROR score also exhibited a statistically significant improvement over a clinical model based in determining RFS within this test population providing further evidence of the improved accuracy of this decision making tool when compared to traditional clinicopathological measures ( Nielsen et al. Clin. Cancer Res., 16(21):5222-5232 (2009 )).
- the gene set contains many genes that are known markers for proliferation.
- the methods disclosed herein provide for the determination of subsets of genes that provide a proliferation signature.
- the methods can include determining the expression of at least one of, a combination of, or each of, a 18-gene subset of the NANO46 intrinsic genes selected from ANLN, CCNE1, CDC20, CDC6, CDCA1, CENPF, CEP55, EXOl, KIF2C, KNTC2, MELK, MKI67, ORC6L, PTTG1, RRM2, TYMS, UBE2C and/or UBE2T.
- the expression of each of the 18-gene subset of the NANO46 gene set is determined to provide a proliferation score.
- the expression of one or more of these genes may be determined and a proliferation signature index can be generated by averaging the normalized expression estimates of one or more of these genes in a sample.
- the sample can be assigned a high proliferation signature, a moderate/intermediate proliferation signature, a low proliferation signature or an ultra-low proliferation signature.
- Methods of determining a proliferation signature from a biological sample are as described in Nielsen et al. Clin. Cancer Res., 16(21):5222-5232 (2009 ) and supplemental online material.
- Luminal subtypes The most common subtypes of breast cancer are the luminal subtypes, Luminal A and Luminal B. Prior studies suggest that luminal A comprises approximately 30% to 40% and luminal B approximately 20% of all breast cancers, but they represent over 90 % of hormone receptor positive breast cancers ( Nielsen et al. Clin. Cancer Res., 16(21):5222-5232 (2009 )). The gene expression pattern of these subtypes resembles the luminal epithelial component of the breast.
- ER estrogen receptor
- PR progesterone receptor
- LIV1 LIV1, GATA3, and cyclin D1
- luminal cytokeratins 8 and 18 Lisa Carey & Charles Perou (2009). Gene Arrays, Prognosis, and Therapeutic Interventions. Jay R. Harris et al. (4th ed.), Diseases of the breast (pp. 458-472). Philadelphia, PA: Lippincott Williams & Wilkins ).
- HER2-enriched The HER2-enriched subtype is generally ER-negative and is HER2-positive in the majority of cases with high expression of the ERBB2 cluster, including ERBB2 and GRB7. Genes associated with cell cycle activation are highly expressed and these tumors have a poor outcome.
- Basal-like The Basal-like subtype is generally ER-negative, is almost always clinically HER2-negative and expresses a suite of "basal” biomarkers including the basal epithelial cytokeratins (CK) and epidermal growth factor receptor (EGFR). Genes associated with cell cycle activation are highly expressed.
- CK basal epithelial cytokeratins
- EGFR epidermal growth factor receptor
- the NANO46 classification model described herein may be further combined with information on clinical variables to generate a continuous risk of recurrence (ROR) predictor.
- ROR risk of recurrence
- a number of clinical and prognostic breast cancer factors are known in the art and are used to predict treatment outcome and the likelihood of disease recurrence. Such factors include, for example, lymph node involvement, tumor size, histologic grade, estrogen and progesterone hormone receptor status, HER-2 levels, and tumor ploidy.
- risk of recurrence (ROR) score is provided for a subject diagnosed with or suspected of having breast cancer. This score uses the NANO46 classification model in combination with clinical factors of lymph node status (N) and tumor size (T).
- Lymph node status is classified as N0-N3 (NO: regional lymph nodes are free of metastasis; N1 : metastasis to movable, same-side axillary lymph node(s); N2: metastasis to same-side lymph node(s) fixed to one another or to other structures; N3: metastasis to same-side lymph nodes beneath the breastbone).
- Methods of identifying breast cancer patients and staging the disease are well known and may include manual examination, biopsy, review of patient's and/or family history, and imaging techniques, such as mammography, magnetic resonance imaging (MRI), and positron emission tomography (PET).
- MRI magnetic resonance imaging
- PET positron emission tomography
- breast cancer subtype is assessed through the evaluation of expression patterns, or profiles, of the intrinsic genes listed in Table 1 in one or more subject samples.
- subject, or subject sample refers to an individual regardless of health and/or disease status.
- a subject can be a subject, a study participant, a control subject, a screening subject, or any other class of individual from whom a sample is obtained and assessed in the context of the disclosure.
- a subject can be diagnosed with breast cancer, can present with one or more symptoms of breast cancer, or a predisposing factor, such as a family (genetic) or medical history (medical) factor, for breast cancer, can be undergoing treatment or therapy for breast cancer, or the like.
- a subject can be healthy with respect to any of the aforementioned factors or criteria.
- the term “healthy” as used herein is relative to breast cancer status, as the term “healthy” cannot be defined to correspond to any absolute evaluation or status.
- an individual defined as healthy with reference to any specified disease or disease criterion can in fact be diagnosed with any other one or more diseases, or exhibit any other one or more disease criterion, including one or more cancers other than breast cancer.
- the healthy controls are preferably free of any cancer.
- the methods for predicting breast cancer intrinsic subtypes include collecting a biological sample comprising a cancer cell or tissue, such as a breast tissue sample or a primary breast tumor tissue sample.
- biological sample any sampling of cells, tissues, or bodily fluids in which expression of an intrinsic gene can be detected. Examples of such biological samples include, but are not limited to, biopsies and smears.
- Bodily fluids useful in the present disclosure include blood, lymph, urine, saliva, nipple aspirates, gynecological fluids, or any other bodily secretion or derivative thereof. Blood can include whole blood, plasma, serum, or any derivative of blood.
- the biological sample includes breast cells, particularly breast tissue from a biopsy, such as a breast tumor tissue sample.
- Biological samples may be obtained from a subject by a variety of techniques including, for example, by scraping or swabbing an area, by using a needle to aspirate cells or bodily fluids, or by removing a tissue sample ( i.e., biopsy). Methods for collecting various biological samples are well known in the art.
- a breast tissue sample is obtained by, for example, fine needle aspiration biopsy, core needle biopsy, or excisional biopsy. Fixative and staining solutions may be applied to the cells or tissues for preserving the specimen and for facilitating examination.
- Biological samples may be transferred to a glass slide for viewing under magnification.
- the biological sample is a formalin-fixed, paraffin-embedded breast tissue sample, particularly a primary breast tumor sample.
- the tissue sample is obtained from a pathologist-guided tissue core sample.
- the present disclosure provides methods for classifying, prognosticating, or monitoring breast cancer in subjects.
- data obtained from analysis of intrinsic gene expression is evaluated using one or more pattern recognition algorithms.
- Such analysis methods may be used to form a predictive model, which can be used to classify test data.
- one convenient and particularly effective method of classification employs multivariate statistical analysis modeling, first to form a model (a "predictive mathematical model") using data (“modeling data") from samples of known subtype (e.g., from subjects known to have a particular breast cancer intrinsic subtype: LumA, LumB, Basal-like, HER2-enriched, or normal-like), and second to classify an unknown sample (e.g., "test sample”) according to subtype.
- Pattern recognition methods have been used widely to characterize many different types of problems ranging, for example, over linguistics, fingerprinting, chemistry and psychology.
- pattern recognition is the use of multivariate statistics, both parametric and non-parametric, to analyze data, and hence to classify samples and to predict the value of some dependent variable based on a range of observed measurements.
- One set of methods is termed "unsupervised” and these simply reduce data complexity in a rational way and also produce display plots which can be interpreted by the human eye.
- this type of approach may not be suitable for developing a clinical assay that can be used to classify samples derived from subjects independent of the initial sample population used to train the prediction algorithm.
- the other approach is termed "supervised” whereby a training set of samples with known class or outcome is used to produce a mathematical model which is then evaluated with independent validation data sets.
- a "training set” of intrinsic gene expression data is used to construct a statistical model that predicts correctly the "subtype” of each sample.
- This training set is then tested with independent data (referred to as a test or validation set) to determine the robustness of the computer-based model.
- These models are sometimes termed “expert systems,” but may be based on a range of different mathematical procedures.
- Supervised methods can use a data set with reduced dimensionality (for example, the first few principal components), but typically use unreduced data, with all dimensionality.
- the methods allow the quantitative description of the multivariate boundaries that characterize and separate each subtype in terms of its intrinsic gene expression profile. It is also possible to obtain confidence limits on any predictions, for example, a level of probability to be placed on the goodness of fit. The robustness of the predictive models can also be checked using cross-validation, by leaving out selected samples from the analysis.
- the NANO46 classification model described herein is based on the gene expression profile for a plurality of subject samples using the intrinsic genes listed in Table 1.
- the plurality of samples includes a sufficient number of samples derived from subjects belonging to each subtype class.
- sufficient samples or “representative number” in this context is intended a quantity of samples derived from each subtype that is sufficient for building a classification model that can reliably distinguish each subtype from all others in the group.
- a supervised prediction algorithm is developed based on the profiles of objectively-selected prototype samples for "training" the algorithm. The samples are selected and subtyped using an expanded intrinsic gene set according to the methods disclosed in International Patent Publication WO 2007/061876 and US Patent Publication No. 2009/0299640 .
- the samples can be subtyped according to any known assay for classifying breast cancer subtypes. After stratifying the training samples according to subtype, a centroid-based prediction algorithm is used to construct centroids based on the expression profile of the intrinsic gene set described in Table 1.
- the prediction algorithm is the nearest centroid methodology related to that described in Narashiman and Chu (2002) PNAS 99:6567-6572 .
- the method computes a standardized centroid for each subtype. This centroid is the average gene expression for each gene in each subtype (or "class") divided by the within-class standard deviation for that gene.
- Nearest centroid classification takes the gene expression profile of a new sample, and compares it to each of these class centroids.
- Subtype prediction is done by calculating the Spearman's rank correlation of each test case to the five centroids, and assigning a sample to a subtype based on the nearest centroid.
- detecting expression is intended determining the quantity or presence of an RNA transcript or its expression product of an intrinsic gene.
- Methods for detecting expression of the intrinsic genes of the disclosure include methods based on hybridization analysis of polynucleotides, methods based on sequencing of polynucleotides, immunohistochemistry methods, and proteomics-based methods. The methods generally detect expression products (e.g ., mRNA) of the intrinsic genes listed in Table 1.
- PCR-based methods such as reverse transcription PCR (RT-PCR) ( Weis et al., TIG 8:263- 64, 1992 ), and array-based methods such as microarray ( Schena et al., Science 270:467- 70, 1995 ) are used.
- microarray is intended an ordered arrangement of hybridizable array elements, such as, for example, polynucleotide probes, on a substrate.
- probe refers to any molecule that is capable of selectively binding to a specifically intended target biomolecule, for example, a nucleotide transcript or a protein encoded by or corresponding to an intrinsic gene.
- Probes can be synthesized by one of skill in the art, or derived from appropriate biological preparations. Probes may be specifically designed to be labeled. Examples of molecules that can be utilized as probes include, but are not limited to, RNA, DNA, proteins, antibodies, and organic molecules.
- RNA e.g., mRNA
- RNA can be extracted, for example, from frozen or archived paraffin-embedded and fixed (e.g., formalin-fixed) tissue samples (e.g., pathologist-guided tissue core samples).
- RNA isolation can be performed using a purification kit, a buffer set and protease from commercial manufacturers, such as Qiagen (Valencia, CA), according to the manufacturer's instructions.
- RNA from cells in culture can be isolated using Qiagen RNeasy mini-columns.
- Other commercially available RNA isolation kits include MASTERPURETM Complete DNA and RNA Purification Kit (Epicentre, Madison, Wis.) and Paraffin Block RNA Isolation Kit (Ambion, Austin, TX).
- Total RNA from tissue samples can be isolated, for example, using RNA Stat-60 (Tel-Test, Friendswood, TX).
- Total RNA from FFPE can be isolated, for example, using High Pure FFPE RNA Microkit, Cat No. 04823125001 (Roche Applied Science, Indianapolis, IN).
- RNA prepared from a tumor can be isolated, for example, by cesium chloride density gradient centrifugation.
- large numbers of tissue samples can readily be processed using techniques well known to those of skill in the art, such as, for example, the single-step RNA isolation process of Chomczynski (U.S. Pat. No. 4,843,155 ).
- Isolated RNA can be used in hybridization or amplification assays that include, but are not limited to, PCR analyses and probe arrays.
- One method for the detection of RNA levels involves contacting the isolated RNA with a nucleic acid molecule (probe) that can hybridize to the mRNA encoded by the gene being detected.
- the nucleic acid probe can be, for example, a full-length cDNA, or a portion thereof, such as an oligonucleotide of at least 7, 15, 30, 60, 100, 250, or 500 nucleotides in length and sufficient to specifically hybridize under stringent conditions to an intrinsic gene of the present disclosure, or any derivative DNA or RNA.
- Hybridization of an mRNA with the probe indicates that the intrinsic gene in question is being expressed.
- the mRNA is immobilized on a solid surface and contacted with a probe, for example by running the isolated mRNA on an agarose gel and transferring the mRNA from the gel to a membrane, such as nitrocellulose.
- the probes are immobilized on a solid surface and the mRNA is contacted with the probes, for example, in an Agilent gene chip array.
- Agilent gene chip array A skilled artisan can readily adapt known mRNA detection methods for use in detecting the level of expression of the intrinsic genes of the present disclosure.
- An alternative method for determining the level of intrinsic gene expression product in a sample involves the process of nucleic acid amplification, for example, by RT-PCR ( U.S. Pat. No. 4,683,202 ), ligase chain reaction ( Barany, PNAS USA 88: 189-93, (1991 )), self sustained sequence replication ( Guatelli et al., Proc. Natl. Acad. Sci USA 87: 1874-78, (1990 )), transcriptional amplification system ( Kwoh et al., Proc. Natl. Acad.
- intrinsic gene expression is assessed by quantitative RT-PCR.
- Numerous different PCR or QPCR protocols are known in the art and exemplified herein below and can be directly applied or adapted for use using the presently-described compositions for the detection and/or quantification of the intrinsic genes listed in Table 1.
- a target polynucleotide sequence is amplified by reaction with at least one oligonucleotide primer or pair of oligonucleotide primers.
- the primer(s) hybridize to a complementary region of the target nucleic acid and a DNA polymerase extends the primer(s) to amplify the target sequence.
- a nucleic acid fragment of one size dominates the reaction products (the target polynucleotide sequence which is the amplification product).
- the amplification cycle is repeated to increase the concentration of the single target polynucleotide sequence.
- the reaction can be performed in any thermocycler commonly used for PCR.
- cyclers with real time fluorescence measurement capabilities for example, SMARTCYCLER® (Cepheid, Sunnyvale, CA), ABI PRISM 7700® (Applied Biosystems, Foster City, Calif.), ROTOR- GENETM (Corbett Research, Sydney, Australia), LIGHTCYCLER® (Roche Diagnostics Corp, Indianapolis, Ind.), ICYCLER® (Biorad Laboratories, Hercules, Calif.) and MX4000® (Stratagene, La Jolla, Calif.).
- SMARTCYCLER® Cepheid, Sunnyvale, CA
- ABI PRISM 7700® Applied Biosystems, Foster City, Calif.
- ROTOR- GENETM Corbett Research, Sydney, Australia
- LIGHTCYCLER® Roche Diagnostics Corp, Indianapolis, Ind.
- ICYCLER® Biorad Laboratories, Hercules, Calif.
- MX4000® Stratagene, La Jolla, Calif.
- microarrays are used for expression profiling. Microarrays are particularly well suited for this purpose because of the reproducibility between different experiments. DNA microarrays provide one method for the simultaneous measurement of the expression levels of large numbers of genes. Each array consists of a reproducible pattern of capture probes attached to a solid support. Labeled RNA or DNA is hybridized to complementary probes on the array and then detected by laser scanning. Hybridization intensities for each probe on the array are determined and converted to a quantitative value representing relative gene expression levels. See, for example, U.S. Pat. Nos. 6,040,138 , 5,800,992 and 6,020,135 , 6,033,860 , and 6,344,316 . High-density oligonucleotide arrays are particularly useful for determining the gene expression profile for a large number of RNAs in a sample.
- the nCounter® Analysis system is used to detect intrinsic gene expression.
- the basis of the nCounter® Analysis system is the unique code assigned to each nucleic acid target to be assayed (International Patent Application Publication No. WO 08/124847 , US Patent No. 8,415,102 and Geiss et al. Nature Biotechnology. 2008. 26(3): 317-325 ).
- the code is composed of an ordered series of colored fluorescent spots which create a unique barcode for each target to be assayed.
- a pair of probes is designed for each DNA or RNA target, a biotinylated capture probe and a reporter probe carrying the fluorescent barcode. This system is also referred to, herein, as the nanoreporter code system.
- sequence-specific DNA oligonucleotide probes are attached to code-specific reporter molecules.
- each sequence specific reporter probe comprises a target specifc sequence capable of hybriding to no more than one NANO46 gene of Table 1 and optionally comprises at least two, at least three, or at least four label attachment regions, said attachment regions comprising one or more label monomers that emit light.
- Capture probes are made by ligating a second sequence-specific DNA oligonucleotide for each target to a universal oligonucleotide containing biotin. Reporter and capture probes are all pooled into a single hybridization mixture, the "probe library".
- the probe library comprises a probe pair (a capture probe and reporter) for each of the NANO46 genes in Table 1.
- the relative abundance of each target is measured in a single multiplexed hybridization reaction.
- the method comprises contacting a biological sample with a probe library, the library comprising a probe pair for the NANO46 genes in Table 1, such that the presence of the target in the sample creates a probe pair - target complex.
- the complex is then purified. More specifically, the sample is combined with the probe library, and hybridization occurs in solution. After hybridization, the tripartite hybridized complexes (probe pairs and target) are purified in a two-step procedure using magnetic beads linked to oligonucleotides complementary to universal sequences present on the capture and reporter probes.
- Purified reactions are deposited by the Prep Station into individual flow cells of a sample cartridge, bound to a streptavidin-coated surface via the capture probe, electrophoresed to elongate the reporter probes, and immobilized.
- the sample cartridge is transferred to a fully automated imaging and data collection device (Digital Analyzer, NanoString Technologies).
- the expression level of a target is measured by imaging each sample and counting the number of times the code for that target is detected. Data is output in simple spreadsheet format listing the number of counts per target, per sample.
- nucleic acid probes and nanoreporters can include the rationally designed ( e.g. synthetic sequences) described in International Publication No. WO 2010/019826 and US Patent Publication No. 2010/0047924 .
- Multivariate projection methods such as principal component analysis (PCA) and partial least squares analysis (PLS), are so-called scaling sensitive methods.
- PCA principal component analysis
- PLS partial least squares analysis
- Scaling and weighting may be used to place the data in the correct metric, based on knowledge and experience of the studied system, and therefore reveal patterns already inherently present in the data.
- missing data for example gaps in column values
- such missing data may replaced or "filled” with, for example, the mean value of a column ("mean fill”); a random value (“random fill”); or a value based on a principal component analysis (“principal component fill”).
- Translation of the descriptor coordinate axes can be useful. Examples of such translation include normalization and mean centering. “Normalization” may be used to remove sample-to-sample variation. For microarray data, the process of normalization aims to remove systematic errors by balancing the fluorescence intensities of the two labeling dyes.
- the dye bias can come from various sources including differences in dye labeling efficiencies, heat and light sensitivities, as well as scanner settings for scanning two channels.
- normalization factor Some commonly used methods for calculating normalization factor include: (i) global normalization that uses all genes on the array; (ii) housekeeping genes normalization that uses constantly expressed housekeeping/invariant genes; and (iii) internal controls normalization that uses known amount of exogenous control genes added during hybridization ( Quackenbush Nat. Genet. 32 (Suppl.), 496-501 (2002 )).
- the intrinsic genes disclosed herein can be normalized to control housekeeping genes.
- the housekeeping genes described in U.S. Patent Publication 2008/0032293 can be used for normalization.
- Exemplary housekeeping genes include MRPL19, PSMC4, SF3A1, PUM1, ACTB, GAPD, GUSB, RPLPO, and TFRC. It will be understood by one of skill in the art that the methods disclosed herein are not bound by normalization to any particular housekeeping genes, and that any suitable housekeeping gene(s) known in the art can be used.
- microarray data is normalized using the LOWESS method, which is a global locally weighted scatter plot smoothing normalization function.
- qPCR data is normalized to the geometric mean of set of multiple housekeeping genes.
- “Mean centering” may also be used to simplify interpretation. Usually, for each descriptor, the average value of that descriptor for all samples is subtracted. In this way, the mean of a descriptor coincides with the origin, and all descriptors are "centered” at zero.
- unit variance scaling data can be scaled to equal variance. Usually, the value of each descriptor is scaled by 1/StDev, where StDev is the standard deviation for that descriptor for all samples.
- “Pareto scaling” is, in some sense, intermediate between mean centering and unit variance scaling. In pareto scaling, the value of each descriptor is scaled by 1/sqrt(StDev), where StDev is the standard deviation for that descriptor for all samples. In this way, each descriptor has a variance numerically equal to its initial standard deviation. The pareto scaling may be performed, for example, on raw data or mean centered data.
- Logarithmic scaling may be used to assist interpretation when data have a positive skew and/or when data spans a large range, e.g., several orders of magnitude. Usually, for each descriptor, the value is replaced by the logarithm of that value. In “equal range scaling,” each descriptor is divided by the range of that descriptor for all samples. In this way, all descriptors have the same range, that is, 1. However, this method is sensitive to presence of outlier points. In “autoscaling,” each data vector is mean centered and unit variance scaled. This technique is a very useful because each descriptor is then weighted equally, and large and small values are treated with equal emphasis. This can be important for genes expressed at very low, but still detectable, levels.
- data is collected for one or more test samples and classified using the NANO46 classification model described herein.
- DWD Distance Weighted Discrimination
- DWD is a multivariate analysis tool that is able to identify systematic biases present in separate data sets and then make a global adjustment to compensate for these biases; in essence, each separate data set is a multi-dimensional cloud of data points, and DWD takes two points clouds and shifts one such that it more optimally overlaps the other.
- the methods described herein may be implemented and/or the results recorded using any device capable of implementing the methods and/or recording the results.
- devices that may be used include but are not limited to electronic computational devices, including computers of all types.
- the computer program that may be used to configure the computer to carry out the steps of the methods may be contained in any computer readable medium capable of containing the computer program. Examples of computer readable medium that may be used include but are not limited to diskettes, CD- ROMs, DVDs, ROM, RAM, and other memory and computer storage devices.
- the computer program that may be used to configure the computer to carry out the steps of the methods and/or record the results may also be provided over an electronic network, for example, over the internet, an intranet, or other network.
- Outcome may refer to overall or disease-specific survival, event-free survival, or outcome in response to a particular treatment or therapy.
- the methods may be used to predict the likelihood of long-term, disease-free survival.
- Predicting the likelihood of survival of a breast cancer patient is intended to assess the risk that a patient will die as a result of the underlying breast cancer.
- Long-term, disease-free survival is intended to mean that the patient does not die from or suffer a recurrence of the underlying breast cancer within a period of at least five years, or at least ten or more years, following initial diagnosis or treatment.
- outcome is predicted based on classification of a subject according to subtype.
- the NANO46 bioinformatics model provides a measurement of the similarity of a test sample to all four subtypes which is translated into a Risk of Recurrence (ROR) score that can be used in any patient population regardless of disease status and treatment options.
- the intrinsic subtypes and ROR also have value in the prediction of pathological complete response in women treated with, for example, neoadjuvant taxane and anthracycline chemotherapy ( Rouzier et al., J Clin Oncol 23:8331-9 (2005 )).
- a risk of recurrence (ROR) model is used to predict outcome. Using these risk models, subjects can be stratified into low, medium, and high risk of recurrence groups. Calculation of ROR can provide prognostic information to guide treatment decisions and/or monitor response to therapy.
- the prognostic performance of the NANO46-defined intrinsic subtypes and/or other clinical parameters is assessed utilizing a Cox Proportional Hazards Model Analysis, which is a regression method for survival data that provides an estimate of the hazard ratio and its confidence interval.
- the Cox model is a well-recognized statistical technique for exploring the relationship between the survival of a patient and particular variables. This statistical method permits estimation of the hazard (i.e ., risk) of individuals given their prognostic variables (e.g., intrinsic gene expression profile with or without additional clinical factors, as described herein).
- the "hazard ratio" is the risk of death at any given time point for patients displaying particular prognostic variables. See generally Spruance et al., Antimicrob. Agents & Chemo. 48:2787-92 (2004 ).
- the NANO46 classification model described herein can be trained for risk of recurrence using subtype distances (or correlations) alone, or using subtype distances with clinical variables as discussed supra.
- the risk score for a test sample is calculated using intrinsic subtype distances alone using the following equation:
- risk score for a test sample is calculated using intrinsic subtype distances alone using the following equation:
- ROR-S 0.05 ⁇ Basal + 0.12 ⁇ Her2 + -0.34 ⁇ LumA + 0.0.23 ⁇ LumB, where the variables "Basal,” “Her2,” “LumA,” and “LumB” are as described supra and the test expression profiles are compared to centroids constructed using the gene expression data deposited with GEO as accession number GSE2845.
- risk score for a test sample is calculated using intrinsic subtype distances in combination with the proliferation signature ("Prolif") using the following equation:
- ROR-P -0.001 ⁇ Basal + 0.7 ⁇ Her2 + -0.95 ⁇ LumA + 0.49 ⁇ LumB + 0.34 ⁇ Prolif, where the variables "Basal,” “Her2,” “LumA,” “LumB” and “Prolif” are as described supra and the test expression profiles are compared to centroids constructed using the gene expression data deposited with GEO as accession number GSE2845.
- risk score can also be calculated using a combination of breast cancer subtype, proliferation signature and the clinical variable tumor size (T) using the ROR-PT described in conjunction with Table 3 supra.
- ER estrogen
- PgR progesterone
- HER2 HER2
- Ki67 Ki67
- Staining for ER, PgR, and HER2 interpretation can be performed as described previously ( Cheang et al., Clin Cancer Res. 2008;14(5): 1368-1376 .), however any method known in the art may be used.
- a Ki67 antibody (clone SP6; ThermoScientific, Fremont, CA) can be applied at a 1:200 dilution for 32 minutes, by following the Ventana Benchmark automated immunostainer (Ventana, Arlington AZ) standard Cell Conditioner 1 (CC1, a proprietary buffer) protocol at 98°C for 30 minutes.
- An ER antibody (clone SP1; ThermoFisher Scientific, Fremont CA) can be used at 1:250 dilution with 10-minute incubation, after an 8-minute microwave antigen retrieval in 10 mM sodium citrate (pH 6.0).
- Ready-to-use PR antibody (clone 1E2; Ventana) can be used by following the CC1 protocol as above.
- HER2 staining can be done with a SP3 antibody (ThermoFisher Scientific) at a 1:100 dilution after antigen retrieval in 0.05 M Tris buffer (pH 10.0) with heating to 95°C in a steamer for 30 minutes.
- FISH fluorescent in situ hybridization
- slides can be hybridized with probes to LSI (locus-specific identifier) HER2/neu and to centromere 17 by use of the PathVysion HER-2 DNA Probe kit (Abbott Molecular, Abbott Park, IL) according to manufacturer's instructions, with modifications to pretreatment and hybridization as previously described ( Brown LA, Irving J, Parker R, et al.
- Tumors were considered positive for ER or PR if immunostaining was observed in more than 1% of tumor nuclei, as described previously. Tumors were considered positive for HER2 if immunostaining was scored as 3+ according to HercepTest criteria, with an amplification ratio for fluorescent in situ hybridization of 2.0 or more being the cut point that was used to segregate immunohistochemistry equivocal tumors (scored as 2+) ( Yaziji, et al., JAMA, 291(16):1972-1977 (2004 )). Ki67 was visually scored for percentage of tumor cell nuclei with positive immunostaining above the background level by two pathologists.
- kits useful for classifying breast cancer intrinsic subtypes and/or providing prognostic information to identify risk of recurrence comprise a set of capture probes and/or primers specific for the intrinsic genes listed in Table 1.
- the kit may further comprise a computer readable medium.
- the capture probes are immobilized on an array.
- array is intended a solid support or a substrate with peptide or nucleic acid probes attached to the support or substrate.
- Arrays typically comprise a plurality of different capture probes that are coupled to a surface of a substrate in different, known locations.
- the arrays of the disclosure comprise a substrate having a plurality of capture probes that can specifically bind an intrinsic gene expression product.
- the number of capture probes on the substrate varies with the purpose for which the array is intended.
- the arrays may be low-density arrays or high-density arrays and may contain 4 or more, 8 or more, 12 or more, 16 or more, 32 or more addresses, but will minimally comprise capture probes for the 46 intrinsic genes listed in Table 1.
- arrays may be fabricated on a surface of virtually any shape or even a multiplicity of surfaces.
- Arrays may be probes (e.g., nucleic-acid binding probes) on beads, gels, polymeric surfaces, fibers such as fiber optics, glass or any other appropriate substrate, see U.S. Pat. Nos. 5,770,358 , 5,789,162 , 5,708,153 , 6,040,193 and 5,800,992 .
- Arrays may be packaged in such a manner as to allow for diagnostics or other manipulation on the device. See, for example, U.S. Pat. Nos. 5,856,174 and 5,922,591 .
- the kit comprises a set of oligonucleotide primers sufficient for the detection and/or quantitation of each of the intrinsic genes listed in Table 1.
- the oligonucleotide primers may be provided in a lyophilized or reconstituted form, or may be provided as a set of nucleotide sequences.
- the primers are provided in a microplate format, where each primer set occupies a well (or multiple wells, as in the case of replicates) in the microplate.
- the microplate may further comprise primers sufficient for the detection of one or more housekeeping genes as discussed infra.
- the kit may further comprise reagents and instructions sufficient for the amplification of expression products from the genes listed in Table 1.
- the molecular signatures/expression profiles are typically recorded in a database.
- the database is a relational database accessible by a computational device, although other formats, e.g., manually accessible indexed files of expression profiles as photographs, analogue or digital imaging readouts, spreadsheets, etc. can be used.
- the expression patterns initially recorded are analog or digital in nature
- the expression patterns, expression profiles (collective expression patterns), and molecular signatures (correlated expression patterns) are stored digitally and accessed via a database.
- the database is compiled and maintained at a central facility, with access being available locally and/or remotely.
- the NanoString nCounter Analysis System delivers direct, multiplexed measurements of gene expression through digital readouts of the relative abundance of hundreds of mRNA transcripts.
- the nCounter Analysis System uses gene-specific probe pairs ( Figure 7 ) that are mixed together to form a single reagent called a CodeSet. The probe pairs hybridize directly to the mRNA sample in solution eliminating any enzymatic reactions that might introduce bias in the results.
- probe/target complexes are aligned and immobilized ( Figure 10 ) in the nCounter Cartridge.
- the Reporter Probe carries the fluorescent signal; the Capture Probe allows the complex to be immobilized for data collection.
- Up to 800 pairs of probes, each specific to a particular gene, can be combined with a series of internal controls to form a CodeSet.
- the Breast Cancer test will simultaneously measure the expression levels of NANO46 plus eight housekeeping genes in a single hybridization reaction using an nCounter CodeSet designed specifically to those genes.
- Each assay also includes positive assay controls comprised of a linear titration of in vitro transcribed RNA transcripts and corresponding probes, and a set of probes with no sequence homology to element, integer or step, or group of elements, integers or steps.
- Figure 5 outlines the assay processes associated with the Breast Cancer Intrinsic Subtyping test. Following RNA isolation, the test will simultaneously measure the expression levels of 46 target genes plus eight housekeeping genes in a single hybridization reaction using an nCounter CodeSet designed specifically to those genes.
- the housekeeping genes described in U.S. Patent Publication 2008/0032293 can be used for normalization. Exemplary housekeeping genes include MRPL19, PSMC4, SF3A1, PUM1, ACTB, GAPD, GUSB, RPLP0, and TFRC. The housekeeping genes are used to normalize the expression of the tumor sample.
- Each assay run also includes a reference sample consisting of in vitro transcribed RNA's of the 58 targets for normalization purposes.
- FFPE Tissue Review/Procurement and RNA Extraction The Breast Cancer Intrinsic Subtyping Test will use RNA extracted from Formalin-fixed, Paraffin-embedded (FFPE) tissue that has been diagnosed as invasive carcinoma of the breast. A Pathologist reviews an H & E stained slide to identify the tissue area containing sufficient tumor tissue content for the test. Unstained slide mounted tissue sections are processed by macro-dissecting the identified tumor area on each slide to remove any adjacent normal tissue. RNA is then isolated from the tumor tissue, and DNA is removed from the sample.
- FFPE Formalin-fixed, Paraffin-embedded
- RNA samples isolated from a breast tumor For each batch of up to 10 RNA samples isolated from a breast tumor, the user will set up a run using the nCounter Analysis x5 system software, which tracks sample processing, reagent lots, and results for each sample. To initiate the assay, the user will pipette the specified amount of RNA into separate tubes within a 12 reaction strip tube and add the CodeSet and hybridization buffer. A reference sample is pipetted into the remaining two tubes with CodeSet and hybridization buffer.
- the CodeSet consists of probes for each gene that is targeted, additional probes for endogenous "housekeeping" normalization genes and positive and negative controls that are spiked into the assay.
- the reference sample consists of in vitro transcribed RNA for the targeted genes and housekeeping genes.
- NanoString's protocol includes a step for quantitating total RNA using a low volume spectrophotometer such as the NanoDropTM spectrophotometer. NanoString will define performance specifications for the spectrophotometer so that the range of RNA input recommended for the test is above the limit of detection of the low volume spectrophotometer and is reproducibly measurable.
- Hybridization For each set of up to 10 RNA samples, the user will pipette the specified amount of RNA into separate tubes within a 12 reaction strip tube and add the CodeSet and hybridization buffer. A reference sample is pipetted into the remaining two tubes with CodeSet and hybridization buffer.
- the CodeSet consists of probes for each gene that is targeted, additional probes for endogenous "housekeeping" normalization genes and positive and negative controls. The probes within the CodeSet pertaining to each of these genes within the four groups (target genes, housekeeping genes, and positive and negative controls) are each assigned a unique code and are therefore individually identifiable within each run.
- the reference sample consists of in vitro transcribed RNA for the targeted genes and housekeeping genes.
- the nCounter assay includes an overnight hybridization under isothermal conditions. Because the overnight hybridization is performed in a small volume at elevated temperature, care must be taken to avoid evaporation. Many commercial PCR thermocyclers are equipped with heated lids that will prevent the evaporation of small volumes of liquid. Because the assay does not require any fine control of temperature ramping, any heat block with a programmable heated lid and a block with dimensions that fit the NanoString tubes will work with the NanoString assay. NanoString plans to provide specifications for heat blocks that meet the assay requirements.
- the user Upon completing hybridization, the user will then transfer the strip tube containing the set of 10 assays and 2 reference samples into the nCounter Prep Station along with the required prepackaged reagents and disposables described in Table 1 .
- the Prep Plates contain the necessary reagents for purification of excess probes and binding to the cartridge (see section IIIC below for detailed description of purification process).
- the prep plates are centrifuged in a swinging bucket centrifuge prior to placement on the deck of the Prep Station.
- An automated purification process then removes excess capture and reporter probe through two successive hybridization-driven magnetic bead capture steps.
- the nCounter Prep Station then transfers the purified target/probe complexes into an nCounter cartridge for capture to a glass slide. Following completion of the run, the user removes the cartridge from the Prep Station and seals it with an adhesive film.
- RNA sample is too degraded to be analyzed by the test due to improper handling or storage of tissue or RNA (e.g. improper tumor fixation, FFPE block storage, RNA storage, RNA handling introducing RNase).
- the positive and negative assay controls indicate a failure of the assay process (e.g.
- the signals of each sample are next normalized using the housekeeping genes to control for input sample quality.
- the signals are then normalized to the reference sample within each run to control for run-to-run variations.
- the resulting normalized data is entered in the Breast Cancer Intrinsic Subtyping algorithm to determine tumor intrinsic subtype, risk of relapse score, and risk classification.
- the nCounter Analysis System is comprised of two instruments, the nCounter Prep Station used for post-hybridization processing, and the Digital Analyzer used for data collection and analysis.
- nCounter Prep Station - The nCounter Prep Station ( Figure 13 ) is an automated fluid handling robot that processes samples post-hybridization to prepare them for data collection on the nCounter Digital Analyzer. Prior to processing on the Prep Station, total RNA extracted from FFPE (Formalin-Fixed, Paraffin-Embedded) tissue samples is hybridized with the NanoString Reporter Probes and Capture Probes according to the nCounter protocol described above.
- FFPE Form-Fixed, Paraffin-Embedded
- Hybridization to the target RNA is driven by excess NanoString probes. To accurately analyze these hybridized molecules they are first purified from the remaining excess probes in the hybridization reaction.
- the Prep Station isolates the hybridized mRNA molecules from the excess Reporter and Capture probes using two sequential magnetic bead purification steps. These affinity purifications utilize custom oligonucleotide-modified magnetic beads that retain only the tripartite complexes of mRNA molecules that are bound to both a Capture probe and a Reporter probe.
- this solution of tripartite complexes is washed through a flow cell in the NanoString sample cartridge.
- One surface of this flow cell is coated with a polyethylene glycol (PEG) hydrogel that is densely impregnated with covalently bound streptavidin.
- PEG polyethylene glycol
- the tripartite complexes are bound to the streptavidin in the hydrogel through biotin molecules that are incorporated into each Capture probe.
- the PEG hydrogel acts not only to provide a streptavidin-dense surface onto which the tripartite complexes can be specifically bound, but also inhibits the non-specific binding of any remaining excess reporter probes.
- an electric field is applied along the length of each sample cartridge flow cell to facilitate the optical identification and order of the fluorescent spots that make up each reporter probe. Because the reporter probes are charged nucleic acids, the applied voltage imparts a force on them that uniformly stretches and orients them along the electric field. While the voltage is applied, the Prep Station adds an immobilization reagent that locks the reporters in the elongated configuration after the field is removed. Once the reporters are immobilized the cartridge can be transferred to the nCounter Digital Analyzer for data collection. All consumable components and reagents required for sample processing on the Prep Station are provided in the nCounter Master Kit. These reagents are ready to load on the deck of the nCounter Prep Station which can process up to 10 samples and 2 reference samples per run in approximately 2.5 hours.
- nCounter Digital Analyzer The nCounter Digital Analyzer ( Figure 14 ) collects data by taking images of the immobilized fluorescent reporters in the sample cartridge with a CCD camera through a microscope objective lens. Because the fluorescent Reporter Probes are small, single molecule barcodes with features of smaller than the wavelength of visible light, the Digital Analyzer uses high magnification, diffraction limited imaging to resolve the sequence of the spots in the fluorescent barcodes.
- the Digital Analyzer captures hundreds of consecutive fields-of-view (FOV) that can each contain hundreds or thousands of discrete Reporter Probes. Each FOV is a combination of four monochrome images captured at different wavelengths. The resulting overlay can be thought of as a four-color image in blue, green, yellow, and red. Each 4-color FOV is processed in real time to provide a "count" for each fluorescent barcode in the sample. Because each barcode specifically identifies a single mRNA molecule, the resultant data from the Digital Analyzer is a precise measure of the relative abundance of each mRNA of interest in a biological sample.
- the Prep Station and the Digital Analyzer are stand-alone units that do not require connection to an external PC, but must be networked to one another using a Local Area Network (LAN).
- the nCounter System software securely manages operations through user accounts and permissions. Both instruments use setup and process wizards on an embedded touch screen user interface to guide the user through the sample processing and data collection steps of the assay. The user is led through the procedure by step-by-step instructions on the Prep Station and Digital Analyzer.
- the instrument touch screen uses a pressure sensitive method for controlling operations and enables the user to interact with the system by touching a selection on the screen. Because the touchscreen provides a limited human interface for data entry, the system also hosts a web-based application for user accounts management, sample batch definition, and sample status tracking.
- the system software tracks the user account and reagent lots for each sample in a centralized data repository.
- expression data for a sample is acquired by the Digital Analyzer, it is first analyzed to ensure that all pre-specified quality control metrics are met.
- the qualified data are then processed through a locked PAM50 algorithm to generate a report containing intrinsic subtype and risk of recurrence (ROR) score.
- the sample report is transferred to the central repository where it can be securely accessed for download by a user with the correct permissions.
- the Breast Cancer Intrinsic Subtyping Algorithm The Breast Cancer Intrinsic Subtyping Algorithm - The nCounter system will be used to identify the intrinsic subtype of an excised invasive carcinoma of the breast using a 50 gene classifier algorithm originally named the PAM50 ( Parker J.S., et al. Supervised Risk Predictor of Breast Cancer Based on Intrinsic Subtypes. Journal of Clinical Oncology, 27: 1160-1167 (2009 )).
- the gene expression profile will assign a breast cancer to one of four molecular classes or intrinsic subtypes: Basal-like, Luminal A, Luminal B, and HER2 enriched. A brief description of each subtype is provided below.
- Luminal subtypes The most common subtypes of breast cancer are the luminal subtypes in the hormone-receptor positive population, Luminal A and Luminal B. Prior studies suggest that luminal A comprises approximately 30% to 40% and luminal B approximately 20% of breast cancers 2 and over 90 % of hormone receptor-positive breast cancers. The gene expression pattern of these subtypes resembles the luminal epithelial component of the breast ( Nielsen, TO et al. A comparison of PAM50 intrinsic subtyping with immunohistochemistry and clinical prognostic factors in tamoxifen-treated estrogen receptor positive breast cancer. Clinical Cancer Research, 16:5222-5232 (2010 )). These tumors are characterized by high expression of estrogen receptor (ER), progesterone receptor (PR), and genes associated with ER activation 2 such as LIV1, GATA3, and cyclin D1, as well as expression of luminal cytokeratins 8 and 18.
- ER estrogen receptor
- PR progesterone receptor
- genes associated with ER activation 2 such as LIV1,
- Basal-like The Basal-like subtype is generally ER-negative, is almost always clinically HER2-negative and expresses a suite of "basal” biomarkers including the basal epithelial cytokeratins (CK) and epidermal growth factor receptor (EGFR). Genes associated with cell cycle activation are highly expressed.
- CK basal epithelial cytokeratins
- EGFR epidermal growth factor receptor
- HER2-enriched The HER2-enriched subtype is generally ER-negative and is HER2-positive in the majority of cases with high expression of the ERBB2 cluster, including ERBB2 and GRB7. Genes associated with cell cycle activation are highly expressed and these tumors have a poor outcome.
- Cutoffs for the intrinsic subtyping algorithm are pre-defined from training sets that defined the following: 1) intrinsic subtype centroids (i.e. the prototypical gene expression profile of each subtype), 2) coefficients for Risk of Recurrence (ROR) score, and 3) risk classification (Low/Intermediate/High).
- the intrinsic subtype centroids Luminal A, Luminal B, Her2-enriched, Basal-like
- the intrinsic subtype centroids were trained using a clinically representative set of archived FFPE breast tumor specimens collected from multiple sites.
- Hierarchical clustering analysis of gene expression data from the FFPE breast tumor samples was combined with breast tumor biology (i.e. gene expression of previously defined intrinsic subtypes) to define the prototypical expression profile (i.e. centroid) of each subtype.
- a computational algorithm correlates the normalized 50 gene expression profile of an unknown breast cancer tumor sample to each of the prototypical expression signatures of the four breast cancer intrinsic subtypes.
- the tumor sample is assigned the subtype with the largest positive correlation to the sample.
- ROR aR LumA + bR LumB + cR Her 2 ⁇ e + dR basal + eP + fT
- cutoffs were set based on probability of recurrence free survival in a patient population consisting of hormone receptor positive, post-menopausal patients treated with endocrine therapy alone.
- NanoString Breast Cancer Test in Clinical Practice - Oncologists currently use a series of tests to develop a treatment protocol for breast cancer patients. Included in these are the IHC / FISH tests such as ER/PR IHC and HER2 IHC / FISH, and the Agendia MammaPrint® assay and the Genomic Health Oncotype Dx® test. These tests offer the oncologist additional information regarding the patient's prognosis and recommended treatment regimens.
- the MammaPrint test is FDA cleared for use only with frozen or fresh-preserved tissue samples, yet most of the tumor samples collected in the United States are FFPE rather than fresh-frozen. This test is also not distributed and is only available through the Agendia reference labs.
- the Oncotype Dx test can be used to predict the risk of relapse for stage I/II, node negative, estrogen receptor-positive patients receiving adjuvant Tamoxifen therapy as well as response to cyclophosphamide/methotrexate/5-fluorouracil (CMF) chemotherapy.
- CMF cyclophosphamide/methotrexate/5-fluorouracil
- this test is only offered as a lab-developed test (LDT) through Genomic Health's CLIA laboratory and is not FDA cleared for prognostic use, or FDA approved for predicting chemotherapy response.
- NanoString envisions a model that would have the Breast Cancer test used in conjunction with other sources of clinical data currently available to oncologists for breast cancer prognosis in selected patient segments.
- the Breast Cancer Test would be an additional source of prognostic information adding significant value to established clinical parameters (i.e tumor size, nodal status) used by oncologists in managing a patient with breast cancer.
- the methods, assays and kits of the disclosure include a series of quality control metrics that are automatically applied to each sample during analysis. These metrics evaluate the performance of the assay to determine whether the results fall within expected values. Upon successful analysis of these quality control metrics, the Assay gives the following results: Result Output Values The Intrinsic Subtype of the Breast Cancer Specimen Luminal A Luminal B HER2- Enriched Basal-Like Individual Estimate of the Probability of Distant Recurrence within 10 years 0-100% Risk of Recurrence (ROR) Score Integer value on a 0-100 scale Risk Category Low, Intermediate, High
- Intrinsic Subtype of a breast cancer tumor has been shown to be related to prognosis in Early Stage Breast Cancer.
- patients with a Luminal A tumor have significantly better outcomes than patients with Luminal B, HER2-Enriched, or Basal-like tumors.
- the Intrinsic Subtype is identified by comparing the gene expression profile of 50 genes in an unknown sample with the expected expression profiles for the four intrinsic subtypes. The subtype with the most similar profile is assigned to the unknown sample.
- Luminal A comprises approximately 30% to 40% and Luminal B approximately 20% of breast cancers.
- Luminal B approximately 20% of breast cancers.
- ER estrogen receptor
- PR progesterone receptor
- ER activation such as LIV1, GATA3, and cyclin D1, as well as expression of luminal cytokeratins 8 and 18.
- Luminal A breast cancers exhibit lower expression of genes associated with cell cycle activation when compared to Luminal B breast cancers resulting in a better prognosis.
- HER2-Enriched subtype comprises approximately 20% of breast cancers.
- HER2-Enriched tumors are generally ER-negative, so only 5% of the tested ER-positive patient population was found to have HER2-Enriched breast cancer.
- ER-status HER2-Enriched tumors are HER2-positive in the majority of cases with high expression of the ERBB2 cluster, including ERBB2 and GRB7. Genes associated with cell cycle activation are also highly expressed.
- Basal-like subtype comprises approximately 20% of breast cancers.
- Basal-like tumors are generally ER-negative, so only 1% of hormone receptor-positive patients have Basal-like breast cancer.
- the Basal-like subtype is almost always clinically HER2-negative and expresses a suite of "basal" biomarkers including the basal epithelial cytokeratins (CK) and epidermal growth factor receptor (EGFR). Genes associated with cell cycle activation are highly expressed.
- CK basal epithelial cytokeratins
- EGFR epidermal growth factor receptor
- the ROR score is an integer value on a 0-100 scale that is related to an individual patient's probability of distant recurrence within 10 years for the defined intended use population.
- the ROR score is calculated by comparing the expression profiles of 46 genes in an unknown sample with the expected profiles for the four intrinsic subtypes, as described above, to calculate four different correlation values. These correlation values are then combined with a proliferation score and the tumor size to calculate the ROR score.
- the ROR scores for a cohort of post-menopausal women with hormone receptor-positive early stage breast cancer were compared to distant recurrence-free survival following surgery and treatment with 5 years of adjuvant endocrine therapy followed by 5 years of observation. This study resulted in a model relating the ROR score to the probability of distant recurrence in this tested patient population including a 95% confidence interval.
- Risk classification is also provided to allow interpretation of the ROR score by using cutoffs related to clinical outcome in tested patient populations.
- Risk classification by ROR range and nodal status Nodal Status ROR Range Risk Classification Node- Negative 0-40 Low 41-60 Intermediate 61-100 High Node-Positive (1-3 nodes) 0-15 Low 16-40 Intermediate 41-100 High
- the assay kit includes a series of internal controls that are used to assess the quality of each run set as a whole and each sample individually. These controls are listed below.
- a synthetic RNA Reference Sample is included as a control within the Assay kit.
- the reference sample is comprised of in-vitro transcribed RNA targets from the 50 algorithm and 8 housekeeping genes.
- the Reference Sample is processed in duplicate in each assay run along with a set of up to 10 unknown breast tumor RNA samples in a 12 reaction strip tube.
- the signal from the Reference Sample is analyzed against pre-defined thresholds to qualify the run.
- the signal from each of the 50 algorithm genes of the breast tumor RNA sample is normalized to the corresponding genes of the Reference Sample.
- RNA targets are used as positive controls (PCs) for the assay.
- the PC target sequences are derived from the External RNA Control Consortium (ERCC) DNA sequence library.
- the RNA targets are in-vitro transcribed from DNA plasmids.
- Six RNA targets are included within the assay kit in a 4-fold titration series (128 - 0.125 fM final concentration in hybridization reaction) along with the corresponding Capture and Reporter Probes.
- the PCs are added to each breast tumor RNA sample and Reference RNA Sample tested with the Prosigna Assay. A sample will be disqualified from further analysis if the signal intensities from the PCs do not meet pre-defined thresholds.
- Negative control set exogenous probes without targets
- Negative control (NC) target sequences are derived from the ERCC DNA sequence library.
- the probes designed to detect these target sequences are included as part of the assay kit without the corresponding target sequence.
- the negative controls (NCs) are added to each breast tumor RNA sample and Reference Sample tested with the Prosigna Assay as a quality control measure. The sample will be disqualified from further analysis if the signal intensities from the NCs do not meet pre-defined thresholds.
- RNA Integrity Control Set Housekeeping genes
- Capture and Reporter Probes designed to detect 8 housekeeping genes and 50 algorithm genes are included as part of the kit.
- the expression levels of the 8 housekeeping genes are analyzed to determine the quality of RNA extracted from the FFPE tissue sample and input into the assay. The sample will be disqualified from further analysis if the expression level of the housekeeping genes falls below pre-defined thresholds.
- the housekeeping genes are also used to normalize for any differences in the intact RNA amount in a sample prior to Reference Sample normalization.
- breast cancer includes, for example, those conditions classified by biopsy or histology as malignant pathology.
- the clinical delineation of breast cancer diagnoses is well known in the medical arts.
- breast cancer refers to any malignancy of the breast tissue, including, for example, carcinomas and sarcomas.
- Particular embodiments of breast cancer include ductal carcinoma in situ (DCIS), lobular carcinoma in situ (LCIS), or mucinous carcinoma.
- Breast cancer also refers to infiltrating ductal (IDC) or infiltrating lobular carcinoma (ILC).
- the subject of interest is a human patient suspected of or actually diagnosed with breast cancer.
- Figure 5 outlines the assay processes associated with the Breast Cancer Intrinsic Subtyping test. Following RNA isolation, the test will simultaneously measure the expression levels of 46 target genes plus eight housekeeping genes in a single hybridization reaction using an nCounter CodeSet designed specifically to those genes.
- the housekeeping genes described in U.S. Patent Publication 2008/0032293 can be used for normalization. Exemplary housekeeping genes include MRPL19, PSMC4, SF3A1, PUM1, ACTB, GAPD, GUSB, RPLP0, and TFRC. The housekeeping genes are used to normalize the expression of the tumor sample.
- Each assay run also includes a reference sample consisting of in vitro transcribed RNA's of the 58 targets for normalization purposes.
- FFPE Tissue Review/Procurement and RNA Extraction The Breast Cancer Intrinsic Subtyping Test will use RNA extracted from Formalin-fixed, Paraffin-embedded (FFPE) tissue that has been diagnosed as invasive carcinoma of the breast. A Pathologist reviews an H & E stained slide to identify the tissue area containing sufficient tumor tissue content for the test. Unstained slide mounted tissue sections are processed by macro-dissecting the identified tumor area on each slide to remove any adjacent normal tissue. RNA is then isolated from the tumor tissue, and DNA is removed from the sample.
- FFPE Formalin-fixed, Paraffin-embedded
- RNA samples isolated from a breast tumor For each batch of up to 10 RNA samples isolated from a breast tumor, the user will set up a run using the nCounter Analysis x5 system software, which tracks sample processing, reagent lots, and results for each sample. To initiate the assay, the user will pipette the specified amount of RNA into separate tubes within a 12 reaction strip tube and add the CodeSet and hybridization buffer. A reference sample is pipetted into the remaining two tubes with CodeSet and hybridization buffer.
- the CodeSet consists of probes for each gene that is targeted, additional probes for endogenous "housekeeping" normalization genes and positive and negative controls that are spiked into the assay.
- the reference sample consists of in vitro transcribed RNA for the targeted genes and housekeeping genes.
- the user Upon completing hybridization, the user will transfer the strip tube containing the set of 10 assays and 2 reference samples onto the nCounter Prep Station along with the required prepackaged reagents and disposables. An automated purification process then removes excess capture and reporter probe through two successive hybridization-driven magnetic bead capture steps. The nCounter Prep Station then transfers the purified target/probe complexes into an nCounter cartridge for capture to a glass slide. Following completion of the run, the user removes the cartridge from the Prep Station and seals it with an adhesive film.
- the cartridge is then sealed and inserted into the nCounter Digital Analyzer which counts the number of probes captured on the slide for each gene, which corresponds to the amount of target in solution. Automated software will then check thresholds for the housekeeping genes, reference sample, and positive and negative controls to qualify each assay and ensure that the procedure was performed correctly.
- the signals of each sample are next normalized using the housekeeping genes to control for input sample quality. The signals are then normalized to the reference sample within each run to control for run-to-run variations. The resulting normalized data is entered in the Breast Cancer Intrinsic Subtyping algorithm to determine tumor intrinsic subtype and risk of recurrence score.
- Example 2 Clinical Validation of the NAN046 risk of recurrence (ROR) score for predicting residual risk of distant-recurrence (DR) after endocrine therapy in postmenopausal women with HR+ early breast cancer (EBC): An ABSCSG Study.
- ROR risk of recurrence
- EBC HR+ early breast cancer
- the aim of the study is to assess the performance of the ROR score in predicting distal recurrence for postmenopausal patients with hormone receptor positive early breast cancer (HR+ EBC) treated with tamoxifen or tamoxifen followed by anastrozole when the NANO46 test is performed in a routine hospital pathology lab.
- HR+ EBC hormone receptor positive early breast cancer
- results show that both the ROR score and the ROR-based risk groups add statistically significant prognostic information beyond the Clinical Treatment Score.
- the results demonstrate that a complex, multi-gene-expression test can be performed in a hospital pathology laboratory and meet the same quality metrics as a central reference laboratory.
- the results of the TransATAC and ABCSG8 studies together provide Level 1 evidence for the clinical validity of the NANO46 test for predicting the risk of distant recurrence in postmenopausal women with HR+ EBC treated with endocrine therapy alone.
- the results also show that Luminal A subtypes have better outcomes than Luminal B subtypes in postmenopausal women with HR+ EBC treated with endocrine therapy alone.
Landscapes
- Chemical & Material Sciences (AREA)
- Life Sciences & Earth Sciences (AREA)
- Health & Medical Sciences (AREA)
- Organic Chemistry (AREA)
- Proteomics, Peptides & Aminoacids (AREA)
- Engineering & Computer Science (AREA)
- Immunology (AREA)
- Pathology (AREA)
- Analytical Chemistry (AREA)
- Zoology (AREA)
- Genetics & Genomics (AREA)
- Wood Science & Technology (AREA)
- Physics & Mathematics (AREA)
- Biotechnology (AREA)
- Microbiology (AREA)
- Molecular Biology (AREA)
- Hospice & Palliative Care (AREA)
- Biophysics (AREA)
- Oncology (AREA)
- Biochemistry (AREA)
- Bioinformatics & Cheminformatics (AREA)
- General Engineering & Computer Science (AREA)
- General Health & Medical Sciences (AREA)
- Measuring Or Testing Involving Enzymes Or Micro-Organisms (AREA)
Description
- This disclosure relates generally to the field of cancer biology, and specifically, to the fields of detection and identification of specific cancer cell phenotypes and correlation with appropriate therapies.
- Current approaches to treating early breast cancer, including adjuvant therapy, have indeed improved survival and reduced recurrence. However, the risk of recurrence may be underestimated in some patients, but overestimated in others.
- While the risk of recurrence does diminish somewhat over time, ongoing risk has been observed in many studies, some of them involving tens of thousands of patients with breast cancer. In fact, some of the patients who experienced recurrence after five years in these studies had previously been considered "low risk" - for example, their cancer had not spread to the lymph nodes at the time of their initial diagnosis, or their estrogen receptor status was positive. In one of these studies, a substantial number of recurrences occurred more than five years post-treatment. Thus, there is a need in the art to determine risk of recurrence and determine therapies which reduce that risk and improve overall survival.
-
WO2009/158143 and Parker Joel S et al.: "Supervised risk predictor of breast cancer based on intrinsic subtypes", J. of Clinincal Oncology, Americal Soc. of Clinical Oncology, 27: 8, pp. 1160-1167, 10 March 2019 describe methods for classifying and for evaluating the prognosis of a subject having breast cancer. The prediction model is based on a the gene expression profile of a specific set of genes.EP1641810 A2 provides gene sets, the expression of which is important in the diagnosis and/or prognosis of cancer, in particular of breast cancer. "Affymetrix Genechip Human Genome U133 Array Set HG-U133A" GEO provides probes for all the coding genes of the human cell on a microarray. - The present invention provides a method of determining low or high risk of recurrence (ROR) in a subject having breast cancer comprising: determining the size of the breast cancer tumor from the subject; determining a correlation value of a breast cancer tumor for each of at least four intrinsic subtypes including a Basal-like, Luminal A, Luminal B, or HER-2 enriched, by measuring the RNA expression of at least 40 of the genes in the NANO46 intrinsic gene list of Table 1; determining a proliferation score by measuring the RNA expression of each of the 18-gene subset of the NANO46 intrinsic genes selected from ANLN, CCNE1, CDC20, CDC6, CDCA1, CENPF, CEP55, EXO1, KIF2C, KNTC2, MELK, MKI67, ORC6L, PTTG1, RRM2, TYMS, UBE2C, and UBE2T; calculating a risk of recurrence (ROR) score using the following equation: ROR-PT = -0.0067∗Basal + 0.4317∗Her2 + -0.3172∗LumA + 0.4894∗LumB + 0.1981∗ProliferationScore + 0.1133∗TumorSize; wherein the risk of recurrence score is an integer value on a 0-100 scale, wherein the level of RNA expression for at least 40 of the genes in the NANO46 intrinsic gene list of Table 1 is set forth in Table 3; thereby determining whether the subject has a low or high risk of recurrence based on the risk of recurrence (ROR) score and interpretation of the ROR score using the risk classification by risk of recurrence (ROR) range and nodal status.
- The method of the present invention can include determining at least one of, a combination of, or each of, the following: tumor grade, tumor ploidy, estrogen receptor expression, progesterone receptor expression, and HER2/ERBB2 expression.
- The risk may be breast cancer specific survival, event-free survival, or response to therapy.
- The RNA expression of the members of the NANO46 intrinsic gene list may be determined using the nanoreporter code system (nCounter® Analysis system).
- The method may utilise a sampling of cells or tissues. The sample can be a tumor. The tissue can be obtained from a biopsy. The sample can be a sampling of bodily fluids. The bodily fluid can be blood, lymph, urine, saliva or nipple aspirate.
-
-
Figure 1 is a heatmap of the breast cancer intrinsic subtypes and the intrinsic genes of Table 1. -
Figure 2 shows a Kaplan Meier survival curves from a cohort of untreated breast cancer patients. -
Figure 3 shows a Kaplan Meier survival curves from a cohort of node-negative, ER+ Breast Cancer Patients treated with tamoxifen. -
Figure 4 shows a 10 Year event probability as a function of ROR Score in ER+, Node-negative breast cancer patients treated with tamoxifen. The graph shows the subpopulation subtyped as Luminal A or B within this population. RFS = Recurrence-free survival; DSS = disease-specific survival -
Figure 5 is a schematic of the breast cancer intrinsic subtyping assay. -
Figure 6 is a schematic of the algorithm process. -
Figure 7 is an illustration showing the hybridization of the CodeSet to mRNA. -
Figure 8 is an illustration showing the removal of excess reporters. -
Figure 9 is an illustration showing the binding of the reporters to the surface of a cartridge. -
Figure 10 is an illustration showing the immobilization and alignment of a reporter. -
Figure 11 is an illustration of data collection. -
Figure 12 is an illustration of the nCounter analysis system breast cancer test assay process. -
Figure 13 is an illustration of the nCounter Prep Station. -
Figure 14 is an illustration of nCounter Digital Analyzer. - The invention is defined by the appended claims. The disclosure presents a method of predicting outcome in a subject having breast cancer comprising: providing a tumor sample from the subject; determining the expression of the genes in the NANO46 intrinsic gene list of Table 1 in the tumor sample; determining the intrinsic subtype of the tumor sample based on the expression of the genes in the NANO46 intrinsic gene list, wherein the intrinsic subtype consists of at least Basal-like, Luminal A, Luminal B or HER2-enriched; determining a proliferation score based on the expression of a subset of proliferation genes in the NANO46 intrinsic gene list; determining the size of the tumor, calculating a risk of recurrence score using a weighted sum of said intrinsic subtype, proliferation score and tumor size; and determining whether the subject has a low or high risk of recurrence based on the recurrence score. In one embodiment a low score indicates a more favorable outcome and high score indicates a less favorable outcome.
- Intrinsic genes are statistically selected to have low variation in expression between biological sample replicates from the same individual and high variation in expression across samples from different individuals. Thus, intrinsic genes are used as classifier genes for breast cancer classification. Although clinical information was not used to derive the breast cancer intrinsic subtypes, this classification has proved to have prognostic significance. Intrinsic gene screening can be used to classify breast cancers into five molecular distinct intrinsic subtypes, Luminal A (LumA), Luminal B (LumB), HER2-enriched (Her-2-E), Basal-like, and Normal-like (Perou et al. Nature, 406(6797):747-52 (2000); Sorlie et al. PNAS, 98(19):10869-74 (2001)).
- A NANO46 gene expression assay, as described herein, can identify intrinsic subtype from a biological sample, e.g., a standard formalin fixed paraffin embedded tumor tissue. The methods utilize a supervised algorithm to classify subject samples according to breast cancer intrinsic subtype. This algorithm, referred to herein as the NANO46 classification model, is based on the gene expression profile of a defined subset of intrinsic genes that has been identified herein as superior for classifying breast cancer intrinsic subtypes. The subset of genes, along with primers target-specific sequences utilized for their detection, is provided in Table 1. Table 1A provides the sequences of target specific probe sequences for detecting each gene utilized in Table 1. The sequences provided in Table 1A are merely representative. The skilled artisan can utilize any target sequence-specific probe for detecting any of (or each of) the genes in Table 1.
Table 1 GENE REPRESENTATIVE GENBANK ACCESSION NUMBER FORWARD PRIMER SEQ ID NO: REVERSE PRIMER SEQ ID NO: ACTR3B NM_020445 
1 
47 NM_001040135 ANLN NM_018685 
2 
48 BAG1 NM_004323 
3 
49 BCL2 NM_000633 
4 
50 BLVRA BX647539 
5 
51 CCNE1 BC035498 
6 
52 CDC20 BG256659 
7 
53 CDC6 NM_001254 
8 
54 CDCA1 NM_031423 
9 
55 CDH3 BC041846 
10 
56 CENPF NM_016343 
11 
57 CEP55 AB091343 
12 
58 CXXC5 BC006428 
13 
59 EGFR NM_005228 
14 
60 ERBB2 NM_001005862 
15 
61 ESR1 NM_001122742 
16 
62 FXO1 NM_130398 
17 
63 FGFR4 AB209631 
18 
64 FOXA1 NM_004496 
19 
65 FOXC1 NM_001453 
20 
66 GPR160 AJ249248 
21 
67 HSPC150 (UBE2T) NM_014176 
22 
68 KIF2C NM_006845 
23 
69 KNTC2 NM_006101 
24 
70 KRT14 BC042437 
25 
71 KRT17 AK095281 
26 
72 KRT5 M21389 
27 
73 MAPT NM_001123066 
28 
74 MDM2 M92424 
29 
75 MELK NM_014791 
30 
76 MIA BG765502 
31 
77 MKI67 NM_002417 
32 
78 MLPH NM_024101 
33 
79 MMP11 NM_005940 
34 
80 MYC NM_002467 
35 
81 NAT1 BC013732 
36 
82 ORC6L NM_014321 
37 
83 PGR NM_000926 
38 
84 PHGDH AK093306 
39 
85 PTTG1 BE904476 
40 
86 RRM2 AK123010 
41 
87 SFRP1 BC036503 
42 
88 SLC39A6 NM_012319 
43 
89 TMEM45B AK098106 
44 
90 TYMS BQ56428 
45 
91 UBE2C BC032677 
46 
92 Table 1a. Probes for detecting NANO46 genes Gene Name RefSeq Accession Target Sequence SEQ ID NO: ACTR3B NM_001040135.1 
140 ANLN NM_018685.2 
141 BAG1 NM_004323.3 
142 BCL2 NM_000633.2 
143 BLVRA NM_000712.3 
144 CCNE1 NM_001238.1 
145 CDC20 NM_001255.1 
146 CDC6 NM_001254.3 
147 CDCA1 NM_145697.1 
148 CDH3 NM_001793.3 
149 CENPF NM_016343.3 
150 CEP55 NM_018131.3 
151 CXXC5 NM_016463.5 
152 EGFR NM_005228.3 
153 
ERBB2 NM_004448.2 
154 ESR1 NM_000125.2 
155 EXO1 NM_006027.3 
156 FGFR4 NM_002011.3 
157 FOXA1 NM_004496.2 
158 FOXC1 NM_001453.1 
159 GPR160 NM_014373.1 
160 UBE2T NM_014176.1 
161 KIF2C NM_006845.2 
162 KNTC2 NM_006101.1 
163 KRT14 NM_000526.3 
164 KRT17 NM_000422.1 
165 KRT5 NM_000424.2 
166 MAPT NM_016835.3 
167 MDM2 NM_006878.2 
168 MELK NM_014791.2 
169 MIA NM_006533.1 
170 MKI67 NM_002417.2 
171 MLPH NM_024101.4 
172 MMP11 NM_005940.3 
173 MYC NM_002467.3 
174 NAT1 NM_000662.4 
175 ORC6L NM_014321.2 
176 PGR NM_000926.2 
177 PHGDH NM_006623.2 
178 PTTG1 NM_004219.2 
179 RRM2 NM_001034.1 
180 SFRP1 NM_003012.3 
181 SLC39A6 NM_012319.2 
182 TMEM45B NM_138788.3 
183 TYMS NM_001071.1 
184 UBE2C NM_007019.2 
185 - Table 2 provides select sequences for the NANO46 genes of Table 1.
Table 2 GENBANK ACCESSION NUMBER SEQUENCE SEQ ID NO: NM_020445 
93 NM_001040135 
94 
NM_018685 
95 
NM_004323 
96 
NM_000633 
97 
BX647539 
98 
BC035498 
99 BG256659 
100 
NM_001254 
101 NM_031423 
102 
BC041846 
103 
NM_016343 
104 

AB091343 
105 BC006428 
106 
NM_005228 
107 
NM_001005862 
108 
NM_001122742 
109 
NM_130398 
110 
AB209631 
111 
NM_004496 
112 
NM_001453 
113 
AJ249248 
114 NM_014176 
115 NM_006845 
116 
NM_006101 
117 BC042437 
118 
AK095281 
119 M21389 
120 
NM_001123066 
121 
M92424 
122 
NM_014791 
123 BG765502 
124 
NM_002417 
125 

NM_024101 
126 
NM_005940 
127 
NM_002467 
128 BC013732 
129 NM_014321 
130 
NM_000926 
131 


AK093306 
132 BE904476 
133 AK123010 
134 
BC036503 
135 
NM_012319 
136 
AK098106 
137 BQ056428 
138 
BC032677 
139 - At least 40, at least 41, at least 42, at least 43, at least 44, at least 46 or all 46 of the genes in Table 1 can be utilized in the methods of the disclosure. Preferably, the expression of each of the 46 genes is determined in a biological sample. The prototypical gene expression profiles (i.e. centroid) of the four intrinsic subtypes were pre-defined from a training set of FFPE breast tumor samples using hierarchical clustering analysis of gene expression data. A heatmap of the prototypical gene expression profiles (i.e. centroids) of these four subtypes is shown in
Figure 1 , where the level of expression is illustrated by the heatmap. Table 3 shows the actual values.Table 3. Tumor Subtype Centroids for Comparison to a Sample Target Gene Basal-like Her2-enriched Luminal A Luminal B ACTR3B -0.2052 -0.7965 -0.2790 -0.4380 ANLN 1.0227 0.5006 -0.7289 0.1149 BAG1 -0.4676 -0.3132 0.4716 0.5879 BCL2 -0.7365 -0.7237 0.7234 0.6363 BLVRA -0.8761 0.2270 0.1628 0.7138 CCNE1 1.3100 0.2201 -0.6231 -0.2729 CDC20 1.0995 0.1445 -1.0518 -0.1173 CDC6 0.5817 0.6601 -0.7032 0.3134 CDCA1 0.9367 0.1623 -0.4509 0.2692 CDH3 0.7639 0.0144 -0.0502 -1.0229 CENPF 1.0222 0.2944 -0.5657 0.2437 CEP55 1.0442 0.4881 -0.6365 0.2921 CXXC5 -0.9732 0.1866 0.5687 0.9463 EGFR 0.3352 -0.1326 -0.0011 -0.9755 ERBB2 -0.7045 1.4182 0.2420 0.1978 ESR1 -1.1847 -0.4926 0.7177 1.0101 EXO1 1.0546 0.4317 -0.7259 0.2559 FGFR4 -0.2073 1.4562 0.1707 -0.2223 FOXA1 -1.3590 0.5726 0.7131 0.7963 FOXC1 1.0666 -0.7362 -0.4078 -0.9877 GPR160 -1.0540 0.5524 0.6032 0.7305 KIF2C 0.9242 0.1104 -1.1001 -0.2771 KNTC2 1.1373 0.2266 -0.7593 0.1656 KRT14 0.4759 -0.5269 0.8187 -0.8879 KRT17 0.6863 -0.3777 0.6149 -1.1415 KRT5 0.7136 -0.4146 0.5832 -0.9462 MAPT -1.1343 -0.2711 1.0957 0.8372 MDM2 -0.7498 -0.4855 -0.1788 0.2397 MELK 1.0209 0.2678 -0.8016 0.1012 MIA 1.2408 -0.5475 0.3289 -0.6320 MKI67 1.0446 0.4630 -0.6717 0.3161 MLPH -1.4150 0.4842 0.8829 0.8194 MMP11 -0.1295 0.5220 0.3402 0.5653 MYC 0.5639 -0.9904 -0.3015 -0.2791 NAT1 -0.9711 -0.2708 1.2256 0.9576 ORC6L 1.0086 0.5152 -1.0385 -0.0336 PGR -0.9216 -0.5755 1.2061 0.9278 PHGDH 0.9192 0.0322 -0.5194 -0.5371 PTTG1 0.9541 0.2079 -1.1207 0.1052 RRM2 0.7895 0.6336 -0.8099 0.3228 SFRP1 0.7694 -0.8271 0.2617 -1.0846 SLC39A6 -0.9992 -0.4573 0.6607 0.9222 TMEM45B -1.0721 0.7926 0.3190 0.2016 TYMS 0.9823 -0.0960 -0.8593 0.1827 UBE2C 0.8294 0.3358 -1.0141 0.0608 UBE2T 0.6258 0.0617 -0.8652 -0.0487 - After performing the Breast Cancer Intrinsic Subtyping test with a test breast cancer tumor sample and the reference sample provided as part of the test kit, a computational algorithm based on a Pearson's correlation compares the normalized and scaled gene expression profile of the NANO46 intrinsic gene set of the test sample to the prototypical expression signatures of the four breast cancer intrinsic subtypes. The intrinsic subtype analysis is determined by determining the expression of a NANO50 set of genes (which is determining the expression of the NANO46 set of genes and further includes determining the expression of MYBL2, BIRC5, GRB7 and CCNB1) and the risk of recurrence ("ROR") is determined using the NANO46 set of genes). Specifically, the intrinsic subtype is identified by comparing the expression of the NANO50 set of genes in the biological sample with the expected expression profiles for the four intrinsic subtypes. The subtype with the most similar expression profile is assigned to the biological sample. The ROR score is an integer value on a 0-100 scale that is related to an individual patient's probability of distant recurrence within 10 years for the defined intended use population. The ROR score is calculated by comparing the expression profiles of the NANO46 genes in the biological sample with the expected profiles for the four intrinsic subtypes, as described above, to calculate four different correlation values. These correlation values are then combined with a proliferation score (and optionally one or more clinicopathological variables, such as tumor size) to calculate the ROR score. Preferably, the ROR score is calculated by comparing only the expression profiles of the NANO46 genes.
-
Figure 6 provides a schematic of the specific algorithm transformations. The tumor sample is assigned the subtype with the largest positive correlation to the sample. Kaplan Meier survival curves generated from a training set of untreated breast cancer patients demonstrate that the intrinsic subtypes are a prognostic indicator of recurrence free survival (RFS) in this test population, which includes both estrogen receptor positive/negative and HER2 positive/negative patients,Figure 2 . - Independent testing on a cohort of node negative, estrogen receptor positive patients treated with tamoxifen shows predominantly Luminal A and B subtype patients with Luminal A patients exhibiting better outcome than Luminal B patients,
Figure 3 . The outcome of Luminal A patients is expected to improve even further using clinical trial specimens that use more modern treatment regimens (i.e. aromatase inhibitors) and have better adherence to therapy which will improve outcome - The training set of FFPE breast tumor samples, which had well defined clinical characteristics and clinical outcome data, were used to establish a continuous Risk of Recurrence (ROR) score. The score is calculated using coefficients from a Cox model that includes correlation to each intrinsic subtype, a proliferation score (mean gene expression of a subset of 18 of the 46 genes), and tumor size, Table 4.
Table 4. Coefficients to calculate ROR-PT (equation 1) Test Variables Coefficient Basal-like Pearson's correlation (A) - 0.0067 Her2-enriched Pearson's correlation (B) 0.4317 Luminal A Pearson's correlation (C) - 0.3172 Luminal B Pearson's correlation (D) 0.4894 Proliferation Score (E) 0.1981 Tumor Size (F) 0.1133 - The test variables in Table 4 are multiplied by the corresponding coefficients and summed to produce a risk score ("ROR-PT").

- In previous studies, the ROR score provided a continuous estimate of the risk of recurrence for ER-positive, node-negative patients who were treated with tamoxifen for 5 years (Nielsen et al. Clin. Cancer Res., 16(21):5222-5232 (2009)). This result was verified on ER-positive, node-negative patients from the same cohort,
Figure 4 . The ROR score also exhibited a statistically significant improvement over a clinical model based in determining RFS within this test population providing further evidence of the improved accuracy of this decision making tool when compared to traditional clinicopathological measures (Nielsen et al. Clin. Cancer Res., 16(21):5222-5232 (2009)). - The gene set contains many genes that are known markers for proliferation. The methods disclosed herein provide for the determination of subsets of genes that provide a proliferation signature. The methods can include determining the expression of at least one of, a combination of, or each of, a 18-gene subset of the NANO46 intrinsic genes selected from ANLN, CCNE1, CDC20, CDC6, CDCA1, CENPF, CEP55, EXOl, KIF2C, KNTC2, MELK, MKI67, ORC6L, PTTG1, RRM2, TYMS, UBE2C and/or UBE2T. Preferably, the expression of each of the 18-gene subset of the NANO46 gene set is determined to provide a proliferation score. The expression of one or more of these genes may be determined and a proliferation signature index can be generated by averaging the normalized expression estimates of one or more of these genes in a sample. The sample can be assigned a high proliferation signature, a moderate/intermediate proliferation signature, a low proliferation signature or an ultra-low proliferation signature. Methods of determining a proliferation signature from a biological sample are as described in Nielsen et al. Clin. Cancer Res., 16(21):5222-5232 (2009) and supplemental online material.
- Luminal subtypes: The most common subtypes of breast cancer are the luminal subtypes, Luminal A and Luminal B. Prior studies suggest that luminal A comprises approximately 30% to 40% and luminal B approximately 20% of all breast cancers, but they represent over 90 % of hormone receptor positive breast cancers (Nielsen et al. Clin. Cancer Res., 16(21):5222-5232 (2009)). The gene expression pattern of these subtypes resembles the luminal epithelial component of the breast. These tumors are characterized by high expression of estrogen receptor (ER), progesterone receptor (PR), and genes associated with ER activation, such as LIV1, GATA3, and cyclin D1, as well as expression of luminal cytokeratins 8 and 18 (Lisa Carey & Charles Perou (2009). Gene Arrays, Prognosis, and Therapeutic Interventions. Jay R. Harris et al. (4th ed.), Diseases of the breast (pp. 458-472). Philadelphia, PA: Lippincott Williams & Wilkins).
- Luminal A: Luminal A (LumA) breast cancers exhibit low expression of genes associated with cell cycle activation and the ERBB2 cluster resulting in a better prognosis than Luminal B. The Luminal A subgroup has the most favorable prognosis of all subtypes and is enriched for endocrine therapy-responsive tumors.
- Luminal B: Luminal B (LumB) breast cancers also express ER and ER-associated genes. Genes associated with cell cycle activation are highly expressed and this tumor type can be HER2(+) (∼20%) or HER2(-). The prognosis is unfavorable (despite ER expression) and endocrine therapy responsiveness is generally diminished relative to LumA.
- HER2-enriched: The HER2-enriched subtype is generally ER-negative and is HER2-positive in the majority of cases with high expression of the ERBB2 cluster, including ERBB2 and GRB7. Genes associated with cell cycle activation are highly expressed and these tumors have a poor outcome.
- Basal-like: The Basal-like subtype is generally ER-negative, is almost always clinically HER2-negative and expresses a suite of "basal" biomarkers including the basal epithelial cytokeratins (CK) and epidermal growth factor receptor (EGFR). Genes associated with cell cycle activation are highly expressed.
- The NANO46 classification model described herein may be further combined with information on clinical variables to generate a continuous risk of recurrence (ROR) predictor. As described herein, a number of clinical and prognostic breast cancer factors are known in the art and are used to predict treatment outcome and the likelihood of disease recurrence. Such factors include, for example, lymph node involvement, tumor size, histologic grade, estrogen and progesterone hormone receptor status, HER-2 levels, and tumor ploidy. In one embodiment, risk of recurrence (ROR) score is provided for a subject diagnosed with or suspected of having breast cancer. This score uses the NANO46 classification model in combination with clinical factors of lymph node status (N) and tumor size (T). Assessment of clinical variables is based on the American Joint Committee on Cancer (AJCC) standardized system for breast cancer staging. In this system, primary tumor size is categorized on a scale of 0-4 (TO: no evidence of primary tumor; T1 : < 2 cm; T2: > 2 cm - < 5 cm; T3 : > 5 cm; T4: tumor of any size with direct spread to chest wall or skin). Lymph node status is classified as N0-N3 (NO: regional lymph nodes are free of metastasis; N1 : metastasis to movable, same-side axillary lymph node(s); N2: metastasis to same-side lymph node(s) fixed to one another or to other structures; N3: metastasis to same-side lymph nodes beneath the breastbone). Methods of identifying breast cancer patients and staging the disease are well known and may include manual examination, biopsy, review of patient's and/or family history, and imaging techniques, such as mammography, magnetic resonance imaging (MRI), and positron emission tomography (PET).
- In one embodiment of the present disclosure, breast cancer subtype is assessed through the evaluation of expression patterns, or profiles, of the intrinsic genes listed in Table 1 in one or more subject samples. For the purpose of discussion, the term subject, or subject sample, refers to an individual regardless of health and/or disease status. A subject can be a subject, a study participant, a control subject, a screening subject, or any other class of individual from whom a sample is obtained and assessed in the context of the disclosure. Accordingly, a subject can be diagnosed with breast cancer, can present with one or more symptoms of breast cancer, or a predisposing factor, such as a family (genetic) or medical history (medical) factor, for breast cancer, can be undergoing treatment or therapy for breast cancer, or the like. Alternatively, a subject can be healthy with respect to any of the aforementioned factors or criteria. It will be appreciated that the term "healthy" as used herein, is relative to breast cancer status, as the term "healthy" cannot be defined to correspond to any absolute evaluation or status. Thus, an individual defined as healthy with reference to any specified disease or disease criterion, can in fact be diagnosed with any other one or more diseases, or exhibit any other one or more disease criterion, including one or more cancers other than breast cancer. However, the healthy controls are preferably free of any cancer.
- In particular embodiments, the methods for predicting breast cancer intrinsic subtypes include collecting a biological sample comprising a cancer cell or tissue, such as a breast tissue sample or a primary breast tumor tissue sample. By "biological sample" is intended any sampling of cells, tissues, or bodily fluids in which expression of an intrinsic gene can be detected. Examples of such biological samples include, but are not limited to, biopsies and smears. Bodily fluids useful in the present disclosure include blood, lymph, urine, saliva, nipple aspirates, gynecological fluids, or any other bodily secretion or derivative thereof. Blood can include whole blood, plasma, serum, or any derivative of blood. In some embodiments, the biological sample includes breast cells, particularly breast tissue from a biopsy, such as a breast tumor tissue sample. Biological samples may be obtained from a subject by a variety of techniques including, for example, by scraping or swabbing an area, by using a needle to aspirate cells or bodily fluids, or by removing a tissue sample (i.e., biopsy). Methods for collecting various biological samples are well known in the art. In some embodiments, a breast tissue sample is obtained by, for example, fine needle aspiration biopsy, core needle biopsy, or excisional biopsy. Fixative and staining solutions may be applied to the cells or tissues for preserving the specimen and for facilitating examination. Biological samples, particularly breast tissue samples, may be transferred to a glass slide for viewing under magnification. In one embodiment, the biological sample is a formalin-fixed, paraffin-embedded breast tissue sample, particularly a primary breast tumor sample. In various embodiments, the tissue sample is obtained from a pathologist-guided tissue core sample.
- In various embodiments, the present disclosure provides methods for classifying, prognosticating, or monitoring breast cancer in subjects. In this embodiment, data obtained from analysis of intrinsic gene expression is evaluated using one or more pattern recognition algorithms. Such analysis methods may be used to form a predictive model, which can be used to classify test data. For example, one convenient and particularly effective method of classification employs multivariate statistical analysis modeling, first to form a model (a "predictive mathematical model") using data ("modeling data") from samples of known subtype (e.g., from subjects known to have a particular breast cancer intrinsic subtype: LumA, LumB, Basal-like, HER2-enriched, or normal-like), and second to classify an unknown sample (e.g., "test sample") according to subtype. Pattern recognition methods have been used widely to characterize many different types of problems ranging, for example, over linguistics, fingerprinting, chemistry and psychology. In the context of the methods described herein, pattern recognition is the use of multivariate statistics, both parametric and non-parametric, to analyze data, and hence to classify samples and to predict the value of some dependent variable based on a range of observed measurements. There are two main approaches. One set of methods is termed "unsupervised" and these simply reduce data complexity in a rational way and also produce display plots which can be interpreted by the human eye. However, this type of approach may not be suitable for developing a clinical assay that can be used to classify samples derived from subjects independent of the initial sample population used to train the prediction algorithm.
- The other approach is termed "supervised" whereby a training set of samples with known class or outcome is used to produce a mathematical model which is then evaluated with independent validation data sets. Here, a "training set" of intrinsic gene expression data is used to construct a statistical model that predicts correctly the "subtype" of each sample. This training set is then tested with independent data (referred to as a test or validation set) to determine the robustness of the computer-based model. These models are sometimes termed "expert systems," but may be based on a range of different mathematical procedures. Supervised methods can use a data set with reduced dimensionality (for example, the first few principal components), but typically use unreduced data, with all dimensionality. In all cases the methods allow the quantitative description of the multivariate boundaries that characterize and separate each subtype in terms of its intrinsic gene expression profile. It is also possible to obtain confidence limits on any predictions, for example, a level of probability to be placed on the goodness of fit. The robustness of the predictive models can also be checked using cross-validation, by leaving out selected samples from the analysis.
- The NANO46 classification model described herein is based on the gene expression profile for a plurality of subject samples using the intrinsic genes listed in Table 1. The plurality of samples includes a sufficient number of samples derived from subjects belonging to each subtype class. By "sufficient samples" or "representative number" in this context is intended a quantity of samples derived from each subtype that is sufficient for building a classification model that can reliably distinguish each subtype from all others in the group. A supervised prediction algorithm is developed based on the profiles of objectively-selected prototype samples for "training" the algorithm. The samples are selected and subtyped using an expanded intrinsic gene set according to the methods disclosed in International Patent Publication
WO 2007/061876 andUS Patent Publication No. 2009/0299640 . Alternatively, the samples can be subtyped according to any known assay for classifying breast cancer subtypes. After stratifying the training samples according to subtype, a centroid-based prediction algorithm is used to construct centroids based on the expression profile of the intrinsic gene set described in Table 1. - In one embodiment, the prediction algorithm is the nearest centroid methodology related to that described in Narashiman and Chu (2002) PNAS 99:6567-6572. In the present disclosure, the method computes a standardized centroid for each subtype. This centroid is the average gene expression for each gene in each subtype (or "class") divided by the within-class standard deviation for that gene. Nearest centroid classification takes the gene expression profile of a new sample, and compares it to each of these class centroids. Subtype prediction is done by calculating the Spearman's rank correlation of each test case to the five centroids, and assigning a sample to a subtype based on the nearest centroid.
- Any methods available in the art for detecting expression of the intrinsic genes listed in Table 1 are encompassed herein. By "detecting expression" is intended determining the quantity or presence of an RNA transcript or its expression product of an intrinsic gene. Methods for detecting expression of the intrinsic genes of the disclosure, that is, gene expression profiling, include methods based on hybridization analysis of polynucleotides, methods based on sequencing of polynucleotides, immunohistochemistry methods, and proteomics-based methods. The methods generally detect expression products (e.g., mRNA) of the intrinsic genes listed in Table 1. In preferred embodiments, PCR-based methods, such as reverse transcription PCR (RT-PCR) (Weis et al., TIG 8:263- 64, 1992), and array-based methods such as microarray (Schena et al., Science 270:467- 70, 1995) are used. By "microarray" is intended an ordered arrangement of hybridizable array elements, such as, for example, polynucleotide probes, on a substrate. The term "probe" refers to any molecule that is capable of selectively binding to a specifically intended target biomolecule, for example, a nucleotide transcript or a protein encoded by or corresponding to an intrinsic gene. Probes can be synthesized by one of skill in the art, or derived from appropriate biological preparations. Probes may be specifically designed to be labeled. Examples of molecules that can be utilized as probes include, but are not limited to, RNA, DNA, proteins, antibodies, and organic molecules.
- Many expression detection methods use isolated RNA. The starting material is typically total RNA isolated from a biological sample, such as a tumor or tumor cell line, and corresponding normal tissue or cell line, respectively. If the source of RNA is a primary tumor, RNA (e.g., mRNA) can be extracted, for example, from frozen or archived paraffin-embedded and fixed (e.g., formalin-fixed) tissue samples (e.g., pathologist-guided tissue core samples).
- General methods for RNA extraction are well known in the art and are disclosed in standard textbooks of molecular biology, including Ausubel et al., ed., Current Protocols in Molecular Biology, John Wiley & Sons, New York 1987-1999. Methods for RNA extraction from paraffin embedded tissues are disclosed, for example, in Rupp and Locker, Lab Invest. 56:A67, (1987); and De Andres et al. Biotechniques 18:42-44, (1995). In particular, RNA isolation can be performed using a purification kit, a buffer set and protease from commercial manufacturers, such as Qiagen (Valencia, CA), according to the manufacturer's instructions. For example, total RNA from cells in culture can be isolated using Qiagen RNeasy mini-columns. Other commercially available RNA isolation kits include MASTERPURE™ Complete DNA and RNA Purification Kit (Epicentre, Madison, Wis.) and Paraffin Block RNA Isolation Kit (Ambion, Austin, TX). Total RNA from tissue samples can be isolated, for example, using RNA Stat-60 (Tel-Test, Friendswood, TX). Total RNA from FFPE can be isolated, for example, using High Pure FFPE RNA Microkit, Cat No. 04823125001 (Roche Applied Science, Indianapolis, IN). RNA prepared from a tumor can be isolated, for example, by cesium chloride density gradient centrifugation. Additionally, large numbers of tissue samples can readily be processed using techniques well known to those of skill in the art, such as, for example, the single-step RNA isolation process of
Chomczynski (U.S. Pat. No. 4,843,155 ). - Isolated RNA can be used in hybridization or amplification assays that include, but are not limited to, PCR analyses and probe arrays. One method for the detection of RNA levels involves contacting the isolated RNA with a nucleic acid molecule (probe) that can hybridize to the mRNA encoded by the gene being detected. The nucleic acid probe can be, for example, a full-length cDNA, or a portion thereof, such as an oligonucleotide of at least 7, 15, 30, 60, 100, 250, or 500 nucleotides in length and sufficient to specifically hybridize under stringent conditions to an intrinsic gene of the present disclosure, or any derivative DNA or RNA. Hybridization of an mRNA with the probe indicates that the intrinsic gene in question is being expressed.
- In one embodiment, the mRNA is immobilized on a solid surface and contacted with a probe, for example by running the isolated mRNA on an agarose gel and transferring the mRNA from the gel to a membrane, such as nitrocellulose. In an alternative embodiment, the probes are immobilized on a solid surface and the mRNA is contacted with the probes, for example, in an Agilent gene chip array. A skilled artisan can readily adapt known mRNA detection methods for use in detecting the level of expression of the intrinsic genes of the present disclosure.
- An alternative method for determining the level of intrinsic gene expression product in a sample involves the process of nucleic acid amplification, for example, by RT-PCR (
U.S. Pat. No. 4,683,202 ), ligase chain reaction (Barany, PNAS USA 88: 189-93, (1991)), self sustained sequence replication (Guatelli et al., Proc. Natl. Acad. Sci USA 87: 1874-78, (1990)), transcriptional amplification system (Kwoh et al., Proc. Natl. Acad. ScL USA 86: 1173-77, (1989)), Q-Beta Replicase (Lizardi et al., Bio/Technology 6:1197, (1988)), rolling circle replication (U.S. Pat. No. 5,854,033 ), or any other nucleic acid amplification method, followed by the detection of the amplified molecules using techniques well known to those of skill in the art. These detection schemes are especially useful for the detection of nucleic acid molecules if such molecules are present in very low numbers. - In particular aspects of the disclosure, intrinsic gene expression is assessed by quantitative RT-PCR. Numerous different PCR or QPCR protocols are known in the art and exemplified herein below and can be directly applied or adapted for use using the presently-described compositions for the detection and/or quantification of the intrinsic genes listed in Table 1. Generally, in PCR, a target polynucleotide sequence is amplified by reaction with at least one oligonucleotide primer or pair of oligonucleotide primers. The primer(s) hybridize to a complementary region of the target nucleic acid and a DNA polymerase extends the primer(s) to amplify the target sequence. Under conditions sufficient to provide polymerase-based nucleic acid amplification products, a nucleic acid fragment of one size dominates the reaction products (the target polynucleotide sequence which is the amplification product). The amplification cycle is repeated to increase the concentration of the single target polynucleotide sequence. The reaction can be performed in any thermocycler commonly used for PCR. However, preferred are cyclers with real time fluorescence measurement capabilities, for example, SMARTCYCLER® (Cepheid, Sunnyvale, CA), ABI PRISM 7700® (Applied Biosystems, Foster City, Calif.), ROTOR- GENE™ (Corbett Research, Sydney, Australia), LIGHTCYCLER® (Roche Diagnostics Corp, Indianapolis, Ind.), ICYCLER® (Biorad Laboratories, Hercules, Calif.) and MX4000® (Stratagene, La Jolla, Calif.).
- In another embodiment of the disclosure, microarrays are used for expression profiling. Microarrays are particularly well suited for this purpose because of the reproducibility between different experiments. DNA microarrays provide one method for the simultaneous measurement of the expression levels of large numbers of genes. Each array consists of a reproducible pattern of capture probes attached to a solid support. Labeled RNA or DNA is hybridized to complementary probes on the array and then detected by laser scanning. Hybridization intensities for each probe on the array are determined and converted to a quantitative value representing relative gene expression levels. See, for example,
U.S. Pat. Nos. 6,040,138 ,5,800,992 and6,020,135 ,6,033,860 , and6,344,316 . High-density oligonucleotide arrays are particularly useful for determining the gene expression profile for a large number of RNAs in a sample. - In a preferred embodiment, the nCounter® Analysis system is used to detect intrinsic gene expression. The basis of the nCounter® Analysis system is the unique code assigned to each nucleic acid target to be assayed (International Patent Application Publication No.
WO 08/124847 US Patent No. 8,415,102 and Geiss et al. Nature Biotechnology. 2008. 26(3): 317-325). The code is composed of an ordered series of colored fluorescent spots which create a unique barcode for each target to be assayed. A pair of probes is designed for each DNA or RNA target, a biotinylated capture probe and a reporter probe carrying the fluorescent barcode. This system is also referred to, herein, as the nanoreporter code system. - Specific reporter and capture probes are synthesized for each target. Briefly, sequence-specific DNA oligonucleotide probes are attached to code-specific reporter molecules. Preferably, each sequence specific reporter probe comprises a target specifc sequence capable of hybriding to no more than one NANO46 gene of Table 1 and optionally comprises at least two, at least three, or at least four label attachment regions, said attachment regions comprising one or more label monomers that emit light. Capture probes are made by ligating a second sequence-specific DNA oligonucleotide for each target to a universal oligonucleotide containing biotin. Reporter and capture probes are all pooled into a single hybridization mixture, the "probe library". Preferably, the probe library comprises a probe pair (a capture probe and reporter) for each of the NANO46 genes in Table 1.
- The relative abundance of each target is measured in a single multiplexed hybridization reaction. The method comprises contacting a biological sample with a probe library, the library comprising a probe pair for the NANO46 genes in Table 1, such that the presence of the target in the sample creates a probe pair - target complex. The complex is then purified. More specifically, the sample is combined with the probe library, and hybridization occurs in solution. After hybridization, the tripartite hybridized complexes (probe pairs and target) are purified in a two-step procedure using magnetic beads linked to oligonucleotides complementary to universal sequences present on the capture and reporter probes. This dual purification process allows the hybridization reaction to be driven to completion with a large excess of target-specific probes, as they are ultimately removed, and, thus, do not interfere with binding and imaging of the sample. All post hybridization steps are handled robotically on a custom liquid-handling robot (Prep Station, NanoString Technologies).
- Purified reactions are deposited by the Prep Station into individual flow cells of a sample cartridge, bound to a streptavidin-coated surface via the capture probe, electrophoresed to elongate the reporter probes, and immobilized. After processing, the sample cartridge is transferred to a fully automated imaging and data collection device (Digital Analyzer, NanoString Technologies). The expression level of a target is measured by imaging each sample and counting the number of times the code for that target is detected. Data is output in simple spreadsheet format listing the number of counts per target, per sample.
- This system can be used along with nanoreporters. Additional disclosure regarding nanoreporters can be found in International Publication No.
WO 07/076129 WO 07/076132 US Patent Publication No. 2010/0015607 and2010/0261026 . Further, the term nucleic acid probes and nanoreporters can include the rationally designed (e.g. synthetic sequences) described in International Publication No.WO 2010/019826 andUS Patent Publication No. 2010/0047924 . - It is often useful to pre-process gene expression data, for example, by addressing missing data, translation, scaling, normalization, weighting, etc. Multivariate projection methods, such as principal component analysis (PCA) and partial least squares analysis (PLS), are so-called scaling sensitive methods. By using prior knowledge and experience about the type of data studied, the quality of the data prior to multivariate modeling can be enhanced by scaling and/or weighting. Adequate scaling and/or weighting can reveal important and interesting variation hidden within the data, and therefore make subsequent multivariate modeling more efficient. Scaling and weighting may be used to place the data in the correct metric, based on knowledge and experience of the studied system, and therefore reveal patterns already inherently present in the data.
- If possible, missing data, for example gaps in column values, should be avoided. However, if necessary, such missing data may replaced or "filled" with, for example, the mean value of a column ("mean fill"); a random value ("random fill"); or a value based on a principal component analysis ("principal component fill").
- "Translation" of the descriptor coordinate axes can be useful. Examples of such translation include normalization and mean centering. "Normalization" may be used to remove sample-to-sample variation. For microarray data, the process of normalization aims to remove systematic errors by balancing the fluorescence intensities of the two labeling dyes. The dye bias can come from various sources including differences in dye labeling efficiencies, heat and light sensitivities, as well as scanner settings for scanning two channels. Some commonly used methods for calculating normalization factor include: (i) global normalization that uses all genes on the array; (ii) housekeeping genes normalization that uses constantly expressed housekeeping/invariant genes; and (iii) internal controls normalization that uses known amount of exogenous control genes added during hybridization (Quackenbush Nat. Genet. 32 (Suppl.), 496-501 (2002)). In one embodiment, the intrinsic genes disclosed herein can be normalized to control housekeeping genes. For example, the housekeeping genes described in
U.S. Patent Publication 2008/0032293 can be used for normalization. Exemplary housekeeping genes include MRPL19, PSMC4, SF3A1, PUM1, ACTB, GAPD, GUSB, RPLPO, and TFRC. It will be understood by one of skill in the art that the methods disclosed herein are not bound by normalization to any particular housekeeping genes, and that any suitable housekeeping gene(s) known in the art can be used. - Many normalization approaches are possible, and they can often be applied at any of several points in the analysis. In one embodiment, microarray data is normalized using the LOWESS method, which is a global locally weighted scatter plot smoothing normalization function. In another embodiment, qPCR data is normalized to the geometric mean of set of multiple housekeeping genes.
- "Mean centering" may also be used to simplify interpretation. Usually, for each descriptor, the average value of that descriptor for all samples is subtracted. In this way, the mean of a descriptor coincides with the origin, and all descriptors are "centered" at zero. In "unit variance scaling," data can be scaled to equal variance. Usually, the value of each descriptor is scaled by 1/StDev, where StDev is the standard deviation for that descriptor for all samples. "Pareto scaling" is, in some sense, intermediate between mean centering and unit variance scaling. In pareto scaling, the value of each descriptor is scaled by 1/sqrt(StDev), where StDev is the standard deviation for that descriptor for all samples. In this way, each descriptor has a variance numerically equal to its initial standard deviation. The pareto scaling may be performed, for example, on raw data or mean centered data.
- "Logarithmic scaling" may be used to assist interpretation when data have a positive skew and/or when data spans a large range, e.g., several orders of magnitude. Usually, for each descriptor, the value is replaced by the logarithm of that value. In "equal range scaling," each descriptor is divided by the range of that descriptor for all samples. In this way, all descriptors have the same range, that is, 1. However, this method is sensitive to presence of outlier points. In "autoscaling," each data vector is mean centered and unit variance scaled. This technique is a very useful because each descriptor is then weighted equally, and large and small values are treated with equal emphasis. This can be important for genes expressed at very low, but still detectable, levels.
- In one embodiment, data is collected for one or more test samples and classified using the NANO46 classification model described herein. When comparing data from multiple analyses (e.g., comparing expression profiles for one or more test samples to the centroids constructed from samples collected and analyzed in an independent study), it will be necessary to normalize data across these data sets. In one embodiment, Distance Weighted Discrimination (DWD) is used to combine these data sets together (Benito et al. (2004) Bioinformatics 20(1): 105-114). DWD is a multivariate analysis tool that is able to identify systematic biases present in separate data sets and then make a global adjustment to compensate for these biases; in essence, each separate data set is a multi-dimensional cloud of data points, and DWD takes two points clouds and shifts one such that it more optimally overlaps the other.
- The methods described herein may be implemented and/or the results recorded using any device capable of implementing the methods and/or recording the results. Examples of devices that may be used include but are not limited to electronic computational devices, including computers of all types. When the methods described herein are implemented and/or recorded in a computer, the computer program that may be used to configure the computer to carry out the steps of the methods may be contained in any computer readable medium capable of containing the computer program. Examples of computer readable medium that may be used include but are not limited to diskettes, CD- ROMs, DVDs, ROM, RAM, and other memory and computer storage devices. The computer program that may be used to configure the computer to carry out the steps of the methods and/or record the results may also be provided over an electronic network, for example, over the internet, an intranet, or other network.
- Provided herein are methods for predicting breast cancer outcome within the context of the intrinsic subtype and optionally other clinical variables. Outcome may refer to overall or disease-specific survival, event-free survival, or outcome in response to a particular treatment or therapy. In particular, the methods may be used to predict the likelihood of long-term, disease-free survival. "Predicting the likelihood of survival of a breast cancer patient" is intended to assess the risk that a patient will die as a result of the underlying breast cancer. "Long-term, disease-free survival" is intended to mean that the patient does not die from or suffer a recurrence of the underlying breast cancer within a period of at least five years, or at least ten or more years, following initial diagnosis or treatment.
- In one embodiment, outcome is predicted based on classification of a subject according to subtype. In addition to providing a subtype assignment, the NANO46 bioinformatics model provides a measurement of the similarity of a test sample to all four subtypes which is translated into a Risk of Recurrence (ROR) score that can be used in any patient population regardless of disease status and treatment options. The intrinsic subtypes and ROR also have value in the prediction of pathological complete response in women treated with, for example, neoadjuvant taxane and anthracycline chemotherapy (Rouzier et al., J Clin Oncol 23:8331-9 (2005)). Thus, in various embodiments of the present disclosure, a risk of recurrence (ROR) model is used to predict outcome. Using these risk models, subjects can be stratified into low, medium, and high risk of recurrence groups. Calculation of ROR can provide prognostic information to guide treatment decisions and/or monitor response to therapy.
- In some embodiments described herein, the prognostic performance of the NANO46-defined intrinsic subtypes and/or other clinical parameters is assessed utilizing a Cox Proportional Hazards Model Analysis, which is a regression method for survival data that provides an estimate of the hazard ratio and its confidence interval. The Cox model is a well-recognized statistical technique for exploring the relationship between the survival of a patient and particular variables. This statistical method permits estimation of the hazard (i.e., risk) of individuals given their prognostic variables (e.g., intrinsic gene expression profile with or without additional clinical factors, as described herein). The "hazard ratio" is the risk of death at any given time point for patients displaying particular prognostic variables. See generally Spruance et al., Antimicrob. Agents & Chemo. 48:2787-92 (2004).
- The NANO46 classification model described herein can be trained for risk of recurrence using subtype distances (or correlations) alone, or using subtype distances with clinical variables as discussed supra. In one embodiment, the risk score for a test sample is calculated using intrinsic subtype distances alone using the following equation:
- ROR = 0.05∗Basal + 0.11∗Her2 + -0.25∗LumA + 0.07∗LumB + -0.11∗Normal, where the variables "Basal," "Her2," "LumA," "LumB," and "Normal" are the distances to the centroid for each respective classifier when the expression profile from a test sample is compared to centroids constructed using the gene expression data deposited with the Gene Expression Omnibus (GEO).
- Risk score can also be calculated using a combination of breast cancer subtype and the clinical variables tumor size (T) and lymph nodes status (N) using the following equation: ROR (full) = 0.05∗Basal + 0.1∗Her2 + -0.19∗LumA + 0.05∗LumB + - 0.09∗Normal + 0.16∗T + 0.08∗N, again when comparing test expression profiles to centroids constructed using the gene expression data deposited with GEO as accession number GSE2845.
- In yet another embodiment, risk score for a test sample is calculated using intrinsic subtype distances alone using the following equation:
- ROR-S = 0.05∗Basal + 0.12∗Her2 + -0.34∗LumA + 0.0.23∗LumB, where the variables "Basal," "Her2," "LumA," and "LumB" are as described supra and the test expression profiles are compared to centroids constructed using the gene expression data deposited with GEO as accession number GSE2845. In yet another embodiment, risk score can also be calculated using a combination of breast cancer subtype and the clinical variable tumor size (T) using the following equation (where the variables are as described supra): ROR-C = 0.05∗Basal + 0.11∗Her2 + -0.23∗LumA + 0.09∗LumB + 0.17∗T.
- In yet another embodiment, risk score for a test sample is calculated using intrinsic subtype distances in combination with the proliferation signature ("Prolif") using the following equation:
- ROR-P = -0.001∗Basal + 0.7∗Her2 + -0.95∗LumA + 0.49∗LumB + 0.34∗Prolif, where the variables "Basal," "Her2," "LumA," "LumB" and "Prolif" are as described supra and the test expression profiles are compared to centroids constructed using the gene expression data deposited with GEO as accession number GSE2845.
- In yet another embodiment, risk score can also be calculated using a combination of breast cancer subtype, proliferation signature and the clinical variable tumor size (T) using the ROR-PT described in conjunction with Table 3 supra.
- Immunohistochemistry for estrogen (ER), progesterone (PgR), HER2, and Ki67 was performed concurrently on serial sections with the standard streptavidin-biotin complex method with 3,3'-diaminobenzidine as the chromogen. Staining for ER, PgR, and HER2 interpretation can be performed as described previously (Cheang et al., Clin Cancer Res. 2008;14(5): 1368-1376.), however any method known in the art may be used.
- For example, a Ki67 antibody (clone SP6; ThermoScientific, Fremont, CA) can be applied at a 1:200 dilution for 32 minutes, by following the Ventana Benchmark automated immunostainer (Ventana, Tucson AZ) standard Cell Conditioner 1 (CC1, a proprietary buffer) protocol at 98°C for 30 minutes. An ER antibody (clone SP1; ThermoFisher Scientific, Fremont CA) can be used at 1:250 dilution with 10-minute incubation, after an 8-minute microwave antigen retrieval in 10 mM sodium citrate (pH 6.0). Ready-to-use PR antibody (clone 1E2; Ventana) can be used by following the CC1 protocol as above. HER2 staining can be done with a SP3 antibody (ThermoFisher Scientific) at a 1:100 dilution after antigen retrieval in 0.05 M Tris buffer (pH 10.0) with heating to 95°C in a steamer for 30 minutes. For HER2 fluorescent in situ hybridization (FISH) assay, slides can be hybridized with probes to LSI (locus-specific identifier) HER2/neu and to centromere 17 by use of the PathVysion HER-2 DNA Probe kit (Abbott Molecular, Abbott Park, IL) according to manufacturer's instructions, with modifications to pretreatment and hybridization as previously described (Brown LA, Irving J, Parker R, et al. Amplification of EMSY, a novel oncogene on 11q13, in high grade ovarian surface epithelial carcinomas. Gynecol Oncol. 2006;100(2):264-270). Slides can then be counterstained with 4',6-diamidino-2-phenylindole, stained material was visualized on a Zeiss Axioplan epifluorescent microscope, and signals were analyzed with a Metafer image acquisition system (Metasystems, Altlussheim, Germany). Biomarker expression from immunohistochemistry assays can then be scored by two pathologists, who were blinded to the clinicopathological characteristics and outcome and who used previously established and published criteria for biomarker expression levels that had been developed on other breast cancer cohorts.
- Tumors were considered positive for ER or PR if immunostaining was observed in more than 1% of tumor nuclei, as described previously. Tumors were considered positive for HER2 if immunostaining was scored as 3+ according to HercepTest criteria, with an amplification ratio for fluorescent in situ hybridization of 2.0 or more being the cut point that was used to segregate immunohistochemistry equivocal tumors (scored as 2+) (Yaziji, et al., JAMA, 291(16):1972-1977 (2004)). Ki67 was visually scored for percentage of tumor cell nuclei with positive immunostaining above the background level by two pathologists.
- Other methods can also be used to detect subtypes. These techniques include ELISA, Western blots, Northern blots, or FACS analysis.
- The present disclosure also describes kits useful for classifying breast cancer intrinsic subtypes and/or providing prognostic information to identify risk of recurrence These kits comprise a set of capture probes and/or primers specific for the intrinsic genes listed in Table 1. The kit may further comprise a computer readable medium.
- In one embodiment of the present disclosure, the capture probes are immobilized on an array. By "array" is intended a solid support or a substrate with peptide or nucleic acid probes attached to the support or substrate. Arrays typically comprise a plurality of different capture probes that are coupled to a surface of a substrate in different, known locations. The arrays of the disclosure comprise a substrate having a plurality of capture probes that can specifically bind an intrinsic gene expression product. The number of capture probes on the substrate varies with the purpose for which the array is intended. The arrays may be low-density arrays or high-density arrays and may contain 4 or more, 8 or more, 12 or more, 16 or more, 32 or more addresses, but will minimally comprise capture probes for the 46 intrinsic genes listed in Table 1.
- Techniques for the synthesis of these arrays using mechanical synthesis methods are described in, e.g.,
U.S. Patent No. 5,384,261 . The array may be fabricated on a surface of virtually any shape or even a multiplicity of surfaces. Arrays may be probes (e.g., nucleic-acid binding probes) on beads, gels, polymeric surfaces, fibers such as fiber optics, glass or any other appropriate substrate, seeU.S. Pat. Nos. 5,770,358 ,5,789,162 ,5,708,153 ,6,040,193 and5,800,992 . Arrays may be packaged in such a manner as to allow for diagnostics or other manipulation on the device. See, for example,U.S. Pat. Nos. 5,856,174 and5,922,591 . - In another embodiment, the kit comprises a set of oligonucleotide primers sufficient for the detection and/or quantitation of each of the intrinsic genes listed in Table 1. The oligonucleotide primers may be provided in a lyophilized or reconstituted form, or may be provided as a set of nucleotide sequences. In one embodiment, the primers are provided in a microplate format, where each primer set occupies a well (or multiple wells, as in the case of replicates) in the microplate. The microplate may further comprise primers sufficient for the detection of one or more housekeeping genes as discussed infra. The kit may further comprise reagents and instructions sufficient for the amplification of expression products from the genes listed in Table 1.
- In order to facilitate ready access, e.g., for comparison, review, recovery, and/or modification, the molecular signatures/expression profiles are typically recorded in a database. Most typically, the database is a relational database accessible by a computational device, although other formats, e.g., manually accessible indexed files of expression profiles as photographs, analogue or digital imaging readouts, spreadsheets, etc. can be used. Regardless of whether the expression patterns initially recorded are analog or digital in nature, the expression patterns, expression profiles (collective expression patterns), and molecular signatures (correlated expression patterns) are stored digitally and accessed via a database. Typically, the database is compiled and maintained at a central facility, with access being available locally and/or remotely.
- General - The NanoString nCounter Analysis System delivers direct, multiplexed measurements of gene expression through digital readouts of the relative abundance of hundreds of mRNA transcripts. The nCounter Analysis System uses gene-specific probe pairs (
Figure 7 ) that are mixed together to form a single reagent called a CodeSet. The probe pairs hybridize directly to the mRNA sample in solution eliminating any enzymatic reactions that might introduce bias in the results. - After hybridization, all of the sample processing steps are automated on the nCounter Prep Station. First, excess capture and reporter probes are removed (
Figure 8 ) followed by binding of the probe-target complexes to random locations on the surface of the nCounter cartridge via a streptavidin-biotin linkage (Figure 9 ). - Finally, probe/target complexes are aligned and immobilized (
Figure 10 ) in the nCounter Cartridge. The Reporter Probe carries the fluorescent signal; the Capture Probe allows the complex to be immobilized for data collection. Up to 800 pairs of probes, each specific to a particular gene, can be combined with a series of internal controls to form a CodeSet. - After sample processing has completed, cartridges are placed in the nCounter Digital Analyzer for data collection. Each target molecule of interest is identified by the "color code" generated by six ordered fluorescent spots present on the reporter probe. The Reporter Probes on the surface of the cartridge are then counted and tabulated for each target molecule (
Figure 11 ). - Reagents and Test Components - The Breast Cancer test will simultaneously measure the expression levels of NANO46 plus eight housekeeping genes in a single hybridization reaction using an nCounter CodeSet designed specifically to those genes. Each assay also includes positive assay controls comprised of a linear titration of in vitro transcribed RNA transcripts and corresponding probes, and a set of probes with no sequence homology to element, integer or step, or group of elements, integers or steps.
-
Figure 5 outlines the assay processes associated with the Breast Cancer Intrinsic Subtyping test. Following RNA isolation, the test will simultaneously measure the expression levels of 46 target genes plus eight housekeeping genes in a single hybridization reaction using an nCounter CodeSet designed specifically to those genes. For example, the housekeeping genes described inU.S. Patent Publication 2008/0032293 can be used for normalization. Exemplary housekeeping genes include MRPL19, PSMC4, SF3A1, PUM1, ACTB, GAPD, GUSB, RPLP0, and TFRC. The housekeeping genes are used to normalize the expression of the tumor sample. Each assay run also includes a reference sample consisting of in vitro transcribed RNA's of the 58 targets for normalization purposes. - FFPE Tissue Review/Procurement and RNA Extraction: The Breast Cancer Intrinsic Subtyping Test will use RNA extracted from Formalin-fixed, Paraffin-embedded (FFPE) tissue that has been diagnosed as invasive carcinoma of the breast. A Pathologist reviews an H & E stained slide to identify the tissue area containing sufficient tumor tissue content for the test. Unstained slide mounted tissue sections are processed by macro-dissecting the identified tumor area on each slide to remove any adjacent normal tissue. RNA is then isolated from the tumor tissue, and DNA is removed from the sample.
- Assay Setup and Initiation of Hybridization: For each batch of up to 10 RNA samples isolated from a breast tumor, the user will set up a run using the nCounter Analysis x5 system software, which tracks sample processing, reagent lots, and results for each sample. To initiate the assay, the user will pipette the specified amount of RNA into separate tubes within a 12 reaction strip tube and add the CodeSet and hybridization buffer. A reference sample is pipetted into the remaining two tubes with CodeSet and hybridization buffer. The CodeSet consists of probes for each gene that is targeted, additional probes for endogenous "housekeeping" normalization genes and positive and negative controls that are spiked into the assay. The reference sample consists of in vitro transcribed RNA for the targeted genes and housekeeping genes. Once the hybridization reagents are added to the respective tubes, the user transfers the strip tube into a heated-lid heatblock for a specified period of time at a set temperature.
- Purification and Binding on the Prep Station: Upon completing hybridization, the user will transfer the strip tube containing the set of 10 assays and 2 reference samples onto the measurements in a cuvette-type UV-Vis spectrophotometer; therefore, NanoString's protocol includes a step for quantitating total RNA using a low volume spectrophotometer such as the NanoDrop™ spectrophotometer. NanoString will define performance specifications for the spectrophotometer so that the range of RNA input recommended for the test is above the limit of detection of the low volume spectrophotometer and is reproducibly measurable.
- Hybridization - For each set of up to 10 RNA samples, the user will pipette the specified amount of RNA into separate tubes within a 12 reaction strip tube and add the CodeSet and hybridization buffer. A reference sample is pipetted into the remaining two tubes with CodeSet and hybridization buffer. The CodeSet consists of probes for each gene that is targeted, additional probes for endogenous "housekeeping" normalization genes and positive and negative controls. The probes within the CodeSet pertaining to each of these genes within the four groups (target genes, housekeeping genes, and positive and negative controls) are each assigned a unique code and are therefore individually identifiable within each run. The reference sample consists of in vitro transcribed RNA for the targeted genes and housekeeping genes. Once the hybridization reagents are added to the respective tubes, the user transfers the strip tube into a heated-lid heatblock for a specified period of time at a set temperature.
- Requirement for Heat block with heated lid for hybridization step - The nCounter assay includes an overnight hybridization under isothermal conditions. Because the overnight hybridization is performed in a small volume at elevated temperature, care must be taken to avoid evaporation. Many commercial PCR thermocyclers are equipped with heated lids that will prevent the evaporation of small volumes of liquid. Because the assay does not require any fine control of temperature ramping, any heat block with a programmable heated lid and a block with dimensions that fit the NanoString tubes will work with the NanoString assay. NanoString plans to provide specifications for heat blocks that meet the assay requirements.
- Purification and Binding on the Prep Station - Upon completing hybridization, the user will then transfer the strip tube containing the set of 10 assays and 2 reference samples into the nCounter Prep Station along with the required prepackaged reagents and disposables described in Table 1. The Prep Plates contain the necessary reagents for purification of excess probes and binding to the cartridge (see section IIIC below for detailed description of purification process). The prep plates are centrifuged in a swinging bucket centrifuge prior to placement on the deck of the Prep Station. An automated purification process then removes excess capture and reporter probe through two successive hybridization-driven magnetic bead capture steps. The nCounter Prep Station then transfers the purified target/probe complexes into an nCounter cartridge for capture to a glass slide. Following completion of the run, the user removes the cartridge from the Prep Station and seals it with an adhesive film.
- Imaging and Analysis on the Digital Analyzer - The sealed cartridge is then inserted into the nCounter Digital Analyzer which counts the number of probes captured on the slide for each gene, which corresponds to the amount of target in solution. Automated software then checks thresholds for the housekeeping genes, reference sample, and positive and negative controls to qualify each assay and ensure that the procedure was performed correctly. The housekeeping genes provide a measure of RNA integrity, and the thresholds indicate when a tested RNA sample is too degraded to be analyzed by the test due to improper handling or storage of tissue or RNA (e.g. improper tumor fixation, FFPE block storage, RNA storage, RNA handling introducing RNase). The positive and negative assay controls indicate a failure of the assay process (e.g. error in assay setup such as sample mixing with CodeSet, or sample processing such as temperature). The signals of each sample are next normalized using the housekeeping genes to control for input sample quality. The signals are then normalized to the reference sample within each run to control for run-to-run variations. The resulting normalized data is entered in the Breast Cancer Intrinsic Subtyping algorithm to determine tumor intrinsic subtype, risk of relapse score, and risk classification.
- Instrumentation- The nCounter Analysis System is comprised of two instruments, the nCounter Prep Station used for post-hybridization processing, and the Digital Analyzer used for data collection and analysis.
- nCounter Prep Station - The nCounter Prep Station (
Figure 13 ) is an automated fluid handling robot that processes samples post-hybridization to prepare them for data collection on the nCounter Digital Analyzer. Prior to processing on the Prep Station, total RNA extracted from FFPE (Formalin-Fixed, Paraffin-Embedded) tissue samples is hybridized with the NanoString Reporter Probes and Capture Probes according to the nCounter protocol described above. - Hybridization to the target RNA is driven by excess NanoString probes. To accurately analyze these hybridized molecules they are first purified from the remaining excess probes in the hybridization reaction. The Prep Station isolates the hybridized mRNA molecules from the excess Reporter and Capture probes using two sequential magnetic bead purification steps. These affinity purifications utilize custom oligonucleotide-modified magnetic beads that retain only the tripartite complexes of mRNA molecules that are bound to both a Capture probe and a Reporter probe.
- Next, this solution of tripartite complexes is washed through a flow cell in the NanoString sample cartridge. One surface of this flow cell is coated with a polyethylene glycol (PEG) hydrogel that is densely impregnated with covalently bound streptavidin. As the solution passes through the flow cell, the tripartite complexes are bound to the streptavidin in the hydrogel through biotin molecules that are incorporated into each Capture probe. The PEG hydrogel acts not only to provide a streptavidin-dense surface onto which the tripartite complexes can be specifically bound, but also inhibits the non-specific binding of any remaining excess reporter probes.
- After the complexes are bound to the flow cell surface, an electric field is applied along the length of each sample cartridge flow cell to facilitate the optical identification and order of the fluorescent spots that make up each reporter probe. Because the reporter probes are charged nucleic acids, the applied voltage imparts a force on them that uniformly stretches and orients them along the electric field. While the voltage is applied, the Prep Station adds an immobilization reagent that locks the reporters in the elongated configuration after the field is removed. Once the reporters are immobilized the cartridge can be transferred to the nCounter Digital Analyzer for data collection. All consumable components and reagents required for sample processing on the Prep Station are provided in the nCounter Master Kit. These reagents are ready to load on the deck of the nCounter Prep Station which can process up to 10 samples and 2 reference samples per run in approximately 2.5 hours.
- nCounter Digital Analyzer - The nCounter Digital Analyzer (
Figure 14 ) collects data by taking images of the immobilized fluorescent reporters in the sample cartridge with a CCD camera through a microscope objective lens. Because the fluorescent Reporter Probes are small, single molecule barcodes with features of smaller than the wavelength of visible light, the Digital Analyzer uses high magnification, diffraction limited imaging to resolve the sequence of the spots in the fluorescent barcodes. - The Digital Analyzer captures hundreds of consecutive fields-of-view (FOV) that can each contain hundreds or thousands of discrete Reporter Probes. Each FOV is a combination of four monochrome images captured at different wavelengths. The resulting overlay can be thought of as a four-color image in blue, green, yellow, and red. Each 4-color FOV is processed in real time to provide a "count" for each fluorescent barcode in the sample. Because each barcode specifically identifies a single mRNA molecule, the resultant data from the Digital Analyzer is a precise measure of the relative abundance of each mRNA of interest in a biological sample.
- Software - The Prep Station and the Digital Analyzer are stand-alone units that do not require connection to an external PC, but must be networked to one another using a Local Area Network (LAN). The nCounter System software securely manages operations through user accounts and permissions. Both instruments use setup and process wizards on an embedded touch screen user interface to guide the user through the sample processing and data collection steps of the assay. The user is led through the procedure by step-by-step instructions on the Prep Station and Digital Analyzer. The instrument touch screen uses a pressure sensitive method for controlling operations and enables the user to interact with the system by touching a selection on the screen. Because the touchscreen provides a limited human interface for data entry, the system also hosts a web-based application for user accounts management, sample batch definition, and sample status tracking.
- When samples are processed, the system software tracks the user account and reagent lots for each sample in a centralized data repository. After expression data for a sample is acquired by the Digital Analyzer, it is first analyzed to ensure that all pre-specified quality control metrics are met. The qualified data are then processed through a locked PAM50 algorithm to generate a report containing intrinsic subtype and risk of recurrence (ROR) score. The sample report is transferred to the central repository where it can be securely accessed for download by a user with the correct permissions.
- The Breast Cancer Intrinsic Subtyping Algorithm - The nCounter system will be used to identify the intrinsic subtype of an excised invasive carcinoma of the breast using a 50 gene classifier algorithm originally named the PAM50 (Parker J.S., et al. Supervised Risk Predictor of Breast Cancer Based on Intrinsic Subtypes. Journal of Clinical Oncology, 27: 1160-1167 (2009)). The gene expression profile will assign a breast cancer to one of four molecular classes or intrinsic subtypes: Basal-like, Luminal A, Luminal B, and HER2 enriched. A brief description of each subtype is provided below.
- Luminal subtypes: The most common subtypes of breast cancer are the luminal subtypes in the hormone-receptor positive population, Luminal A and Luminal B. Prior studies suggest that luminal A comprises approximately 30% to 40% and luminal B approximately 20% of breast cancers2 and over 90 % of hormone receptor-positive breast cancers. The gene expression pattern of these subtypes resembles the luminal epithelial component of the breast (Nielsen, TO et al. A comparison of PAM50 intrinsic subtyping with immunohistochemistry and clinical prognostic factors in tamoxifen-treated estrogen receptor positive breast cancer. Clinical Cancer Research, 16:5222-5232 (2010)). These tumors are characterized by high expression of estrogen receptor (ER), progesterone receptor (PR), and genes associated with ER activation2 such as LIV1, GATA3, and cyclin D1, as well as expression of luminal cytokeratins 8 and 18.
- Luminal A: Luminal A (LumA) breast cancers exhibit low expression of genes associated with cell cycle activation and the ERBB2 cluster resulting in a better prognosis than luminal B. The Luminal A subgroup has the most favorable prognosis of all subtypes and is enriched for endocrine therapy-responsive tumors.
- Luminal B: Luminal B (LumB) breast cancers express ER and ER-associated genes, but to a lower extent than LumA. Genes associated with cell cycle activation are highly expressed and this tumor type can be HER2(+) or HER2(-). The prognosis is unfavorable (despite ER expression) and endocrine therapy responsiveness is generally diminished relative to LumA.
- Basal-like: The Basal-like subtype is generally ER-negative, is almost always clinically HER2-negative and expresses a suite of "basal" biomarkers including the basal epithelial cytokeratins (CK) and epidermal growth factor receptor (EGFR). Genes associated with cell cycle activation are highly expressed.
- HER2-enriched: The HER2-enriched subtype is generally ER-negative and is HER2-positive in the majority of cases with high expression of the ERBB2 cluster, including ERBB2 and GRB7. Genes associated with cell cycle activation are highly expressed and these tumors have a poor outcome.
- Cutoffs for the intrinsic subtyping algorithm are pre-defined from training sets that defined the following: 1) intrinsic subtype centroids (i.e. the prototypical gene expression profile of each subtype), 2) coefficients for Risk of Recurrence (ROR) score, and 3) risk classification (Low/Intermediate/High). The intrinsic subtype centroids (Luminal A, Luminal B, Her2-enriched, Basal-like) were trained using a clinically representative set of archived FFPE breast tumor specimens collected from multiple sites. Hierarchical clustering analysis of gene expression data from the FFPE breast tumor samples was combined with breast tumor biology (i.e. gene expression of previously defined intrinsic subtypes) to define the prototypical expression profile (i.e. centroid) of each subtype. A computational algorithm correlates the normalized 50 gene expression profile of an unknown breast cancer tumor sample to each of the prototypical expression signatures of the four breast cancer intrinsic subtypes. The tumor sample is assigned the subtype with the largest positive correlation to the sample.
- 304 unique tumor samples with well-defined clinical characteristics and clinical outcome data were used to establish the ROR score. The ROR score is calculated using coefficients from a Cox model that includes the Pearson correlation (R) to each intrinsic subtype, a proliferation score (P), and tumor size (T), as shown in the equation below.

- To classify tumor samples into specific risk groups (Low Risk/Intermediate Risk/High Risk) based on their calculated ROR score, cutoffs were set based on probability of recurrence free survival in a patient population consisting of hormone receptor positive, post-menopausal patients treated with endocrine therapy alone.
- Anticipated Use of NanoString Breast Cancer Test in Clinical Practice - Oncologists currently use a series of tests to develop a treatment protocol for breast cancer patients. Included in these are the IHC / FISH tests such as ER/PR IHC and HER2 IHC / FISH, and the Agendia MammaPrint® assay and the Genomic Health Oncotype Dx® test. These tests offer the oncologist additional information regarding the patient's prognosis and recommended treatment regimens.
- These tests, however, have limitations. ER, PgR, and Her2 testing is done locally by pathologists and reference labs, but the challenges with widespread standardization of IHC and FISH testing is well documented (Lester, J et al. Assessment of Tissue Estrogen and Progesterone Receptor Levels: A Survey of Current Practice, Techniques, and Quantitation Methods. The Breast Journal, 6:189-196 (2000); Wolff, A et al. American Society of Clinical Oncology / College of American Pathologists Guideline Recommendations for Human Epidermal )). The MammaPrint test is FDA cleared for use only with frozen or fresh-preserved tissue samples, yet most of the tumor samples collected in the United States are FFPE rather than fresh-frozen. This test is also not distributed and is only available through the Agendia reference labs. The Oncotype Dx test can be used to predict the risk of relapse for stage I/II, node negative, estrogen receptor-positive patients receiving adjuvant Tamoxifen therapy as well as response to cyclophosphamide/methotrexate/5-fluorouracil (CMF) chemotherapy. However this test is only offered as a lab-developed test (LDT) through Genomic Health's CLIA laboratory and is not FDA cleared for prognostic use, or FDA approved for predicting chemotherapy response.
- NanoString envisions a model that would have the Breast Cancer test used in conjunction with other sources of clinical data currently available to oncologists for breast cancer prognosis in selected patient segments. The Breast Cancer Test would be an additional source of prognostic information adding significant value to established clinical parameters (i.e tumor size, nodal status) used by oncologists in managing a patient with breast cancer.
- The methods, assays and kits of the disclosure include a series of quality control metrics that are automatically applied to each sample during analysis. These metrics evaluate the performance of the assay to determine whether the results fall within expected values. Upon successful analysis of these quality control metrics, the Assay gives the following results:
Result Output Values The Intrinsic Subtype of the Breast Cancer Specimen Luminal A Luminal B HER2- Enriched Basal-Like Individual Estimate of the Probability of Distant Recurrence within 10 years 0-100% Risk of Recurrence (ROR) Score Integer value on a 0-100 scale Risk Category Low, Intermediate, High - The Intrinsic Subtype of a breast cancer tumor has been shown to be related to prognosis in Early Stage Breast Cancer. On average, patients with a Luminal A tumor have significantly better outcomes than patients with Luminal B, HER2-Enriched, or Basal-like tumors.
- The Intrinsic Subtype is identified by comparing the gene expression profile of 50 genes in an unknown sample with the expected expression profiles for the four intrinsic subtypes. The subtype with the most similar profile is assigned to the unknown sample.
- The most common subtypes of breast cancer are the luminal subtypes, Luminal A (LumA) and Luminal B (LumB). Prior studies suggest that Luminal A comprises approximately 30% to 40% and Luminal B approximately 20% of breast cancers. However, greater than 90% of hormone-receptor positive patients have luminal tumors. The gene expression pattern of these subtypes resembles the luminal epithelial component of the breast tissue. These tumors are characterized by high expression of estrogen receptor (ER), progesterone receptor (PR), and genes associated with ER activation, such as LIV1, GATA3, and cyclin D1, as well as expression of luminal cytokeratins 8 and 18. Luminal A breast cancers exhibit lower expression of genes associated with cell cycle activation when compared to Luminal B breast cancers resulting in a better prognosis.
- Prior studies suggest that the HER2-Enriched subtype (Her2E) comprises approximately 20% of breast cancers. However, HER2-Enriched tumors are generally ER-negative, so only 5% of the tested ER-positive patient population was found to have HER2-Enriched breast cancer. Regardless of ER-status, HER2-Enriched tumors are HER2-positive in the majority of cases with high expression of the ERBB2 cluster, including ERBB2 and GRB7. Genes associated with cell cycle activation are also highly expressed.
- Published data suggest that the Basal-like subtype comprises approximately 20% of breast cancers. However, Basal-like tumors are generally ER-negative, so only 1% of hormone receptor-positive patients have Basal-like breast cancer. The Basal-like subtype is almost always clinically HER2-negative and expresses a suite of "basal" biomarkers including the basal epithelial cytokeratins (CK) and epidermal growth factor receptor (EGFR). Genes associated with cell cycle activation are highly expressed.
- The ROR score is an integer value on a 0-100 scale that is related to an individual patient's probability of distant recurrence within 10 years for the defined intended use population. The ROR score is calculated by comparing the expression profiles of 46 genes in an unknown sample with the expected profiles for the four intrinsic subtypes, as described above, to calculate four different correlation values. These correlation values are then combined with a proliferation score and the tumor size to calculate the ROR score.
- The ROR scores for a cohort of post-menopausal women with hormone receptor-positive early stage breast cancer were compared to distant recurrence-free survival following surgery and treatment with 5 years of adjuvant endocrine therapy followed by 5 years of observation. This study resulted in a model relating the ROR score to the probability of distant recurrence in this tested patient population including a 95% confidence interval.
- Risk classification is also provided to allow interpretation of the ROR score by using cutoffs related to clinical outcome in tested patient populations.
Risk classification by ROR range and nodal status Nodal Status ROR Range Risk Classification Node- Negative 0-40 Low 41-60 Intermediate 61-100 High Node-Positive (1-3 nodes) 0-15 Low 16-40 Intermediate 41-100 High - Each lot of the Assay components is tested using predetermined specifications. All kit-level items are lot tracked, and the critical components contained within each kit are tested together and released as a Master Lot.
- The assay kit includes a series of internal controls that are used to assess the quality of each run set as a whole and each sample individually. These controls are listed below.
- A synthetic RNA Reference Sample is included as a control within the Assay kit. The reference sample is comprised of in-vitro transcribed RNA targets from the 50 algorithm and 8 housekeeping genes. The Reference Sample is processed in duplicate in each assay run along with a set of up to 10 unknown breast tumor RNA samples in a 12 reaction strip tube. The signal from the Reference Sample is analyzed against pre-defined thresholds to qualify the run.
- The signal from each of the 50 algorithm genes of the breast tumor RNA sample is normalized to the corresponding genes of the Reference Sample.
- Synthetic RNA targets are used as positive controls (PCs) for the assay. The PC target sequences are derived from the External RNA Control Consortium (ERCC) DNA sequence library. The RNA targets are in-vitro transcribed from DNA plasmids. Six RNA targets are included within the assay kit in a 4-fold titration series (128 - 0.125 fM final concentration in hybridization reaction) along with the corresponding Capture and Reporter Probes. The PCs are added to each breast tumor RNA sample and Reference RNA Sample tested with the Prosigna Assay. A sample will be disqualified from further analysis if the signal intensities from the PCs do not meet pre-defined thresholds.
- Negative control (NC) target sequences are derived from the ERCC DNA sequence library. The probes designed to detect these target sequences are included as part of the assay kit without the corresponding target sequence. The negative controls (NCs) are added to each breast tumor RNA sample and Reference Sample tested with the Prosigna Assay as a quality control measure. The sample will be disqualified from further analysis if the signal intensities from the NCs do not meet pre-defined thresholds.
- Capture and Reporter Probes designed to detect 8 housekeeping genes and 50 algorithm genes are included as part of the kit. The expression levels of the 8 housekeeping genes are analyzed to determine the quality of RNA extracted from the FFPE tissue sample and input into the assay. The sample will be disqualified from further analysis if the expression level of the housekeeping genes falls below pre-defined thresholds.
- The housekeeping genes are also used to normalize for any differences in the intact RNA amount in a sample prior to Reference Sample normalization.
- For the purposes of the present disclosure, "breast cancer" includes, for example, those conditions classified by biopsy or histology as malignant pathology. The clinical delineation of breast cancer diagnoses is well known in the medical arts. One of skill in the art will appreciate that breast cancer refers to any malignancy of the breast tissue, including, for example, carcinomas and sarcomas. Particular embodiments of breast cancer include ductal carcinoma in situ (DCIS), lobular carcinoma in situ (LCIS), or mucinous carcinoma. Breast cancer also refers to infiltrating ductal (IDC) or infiltrating lobular carcinoma (ILC). In most embodiments of the disclosure, the subject of interest is a human patient suspected of or actually diagnosed with breast cancer.
- The article "a" and "an" are used herein to refer to one or more than one (i.e., to at least one) of the grammatical object of the article. By way of example, "an element" means one or more element.
- Throughout the specification the word "comprising," or variations such as "comprises" or "comprising," will be understood to imply the inclusion of a stated element, integer or step, or group of elements, integers or steps, but not the exclusion of any other element, integer or step, or group of elements, integers or steps.
-
Figure 5 outlines the assay processes associated with the Breast Cancer Intrinsic Subtyping test. Following RNA isolation, the test will simultaneously measure the expression levels of 46 target genes plus eight housekeeping genes in a single hybridization reaction using an nCounter CodeSet designed specifically to those genes. For example, the housekeeping genes described inU.S. Patent Publication 2008/0032293 can be used for normalization. Exemplary housekeeping genes include MRPL19, PSMC4, SF3A1, PUM1, ACTB, GAPD, GUSB, RPLP0, and TFRC. The housekeeping genes are used to normalize the expression of the tumor sample. Each assay run also includes a reference sample consisting of in vitro transcribed RNA's of the 58 targets for normalization purposes. - FFPE Tissue Review/Procurement and RNA Extraction: The Breast Cancer Intrinsic Subtyping Test will use RNA extracted from Formalin-fixed, Paraffin-embedded (FFPE) tissue that has been diagnosed as invasive carcinoma of the breast. A Pathologist reviews an H & E stained slide to identify the tissue area containing sufficient tumor tissue content for the test. Unstained slide mounted tissue sections are processed by macro-dissecting the identified tumor area on each slide to remove any adjacent normal tissue. RNA is then isolated from the tumor tissue, and DNA is removed from the sample.
- Assay Setup and Initiation of Hybridization: For each batch of up to 10 RNA samples isolated from a breast tumor, the user will set up a run using the nCounter Analysis x5 system software, which tracks sample processing, reagent lots, and results for each sample. To initiate the assay, the user will pipette the specified amount of RNA into separate tubes within a 12 reaction strip tube and add the CodeSet and hybridization buffer. A reference sample is pipetted into the remaining two tubes with CodeSet and hybridization buffer. The CodeSet consists of probes for each gene that is targeted, additional probes for endogenous "housekeeping" normalization genes and positive and negative controls that are spiked into the assay. The reference sample consists of in vitro transcribed RNA for the targeted genes and housekeeping genes. Once the hybridization reagents are added to the respective tubes, the user transfers the strip tube into a heated-lid heatblock for a specified period of time at a set temperature.
- Purification and Binding on the Prep Station: Upon completing hybridization, the user will transfer the strip tube containing the set of 10 assays and 2 reference samples onto the nCounter Prep Station along with the required prepackaged reagents and disposables. An automated purification process then removes excess capture and reporter probe through two successive hybridization-driven magnetic bead capture steps. The nCounter Prep Station then transfers the purified target/probe complexes into an nCounter cartridge for capture to a glass slide. Following completion of the run, the user removes the cartridge from the Prep Station and seals it with an adhesive film.
- Imaging and Analysis on the Digital Analyzer: The cartridge is then sealed and inserted into the nCounter Digital Analyzer which counts the number of probes captured on the slide for each gene, which corresponds to the amount of target in solution. Automated software will then check thresholds for the housekeeping genes, reference sample, and positive and negative controls to qualify each assay and ensure that the procedure was performed correctly. The signals of each sample are next normalized using the housekeeping genes to control for input sample quality. The signals are then normalized to the reference sample within each run to control for run-to-run variations. The resulting normalized data is entered in the Breast Cancer Intrinsic Subtyping algorithm to determine tumor intrinsic subtype and risk of recurrence score.
- The aim of the study is to assess the performance of the ROR score in predicting distal recurrence for postmenopausal patients with hormone receptor positive early breast cancer (HR+ EBC) treated with tamoxifen or tamoxifen followed by anastrozole when the NANO46 test is performed in a routine hospital pathology lab. Does the ROR score add prognostic information (Distant RFS) beyond the Clinical Treatment Score in all patients (CTS includes: nodes, grade, tumor size, age, treatment)? Do the ROR-based risk groups at prognostic information (Distant RFS) beyond the Clinical Treatment Score in all patients?
- Study Overview: 3,714 patients were enrolled in a ABCSG8. Patients were postmenopausal women with HR+ EBC (node negative and note positive), grade one or two, with no prior treatment. 1,671 patients re-consented for long-term follow-up or are deceased. The median follow-up was 11 years. 1,620 FFPE blocks were collected. 25 had insufficient cancer in the block on path review, 73 had insufficient RNA included, 44 failed QC specs for the NanoString device. 1,478 patients (91.2%) passed the NANO46 analysis.
- Methods: Three unstained 10 micron sections and 1 H&E slide for each patient was sent to an independent academic pathology laboratory at BCCA where tissue review, manual micro-dissection and RNA extraction were performed. NANO46 analysis was then conducted on 250 ng of the extracted RNA using the NanoString nCounter Analysis System; both intrinsic subtype and ROR score were calculated.
- Results: The ROR Score adds statistically significant prognostic information (Distant RFS) beyond CTS in all patients (Likelihood ratio test ΔLRχ2 = 53.5, p < 0.0001). The ROR-based risk groups add statistically significant prognostic information (Distant RFS) beyond CTS in all patients (Likelihood ratio test ΔLRχ2 = 34.1, p < 0.0001). Differentiation between Luminal A and Luminal B adds statistically significant prognostic information (Distant RFS) beyond CTS in all patients (Luminal B vs. A: HR=2.38, 95% CI; 1.69-3.35, p < 0.0001). Results in the node-negative and node-positive subgroups are similar to the results for all patients that are reported in the study.
- Conclusions: The results show that both the ROR score and the ROR-based risk groups add statistically significant prognostic information beyond the Clinical Treatment Score. The results demonstrate that a complex, multi-gene-expression test can be performed in a hospital pathology laboratory and meet the same quality metrics as a central reference laboratory. The results of the TransATAC and ABCSG8 studies together provide
Level 1 evidence for the clinical validity of the NANO46 test for predicting the risk of distant recurrence in postmenopausal women with HR+ EBC treated with endocrine therapy alone. The results also show that Luminal A subtypes have better outcomes than Luminal B subtypes in postmenopausal women with HR+ EBC treated with endocrine therapy alone.
Claims (5)
- A method of determining low or high risk of recurrence (ROR) in a subject having breast cancer comprising:determining the size of the breast cancer tumor from the subject;determining a correlation value of a breast cancer tumor for each of at least four intrinsic subtypes including a Basal-like, Luminal A, Luminal B, or HER-2 enriched, by measuring the RNA expression of at least 40 of the genes in the NANO46 intrinsic gene list of Table 1;determining a proliferation score by measuring the RNA expression of each of the 18-gene subset of the NANO46 intrinsic genes selected from ANLN, CCNE1, CDC20, CDC6, CDCA1, CENPF, CEP55, EXO1, KIF2C, KNTC2, MELK, MKI67, ORC6L, PTTG1, RRM2, TYMS, UBE2C, and UBE2T;calculating a risk of recurrence (ROR) score using the following equation: ROR-PT = - 0.0067∗Basal + 0.4317∗Her2 + -0.3172∗LumA + 0.4894∗LumB + 0.1981∗ProliferationScore + 0.1133∗TumorSize; wherein the risk of recurrence score is an integer value on a 0-100 scale, wherein the level of RNA expression for at least 40 of the genes in the NANO46 intrinsic gene list of Table 1 is set forth in Table 3;thereby determining whether the subject has a low or high risk of recurrence based on the risk of recurrence (ROR) score and interpretation of the ROR score using the risk classification by risk of recurrence (ROR) range and nodal status.
- The method of claim 1, further comprising determining at least one of the following: tumor grade, tumor ploidy, estrogen receptor expression, progesterone receptor expression, and HER2/ERBB2 expression.
- The method of claim 1, further comprising determining each of the following: tumor grade, tumor ploidy, estrogen receptor expression, progesterone receptor expression, and HER2/ERBB2 expression.
- The method of claim 1, wherein the risk is breast cancer specific survival, event-free survival, or response to therapy.
- The method of claim 1, wherein the RNA expression of the members of the NANO46 intrinsic gene list is determined using the nanoreporter code system (nCounter® Analysis system).
Applications Claiming Priority (3)
| Application Number | Priority Date | Filing Date | Title |
|---|---|---|---|
| US201261650209P | 2012-05-22 | 2012-05-22 | |
| US201361753673P | 2013-01-17 | 2013-01-17 | |
| PCT/US2013/042157 WO2013177245A2 (en) | 2012-05-22 | 2013-05-22 | Nano46 genes and methods to predict breast cancer outcome |
Publications (3)
| Publication Number | Publication Date |
|---|---|
| EP2852689A2 EP2852689A2 (en) | 2015-04-01 |
| EP2852689A4 EP2852689A4 (en) | 2016-05-11 |
| EP2852689B1 true EP2852689B1 (en) | 2019-12-11 |
Family
ID=49624503
Family Applications (1)
| Application Number | Title | Priority Date | Filing Date |
|---|---|---|---|
| EP13794236.3A Active EP2852689B1 (en) | 2012-05-22 | 2013-05-22 | Nano46 genes and methods to predict breast cancer outcome |
Country Status (12)
| Country | Link |
|---|---|
| US (3) | US20130337444A1 (en) |
| EP (1) | EP2852689B1 (en) |
| JP (1) | JP6325530B2 (en) |
| CN (2) | CN104704128A (en) |
| AU (1) | AU2013266419B2 (en) |
| BR (1) | BR112014029300A2 (en) |
| CA (1) | CA2874492C (en) |
| ES (1) | ES2763931T3 (en) |
| IL (1) | IL235795B (en) |
| IN (1) | IN2014MN02418A (en) |
| MX (1) | MX369628B (en) |
| WO (1) | WO2013177245A2 (en) |
Families Citing this family (29)
| Publication number | Priority date | Publication date | Assignee | Title |
|---|---|---|---|---|
| ES2457534T3 (en) | 2008-05-30 | 2014-04-28 | The University Of North Carolina At Chapel Hill | Gene expression profiles to predict outcomes in breast cancer |
| AU2012229123B2 (en) | 2011-03-15 | 2017-02-02 | British Columbia Cancer Agency Branch | Methods of treating breast cancer with anthracycline therapy |
| GB201106254D0 (en) | 2011-04-13 | 2011-05-25 | Frisen Jonas | Method and product |
| EP2785873A4 (en) | 2011-11-30 | 2015-11-11 | Univ North Carolina | Methods of treating breast cancer with taxane therapy |
| EP2909337B1 (en) | 2012-10-17 | 2019-01-09 | Spatial Transcriptomics AB | Methods and product for optimising localised or spatial detection of gene expression in a tissue sample |
| EP2997163A4 (en) * | 2013-05-13 | 2017-02-22 | Nanostring Technologies, Inc | Methods to predict risk of recurrence in node-positive early breast cancer |
| LT3013983T (en) | 2013-06-25 | 2023-05-10 | Prognosys Biosciences, Inc. | Spatially encoded biological assays using a microfluidic device |
| US20150072021A1 (en) | 2013-09-09 | 2015-03-12 | British Columbia Cancer Agency Branch | Methods and Kits for Predicting Outcome and Methods and Kits for Treating Breast Cancer with Radiation Therapy |
| KR102105236B1 (en) | 2014-11-21 | 2020-04-28 | 나노스트링 테크놀로지스, 인크. | Enzyme- and amplification-free sequencing |
| CA2968519C (en) * | 2014-11-24 | 2024-01-09 | Nanostring Technologies, Inc. | Methods and apparatuses for gene purification and imaging |
| AU2015359479A1 (en) * | 2014-12-09 | 2017-06-15 | King's College London | Breast cancer treatment with taxane therapy |
| EP4321627A3 (en) | 2015-04-10 | 2024-04-17 | 10x Genomics Sweden AB | Spatially distinguished, multiplex nucleic acid analysis of biological specimens |
| CN107850599B (en) * | 2015-07-23 | 2021-02-09 | 新加坡国立大学 | Stratification of patients for treatment with WBP2 and HER2 as co-prognostic factors |
| SG11201809913PA (en) | 2016-05-16 | 2018-12-28 | Nanostring Technologies Inc | Methods for detecting target nucleic acids in a sample |
| WO2017222453A1 (en) | 2016-06-21 | 2017-12-28 | Hauling Thomas | Nucleic acid sequencing |
| WO2018074865A2 (en) * | 2016-10-21 | 2018-04-26 | 서울대학교병원 | Composition and method for breast cancer prognosis prediction |
| CN110225980B (en) | 2016-11-21 | 2023-01-06 | 纳米线科技公司 | Chemical compositions and methods of use thereof |
| KR101950717B1 (en) * | 2016-11-23 | 2019-02-21 | 주식회사 젠큐릭스 | Methods for predicting effectiveness of chemotherapy for breast cancer patients |
| WO2018144782A1 (en) * | 2017-02-01 | 2018-08-09 | The Translational Genomics Research Institute | Methods of detecting somatic and germline variants in impure tumors |
| CA3078158A1 (en) | 2017-10-06 | 2019-04-11 | Cartana Ab | Rna templated ligation |
| KR102071491B1 (en) * | 2017-11-10 | 2020-01-30 | 주식회사 디시젠 | Breast cancer prognosis prediction method and system based on machine learning using next generation sequencing |
| CN112703255A (en) | 2018-05-14 | 2021-04-23 | 纳米线科技公司 | Chemical compositions and methods of use thereof |
| US20210371936A1 (en) * | 2018-11-05 | 2021-12-02 | Biontech Diagnostics Gmbh | Predictive methods in breast cancer |
| CN113906147B (en) | 2019-05-31 | 2024-09-13 | 10X基因组学有限公司 | Method for detecting target nucleic acid molecule |
| JP7352937B2 (en) * | 2019-07-19 | 2023-09-29 | 公立大学法人福島県立医科大学 | Differential marker gene set, method and kit for differentiating or classifying breast cancer subtypes |
| EP3945136A1 (en) * | 2020-07-28 | 2022-02-02 | Hospital Clínic de Barcelona | In vitro method for the prognosis of patients suffering from her2-positive breast cancer |
| US12060603B2 (en) | 2021-01-19 | 2024-08-13 | 10X Genomics, Inc. | Methods for internally controlled in situ assays using padlock probes |
| AU2022419002A1 (en) * | 2021-12-20 | 2024-08-01 | Fundació De Recerca Clínic Barcelona-Institut D’Investigacions Biomèdiques August Pi I Sunyer | Development and validation of an in vitro method for the prognosis of patients suffering from her2-positive breast cancer |
| CN117965734B (en) * | 2024-02-02 | 2024-09-24 | 奥明星程(杭州)生物科技有限公司 | Gene marker for detecting hard fibroid, kit, detection method and application |
Family Cites Families (24)
| Publication number | Priority date | Publication date | Assignee | Title |
|---|---|---|---|---|
| US5800992A (en) | 1989-06-07 | 1998-09-01 | Fodor; Stephen P.A. | Method of detecting nucleic acids |
| US6040138A (en) | 1995-09-15 | 2000-03-21 | Affymetrix, Inc. | Expression monitoring by hybridization to high density oligonucleotide arrays |
| AU669489B2 (en) | 1991-09-18 | 1996-06-13 | Affymax Technologies N.V. | Method of synthesizing diverse collections of oligomers |
| US5384261A (en) | 1991-11-22 | 1995-01-24 | Affymax Technologies N.V. | Very large scale immobilized polymer synthesis using mechanically directed flow paths |
| ATE293011T1 (en) | 1991-11-22 | 2005-04-15 | Affymetrix Inc A Delaware Corp | COMBINATORY STRATEGIES FOR POLYMER SYNTHESIS |
| US5856174A (en) | 1995-06-29 | 1999-01-05 | Affymetrix, Inc. | Integrated nucleic acid diagnostic device |
| EP0880598A4 (en) | 1996-01-23 | 2005-02-23 | Affymetrix Inc | Nucleic acid analysis techniques |
| AU1287799A (en) | 1997-10-31 | 1999-05-24 | Affymetrix, Inc. | Expression profiles in adult and fetal organs |
| US6020135A (en) | 1998-03-27 | 2000-02-01 | Affymetrix, Inc. | P53-regulated genes |
| US6750015B2 (en) * | 2000-06-28 | 2004-06-15 | Kathryn B. Horwitz | Progesterone receptor-regulated gene expression and methods related thereto |
| US20020168639A1 (en) * | 2000-09-22 | 2002-11-14 | Muraca Patrick J. | Profile array substrates |
| ES2787475T3 (en) | 2003-06-24 | 2020-10-16 | Genomic Health Inc | Prediction of probability of cancer recurrence |
| US20050071087A1 (en) * | 2003-09-29 | 2005-03-31 | Anderson Glenda G. | Systems and methods for detecting biological features |
| CA2574447A1 (en) | 2004-07-15 | 2006-01-26 | University Of Utah Research Foundation | Housekeeping genes and methods for identifying the same |
| CN101061480A (en) * | 2004-09-22 | 2007-10-24 | 三路影像公司 | Methods and computer program products for analysis and optimization of marker candidates for cancer prognosis |
| US20090299640A1 (en) | 2005-11-23 | 2009-12-03 | University Of Utah Research Foundation | Methods and Compositions Involving Intrinsic Genes |
| CA2640385C (en) | 2005-12-23 | 2014-07-15 | Nanostring Technologies, Inc. | Nanoreporters and methods of manufacturing and use thereof |
| CA2635215C (en) | 2005-12-23 | 2016-08-30 | Nanostring Technologies, Inc. | Compositions comprising oriented, immobilized macromolecules and methods for their preparation |
| AU2008237018B2 (en) | 2007-04-10 | 2014-04-03 | Bruker Spatial Biology, Inc. | Methods and computer systems for identifying target-specific sequences for use in nanoreporters |
| WO2008150512A2 (en) * | 2007-06-04 | 2008-12-11 | University Of Louisville Research Foundation, Inc. | Methods for identifying an increased likelihood of recurrence of breast cancer |
| CA2698569A1 (en) * | 2007-09-06 | 2009-09-03 | Mark G. Erlander | Tumor grading and cancer prognosis |
| ES2457534T3 (en) * | 2008-05-30 | 2014-04-28 | The University Of North Carolina At Chapel Hill | Gene expression profiles to predict outcomes in breast cancer |
| JP5836803B2 (en) | 2008-08-14 | 2015-12-24 | ナノストリング テクノロジーズ, インコーポレイテッド | Stable nanoreporter |
| KR101864855B1 (en) * | 2010-03-31 | 2018-07-13 | 지피돈 디아그노스틱스 게엠베하 | Method for breast cancer recurrence prediction under endocrine treatment |
-
2013
- 2013-05-22 EP EP13794236.3A patent/EP2852689B1/en active Active
- 2013-05-22 ES ES13794236T patent/ES2763931T3/en active Active
- 2013-05-22 CN CN201380038875.4A patent/CN104704128A/en active Pending
- 2013-05-22 AU AU2013266419A patent/AU2013266419B2/en active Active
- 2013-05-22 CN CN201911216650.9A patent/CN111500718A/en active Pending
- 2013-05-22 US US13/899,656 patent/US20130337444A1/en not_active Abandoned
- 2013-05-22 IN IN2418MUN2014 patent/IN2014MN02418A/en unknown
- 2013-05-22 CA CA2874492A patent/CA2874492C/en active Active
- 2013-05-22 WO PCT/US2013/042157 patent/WO2013177245A2/en active Application Filing
- 2013-05-22 JP JP2015514143A patent/JP6325530B2/en active Active
- 2013-05-22 MX MX2014014275A patent/MX369628B/en active IP Right Grant
- 2013-05-22 BR BR112014029300A patent/BR112014029300A2/en not_active Application Discontinuation
-
2014
- 2014-11-20 IL IL235795A patent/IL235795B/en active IP Right Grant
-
2020
- 2020-02-14 US US16/792,051 patent/US20200332368A1/en not_active Abandoned
-
2022
- 2022-09-29 US US17/936,745 patent/US20230272476A1/en active Pending
Non-Patent Citations (1)
| Title |
|---|
| None * |
Also Published As
| Publication number | Publication date |
|---|---|
| CN104704128A (en) | 2015-06-10 |
| JP6325530B2 (en) | 2018-05-16 |
| CA2874492A1 (en) | 2013-11-28 |
| US20230272476A1 (en) | 2023-08-31 |
| IL235795A0 (en) | 2015-01-29 |
| EP2852689A4 (en) | 2016-05-11 |
| IN2014MN02418A (en) | 2015-08-14 |
| CA2874492C (en) | 2021-10-19 |
| CN111500718A (en) | 2020-08-07 |
| EP2852689A2 (en) | 2015-04-01 |
| IL235795B (en) | 2020-02-27 |
| WO2013177245A3 (en) | 2015-01-29 |
| BR112014029300A2 (en) | 2017-07-25 |
| MX2014014275A (en) | 2015-07-06 |
| MX369628B (en) | 2019-11-14 |
| ES2763931T3 (en) | 2020-06-01 |
| JP2015518724A (en) | 2015-07-06 |
| AU2013266419B2 (en) | 2018-09-27 |
| WO2013177245A2 (en) | 2013-11-28 |
| US20200332368A1 (en) | 2020-10-22 |
| AU2013266419A1 (en) | 2014-12-11 |
| US20130337444A1 (en) | 2013-12-19 |
Similar Documents
| Publication | Publication Date | Title |
|---|---|---|
| US20230272476A1 (en) | Nano46 genes and methods to predict breast cancer outcome | |
| US20230250484A1 (en) | Gene expression profiles to predict breast cancer outcomes | |
| US9181588B2 (en) | Methods of treating breast cancer with taxane therapy | |
| US20160115551A1 (en) | Methods to predict risk of recurrence in node-positive early breast cancer | |
| US20140154681A1 (en) | Methods to Predict Breast Cancer Outcome | |
| US20150072021A1 (en) | Methods and Kits for Predicting Outcome and Methods and Kits for Treating Breast Cancer with Radiation Therapy | |
| JP2015530072A (en) | Breast cancer treatment with gemcitabine therapy | |
| AU2012229123A1 (en) | Methods of treating breast cancer with anthracycline therapy | |
| US20160160293A1 (en) | Breast cancer treatment with taxane therapy |
Legal Events
| Date | Code | Title | Description |
|---|---|---|---|
| PUAI | Public reference made under article 153(3) epc to a published international application that has entered the european phase |
Free format text: ORIGINAL CODE: 0009012 |
|
| 17P | Request for examination filed |
Effective date: 20141126 |
|
| AK | Designated contracting states |
Kind code of ref document: A2 Designated state(s): AL AT BE BG CH CY CZ DE DK EE ES FI FR GB GR HR HU IE IS IT LI LT LU LV MC MK MT NL NO PL PT RO RS SE SI SK SM TR |
|
| AX | Request for extension of the european patent |
Extension state: BA ME |
|
| A4 | Supplementary search report drawn up and despatched |
Effective date: 20160412 |
|
| RIC1 | Information provided on ipc code assigned before grant |
Ipc: C12Q 1/68 20060101AFI20160401BHEP |
|
| STAA | Information on the status of an ep patent application or granted ep patent |
Free format text: STATUS: EXAMINATION IS IN PROGRESS |
|
| 17Q | First examination report despatched |
Effective date: 20170421 |
|
| GRAP | Despatch of communication of intention to grant a patent |
Free format text: ORIGINAL CODE: EPIDOSNIGR1 |
|
| STAA | Information on the status of an ep patent application or granted ep patent |
Free format text: STATUS: GRANT OF PATENT IS INTENDED |
|
| INTG | Intention to grant announced |
Effective date: 20190703 |
|
| GRAS | Grant fee paid |
Free format text: ORIGINAL CODE: EPIDOSNIGR3 |
|
| GRAA | (expected) grant |
Free format text: ORIGINAL CODE: 0009210 |
|
| STAA | Information on the status of an ep patent application or granted ep patent |
Free format text: STATUS: THE PATENT HAS BEEN GRANTED |
|
| AK | Designated contracting states |
Kind code of ref document: B1 Designated state(s): AL AT BE BG CH CY CZ DE DK EE ES FI FR GB GR HR HU IE IS IT LI LT LU LV MC MK MT NL NO PL PT RO RS SE SI SK SM TR |
|
| AX | Request for extension of the european patent |
Extension state: BA ME |
|
| REG | Reference to a national code |
Ref country code: GB Ref legal event code: FG4D |
|
| REG | Reference to a national code |
Ref country code: CH Ref legal event code: EP |
|
| REG | Reference to a national code |
Ref country code: AT Ref legal event code: REF Ref document number: 1212226 Country of ref document: AT Kind code of ref document: T Effective date: 20191215 |
|
| REG | Reference to a national code |
Ref country code: DE Ref legal event code: R096 Ref document number: 602013063931 Country of ref document: DE |
|
| REG | Reference to a national code |
Ref country code: IE Ref legal event code: FG4D |
|
| REG | Reference to a national code |
Ref country code: CH Ref legal event code: NV Representative=s name: MICHELI AND CIE SA, CH |
|
| REG | Reference to a national code |
Ref country code: NL Ref legal event code: MP Effective date: 20191211 |
|
| REG | Reference to a national code |
Ref country code: LT Ref legal event code: MG4D |
|
| PG25 | Lapsed in a contracting state [announced via postgrant information from national office to epo] |
Ref country code: NO Free format text: LAPSE BECAUSE OF FAILURE TO SUBMIT A TRANSLATION OF THE DESCRIPTION OR TO PAY THE FEE WITHIN THE PRESCRIBED TIME-LIMIT Effective date: 20200311 Ref country code: GR Free format text: LAPSE BECAUSE OF FAILURE TO SUBMIT A TRANSLATION OF THE DESCRIPTION OR TO PAY THE FEE WITHIN THE PRESCRIBED TIME-LIMIT Effective date: 20200312 Ref country code: LT Free format text: LAPSE BECAUSE OF FAILURE TO SUBMIT A TRANSLATION OF THE DESCRIPTION OR TO PAY THE FEE WITHIN THE PRESCRIBED TIME-LIMIT Effective date: 20191211 Ref country code: LV Free format text: LAPSE BECAUSE OF FAILURE TO SUBMIT A TRANSLATION OF THE DESCRIPTION OR TO PAY THE FEE WITHIN THE PRESCRIBED TIME-LIMIT Effective date: 20191211 Ref country code: SE Free format text: LAPSE BECAUSE OF FAILURE TO SUBMIT A TRANSLATION OF THE DESCRIPTION OR TO PAY THE FEE WITHIN THE PRESCRIBED TIME-LIMIT Effective date: 20191211 Ref country code: FI Free format text: LAPSE BECAUSE OF FAILURE TO SUBMIT A TRANSLATION OF THE DESCRIPTION OR TO PAY THE FEE WITHIN THE PRESCRIBED TIME-LIMIT Effective date: 20191211 Ref country code: BG Free format text: LAPSE BECAUSE OF FAILURE TO SUBMIT A TRANSLATION OF THE DESCRIPTION OR TO PAY THE FEE WITHIN THE PRESCRIBED TIME-LIMIT Effective date: 20200311 |
|
| REG | Reference to a national code |
Ref country code: DE Ref legal event code: R082 Ref document number: 602013063931 Country of ref document: DE Representative=s name: MEWBURN ELLIS LLP, DE |
|
| PG25 | Lapsed in a contracting state [announced via postgrant information from national office to epo] |
Ref country code: RS Free format text: LAPSE BECAUSE OF FAILURE TO SUBMIT A TRANSLATION OF THE DESCRIPTION OR TO PAY THE FEE WITHIN THE PRESCRIBED TIME-LIMIT Effective date: 20191211 Ref country code: HR Free format text: LAPSE BECAUSE OF FAILURE TO SUBMIT A TRANSLATION OF THE DESCRIPTION OR TO PAY THE FEE WITHIN THE PRESCRIBED TIME-LIMIT Effective date: 20191211 |
|
| REG | Reference to a national code |
Ref country code: ES Ref legal event code: FG2A Ref document number: 2763931 Country of ref document: ES Kind code of ref document: T3 Effective date: 20200601 |
|
| PG25 | Lapsed in a contracting state [announced via postgrant information from national office to epo] |
Ref country code: AL Free format text: LAPSE BECAUSE OF FAILURE TO SUBMIT A TRANSLATION OF THE DESCRIPTION OR TO PAY THE FEE WITHIN THE PRESCRIBED TIME-LIMIT Effective date: 20191211 |
|
| PG25 | Lapsed in a contracting state [announced via postgrant information from national office to epo] |
Ref country code: EE Free format text: LAPSE BECAUSE OF FAILURE TO SUBMIT A TRANSLATION OF THE DESCRIPTION OR TO PAY THE FEE WITHIN THE PRESCRIBED TIME-LIMIT Effective date: 20191211 Ref country code: PT Free format text: LAPSE BECAUSE OF FAILURE TO SUBMIT A TRANSLATION OF THE DESCRIPTION OR TO PAY THE FEE WITHIN THE PRESCRIBED TIME-LIMIT Effective date: 20200506 Ref country code: RO Free format text: LAPSE BECAUSE OF FAILURE TO SUBMIT A TRANSLATION OF THE DESCRIPTION OR TO PAY THE FEE WITHIN THE PRESCRIBED TIME-LIMIT Effective date: 20191211 Ref country code: NL Free format text: LAPSE BECAUSE OF FAILURE TO SUBMIT A TRANSLATION OF THE DESCRIPTION OR TO PAY THE FEE WITHIN THE PRESCRIBED TIME-LIMIT Effective date: 20191211 Ref country code: CZ Free format text: LAPSE BECAUSE OF FAILURE TO SUBMIT A TRANSLATION OF THE DESCRIPTION OR TO PAY THE FEE WITHIN THE PRESCRIBED TIME-LIMIT Effective date: 20191211 |
|
| PG25 | Lapsed in a contracting state [announced via postgrant information from national office to epo] |
Ref country code: SM Free format text: LAPSE BECAUSE OF FAILURE TO SUBMIT A TRANSLATION OF THE DESCRIPTION OR TO PAY THE FEE WITHIN THE PRESCRIBED TIME-LIMIT Effective date: 20191211 Ref country code: IS Free format text: LAPSE BECAUSE OF FAILURE TO SUBMIT A TRANSLATION OF THE DESCRIPTION OR TO PAY THE FEE WITHIN THE PRESCRIBED TIME-LIMIT Effective date: 20200411 Ref country code: SK Free format text: LAPSE BECAUSE OF FAILURE TO SUBMIT A TRANSLATION OF THE DESCRIPTION OR TO PAY THE FEE WITHIN THE PRESCRIBED TIME-LIMIT Effective date: 20191211 |
|
| REG | Reference to a national code |
Ref country code: DE Ref legal event code: R097 Ref document number: 602013063931 Country of ref document: DE |
|
| REG | Reference to a national code |
Ref country code: AT Ref legal event code: MK05 Ref document number: 1212226 Country of ref document: AT Kind code of ref document: T Effective date: 20191211 |
|
| PLBE | No opposition filed within time limit |
Free format text: ORIGINAL CODE: 0009261 |
|
| STAA | Information on the status of an ep patent application or granted ep patent |
Free format text: STATUS: NO OPPOSITION FILED WITHIN TIME LIMIT |
|
| PG25 | Lapsed in a contracting state [announced via postgrant information from national office to epo] |
Ref country code: DK Free format text: LAPSE BECAUSE OF FAILURE TO SUBMIT A TRANSLATION OF THE DESCRIPTION OR TO PAY THE FEE WITHIN THE PRESCRIBED TIME-LIMIT Effective date: 20191211 |
|
| 26N | No opposition filed |
Effective date: 20200914 |
|
| PG25 | Lapsed in a contracting state [announced via postgrant information from national office to epo] |
Ref country code: PL Free format text: LAPSE BECAUSE OF FAILURE TO SUBMIT A TRANSLATION OF THE DESCRIPTION OR TO PAY THE FEE WITHIN THE PRESCRIBED TIME-LIMIT Effective date: 20191211 Ref country code: AT Free format text: LAPSE BECAUSE OF FAILURE TO SUBMIT A TRANSLATION OF THE DESCRIPTION OR TO PAY THE FEE WITHIN THE PRESCRIBED TIME-LIMIT Effective date: 20191211 Ref country code: SI Free format text: LAPSE BECAUSE OF FAILURE TO SUBMIT A TRANSLATION OF THE DESCRIPTION OR TO PAY THE FEE WITHIN THE PRESCRIBED TIME-LIMIT Effective date: 20191211 |
|
| PG25 | Lapsed in a contracting state [announced via postgrant information from national office to epo] |
Ref country code: MC Free format text: LAPSE BECAUSE OF FAILURE TO SUBMIT A TRANSLATION OF THE DESCRIPTION OR TO PAY THE FEE WITHIN THE PRESCRIBED TIME-LIMIT Effective date: 20191211 |
|
| REG | Reference to a national code |
Ref country code: BE Ref legal event code: MM Effective date: 20200531 |
|
| PG25 | Lapsed in a contracting state [announced via postgrant information from national office to epo] |
Ref country code: LU Free format text: LAPSE BECAUSE OF NON-PAYMENT OF DUE FEES Effective date: 20200522 |
|
| PG25 | Lapsed in a contracting state [announced via postgrant information from national office to epo] |
Ref country code: BE Free format text: LAPSE BECAUSE OF NON-PAYMENT OF DUE FEES Effective date: 20200531 |
|
| PG25 | Lapsed in a contracting state [announced via postgrant information from national office to epo] |
Ref country code: TR Free format text: LAPSE BECAUSE OF FAILURE TO SUBMIT A TRANSLATION OF THE DESCRIPTION OR TO PAY THE FEE WITHIN THE PRESCRIBED TIME-LIMIT Effective date: 20191211 Ref country code: MT Free format text: LAPSE BECAUSE OF FAILURE TO SUBMIT A TRANSLATION OF THE DESCRIPTION OR TO PAY THE FEE WITHIN THE PRESCRIBED TIME-LIMIT Effective date: 20191211 Ref country code: CY Free format text: LAPSE BECAUSE OF FAILURE TO SUBMIT A TRANSLATION OF THE DESCRIPTION OR TO PAY THE FEE WITHIN THE PRESCRIBED TIME-LIMIT Effective date: 20191211 |
|
| PG25 | Lapsed in a contracting state [announced via postgrant information from national office to epo] |
Ref country code: MK Free format text: LAPSE BECAUSE OF FAILURE TO SUBMIT A TRANSLATION OF THE DESCRIPTION OR TO PAY THE FEE WITHIN THE PRESCRIBED TIME-LIMIT Effective date: 20191211 |
|
| PGFP | Annual fee paid to national office [announced via postgrant information from national office to epo] |
Ref country code: IE Payment date: 20240509 Year of fee payment: 12 |
|
| PGFP | Annual fee paid to national office [announced via postgrant information from national office to epo] |
Ref country code: GB Payment date: 20240502 Year of fee payment: 12 |
|
| PGFP | Annual fee paid to national office [announced via postgrant information from national office to epo] |
Ref country code: DE Payment date: 20240502 Year of fee payment: 12 |
|
| PGFP | Annual fee paid to national office [announced via postgrant information from national office to epo] |
Ref country code: CH Payment date: 20240602 Year of fee payment: 12 |
|
| PGFP | Annual fee paid to national office [announced via postgrant information from national office to epo] |
Ref country code: ES Payment date: 20240611 Year of fee payment: 12 |
|
| PGFP | Annual fee paid to national office [announced via postgrant information from national office to epo] |
Ref country code: IT Payment date: 20240513 Year of fee payment: 12 Ref country code: FR Payment date: 20240509 Year of fee payment: 12 |