WO2025004500A1 - プロジェクト計画適正化ツール、及びプロジェクト計画適正化方法 - Google Patents
プロジェクト計画適正化ツール、及びプロジェクト計画適正化方法 Download PDFInfo
- Publication number
- WO2025004500A1 WO2025004500A1 PCT/JP2024/014843 JP2024014843W WO2025004500A1 WO 2025004500 A1 WO2025004500 A1 WO 2025004500A1 JP 2024014843 W JP2024014843 W JP 2024014843W WO 2025004500 A1 WO2025004500 A1 WO 2025004500A1
- Authority
- WO
- WIPO (PCT)
- Prior art keywords
- project
- value parameter
- planned value
- planned
- optimization tool
- Prior art date
- Legal status (The legal status is an assumption and is not a legal conclusion. Google has not performed a legal analysis and makes no representation as to the accuracy of the status listed.)
- Ceased
Links
Images

Classifications
-
- G—PHYSICS
- G06—COMPUTING OR CALCULATING; COUNTING
- G06Q—INFORMATION AND COMMUNICATION TECHNOLOGY [ICT] SPECIALLY ADAPTED FOR ADMINISTRATIVE, COMMERCIAL, FINANCIAL, MANAGERIAL OR SUPERVISORY PURPOSES; SYSTEMS OR METHODS SPECIALLY ADAPTED FOR ADMINISTRATIVE, COMMERCIAL, FINANCIAL, MANAGERIAL OR SUPERVISORY PURPOSES, NOT OTHERWISE PROVIDED FOR
- G06Q10/00—Administration; Management
- G06Q10/06—Resources, workflows, human or project management; Enterprise or organisation planning; Enterprise or organisation modelling
Definitions
- the present invention relates to a project planning optimization tool that optimizes planning parameters based on project outcome predictions when planning a project.
- project outcome prediction technology When planning a project, project outcome prediction technology has been developed that compares the planned values with accumulated actual values and predicts the outcome. There are various prediction methods, but this involves searching through accumulated project management data for past projects that are similar to or have similar trends to the new project to be predicted, and predicting the project's evaluation value based on the management data of the past projects found.
- the accumulated data includes explanatory variables used to find similarities and objective variables, which are the items to be predicted.
- Explanatory variables are values based on the nature of the project and the development content, such as the product category or the scale of development.
- objective variables are evaluation values that indicate the results of the development project, such as the labor hours and costs determined at the end of past projects.
- explanatory variables and objective variables can be viewed as a rule-based causal relationship, and in project outcome prediction technology, the relationship between explanatory variables and objective variables is treated as a prediction model.
- the prediction model receives the explanatory variables of the project to be predicted as input, and outputs a predicted result evaluation value as the objective variable.
- Prediction technology can be applied at the start of a project, but there are explanatory variables that are difficult to determine at the start of a project, and some are entered as planned values.
- Patent Document 1 JP 2022-32115 A discloses a project sign detection device that includes a storage device that holds information on the content and profit and loss of each past project, a process that extracts the information on each of the past projects from the storage device, and generates a decision tree for each explanatory variable by machine learning, with the values of one or more predetermined items in the content of each piece of information as explanatory variables and the profit and loss situation of each piece of information as a target variable, and a calculation device that executes a process of extracting values of items corresponding to the explanatory variables of the decision tree from the information on the content of a target project and inputting them into the corresponding decision trees, and calculating the failure probability of the target project by a random forest algorithm.
- the above project outcome prediction technology is used in drawing up project plans.
- planning a project based on appropriate planned values that will produce favorable results using project outcome prediction technology the validity of the plan can be confirmed. For example, results based on planned values created by humans can be checked using project outcome prediction technology to see if the plan is unrealistic. Furthermore, if necessary, the planned values can be updated and predicted again, allowing adjustments to be made to obtain better predicted results.
- a project plan optimization tool that outputs information related to improvement proposals for a project's business plan is configured by a computer having a calculation device that executes calculation processing and a storage device accessible by the calculation device, and is characterized by comprising: a planned value parameter input unit to which a first planned value parameter for each of a plurality of phases into which the project is divided is input; a past performance information accumulation unit that accumulates the actual value parameters and result evaluation values of each phase of a plurality of past projects; a past performance information analysis unit that associates and analyzes the actual value parameters and result evaluation values of each phase of the past projects to generate a prediction model for the project; a project result prediction unit that predicts the result evaluation value from the first planned value parameters using the prediction model; and a planned value parameter optimization unit that reallocates the first planned value parameters between the phases and outputs optimized second planned value parameters.
- the planned parameters of a project can be optimized. Problems, configurations, and advantages other than those described above will become clear from the explanation of the following examples.
- FIG. 1 is a diagram showing an overall configuration of a project plan optimization tool according to an embodiment of the present invention. 11 is a flowchart of an optimization process according to an embodiment of the present invention.
- FIG. 2 is a diagram showing multiple phases constituting a project according to an embodiment of the present invention.
- FIG. 1 is a diagram illustrating definitions of project plan values and result forecasts for each phase in an embodiment of the present invention.
- FIG. 13 is a diagram showing an example of the configuration of a migration rule table according to the embodiment of the present invention.
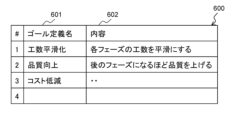
- FIG. 13 is a diagram illustrating an example of a configuration of a goal definition table according to the embodiment of the present invention.
- FIG. 1 is a diagram showing the overall configuration of a project plan optimization tool 100 according to the present embodiment.
- the project plan optimization tool 100 has a project result prediction unit 101, a planned value parameter optimization unit 102, a past performance information analysis unit 103, and a user interface unit 110.
- the user interface unit 110 has a function of presenting the execution results of the program to the user via a display device or an input device and receiving input from the user, and has a planned value parameter input unit 111, a project forecast result output unit 112, a movement rule input unit 113, an optimization goal definition input unit 114, and an optimization result output unit 115.
- the past performance information analysis unit 103 is also connected to a past performance information accumulation unit 120, refers to project performance information 121, and holds a prediction model 104, which is the analysis result.
- the project result prediction unit 101 has a function of predicting the results of a project by simulating the project, and predicts a predicted result evaluation value based on the prediction model 104 for the planned value parameters input to the planned value parameter input unit 111.
- the predicted predicted result evaluation value is displayed on the project prediction result output unit 112.
- the planned value parameter optimization unit 102 reallocates the planned value parameters to the prediction results by the project result prediction unit 101 to optimize the prediction results.
- the constraint conditions for the planned value parameters in optimization are obtained from the movement rule input unit 113, and the goal conditions for optimization are obtained from the optimization goal definition input unit 114.
- the optimization results obtained by the planned value parameter optimization unit 102 are output from the optimization result output unit 115.
- the past performance information analysis unit 103 analyzes the project performance information 121 stored in the past performance information accumulation unit 120, and generates and stores the prediction model 104.
- the past performance information stores a wide range of information that can be explanatory variables for the prediction model as project parameters, such as the period, development scale (number of lines of development, number of requirements), product category, distinction between new development and derivative development, safety/security level, and execution environment aspects (OS, CPU).
- the final labor hours, cost (amount), quality (defect information), delivery date, etc. are stored as result information that can be the objective variable.
- the past performance information analysis unit 103 models the causal relationships in these explanatory variables and objective variables, generates and holds the prediction model 104.
- Machine learning technology can be used as one generation method. Generally, in such cases, supervised machine learning regression analysis is used, learning the explanatory variables and objective variables as teacher data, and generating a prediction model.
- the project plan optimization tool 100 of this embodiment is composed of a computer having a processor (CPU), memory, auxiliary storage device, communication interface, input interface, and output interface.
- the processor is a computing device that executes programs stored in memory.
- the processor executes various programs to realize the functions of each functional unit of the project plan optimization tool 100 (e.g., project result prediction unit 101, planned value parameter optimization unit 102, past performance information analysis unit 103, etc.). Note that some of the processing performed by the processor by executing the programs may be executed by other computing devices (e.g., hardware such as ASIC and FPGA).
- Memory includes ROM, which is a non-volatile storage element, and RAM, which is a volatile storage element.
- ROM stores unchanging programs (e.g., BIOS).
- RAM is a high-speed, volatile storage element such as DRAM (Dynamic Random Access Memory), and temporarily stores programs executed by the processor and data used when executing programs.
- the auxiliary storage device is, for example, a large-capacity, non-volatile storage device such as a magnetic storage device (HDD) or a flash memory (SSD).
- the auxiliary storage device also stores data used by the processor when executing a program, and the program executed by the processor. In other words, the program is read from the auxiliary storage device, loaded into memory, and executed by the processor to realize each function of the project plan optimization tool 100.
- the communication interface is a network interface device that controls communications with other devices according to a specified protocol.
- the input interface is an interface that receives input from a user, such as a keyboard or mouse.
- the input interface receives input of a file in which cost data is recorded and stored in an auxiliary storage device.
- the input interface may also provide a GUI and receive input of cost data from a user.
- An output interface is an interface that outputs the results of a program execution in a format that is visible to the user, such as a display device or a printer.
- the output interface outputs the results of a program execution.
- the output interface may also be a data output port that outputs the results of a program execution in a format that is visible to the user.
- a terminal connected to the computer via a network may provide the input interface and output interface.
- the programs executed by the processor are provided to the computer via removable media (CD-ROM, flash memory, etc.) or a network, and are stored in a non-volatile auxiliary storage device, which is a non-transient storage medium. For this reason, it is preferable for the computer to have an interface for reading data from removable media.
- the project plan optimization tool 100 is a computer system configured on one physical computer, or on multiple logically or physically configured computers, and may operate on a virtual computer constructed on multiple physical computer resources.
- the project result prediction unit 101, the planned value parameter optimization unit 102, and the past performance information analysis unit 103 may each operate on separate physical or logical computers, or multiple units may be combined to operate on a single physical or logical computer.
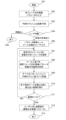
- FIG. 2 is a flowchart of the optimization process in this embodiment.
- the optimization process shown in FIG. 2 starts when the prediction model 104 that is the premise of the process has been generated by the past performance information analysis unit 103 (201).
- step 202 the input of the planned value parameters for each phase that constitutes the project is received from the planned value parameter input unit 111.
- step 203 the project result prediction unit 101 predicts the result evaluation value for the planned value parameters using the prediction model 104, and predicts the project result.
- the prediction of the project result is performed on a phase-by-phase basis, and a series of predicted values for one type of prediction target variable is output for the number of phases that make up the project.
- step 204 the predicted result evaluation value is presented to the user, and the user is asked whether or not it is necessary to continue the optimization process. If it is not necessary to continue the optimization process, the process ends (205).
- step 206 the planned value parameter movement rules are received as user input from the movement rule input unit 113, and the optimization goal definition is received from the optimization goal definition input unit 114.
- step 207 the degree of deviation of the series of predicted values generated in step 203 or step 210 (described later) from the input optimization goal definition is evaluated. For example, for a numerical sequence for which the goal definition can be changed, the deviation can be determined from the difference with the corresponding predicted value. At that time, the phase with the largest deviation is selected and stored as the selected phase for the subsequent step.
- step 208 the possibility of moving the planned value parameters of the selected phase is evaluated according to the planned value parameter movement rules between phases, and candidates for the planned value parameters after the movement are prepared. This process is performed for all applicable movement rules, and groups of planned value parameters obtained by combining the planned value parameter candidates are listed as patterns and stored.
- step 209 the project result prediction unit 101 predicts the result evaluation values for all patterns of the planned value parameter groups in sequence. A series of predicted result evaluation values for all patterns is obtained.
- step 210 the result that is closest to all predicted outcome scores is recorded against the optimization goal definition.
- step 211 it is determined whether sufficient optimization has been performed. This determination may be made by using a predetermined threshold value to determine the closeness to the optimization goal definition in the comparison in step 210, or it may be determined that sufficiency has been met based on the number of repetitions performed since step 207. As a result, if the optimization is insufficient, the process returns to step 207 and repeats the process.
- step 211 If it is determined in step 211 that the optimization is sufficient, the optimized planned value parameters, which are the result of the optimization, are presented to the user in step 212, and the process ends (213).
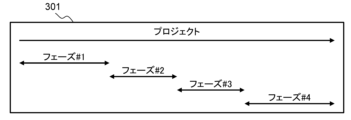
- Figure 3 shows the multiple phases that make up a project.
- the horizontal axis is the project timeline, on which four phases are defined. Each phase exists by dividing the project along the timeline, but the duration of each phase is not clearly separated by a certain date, and there may be overlapping periods between adjacent phases, or there may be gaps between phases.
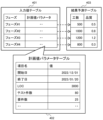
- Figure 4 shows the definition of the project plan values and result forecasts for each phase shown in Figure 3.
- step 202 the planned value parameters for each phase, which are composed of the input value table 401 and the planned value parameter table 402, are input to the planned value parameter input unit 111.
- step 209 multiple patterns of planned value parameter groups corresponding to the input value table 401 and the planned value parameter table 402 are created according to the movement rules. These become candidates for optimization. The results of predictions made using these are stored in the same data structure as the result prediction table 403.
- step 210 the input value table 401, the planned value parameter table 402, and the result prediction table 403 are stored for use in subsequent processing with the set of planned value parameters that have resulted in the appropriate result at that time. If optimization is to continue, the values in the stored tables are used in steps 207 and 208. If proceeding to step 212, the values in the stored tables are used.
- the input value table 401 holds the planned value parameters for each phase.
- Each planned value parameter is structured like the planned value parameter table 402, and stores the planned value in the definition item.
- a different instance of the planned value parameter table 402 is created for each row of the input value table 401, and holds information for each phase.
- the project result prediction unit 101 acquires information held in the input value table 401 and the planned value parameter table 402 for each phase, predicts the project results (man-hours, quality) using the prediction model 104, and stores the predicted values in the result prediction table 403. When there are multiple types of objects to be predicted, a predicted value is stored for each prediction object.
- Figure 4 shows an example of prediction for two types of prediction objects, man-hours and quality.
- the movement rule table 500 will be explained with reference to FIG. 5.
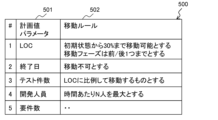
- the movement rule table 500 in which the movement rules for the planned value parameters are defined, includes the planned value parameters 501 and their movement rules 502, and the movement rules input by the user to the movement rule input unit 113 are recorded for each type of planned value parameter as shown in the example rules below.
- the movement rule table 500 is stored in the memory of the computer in which the project plan optimization tool 100 is implemented.
- the planned value parameter "LOC” has two rules: "It can be moved up to 30% from the initial state” and "The distance of the moving phase is limited to one phase forward or backward.”
- LOC is an abbreviation for Line of Code and represents the number of lines.
- the former rule specifies the maximum amount by which the planned value parameter LOC can be moved in step 208, and for example, the planned value initially entered in step 202 is 1000 lines, and the rule states that it can be moved up to 30% forward or backward, or up to 300 lines, by optimization.
- the latter is a rule regarding the range of destination phases that allows the planned value parameters to be moved only to adjacent phases before and after the selected phase when considering the movement of the planned value parameters in step 208, with the selected phase being the target.
- the planned value parameter "end date" is not movable, and is not subject to consideration of the possibility of moving in step 208.
- the project planned values there are some planned value parameters that cannot be changed depending on their nature or organizational circumstances. Such rules can also be defined.
- a rule is defined for the planned value parameter "number of tests" that "it moves in proportion to LOC.”
- the planned value parameters are not independent and may have a correlation with each other. In such cases, it is desirable to maintain the relationship of the planned value parameters when considering the amount of movement in step 208.
- LOC and number of tests are considered to be proportional, and the rule is to consider the possibility of moving both planned value parameters, the LOC value and the number of tests, while maintaining their proportional relationship.
- Such interrelationships may be three or more.
- a numerical range specific to the planned value parameter is defined.
- the upper limit for development personnel is set to N people per unit time, and in step 208, a change in the planned value is considered so as not to exceed this number.
- the description is in natural language, but it is a good idea to prepare a template for such rules in advance on the user interface and implement it in a format such as selecting a template and specifying the details with numbers.
- the template shows the rule definition in a format such as "Can move X% from initial state” or "Move in proportion to X”, and after selecting a template on the user interface, the numerical value of X or the target is entered.
- This template can be prepared without depending on any specific planned value parameters.
- the user generates a movement rule table 500 in which movement rules are defined by sequentially assigning rules to each planned value parameter. It is also assumed that rules will be applied in a more or less fixed manner depending on the organization. In such a case, it is also possible to read movement rules defined in a previously prepared table, and customize the loaded movement rules for use.
- a pattern of parameter movement is generated. For example, if the movement rule is "can move up to 30% from the initial state", candidates for the amount of movement are selected within 30%. There are several possible approaches, but if it is performed collectively within a range, the possible range of the amount of movement is divided into equal intervals (for example, 10 equal parts) to create a group of candidates. Furthermore, according to the rule "up to one movement phase forward or backward", a combination of the amount of movement forward and backward is created as a group of candidates.
- step 209 candidates are similarly created for the subsequent movement rules, prediction is performed using the prediction model 104 for all patterns of the planned value parameter group derived by the combination of candidates, and appropriate planned value parameters are found in step 210. It is recommended to evaluate all combinations, but as the number of combinations increases, an increase in the amount of calculation is expected, so it is recommended to suppress the increase in the amount of calculation by a method of selectively evaluating patterns using random numbers, etc., or by preferentially incorporating candidates with fewer differences from the initial state into the pattern. Additionally, the causal relationship information in the prediction model 104 may be used to determine the priority of explanatory variables that have an impact based on the desired goal definition, and patterns may be created in that order.
- the goal definition table 600 will be explained with reference to FIG. 6.
- the goal definition table 600 records the contents of the goal definition entered by the user in step 206.
- the goal definition table 600 includes a goal definition name 601, which is a name for identifying the goal definition, and its contents 602.
- the goal definition is compared with the prediction result to evaluate the degree of achievement of optimization.
- the goal is to make the effort predicted for each phase as the objective variable uniform throughout the project.
- the goal definition it is preferable that it can be specified in natural language as shown in content 602 or in a template similar to the movement rules described above.
- the objective variable specified in the goal definition content 602 is re-expressed as a numerical value as a result of the sequence for each phase.
- the goal is reached when the predicted result of the effort for each phase falls within a specified error range with the average effort for each phase.
- the predicted result that minimizes the difference in effort for each phase and the planned value parameters after movement at that time are selected.
- the goal is for quality to improve the later the phase in the chronological order.
- a goal numerical value is set that slopes according to the position of each phase on the time axis.
- the slope of the numerical value may be an implicitly specified value, or it may be specified by the user.
- bug density or number of bugs it is desirable for the quality indicator to decrease as time progresses toward completion.
- the quality indicator for each phase can be calculated as a goal numerical value using the expected quality indicator for the entire project (bug density, number of bugs) and the specified slope.
- goal definitions are defined individually for multiple objective variables. Therefore, in the judgment of step 211, the closeness between the calculated objective variables and each goal definition shown in the goal definition table 600 is evaluated. Most simply, it is advisable to select as the solution the case in which the average difference between the calculated objective variables and each goal definition value is smallest.
- the goal definition may be defined by a combination of multiple conditions.
- a priority may be assigned to each goal definition, and a weighted average value based on the priority may be used. This allows a solution that prioritizes goal definitions with higher priorities to be selected in step 210.
- the plan value parameters can be reallocated between the phases, and the plan value parameters can be optimized.
- the plan value movement rules can be used to obtain appropriate plan value parameters that ensure the validity of the plan values.
- the user can input the shape of the plan value transition desired as a target goal, and the target goal is approached within the range permitted by the movement rules, thereby obtaining plan value parameters that derive the project results desired by the user.
- Example 2 In the first embodiment, a candidate group for reallocation of planned value parameters is generated using the movement rule shown in FIG. 3 as a constraint condition, and the search for a planned value parameter that derives an appropriate prediction result is limited to the candidate group under this constraint condition. However, even when some constraints are released, a calculated value parameter that derives an appropriate prediction result may exist. In this case, if the released constraint is permissible, the optimized calculated value parameter obtained therein may also be used.
- it is possible patterns of parameter movement in step 208 it is possible to intentionally deviate from the movement rule, for example, to search for a combination of parameters that are redistributed within a range of 50% rule deviation conditions for the movement rule in the range of "30% from the initial state" in FIG. 5, and it is considered that a more appropriate result may be obtained than when complying with the movement rule.
- the result display in step 212 may display the deviated movement rule together with a comparison of the result of deviating from the movement rule and the result that complies with the movement rule, allowing the user to decide whether or not to deviate from the movement rule.
- the present invention is not limited to the above-described embodiments, but includes various modified examples and equivalent configurations within the spirit of the appended claims.
- the above-described embodiments have been described in detail to clearly explain the present invention, and the present invention is not necessarily limited to having all of the configurations described.
- part of the configuration of one embodiment may be replaced with the configuration of another embodiment.
- the configuration of another embodiment may be added to the configuration of one embodiment.
- part of the configuration of each embodiment may be added, deleted, or replaced with other configurations.
- each of the configurations, functions, processing units, processing means, etc. described above may be realized in part or in whole in hardware, for example by designing them as integrated circuits, or may be realized in software by a processor interpreting and executing a program that realizes each function.
- Information such as programs, tables, and files that realize each function can be stored in a storage device such as a memory, hard disk, or SSD (Solid State Drive), or in a recording medium such as an IC card, SD card, or DVD.
- a storage device such as a memory, hard disk, or SSD (Solid State Drive)
- a recording medium such as an IC card, SD card, or DVD.
- control lines and information lines shown are those considered necessary for explanation, and do not necessarily represent all control lines and information lines necessary for implementation. In reality, it is safe to assume that almost all components are interconnected.
Landscapes
- Engineering & Computer Science (AREA)
- Business, Economics & Management (AREA)
- Human Resources & Organizations (AREA)
- Strategic Management (AREA)
- Economics (AREA)
- Entrepreneurship & Innovation (AREA)
- Educational Administration (AREA)
- Game Theory and Decision Science (AREA)
- Development Economics (AREA)
- Marketing (AREA)
- Operations Research (AREA)
- Quality & Reliability (AREA)
- Tourism & Hospitality (AREA)
- Physics & Mathematics (AREA)
- General Business, Economics & Management (AREA)
- General Physics & Mathematics (AREA)
- Theoretical Computer Science (AREA)
- Management, Administration, Business Operations System, And Electronic Commerce (AREA)
Abstract
プロジェクト計画適正化ツールであって、前記プロジェクトが複数に分割された各フェーズに対する第1の計画値パラメータが入力される計画値パラメータ入力部と、複数の過去プロジェクトの各フェーズの実績値パラメータと結果評価値とを蓄積する過去実績情報蓄積部と、前記過去プロジェクトの各フェーズの実績値パラメータと結果評価値とを対応付けて分析し、プロジェクトの予測モデルを生成する過去実績情報分析部と、前記予測モデルを用いて、第1の計画値パラメータから結果評価値を予測するプロジェクト結果予測部と、前記第1の計画値パラメータを前記フェーズ間で再配分して、適正化された第2の計画値パラメータを出力する計画値パラメータ適正化部とを備える。
Description
本出願は、令和5年(2023年)6月30日に出願された日本出願である特願2023-108268の優先権を主張し、その内容を参照することにより、本出願に取り込む。
本発明は、プロジェクトを計画するにあたり、プロジェクトの結果予測に基づいて計画値パラメータを適正化するプロジェクト化計画適正化ツールに関する。
ソフトウェア開発プロジェクトにおいて、蓄積されたプロジェクトの管理データの実績値に基づいて分析や判断を行うデータ利活用が行われている。これにより、プロジェクト計画を効率よく推進し、予測技術によって早期にリスクを検知できる。
プロジェクトを計画するにあたり、その計画値を蓄積された実績値と照合し、結果を予測するプロジェクト結果予測技術が開発されている。予測の方法は様々であるが、予測しようとする新たなプロジェクトに類似する又は傾向が近い過去プロジェクトを、蓄積されたプロジェクト管理データ群から探索し、探索された過去プロジェクトの管理データに基づいて、プロジェクトの評価値を予測する。
このとき蓄積データには、類似性を見つけるために用いられる説明変数と、予測対象の項目である目的変数とが含まれる。説明変数は、プロジェクトの性質や開発内容に基づく値であり、例えば、製品カテゴリや開発の規模などである。一方、目的変数は、開発プロジェクトの結果を示す評価値であり、過去のプロジェクト終了時に確定した工数やコストなどである。
説明変数と目的変数との関係はルールに基づく因果関係として捉えることができ、プロジェクト結果予測技術では説明変数と目的変数との関係を予測モデルとして扱う。プロジェクト結果予測技術では、予測モデルが、予測するプロジェクトの説明変数の入力を受け、目的変数として結果評価値の予測値を出力する。プロジェクト開始時に予測技術を適用してもよいが、プロジェクト開始時には確定しづらい説明変数があり、一部は計画値として入力される。
本技術分野の背景技術として、以下の先行技術がある。特許文献1(特開2022-32115号公報)は、過去のプロジェクトそれぞれの内容および損益に関する各情報を保持する記憶装置と、前記記憶装置から前記過去のプロジェクトそれぞれの前記各情報を抽出し、当該各情報のうち前記内容における予め定めた1 又は複数の項目の値を説明変数、前記各情報のうち前記損益の状況を目的変数とした、前記説明変数ごとの決定木を機械学習により生成する処理と、対象プロジェクトの内容の情報のうち、前記決定木の説明変数に応じた項目の値を抽出して対応する各決定木に入力し、ランダムフォレストアルゴリズムにより、前記対象プロジェクトの失敗確率を算出する処理を実行する演算装置と、を備えることを特徴とするプロジェクト予兆検知装置を開示する。
以上のようなプロジェクト結果予測技術は、プロジェクト計画の立案に用いられる。プロジェクト結果予測技術で好適な結果となる適正な計画値に基づいてプロジェクトを計画することで、計画の妥当性が裏付けられる。例えば、人が作成した計画値に基づく結果をプロジェクト結果予測技術によってチェックし、計画に無理があるかを確認できる。また必要に応じて計画値を更新し再度予測し、より良い予測結果が得られるように調整できる。
一方、多くの場合、開発プロジェクトは、時系列で開発やリリースの時期で区切られる複数のフェーズに分けて管理される。プロジェクト計画時には、予め想定される開発規模、期間、予算、人員等の計画値の各フェーズへの配分という要件が新たに求められる。プロジェクト結果予測技術は、各フェーズに対して適用できる。その場合、フェーズ単位の説明変数を入力し、フェーズごとの目的変数として結果評価値の予測値を出力できる。一つの目的変数について、プロジェクト計画全体として見れば、プロジェクトを通じてフェーズ単位での推移が確認できる。例えば、どのフェーズで負担が発生しそうか、などの観点での予測結果を得られる。このような結果を受けて、計画値を調整し、フェーズ間の負担の平滑化やフェーズ単位のリスク対策などの方策が求められる。
プロジェクトが分割されたフェーズ単位で結果を予測した後、フェーズ単位の結果評価値の予測値がユーザに望ましい値となるように説明変数の入力値を調整するには、試行錯誤のコストが大きく、この適正化を自動的に行う技術が求められる。
本願において開示される発明の代表的な一例を示せば以下の通りである。すなわち、プロジェクトの業務計画の改善提案に関する情報を出力するプロジェクト計画適正化ツールであって、演算処理を実行する演算装置と、前記演算装置がアクセス可能な記憶装置とを有する計算機で構成され、前記プロジェクトが複数に分割された各フェーズに対する第1の計画値パラメータが入力される計画値パラメータ入力部と、複数の過去プロジェクトの各フェーズの実績値パラメータと結果評価値とを蓄積する過去実績情報蓄積部と、前記過去プロジェクトの各フェーズの実績値パラメータと結果評価値とを対応付けて分析し、プロジェクトの予測モデルを生成する過去実績情報分析部と、前記予測モデルを用いて、第1の計画値パラメータから結果評価値を予測するプロジェクト結果予測部と、前記第1の計画値パラメータを前記フェーズ間で再配分して、適正化された第2の計画値パラメータを出力する計画値パラメータ適正化部とを備えることを特徴とする。
本発明の一態様によれば、プロジェクトの計画値パラメータを適正化できる。前述した以外の課題、構成及び効果は、以下の実施例の説明によって明らかにされる。
<実施例1>
図1は、本実施例のプロジェクト計画適正化ツール100の全体構成を示す図である。
図1は、本実施例のプロジェクト計画適正化ツール100の全体構成を示す図である。
プロジェクト計画適正化ツール100は、プロジェクト結果予測部101と、計画値パラメータ適正化部102と、過去実績情報分析部103と、ユーザインタフェイス部110とを有する。ユーザインタフェイス部110は、ディスプレイ装置や入力装置を介してプログラムの実行結果をユーザへ提示し、ユーザによる入力を受領する機能を有し、計画値パラメータ入力部111と、プロジェクト予測結果出力部112と、移動ルール入力部113と、適正化ゴール定義入力部114と、適正化結果出力部115とを有する。また、過去実績情報分析部103は、過去実績情報蓄積部120と接続され、プロジェクト実績情報121を参照し、分析結果である予測モデル104を保持する。
プロジェクト結果予測部101は、プロジェクトのシミュレーションによって、プロジェクトの結果を予測する機能を有し、計画値パラメータ入力部111に入力された計画値パラメータを、予測モデル104に基づいて予測結果評価値を予測する。予測された予測結果評価値はプロジェクト予測結果出力部112に表示される。
計画値パラメータ適正化部102は、プロジェクト結果予測部101による予測結果に計画値パラメータを再配分して、予測結果を適正化する。適正化における計画値パラメータの制約条件を移動ルール入力部113から取得し、適正化のゴール条件を適正化ゴール定義入力部114から取得する。計画値パラメータ適正化部102が適正化した結果は適正化結果出力部115から出力される。
過去実績情報分析部103は、過去実績情報蓄積部120が保持するプロジェクト実績情報121を分析し、予測モデル104を生成し、保持する。
ソフトウェア開発のプロジェクトを前提により具体的な例示すれば、過去の実績情報には、プロジェクトのパラメータとして、予測モデルの説明変数となり得る期間、開発規模(開発行数、要件数)、製品カテゴリ、新規開発/派生開発の区別、安全性/セキュリティレベル、実行環境面(OS、CPU)などの多岐にわたる情報が蓄積されている。また目的変数となり得る結果情報として、最終的な工数や、コスト(金額)、品質(不具合情報)、納期などが格納される。過去実績情報分析部103は、これらの説明変数及び目的変数群における因果関係をモデル化し予測モデル104を生成し、保持する。その一つの生成手段として機械学習の技術を使用できる。一般に、このようなケースでは教師ありの機械学習回帰分析が用いられ、説明変数及び目的変数を教師データとして学習し、予測モデルを生成する。
本実施例のプロジェクト計画適正化ツール100は、プロセッサ(CPU)、メモリ、補助記憶装置、通信インターフェース、入力インターフェース、及び出力インターフェースを有する計算機によって構成される。
プロセッサは、メモリに格納されたプログラムを実行する演算装置である。プロセッサが、各種プログラムを実行することによって、プロジェクト計画適正化ツール100の各機能部(例えば、プロジェクト結果予測部101、計画値パラメータ適正化部102、過去実績情報分析部103など)による機能が実現される。なお、プロセッサがプログラムを実行して行う処理の一部を、他の演算装置(例えば、ASIC、FPGA等のハードウェア)で実行してもよい。
メモリは、不揮発性の記憶素子であるROM及び揮発性の記憶素子であるRAMを含む。ROMは、不変のプログラム(例えば、BIOS)などを格納する。RAMは、DRAM(Dynamic Random Access Memory)のような高速かつ揮発性の記憶素子であり、プロセッサが実行するプログラム及びプログラムの実行時に使用されるデータを一時的に格納する。
補助記憶装置は、例えば、磁気記憶装置(HDD)、フラッシュメモリ(SSD)等の大容量かつ不揮発性の記憶装置である。また、補助記憶装置は、プロセッサがプログラムの実行時に使用するデータ、及びプロセッサが実行するプログラムを格納する。すなわち、プログラムは、補助記憶装置から読み出されて、メモリにロードされて、プロセッサによって実行されることによって、プロジェクト計画適正化ツール100の各機能を実現する。
通信インターフェースは、所定のプロトコルに従って、他の装置との通信を制御するネットワークインターフェース装置である。
入力インターフェースは、キーボードやマウスなどの、ユーザからの入力を受けるインターフェースである。例えば、入力インターフェースは、コストデータが記録され、補助記憶装置に格納されるファイルの入力を受け付ける。また、入力インターフェースは、GUIを提供し、ユーザからコストデータの入力を受け付けてもよい。
出力インターフェースは、ディスプレイ装置やプリンタなどの、プログラムの実行結果をユーザが視認可能な形式で出力するインターフェースである。例えば、出力インターフェースは、プログラムの実行結果を出力する。また、出力インターフェースは、プログラムの実行結果をユーザが視認可能な形式で出力するデータ出力ポートでもよい。
なお、計算機にネットワークを介して接続された端末が入力インターフェース及び出力インターフェースを提供してもよい。
プロセッサが実行するプログラムは、リムーバブルメディア(CD-ROM、フラッシュメモリなど)又はネットワークを介して計算機に提供され、非一時的記憶媒体である不揮発性の補助記憶装置に格納される。このため、計算機は、リムーバブルメディアからデータを読み込むインターフェースを有するとよい。
プロジェクト計画適正化ツール100は、物理的に一つの計算機上で、又は、論理的又は物理的に構成された複数の計算機上で構成される計算機システムであり、複数の物理的計算機資源上に構築された仮想計算機上で動作してもよい。例えば、プロジェクト結果予測部101、計画値パラメータ適正化部102、過去実績情報分析部103は、各々別個の物理的又は論理的計算機上で動作するものでも、複数が組み合わされて一つの物理的又は論理的計算機上で動作するものでもよい。
図2は、本実施例の適正化処理のフローチャートである。
図2に示す適正化処理は、処理の前提となる予測モデル104が過去実績情報分析部103によって生成された状態で開始する(201)。
処理が開始すると、ステップ202では、プロジェクトを構成する各フェーズの計画値パラメータの入力を計画値パラメータ入力部111より受ける。
ステップ203では、プロジェクト結果予測部101により、前記計画値パラメータについて予測モデル104を用いて結果評価値を予測し、プロジェクトの結果を予測する。プロジェクトの結果の予測はフェーズ単位で行われ、1種類の予測対象目的変数に対しプロジェクトを構成するフェーズ数分の予測値の連なりとして出力される。
ステップ204では、予測された結果評価値をユーザに提示し、適正化処理の続行の必要性の有無を確認する。適正化処理の続行が必要なければ処理を終了する(205)。
ステップ206では、ユーザ入力として、計画値パラメータ移動ルールを移動ルール入力部113より受け、適正化のゴール定義を適正化ゴール定義入力部114より受ける。
ステップ207では、入力された適正化のゴール定義に対して、ステップ203又は後述するステップ210で生成された予測値の連なりが、どの程度の乖離を持つかを評価する。例えば、ゴール定義を変えられる数値列に対し、対応する予測値との差をもって乖離を判定できる。その際、乖離が最も大きいフェーズを一つ選択し、後続ステップでの選択フェーズとして記憶する。
ステップ208では、フェーズ間の計画値パラメータ移動ルールに従って、選択フェーズの計画値パラメータの移動の可能性を評価し、移動後の計画値パラメータ候補を準備する。全ての適用可能な移動ルールに対してこの処理を実行し、計画値パラメータ候補の組み合わせによって得られる計画値パラメータ群をパターンとして列挙し、記憶する。
ステップ209では、全ての計画値パラメータ群のパターンについて、プロジェクト結果予測部101によって、順次、結果評価値を予測する。全てのパターンについて予測された結果評価値の連なりが得られる。
ステップ210では、適正化ゴール定義と照らし合わせ、予測された全ての結果評価値から最も近い結果を記録する。
ステップ211では、十分な適正化が行われたかを判定する。この判定は、ステップ210の比較における適正化ゴール定義との近さを所定の閾値で判断してもよいし、ステップ207からの繰り返しの実行回数によって十分性を満たしたものと判断してもよい。その結果、適正化が不十分であれば、ステップ207に戻り、処理を繰り返す。
ステップ211で適正化が十分であると判断されれば、ステップ212でユーザに対し、適正化の結果である適正化済の計画値パラメータを提示し、処理を終了する(213)。
図3及び図4を参照して、プロジェクト結果予測部101で行われる処理の具体例を説明する。この処理は、ステップ203及びステップ209で実行される。
図3は、プロジェクトを構成する複数フェーズを示す図である。横軸はプロジェクトの時間軸であり、時間軸において四つのフェーズが定義されている。プロジェクトを時間軸で分割する形で各フェーズが存在するが、各フェースの期間は、ある日付を境に明確に切り分けられるものではなく、前後のフェーズの期間が重複したり、逆にフェーズ間に間が空くこともある。
図4は、図3で示すフェーズ毎のプロジェクト計画値の定義及び結果予測を示す図である。
ステップ202において、入力値テーブル401及び計画値パラメータテーブル402からなる各フェーズの計画値パラメータが計画値パラメータ入力部111に入力される。
ステップ209において、移動ルールに従って、入力値テーブル401及び計画値パラメータテーブル402に相当する計画値パラメータ群の複数のパターンを作成する。これらは適正化の候補となる。それらを用いて予測を行った結果を、結果予測テーブル403と同じデータ構造で保持する。
ステップ210において、その時点で適正な結果となった計画値パラメータのセットで入力値テーブル401、計画値パラメータテーブル402及び結果予測テーブル403を以後の処理で使用するために保持する。適正化を続ける場合、保持したテーブルの値がステップ207及びステップ208において使用される。ステップ212に進む場合、保持されたテーブルの値が使用される。
入力値テーブル401は、各フェーズ毎に計画値パラメータを保持する。各計画値パラメータは計画値パラメータテーブル402のような構成であり、定義項目に計画値を格納する。計画値パラメータテーブル402は、入力値テーブル401の各行ごとに異なるインスタンスが作成され、フェーズ各々の情報を保持する。
プロジェクト結果予測部101は、入力値テーブル401及び計画値パラメータテーブル402が保持する情報をフェーズ毎に取得し、予測モデル104を用いてプロジェクト結果(工数、品質)を予測し、予測値を結果予測テーブル403に格納する。予測する対象が複数種類ある場合、予測対象ごとに予測値が格納される。図4は、工数と品質の2種類の予測対象について予測する例を示す。
図5を参照して、移動ルールテーブル500を説明する。
計画値パラメータの移動ルールが定義される移動ルールテーブル500は、計画値パラメータ501と、その移動ルール502を含み、ユーザが移動ルール入力部113に入力した移動ルールが計画値パラメータの種類毎に以下に例示するルールのように記録される。移動ルールテーブル500は、プロジェクト計画適正化ツール100が実装される計算機のメモリに格納される。
1行目に示す例では、計画値パラメータ「LOC」は、「初期状態から30%まで移動可能とする」「移動フェーズの距離は前後一つまでとする」という二つのルールを持つ。LOCは、Line of Codeの略称で、行数を表す。前者のルールは、計画値パラメータLOCをステップ208で移動させる際の分量の最大値を指定しており、例えば、ステップ202での初期入力での計画値が1000行であるものを、前後30%分、すなわち300行までを適正化によって移動可能であることをルール付けしたものである。
また、後者は、ステップ207での選択フェーズを対象として、ステップ208で計画値パラメータの移動を検討する際、選択フェーズに前後に隣り合うフェーズに対してのみ計画値パラメータを移動することを可能とする移動先フェーズの範囲に関するルールである。
2行目に示す例では、計画値パラメータ「終了日」は移動不可であることを示し、ステップ208での移動可能性検討の対象とならなくなる。プロジェクト計画値の中には、その性質や組織都合に応じて可変でない計画値パラメータも存在する。このようなルールも定義可能とする。
3行目に示す例では、計画値パラメータ「テスト件数」について、「LOCに比例して移動する」というルールを定めている。各計画値パラメータは独立しておらず、互いに関係する相関関係を持ってもよい。そのような場合に、ステップ208での移動量の検討時に、計画値パラメータの関係性の維持が望ましい。この例ではLOCとテスト件数は比例するものとしており、LOCの値とテスト件数の両計画値パラメータは比例関係のまま移動の可能性を検討するルールとなる。このような相互関係は3者以上の関係性でもよい。
4行目に示す例では、計画値パラメータ固有の値の数値範囲を定義している。図3に示す例では、開発人員の上限値を単位時間あたりN人と定めており、ステップ208ではこの数字を上回らないような計画値の移動を検討する。
以上のように、移動ルールテーブル500では4例を示したが、このような形式で計画値パラメータをフェーズ間で移動する際のルールをステップ206において指定できる。
図5に示す例では自然言語で記述されているが、ユーザインタフェイス上は、このようなルールのテンプレートを予め準備しておいて、テンプレートの選択と数字による詳細指定のような形式で実装するとよい。テンプレートは、「初期状態からX%移動可能」「Xに比例して移動」などの形式でルール定義を示し、ユーザインタフェイス上でテンプレート選択後にXの数値や対象を入力する形式である。このテンプレートは、特定の計画値パラメータに依存することなく準備できる。
ユーザは、各計画値パラメータに対し、順次ルールを与えていくことで移動ルールが定義される移動ルールテーブル500を生成する。なお、組織によってルールがある程度固定的に運用されることも想定される。このような場合には、予め準備されたテーブルに定められた移動ルールを読み込んで、読み込んだ移動ルールをカスタマイズして利用する形式でもよい。
図5に示す移動ルールテーブル500の定義に基づいて、ステップ209ではパラメータ移動のパターンを生成する。例えば、移動ルールが「初期状態から30%まで移動可能」であれば、30%の間で移動量の候補を選択する。そのアプローチは複数考えられるが、範囲内で一括して行うのであれば、移動量のとりうる範囲を等間隔に分割(例えば10等分)して、候補の群を作成する。さらに、ルール「移動フェーズを前後一つまで」に従って、前後に移動する分量の組み合わせを候補の群として作成する。ステップ209では、以降の移動ルールについても同様に候補を作成し、候補の組み合わせによって導出される計画値パラメータ群のパターン全てについて予測モデル104を用いて予測を行い、ステップ210で適正な計画値パラメータを見つける。全ての組み合わせについて評価するとよいが、組み合わせが多くなると計算量の増加が想定され、乱数などでパターンを選択的に評価する方法や、初期状態から違いが少ない候補群から優先的にパターンに取り入れるなどの方法によって計算量の増加を抑制するとよい。また、予測モデル104における因果関係の情報を使用して、目的とするゴール定義によって影響を与える説明変数の優先度を把握した上で、その順に従ってパターンを作成してもよい。
図6を参照して、ゴール定義テーブル600について説明する。
ゴール定義テーブル600は、ステップ206でユーザより入力されるゴール定義の内容が記録される。ゴール定義テーブル600は、ゴール定義を識別するための名称であるゴール定義名601と、その内容602を含む。ステップ210において、ゴール定義と予測結果を照合して、適正化の達成度合いを評価する。
1行目に示す工数平滑化の例では、目的変数として各フェーズで予想された工数がプロジェクトを通じて均等となることをゴールとする。ゴール定義は、ユーザ入力時は内容602のように自然言語や前述した移動ルール同様のテンプレートで指定できるとよい。ステップ210における評価の際、ゴール定義の内容602で指定された目的変数についてフェーズごとの連なりの結果、数値として表現し直す。工数平滑化では、各フェーズの工数の予測結果が各フェーズの工数の平均値と所定の誤差範囲内となるとゴールとなる。ステップ210では、各フェーズの工数の差が最も小さくなる予測結果と、その際の移動後の計画値パラメータを選択する。
2行目に示す品質向上の例では、時系列に後のフェーズほど品質が向上するということをゴールとする。このゴール定義では、前述した工数の例と異なり、各フェーズの時間軸の位置に応じて傾斜したゴール数値が定められる。数値の傾きは、暗黙的に規定値でもよいし、ユーザが指定してもよい。バグ密度やバグ数を品質指標として使用すると、品質指標が完成に向けて時間の推移に従って低減することが望ましい。プロジェクト全体として予想される品質指標(バグ密度、バグ数)と定められた傾きによって、各フェーズの品質指標をゴール数値として算出するとよい。
図6に示すように、ゴール定義は、複数の目的変数に対して個別に定められる。そのため、ステップ211の判定において、計算された目的変数とゴール定義テーブル600に示す各ゴール定義との近さを評価する。最も簡単には、計算された目的変数と各ゴール定義値との差の平均が最も小さいケースを解として選択するとよい。ゴール定義は、複数の条件の組み合わせによって定義されてもよい。
また、各ゴール定義に優先度を付与し、優先度に基づいた重み付けされた平均値を用いてもよい。これにより、ステップ210において、より優先度が高いゴール定義を重視した解を選択できる。
以上に説明したように、本発明の実施例のプロジェクト計画最適化ツールによれば、プロジェクトを構成する複数のフェーズ間の計画値の移動によって、フェーズ間で計画値パラメータを再配分し、計画値パラメータを適正化できる。また、計画値の移動ルールによって、計画値の妥当性を担保した適正な計画値パラメータが得られる。さらに、ユーザが望む計画値推移の形を目標ゴールとして入力し、前記移動ルールの許容する範囲で、目標ゴールに近づけるので、ユーザが望むプロジェクトの結果を導出する計画値パラメータが得られる。
<実施例2>
実施例1では、図3に示す移動ルールを制約条件として計画値パラメータの再配分の候補群を生成しており、適正な予測結果を導出する計画値パラメータを見つけるのはこの制約条件下の候補群に限っていた。しかしながら、一部の制約を解除した中にも適正な予測結果を導出する計算値パラメータは存在しうる。その際、解除した制約が許容されるものであれば、そこで得られた適正化された計算値パラメータも利用可能である。本実施例では、ステップ208におけるパラメータ移動の可能性パターンを列挙する際に、意図的に移動ルールを逸脱させる、例えば、図5の「初期状態から30%」の範囲の移動ルールに対し、50%のルール逸脱条件の範囲で再配分されるパラメータの組み合わせを探索すると、移動ルールに準拠する場合より適正な結果が得られることも考えられる。
実施例1では、図3に示す移動ルールを制約条件として計画値パラメータの再配分の候補群を生成しており、適正な予測結果を導出する計画値パラメータを見つけるのはこの制約条件下の候補群に限っていた。しかしながら、一部の制約を解除した中にも適正な予測結果を導出する計算値パラメータは存在しうる。その際、解除した制約が許容されるものであれば、そこで得られた適正化された計算値パラメータも利用可能である。本実施例では、ステップ208におけるパラメータ移動の可能性パターンを列挙する際に、意図的に移動ルールを逸脱させる、例えば、図5の「初期状態から30%」の範囲の移動ルールに対し、50%のルール逸脱条件の範囲で再配分されるパラメータの組み合わせを探索すると、移動ルールに準拠する場合より適正な結果が得られることも考えられる。
このような移動ルールの逸脱によって適正な結果が見つかった場合、ステップ212の結果表示において、逸脱した移動ルールと共に、移動ルールを逸脱した結果と移動ルールに準拠した結果とを比較表示し、移動ルール逸脱の可否をユーザに判断させるとよい。
なお、移動ルールの中には逸脱が許されない厳格なものと、ある程度の逸脱が許容されるものが混在している。図3に示す移動ルールの定義に、移動ルールを逸脱した試行を許可するかの指定を加えることで、無駄のない解の探索が可能となる。
なお、本発明は前述した実施例に限定されるものではなく、添付した特許請求の範囲の趣旨内における様々な変形例及び同等の構成が含まれる。例えば、前述した実施例は本発明を分かりやすく説明するために詳細に説明したものであり、必ずしも説明した全ての構成を備えるものに本発明は限定されない。また、ある実施例の構成の一部を他の実施例の構成に置き換えてもよい。また、ある実施例の構成に他の実施例の構成を加えてもよい。また、各実施例の構成の一部について、他の構成の追加・削除・置換をしてもよい。
また、前述した各構成、機能、処理部、処理手段等は、それらの一部又は全部を、例えば集積回路で設計する等により、ハードウェアで実現してもよく、プロセッサがそれぞれの機能を実現するプログラムを解釈し実行することにより、ソフトウェアで実現してもよい。
各機能を実現するプログラム、テーブル、ファイル等の情報は、メモリ、ハードディスク、SSD(Solid State Drive)等の記憶装置、又は、ICカード、SDカード、DVD等の記録媒体に格納することができる。
また、制御線や情報線は説明上必要と考えられるものを示しており、実装上必要な全ての制御線や情報線を示しているとは限らない。実際には、ほとんど全ての構成が相互に接続されていると考えてよい。
Claims (11)
- プロジェクトの業務計画の改善提案に関する情報を出力するプロジェクト計画適正化ツールであって、
演算処理を実行する演算装置と、前記演算装置がアクセス可能な記憶装置とを有する計算機で構成され、
前記プロジェクトが複数に分割された各フェーズに対する第1の計画値パラメータが入力される計画値パラメータ入力部と、
複数の過去プロジェクトの各フェーズの実績値パラメータと結果評価値とを蓄積する過去実績情報蓄積部と、
前記過去プロジェクトの各フェーズの実績値パラメータと結果評価値とを対応付けて分析し、前記プロジェクトの予測モデルを生成する過去実績情報分析部と、
前記予測モデルを用いて、前記第1の計画値パラメータから結果評価値を予測するプロジェクト結果予測部と、
前記第1の計画値パラメータを前記フェーズ間で再配分して、適正化された第2の計画値パラメータを出力する計画値パラメータ適正化部とを備えることを特徴とするプロジェクト計画適正化ツール。 - 請求項1に記載のプロジェクト計画適正化ツールであって、
前記過去実績情報分析部は、
前記過去実績情報蓄積部に蓄積された前記実績値パラメータと前記結果評価値とを前記フェーズ毎に機械学習によって分析し、
前記実績値パラメータと前記結果評価値との因果関係を学習した予測モデルを生成することを特徴とするプロジェクト計画適正化ツール。 - 請求項1に記載のプロジェクト計画適正化ツールであって、
前記プロジェクト結果予測部は、複数の計画値パラメータによる複数のプロジェクトのシミュレーションによって複数の結果評価値を算出し、
前記計画値パラメータ適正化部は、前記プロジェクトの目標に沿って設定されたゴール定義に近い結果評価値を選択し、前記選択された結果評価値に対応する第2の計画値パラメータを出力することを特徴とするプロジェクト計画適正化ツール。 - 請求項3に記載のプロジェクト計画適正化ツールであって、
前記計画値パラメータ適正化部は、前記ゴール定義と予め設定された誤差範囲内の結果評価値の選択によって適正化が完了したと判定し、前記選択された結果評価値に対応する第2の計画値パラメータを出力することを特徴とするプロジェクト計画適正化ツール。 - 請求項3に記載のプロジェクト計画適正化ツールであって、
前記ゴール定義は、複数の条件の組み合わせによって定義され、前記複数の条件には優先度が指定されることを特徴とするプロジェクト計画適正化ツール。 - 請求項3に記載のプロジェクト計画適正化ツールであって、
前記ゴール定義は、プロジェクト内の時間軸における各フェーズの位置による評価値の推移であることを特徴とするプロジェクト計画適正化ツール。 - 請求項1に記載のプロジェクト計画適正化ツールであって、
前記計画値パラメータ適正化部は、
計画値パラメータの種類ごとに予め設定された移動ルールに基づいて、適切な結果評価値を導出する、フェーズ間の計画値パラメータの移動の組み合わせを探索し、
前記探索された組み合わせによる第2の計画値パラメータを出力することを特徴とするプロジェクト計画適正化ツール。 - 請求項7に記載のプロジェクト計画適正化ツールであって、
前記移動ルールは、計画値パラメータの移動の可否と、計画値パラメータの移動可能な量と、計画値パラメータの移動先フェーズの範囲と、計画値パラメータの移動後の数値範囲との少なくとも一つを指定可能であることを特徴とするプロジェクト計画適正化ツール。 - 請求項7に記載のプロジェクト計画適正化ツールであって、
前記移動ルールは、相関関係がある複数の計画値パラメータの関係性を維持するルールを含むことを特徴とするプロジェクト計画適正化ツール。 - 請求項7に記載のプロジェクト計画適正化ツールであって、
前記計画値パラメータ適正化部は、
前記移動ルールを逸脱した範囲の計画値パラメータの再配分の組合わせを探索し、
移動ルール逸脱条件が付された第2の計画値パラメータを導出することを特徴とするプロジェクト計画適正化ツール。 - プロジェクトの業務計画の改善提案に関する情報を出力するプロジェクト計画適正化ツールが実行するプロジェクト計画適正化方法であって、
前記プロジェクト計画適正化ツールは、演算処理を実行する演算装置と、前記演算装置がアクセス可能な記憶装置とを有する計算機で構成され、
前記記憶装置は、複数の過去プロジェクトの各フェーズの実績値パラメータと結果評価値とを蓄積する過去実績情報蓄積部を有し、
前記プロジェクト計画適正化方法は、
前記プロジェクトが複数に分割された各フェーズに対する第1の計画値パラメータが入力される計画値パラメータ入力手順と、
前記過去プロジェクトの各フェーズの実績値パラメータと結果評価値とを対応付けて分析し、前記プロジェクトの予測モデルを生成する過去実績情報分析手順と、
前記予測モデルを用いて、前記第1の計画値パラメータから結果評価値を予測するプロジェクト結果予測手順と、
前記第1の計画値パラメータを前記フェーズ間で再配分して、適正化された第2の計画値パラメータを出力する計画値パラメータ適正化手順とを備えることを特徴とするプロジェクト計画適正化方法。
Applications Claiming Priority (2)
| Application Number | Priority Date | Filing Date | Title |
|---|---|---|---|
| JP2023-108268 | 2023-06-30 | ||
| JP2023108268A JP2025007094A (ja) | 2023-06-30 | 2023-06-30 | プロジェクト計画適正化ツール、及びプロジェクト計画適正化方法 |
Publications (1)
| Publication Number | Publication Date |
|---|---|
| WO2025004500A1 true WO2025004500A1 (ja) | 2025-01-02 |
Family
ID=93938604
Family Applications (1)
| Application Number | Title | Priority Date | Filing Date |
|---|---|---|---|
| PCT/JP2024/014843 Ceased WO2025004500A1 (ja) | 2023-06-30 | 2024-04-12 | プロジェクト計画適正化ツール、及びプロジェクト計画適正化方法 |
Country Status (2)
| Country | Link |
|---|---|
| JP (1) | JP2025007094A (ja) |
| WO (1) | WO2025004500A1 (ja) |
Citations (8)
| Publication number | Priority date | Publication date | Assignee | Title |
|---|---|---|---|---|
| JP2003345955A (ja) * | 2002-05-23 | 2003-12-05 | Hitachi Ltd | 問題予測および改善プロセス提示システムならびに方法 |
| JP2003345918A (ja) * | 2002-05-27 | 2003-12-05 | Nec Corp | ソフトウェア品質管理システムおよびソフトウェア品質管理方法 |
| JP2003345956A (ja) * | 2002-05-29 | 2003-12-05 | Hitachi Ltd | プロジェクトリスク管理システム、およびプロジェクトリスク管理装置 |
| JP2005216020A (ja) * | 2004-01-30 | 2005-08-11 | Hitachi Ltd | プロジェクト評価システム,プログラムよび記憶媒体 |
| JP2009187288A (ja) * | 2008-02-06 | 2009-08-20 | Nec Corp | プロジェクト変調検出方法およびプロジェクト変調検出装置 |
| US20110282714A1 (en) * | 2002-04-10 | 2011-11-17 | Cullen Iii Andrew A | Computer system and method for producing analytical data related to the project bid and requisition process |
| JP2015014856A (ja) * | 2013-07-04 | 2015-01-22 | 株式会社日立製作所 | ソフトウェア開発プロジェクトの評価方法及びシステム |
| JP2016110231A (ja) * | 2014-12-02 | 2016-06-20 | 三菱電機株式会社 | プロジェクト評価装置及びプロジェクト評価方法及びプロジェクト評価プログラム |
-
2023
- 2023-06-30 JP JP2023108268A patent/JP2025007094A/ja active Pending
-
2024
- 2024-04-12 WO PCT/JP2024/014843 patent/WO2025004500A1/ja not_active Ceased
Patent Citations (8)
| Publication number | Priority date | Publication date | Assignee | Title |
|---|---|---|---|---|
| US20110282714A1 (en) * | 2002-04-10 | 2011-11-17 | Cullen Iii Andrew A | Computer system and method for producing analytical data related to the project bid and requisition process |
| JP2003345955A (ja) * | 2002-05-23 | 2003-12-05 | Hitachi Ltd | 問題予測および改善プロセス提示システムならびに方法 |
| JP2003345918A (ja) * | 2002-05-27 | 2003-12-05 | Nec Corp | ソフトウェア品質管理システムおよびソフトウェア品質管理方法 |
| JP2003345956A (ja) * | 2002-05-29 | 2003-12-05 | Hitachi Ltd | プロジェクトリスク管理システム、およびプロジェクトリスク管理装置 |
| JP2005216020A (ja) * | 2004-01-30 | 2005-08-11 | Hitachi Ltd | プロジェクト評価システム,プログラムよび記憶媒体 |
| JP2009187288A (ja) * | 2008-02-06 | 2009-08-20 | Nec Corp | プロジェクト変調検出方法およびプロジェクト変調検出装置 |
| JP2015014856A (ja) * | 2013-07-04 | 2015-01-22 | 株式会社日立製作所 | ソフトウェア開発プロジェクトの評価方法及びシステム |
| JP2016110231A (ja) * | 2014-12-02 | 2016-06-20 | 三菱電機株式会社 | プロジェクト評価装置及びプロジェクト評価方法及びプロジェクト評価プログラム |
Also Published As
| Publication number | Publication date |
|---|---|
| JP2025007094A (ja) | 2025-01-17 |
Similar Documents
| Publication | Publication Date | Title |
|---|---|---|
| AU2019200046B2 (en) | Utilizing artificial intelligence to test cloud applications | |
| US10831448B2 (en) | Automated process analysis and automation implementation | |
| Sousa et al. | Applying machine learning to estimate the effort and duration of individual tasks in software projects | |
| JP7479251B2 (ja) | 計算機システムおよび情報処理方法 | |
| US20200226401A1 (en) | Utilizing artificial intelligence to generate and update a root cause analysis classification model | |
| CN117609100B (zh) | 一种自动化代码合并及部署方法 | |
| CN120197644A (zh) | 基于强化学习的智能体动态决策网络生成方法 | |
| US20230017316A1 (en) | Utilizing a combination of machine learning models to determine a success probability for a software product | |
| JP6201556B2 (ja) | 予測モデル学習装置、予測モデル学習方法およびコンピュータプログラム | |
| EP4024203B1 (en) | System performance optimization | |
| US12299427B1 (en) | Generating degree of development of structured processes using automatically calibrated queries | |
| JP2026012859A (ja) | データ要素の所与のセットのデータ要素のソート | |
| Dogan et al. | Parallelism-based session creation to identify high-level activities in event log abstraction | |
| JP2016103126A (ja) | 重要業績評価指標のカテゴリ分割の条件を求める方法、並びに、その為のコンピュータ及びコンピュータ・プログラム | |
| US20210279608A1 (en) | Prediction rationale analysis apparatus and prediction rationale analysis method | |
| US20220374801A1 (en) | Plan evaluation apparatus and plan evaluation method | |
| JP6320891B2 (ja) | 問題構造抽出装置および問題構造抽出方法 | |
| JP2025007094A (ja) | プロジェクト計画適正化ツール、及びプロジェクト計画適正化方法 | |
| JP2025117284A (ja) | プロジェクト分析装置、プロジェクト分析方法、及び、プログラム | |
| KR102480518B1 (ko) | 신용평가 모델 업데이트 또는 교체 방법 및 장치 | |
| KR102499435B1 (ko) | 인공 지능 기반 신용 평가 모델 생성 방법 및 장치 | |
| JP7249873B2 (ja) | 系統業務連携支援装置およびその方法 | |
| KR102891346B1 (ko) | 성과 측정을 기반으로 개발자에 대한 업무 배치를 최적화하기 위한 장치 및 이를 위한 방법 | |
| EP4722995A1 (en) | Method for automatic retraining of a generative ai model | |
| Wong et al. | A Hybrid Approach and Implementation on Root Cause Analysis Logic Model for Enterprise Software Application |
Legal Events
| Date | Code | Title | Description |
|---|---|---|---|
| 121 | Ep: the epo has been informed by wipo that ep was designated in this application |
Ref document number: 24831375 Country of ref document: EP Kind code of ref document: A1 |
|
| NENP | Non-entry into the national phase |
Ref country code: DE |
|
| 122 | Ep: pct application non-entry in european phase |
Ref document number: 24831375 Country of ref document: EP Kind code of ref document: A1 |