WO2024195499A1 - 撮像システム、行列データ、および行列データの生成方法 - Google Patents
撮像システム、行列データ、および行列データの生成方法 Download PDFInfo
- Publication number
- WO2024195499A1 WO2024195499A1 PCT/JP2024/008076 JP2024008076W WO2024195499A1 WO 2024195499 A1 WO2024195499 A1 WO 2024195499A1 JP 2024008076 W JP2024008076 W JP 2024008076W WO 2024195499 A1 WO2024195499 A1 WO 2024195499A1
- Authority
- WO
- WIPO (PCT)
- Prior art keywords
- numerical values
- image
- imaging system
- wavelength bands
- imaging
- Prior art date
- Legal status (The legal status is an assumption and is not a legal conclusion. Google has not performed a legal analysis and makes no representation as to the accuracy of the status listed.)
- Ceased
Links
Images


Classifications
-
- H—ELECTRICITY
- H04—ELECTRIC COMMUNICATION TECHNIQUE
- H04N—PICTORIAL COMMUNICATION, e.g. TELEVISION
- H04N23/00—Cameras or camera modules comprising electronic image sensors; Control thereof
- H04N23/10—Cameras or camera modules comprising electronic image sensors; Control thereof for generating image signals from different wavelengths
- H04N23/11—Cameras or camera modules comprising electronic image sensors; Control thereof for generating image signals from different wavelengths for generating image signals from visible and infrared light wavelengths
-
- G—PHYSICS
- G01—MEASURING; TESTING
- G01J—MEASUREMENT OF INTENSITY, VELOCITY, SPECTRAL CONTENT, POLARISATION, PHASE OR PULSE CHARACTERISTICS OF INFRARED, VISIBLE OR ULTRAVIOLET LIGHT; COLORIMETRY; RADIATION PYROMETRY
- G01J3/00—Spectrometry; Spectrophotometry; Monochromators; Measuring colours
- G01J3/28—Investigating the spectrum
- G01J3/40—Measuring the intensity of spectral lines by determining density of a photograph of the spectrum; Spectrography
-
- H—ELECTRICITY
- H04—ELECTRIC COMMUNICATION TECHNIQUE
- H04N—PICTORIAL COMMUNICATION, e.g. TELEVISION
- H04N23/00—Cameras or camera modules comprising electronic image sensors; Control thereof
- H04N23/10—Cameras or camera modules comprising electronic image sensors; Control thereof for generating image signals from different wavelengths
- H04N23/12—Cameras or camera modules comprising electronic image sensors; Control thereof for generating image signals from different wavelengths with one sensor only
-
- H—ELECTRICITY
- H04—ELECTRIC COMMUNICATION TECHNIQUE
- H04N—PICTORIAL COMMUNICATION, e.g. TELEVISION
- H04N23/00—Cameras or camera modules comprising electronic image sensors; Control thereof
- H04N23/95—Computational photography systems, e.g. light-field imaging systems
- H04N23/955—Computational photography systems, e.g. light-field imaging systems for lensless imaging
-
- H—ELECTRICITY
- H04—ELECTRIC COMMUNICATION TECHNIQUE
- H04N—PICTORIAL COMMUNICATION, e.g. TELEVISION
- H04N25/00—Circuitry of solid-state image sensors [SSIS]; Control thereof
- H04N25/10—Circuitry of solid-state image sensors [SSIS]; Control thereof for transforming different wavelengths into image signals
- H04N25/11—Arrangement of colour filter arrays [CFA]; Filter mosaics
- H04N25/13—Arrangement of colour filter arrays [CFA]; Filter mosaics characterised by the spectral characteristics of the filter elements
- H04N25/131—Arrangement of colour filter arrays [CFA]; Filter mosaics characterised by the spectral characteristics of the filter elements including elements passing infrared wavelengths
-
- H—ELECTRICITY
- H04—ELECTRIC COMMUNICATION TECHNIQUE
- H04N—PICTORIAL COMMUNICATION, e.g. TELEVISION
- H04N5/00—Details of television systems
- H04N5/30—Transforming light or analogous information into electric information
- H04N5/33—Transforming infrared radiation
Definitions
- Patent Document 1 discloses an example of applying compressed sensing technology to a hyperspectral camera that captures multiple spectral images.
- the technology disclosed in Patent Document 1 makes it possible to realize a hyperspectral camera that generates high-resolution, multi-wavelength images.
- An imaging system includes an imaging device having an encoding element including multiple regions with mutually different transmission spectra; a storage device that stores matrix data including N sub-matrices corresponding to N wavelength bands (N is an integer equal to or greater than 2); and a processing circuit that generates N spectral images corresponding to the N wavelength bands based on a compressed image generated by the imaging device in which information on the N wavelength bands is compressed, and the matrix data, and each of the N sub-matrices includes multiple numerical values, and the multiple numerical values correspond to multiple pixel values acquired by imaging based on light passing through the encoding element, and the maximum value of each of the multiple numerical values corresponds to a maximum value determined by the number of bits set for each of the multiple pixel values, and when the maximum value of each of the multiple numerical values is M and the average of the multiple numerical values included in the i-th sub-matrix (i is a natural number between 1 and N) of the N sub-matrices is ⁇ i, there exists an i that
- the general or specific aspects of the present disclosure may be realized in a system, an apparatus, a method, an integrated circuit, a computer program, or a computer-readable recording medium, or in any combination of a system, an apparatus, a method, an integrated circuit, a computer program, and a recording medium.
- the computer-readable recording medium may include a non-volatile recording medium such as a CD-ROM (Compact Disc-Read Only Memory).
- An apparatus may be composed of one or more devices. When an apparatus is composed of two or more devices, the two or more devices may be arranged in one device, or may be arranged separately in two or more separate devices.
- "apparatus" may mean not only one device, but also a system consisting of multiple devices.
- the technology disclosed herein makes it possible to realize an imaging system that can more accurately generate multiple spectroscopic images from an image with compressed spectral information.
- FIG. 1A is a diagram illustrating a schematic configuration example of an imaging system.
- FIG. 1B is a diagram illustrating a schematic configuration example of another imaging system.
- FIG. 1C is a diagram illustrating a schematic configuration example of still another imaging system.
- FIG. 1D is a diagram illustrating a schematic configuration example of still another imaging system.
- FIG. 2A is a schematic diagram illustrating an example of a filter array.
- FIG. 2B is a diagram showing an example of a spatial distribution of the light transmittance of each of a plurality of wavelength bands included in the target wavelength range.
- FIG. 2C is a diagram showing an example of the spectral transmittance of the area A1 included in the filter array shown in FIG. 2A.
- FIG. 2D is a diagram showing an example of the spectral transmittance of the area A2 included in the filter array shown in FIG. 2A.
- FIG. 3A is a diagram for explaining an example of the relationship between a target wavelength range and a plurality of wavelength bands included therein.
- FIG. 3B is a diagram for explaining another example of the relationship between the target wavelength range and a plurality of wavelength bands included therein.
- FIG. 4A is a diagram for explaining the characteristics of the spectral transmittance in a certain region of the filter array.
- FIG. 4B is a diagram showing the results of averaging the spectral transmittance shown in FIG. 4A for each wavelength band.
- FIG. 5 is a diagram illustrating an example of the configuration of an imaging system for acquiring a restoration table from a coding mask.
- FIG. 6 is a flowchart illustrating an example of a calibration operation performed by the processing circuit in this embodiment.
- FIG. 7A is a diagram illustrating an example of the format of the restoration table.
- FIG. 7B is a diagram illustrating another example of the format of the restoration table.
- FIG. 8 is a schematic diagram illustrating an example of an imaging system for generating a hyperspectral image from a compressed image.
- FIG. 9 is a flowchart that illustrates an example of a hyperspectral image generating operation executed by the processing circuit in this embodiment.
- FIG. 10A is a diagram for explaining a method for evaluating a restoration error of a hyperspectral image.
- FIG. 10A is a diagram for explaining a method for evaluating a restoration error of a hyperspectral image.
- FIG. 10B is a diagram for explaining a method for evaluating a restoration error of a hyperspectral image.
- FIG. 10C is a diagram for explaining a method for evaluating the restoration error of a hyperspectral image.
- FIG. 10D is a diagram for explaining a method for evaluating the restoration error of a hyperspectral image.
- FIG. 11 is a graph showing the relationship between the average pixel value of each mask image included in the restoration table and the restoration error.
- FIG. 12 is an enlarged schematic diagram showing a local spatial distribution of pixel values in a mask image corresponding to a certain wavelength band.
- FIG. 13 is a diagram for explaining an example of a filter array.
- FIG. 14 is a diagram for explaining an example of an image sensor.
- FIG. 15 is a diagram for explaining an example of an image processing device 200. As shown in FIG.
- all or part of a circuit, unit, device, member, or part, or all or part of a functional block in a block diagram may be implemented by one or more electronic circuits including, for example, a semiconductor device, a semiconductor integrated circuit (IC), or an LSI (large scale integration).
- the LSI or IC may be integrated into one chip, or may be configured by combining multiple chips.
- functional blocks other than memory elements may be integrated into one chip.
- LSI or IC are referred to as such, but the terminology may change depending on the degree of integration, and may be called a system LSI, VLSI (very large scale integration), or ULSI (ultra large scale integration).
- Field programmable gate arrays (FPGAs) which are programmed after the LSI is manufactured, or reconfigurable logic devices that can reconfigure the connections inside the LSI or set up circuit sections inside the LSI, can also be used for the same purpose.
- all or part of the functions or operations of a circuit, unit, device, member or part can be executed by software processing.
- the software is recorded on one or more non-transitory recording media such as ROMs, optical disks, hard disk drives, etc., and when the software is executed by a processor, the functions specified in the software are executed by the processor and peripheral devices.
- the system or device may include one or more non-transitory recording media on which the software is recorded, a processor, and necessary hardware devices, such as interfaces.
- light refers to electromagnetic waves including not only visible light (wavelengths of about 400 nm to about 700 nm), but also ultraviolet light (wavelengths of about 10 nm to about 400 nm) and infrared light (wavelengths of about 700 nm to about 1 mm).
- images restored based on sparsity may have restoration errors.
- Sparsity is the property that elements that characterize an object to be observed are sparsely present in a space such as frequency space. Sparsity is widely observed in nature. By utilizing sparsity, it becomes possible to observe necessary information efficiently. Sensing technology that utilizes sparsity is called compressed sensing technology. By utilizing compressed sensing technology, it is possible to build highly efficient devices and systems.
- the hyperspectral camera includes, for example, an optical filter with irregular light transmission characteristics in terms of space and/or wavelength.
- Such an optical filter is also called an "encoding mask.”
- the encoding mask is placed on the optical path of light incident on the image sensor, and transmits light incident from an object with different light transmission characteristics depending on the area. This process using the encoding mask is called "encoding.”
- the spectral information of the object is compressed. The image is called a "compressed image.”
- Mask information indicating the light transmission properties of the encoding mask is stored in advance in a storage device as a restoration table.
- the processing device of the imaging device performs restoration processing based on the compressed image and the restoration table.
- the restoration processing generates multiple restored images that have more information than the compressed image, such as image information of higher resolution or image information of more wavelengths.
- the multiple restored images are also referred to as "multiple spectral images.”
- the restoration table can be, for example, data that reflects the spatial distribution of the optical response characteristics of the encoding mask.
- the restoration processing based on such a restoration table makes it possible to generate multiple restored images that respectively correspond to multiple wavelength bands included in the target wavelength range from one compressed image.
- the imaging system according to this embodiment can more accurately generate multiple restored images from a compressed image by using a restoration table that is appropriately generated from an encoding mask.
- the imaging system according to an embodiment of the present disclosure is described below.
- FIG. 1A is a diagram showing a schematic configuration example of an imaging system.
- the system shown in FIG. 1A includes an imaging device 100 and an image processing device 200.
- the imaging device 100 has a configuration similar to that of the imaging device disclosed in Patent Document 1.
- the imaging device 100 includes an optical system 140, a filter array 110, and an image sensor 160.
- the optical system 140 and the filter array 110 are disposed on the optical path of light incident from an object 70, which is a subject.
- the filter array 110 in the example of FIG. 1A is disposed between the optical system 140 and the image sensor 160.
- FIG. 1A illustrates an apple as an example of the object 70.
- the object 70 is not limited to an apple, and may be any object.
- the image sensor 160 generates data of a compressed image 10 in which information of a plurality of wavelength bands is compressed as a two-dimensional monochrome image.
- the image processing device 200 generates data representing a plurality of images corresponding one-to-one to a plurality of wavelength bands included in a predetermined target wavelength range based on the data of the compressed image 10 generated by the image sensor 160.
- the number of wavelength bands included in the target wavelength range is N (N is an integer of 4 or more).
- the N images generated based on the compressed image 10 are referred to as restored images 20W 1 , 20W 2 , ..., 20W N , and these may be collectively referred to as "hyperspectral images 20".
- the filter array 110 is an array of multiple light-transmitting filters arranged in rows and columns.
- the multiple filters include multiple types of filters that differ from one another in terms of spectral transmittance, i.e., the wavelength dependency of light transmittance.
- the filter array 110 modulates the intensity of incident light for each wavelength and outputs it. This process performed by the filter array 110 is called “encoding,” and the filter array 110 is also called an "encoding mask.”
- the filter array 110 is disposed near or directly above the image sensor 160.
- “near” means close enough that a reasonably clear image of the light from the optical system 140 is formed on the surface of the filter array 110.
- “Directly above” means that the two are so close that there is almost no gap between them.
- the filter array 110 and the image sensor 160 may be integrated.
- Optical system 140 includes at least one lens. In FIG. 1A, optical system 140 is shown as a single lens, but optical system 140 may be a combination of multiple lenses. Optical system 140 forms an image on the imaging surface of image sensor 160 through filter array 110.
- FIGS. 1B to 1D are diagrams showing configuration examples of the imaging device 100 in which the filter array 110 is disposed away from the image sensor 160.
- the filter array 110 is disposed between the optical system 140 and the image sensor 160 and at a position distant from the image sensor 160.
- the filter array 110 is disposed between the object 70 and the optical system 140.
- the imaging device 100 includes two optical systems 140A and 140B, and the filter array 110 is disposed between them.
- an optical system including one or more lenses may be disposed between the filter array 110 and the image sensor 160.
- the image sensor 160 is a monochrome type light detection device having a plurality of light detection elements (also referred to as "pixels" in this specification) arranged two-dimensionally.
- the image sensor 160 may be, for example, a CCD (Charge-Coupled Device), a CMOS (Complementary Metal Oxide Semiconductor) sensor, or an infrared array sensor.
- the light detection elements include, for example, photodiodes.
- the image sensor 160 does not necessarily have to be a monochrome type sensor. For example, a color type sensor may be used.
- the color type sensor may include, for example, a plurality of red (R) filters that transmit red light, a plurality of green (G) filters that transmit green light, and a plurality of blue (B) filters that transmit blue light.
- the color type sensor may further include a plurality of IR filters that transmit infrared light.
- the color type sensor may also include a plurality of transparent filters that transmit all red, green, and blue light.
- the image processing device 200 may be a computer including one or more processors and one or more storage media such as a memory.
- the image processing device 200 generates data of a plurality of restored images 20W 1 , 20W 2 , . . . 20W N based on the compressed image 10 acquired by the image sensor 160.
- FIG. 2A is a diagram showing a schematic example of a filter array 110.
- the filter array 110 has a number of regions arranged two-dimensionally. In this specification, these regions are sometimes referred to as "cells.” In each region, an optical filter having an individually set spectral transmittance is arranged.
- the spectral transmittance is expressed as a function T( ⁇ ), where ⁇ is the wavelength of the incident light.
- the spectral transmittance T( ⁇ ) can take a value between 0 and 1.
- the filter array 110 has 48 rectangular regions arranged in 6 rows and 8 columns. This is merely an example, and in actual applications, more regions may be provided. The number may be approximately the same as the number of pixels in the image sensor 160, for example. The number of filters included in the filter array 110 is determined according to the application and ranges from tens to tens of millions, for example.
- FIG. 2B is a diagram showing an example of the spatial distribution of the light transmittance of each of the wavelength bands W1 , W2 , ..., WN included in the target wavelength range.
- the difference in the shading of each region represents the difference in the transmittance. The lighter the region, the higher the transmittance, and the darker the region, the lower the transmittance.
- the spatial distribution of the light transmittance differs depending on the wavelength band.
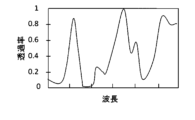
- 2C and 2D are diagrams showing examples of the spectral transmittance of the region A1 and the region A2 included in the filter array 110 shown in FIG. 2A, respectively.
- the spectral transmittance of the region A1 and the spectral transmittance of the region A2 are different from each other. In this way, the spectral transmittance of the filter array 110 varies depending on the region. However, it is not necessary that the spectral transmittance of all the regions is different.
- the filter array 110 the spectral transmittance of at least some of the multiple regions is different from each other.
- the filter array 110 includes two or more filters having different spectral transmittances from each other.
- the number of patterns of the spectral transmittance of the multiple regions included in the filter array 110 may be equal to or greater than the number N of wavelength bands included in the target wavelength range.
- the filter array 110 may be designed so that the spectral transmittance of more than half of the regions is different.
- the target wavelength range W can be set to various ranges depending on the application.
- the target wavelength range W can be, for example, a visible light wavelength range of about 400 nm to about 700 nm, a near infrared wavelength range of about 700 nm to about 2500 nm, or a near ultraviolet wavelength range of about 10 nm to about 400 nm.
- the target wavelength range W may be a wavelength range such as mid-infrared or far-infrared. In this way, the wavelength range used is not limited to the visible light range.
- radiation in general, including infrared and ultraviolet rays, as well as visible light is referred to as "light”.
- N is an arbitrary integer equal to or greater than 4, and the wavelength bands obtained by dividing the target wavelength range W into N equal parts are designated as wavelength bands W1 , W2 , ..., WN .
- the multiple wavelength bands included in the target wavelength range W may be set arbitrarily.
- the bandwidth may be non-uniform depending on the wavelength band.
- the bandwidth differs depending on the wavelength band, and there is a gap between two adjacent wavelength bands. In this way, the method of determining the multiple wavelength bands is arbitrary.
- FIG. 4A is a diagram for explaining the characteristics of the spectral transmittance in a certain region of the filter array 110.
- the spectral transmittance has multiple maximum values P1 to P5 and multiple minimum values for wavelengths in the target wavelength range W.
- the maximum value of the light transmittance in the target wavelength range W is normalized to 1 and the minimum value is 0.
- the spectral transmittance has maximum values in wavelength ranges such as wavelength band W 2 and wavelength band W N-1 . In this way, the spectral transmittance of each region can be designed to have maximum values in at least two wavelength ranges among the wavelength bands W 1 , W 2 , ..., W N.
- the maximum values P1, P3, P4, and P5 are 0.5 or more.
- the filter array 110 transmits a large amount of components in a certain wavelength range among the incident light, and does not transmit components in other wavelength ranges very much.
- the transmittance of light in k wavelength bands out of the N wavelength bands may be greater than 0.5, and the transmittance of light in the remaining N-k wavelength bands may be less than 0.5, where k is an integer satisfying 2 ⁇ k ⁇ N. If the incident light is white light that contains all visible light wavelength components evenly, the filter array 110 modulates the incident light into light having multiple discrete intensity peaks with respect to wavelength for each region, and outputs this multi-wavelength light by superimposing it.
- FIG. 4B is a diagram showing, as an example, the result of averaging the spectral transmittance shown in FIG. 4A for each wavelength band W 1 , W 2 , ..., W N.
- the averaged transmittance is obtained by integrating the spectral transmittance T( ⁇ ) for each wavelength band and dividing by the bandwidth of the wavelength band.
- the transmittance value averaged for each wavelength band in this way is defined as the transmittance in that wavelength band.
- the transmittance is remarkably high in three wavelength ranges having maximum values P1, P3, and P5. In particular, the transmittance exceeds 0.8 in two wavelength ranges having maximum values P3 and P5.
- a grayscale transmittance distribution is assumed in which the transmittance of each region can take any value between 0 and 1 inclusive.
- a binary scale transmittance distribution may be used in which the transmittance of each region can take a value of either approximately 0 or approximately 1.
- each region transmits most of the light in at least two of the multiple wavelength ranges included in the target wavelength range, and does not transmit most of the light in the remaining wavelength ranges.
- "most" refers to approximately 80% or more.
- a part of all the cells may be replaced with a transparent region.
- a transparent region transmits the light of each of the wavelength bands W 1 , W 2 , ..., W N included in the target wavelength range W with a similarly high transmittance, for example, a transmittance of 80% or more.
- the multiple transparent regions may be arranged, for example, in a checkerboard pattern. That is, in two arrangement directions of the multiple regions in the filter array 110, regions whose light transmittance varies depending on the wavelength and transparent regions may be arranged alternately.
- the data showing the spatial distribution of the spectral transmittance of the filter array 110 is acquired in advance based on design data or actual measurement calibration, and is stored in a storage medium provided in the image processing device 200. This data is used in the calculation processing described later.
- the filter array 110 may be configured using, for example, a multilayer film, an organic material, a diffraction grating structure, or a microstructure containing a metal.
- a multilayer film for example, a dielectric multilayer film or a multilayer film containing a metal layer may be used.
- at least one of the thickness, material, and stacking order of each multilayer film is formed so that it differs for each cell. This allows different spectral characteristics to be realized for each cell.
- a configuration using an organic material can be realized by making the pigment or dye contained different for each cell, or by stacking different materials.
- a configuration using a diffraction grating structure can be realized by providing a diffraction structure with a different diffraction pitch or depth for each cell.
- a microstructure containing a metal When a microstructure containing a metal is used, it can be manufactured by utilizing spectrum due to the plasmon effect.
- the image processing device 200 reconstructs a multi-wavelength hyperspectral image 20 based on the compressed image 10 output from the image sensor 160 and the spatial distribution characteristics of the transmittance for each wavelength of the filter array 110.
- multi-wavelength means more wavelength ranges than the wavelength ranges of the three colors RGB captured by a normal color camera, for example.
- the number of wavelength ranges can be, for example, about 4 to 100. This number of wavelength ranges is referred to as the "number of bands.” Depending on the application, the number of bands may exceed 100.
- the data to be obtained is the data of the hyperspectral image 20, and the data is denoted as f.
- f is data obtained by integrating the data of N bands f 1 , f 2 , ..., f N.
- the horizontal direction of the image is the x direction
- the vertical direction of the image is the y direction.
- n the number of pixels in the x direction of the image data to be obtained
- m the number of pixels in the y direction
- each of the image data f 1 , f 2 , ..., f N has n x m pixel values. Therefore, the data f is data with n x m x N elements.
- the number of elements of the data g of the compressed image 10 obtained by encoding and multiplexing by the filter array 110 is n x m.
- the data g can be expressed by the following formula (1).
- f represents the data of the hyperspectral image expressed as a one-dimensional vector.
- Each of f 1 , f 2 , ..., f N has n x m elements. Therefore, the vector on the right side is a one-dimensional vector with n x m x N rows and one column.
- the data g of the compressed image is calculated as a one-dimensional vector with n x m rows and one column.
- the matrix H represents a transformation in which each component f 1 , f 2 , ..., f N of the vector f is encoded and intensity-modulated with different encoding information for each wavelength band, and then added. Therefore, H is a matrix with n x m rows and n x m x N columns.
- Formula (1) can also be expressed as follows.
- pg ij represents the pixel value in the i-th row and j-th column of the compressed image 10 .
- the image processing device 200 utilizes the image redundancy contained in data f to find a solution using a compressed sensing technique. Specifically, the desired data f is estimated by solving the following equation (2).
- f' represents the estimated f data.
- the first term in the parentheses in the above formula represents the deviation between the estimation result Hf and the acquired data g, that is, the so-called residual term.
- the sum of squares is used as the residual term, but the absolute value or the square root of the sum of squares, etc. may be used as the residual term.
- the second term in the parentheses is a regularization term or a stabilization term.
- Formula (2) means to obtain f that minimizes the sum of the first and second terms.
- the function in the parentheses in formula (2) is called the evaluation function.
- the image processing device 200 can converge the solution by recursive iterative calculation and calculate f that minimizes the evaluation function as the final solution f'.
- the first term in the parentheses in formula (2) means an operation to obtain the sum of squares of the difference between the acquired data g and Hf obtained by transforming f in the estimation process by the matrix H.
- the second term ⁇ (f) is a constraint condition in the regularization of f, and is a function reflecting the sparse information of the estimated data. This function has the effect of smoothing or stabilizing the estimated data.
- the regularization term can be expressed, for example, by the discrete cosine transform (DCT), wavelet transform, Fourier transform, or total variation (TV) of f. For example, when the total variation is used, stable estimated data that suppresses the influence of noise in the observed data g can be obtained.
- the sparsity of the object 70 in the space of each regularization term differs depending on the texture of the object 70.
- a regularization term that makes the texture of the object 70 sparser in the space of the regularization term may be selected.
- multiple regularization terms may be included in the operation.
- ⁇ is a weighting coefficient. The larger the weighting factor ⁇ , the more redundant data is reduced, and the higher the compression ratio. The smaller the weighting factor ⁇ , the weaker the convergence to a solution.
- the weighting factor ⁇ is set to an appropriate value that allows f to converge to a certain extent, but does not result in over-compression.
- the image encoded by the filter array 110 is acquired in a blurred state on the imaging surface of the image sensor 160. Therefore, by storing this blur information in advance and reflecting the blur information in the above-mentioned matrix H, the hyperspectral image 20 can be reconstructed.
- the blur information is represented by a point spread function (PSF).
- the PSF is a function that defines the degree of spread of a point image to surrounding pixels. For example, when a point image corresponding to one pixel on an image spreads to a region of k ⁇ k pixels around the pixel due to blurring, the PSF can be defined as a group of coefficients, i.e., a matrix, that indicate the influence on the pixel value of each pixel in that region.
- the hyperspectral image 20 can be reconstructed by reflecting the influence of blurring of the encoding pattern by the PSF in the matrix H.
- the position at which the filter array 110 is placed is arbitrary, but a position can be selected that will not cause the coding pattern of the filter array 110 to become too diffuse and disappear.
- a hyperspectral image 20 can be restored from the compressed image 10 acquired by the image sensor 160. Details of the method for restoring the hyperspectral image 20 are disclosed in Patent Document 1. The entire disclosure of Patent Document 1 is incorporated herein by reference.
- Compressed images and hyperspectral images may be generated by imaging using a filter array 110 including the above-mentioned multiple optical filters, i.e., a method other than imaging using an encoding mask.
- the imaging device 100 may be configured such that the light receiving characteristics of the image sensor 160 are changed for each pixel by processing the image sensor 160.
- a compressed image can be generated by imaging using the processed image sensor 160, as in the above example. That is, a compressed image may be generated by an imaging device configured such that the filter array 110 is built into the image sensor 160.
- the encoded information corresponds to the light receiving characteristics of the image sensor 160.
- a configuration may be adopted in which an optical element such as a metalens is introduced into at least a part of the optical system 140, so that the optical characteristics of the optical system 140 vary spatially and wavelength-wise, thereby compressing the spectral information.
- a compressed image can also be generated by an imaging device including such a configuration.
- the encoded information corresponds to the optical characteristics of the optical element such as a metalens.
- the intensity of the incident light may be modulated for each wavelength by using an imaging device 100 having a configuration different from that using the filter array 110, to generate the compressed image 10 and the hyperspectral image 20.
- the present disclosure also includes a configuration for generating a restored image containing a greater number of signals (e.g., the number of pixels) than the number of signals contained in the compressed image 10, based on encoded information corresponding to the optical response characteristics of the imaging device 100, which includes multiple light-receiving regions having different optical response characteristics, and the compressed image 10 generated by the imaging device 100.
- the optical response characteristics may correspond to the light-receiving characteristics of an image sensor, or may correspond to the optical characteristics of an optical element.
- the imaging device 100 has an encoding element that includes multiple light receiving regions with different optical response characteristics.
- encoding element refers not only to the encoding mask but also to the optical system 140 whose optical characteristics are changed spatially and wavelength-wise.
- the encoding mask includes a plurality of regions having different transmission spectra.
- FIG. 5 is a diagram showing a schematic configuration example of an imaging system for generating a restoration table from a coded mask.
- the imaging system shown in Fig. 5 includes a light source 510, a monochromator 520, an integrating sphere 530, an imaging device 100, an image processing device 200, and a display device 300. Lines with arrows indicate transmission and reception of signals.
- the light source 510 emits light that includes all components of multiple wavelength bands within the target wavelength range. If the target wavelength range is at least a part of the visible light range, the light may be, for example, white light.
- the light emitted from the light source 510 may be, for example, laser light, but is not limited to laser light.
- the light emitted from the light source 510 may be, for example, light from an LED or light from a light bulb.
- the monochromator 520 extracts light of a certain wavelength band from the laser light emitted from the light source 510. Instead of the monochromator 520, a bandpass filter may be used to extract light of a certain wavelength band.
- the integrating sphere 530 has an aperture, and emits the extracted monochromatic light from the aperture after making it spatially uniform.
- the imaging device 100 acquires an image of the light emitted from the integrating sphere 530.
- the thick curves in FIG. 5 represent the optical fiber connecting the light source 510 and the monochromator 520 to each other and the optical fiber connecting the monochromator 520 and the integrating sphere 530 to each other.
- the optical fiber connecting the light source 510 and the monochromator 520 to each other guides the laser light emitted from the light source 510 to the monochromator 520.
- the optical fiber connecting the monochromator 520 and the integrating sphere 530 to each other guides the light emitted from the monochromator 520 to the integrating sphere 530.
- a mirror may be used instead of the optical fiber.
- the image processing device 200 comprises a processing circuit 210 including a control circuit 210a and a signal processing circuit 210b, and a storage device 220.
- the control circuit 210a controls the operations of the light source 510, the monochromator 520, the image capture device 100, the signal processing circuit 210b, and the display device 300.
- the signal processing circuit 210b comprises a memory 212 and an image restoration module 214.
- the memory 212 stores images acquired in the calibration described below.
- the image restoration module 214 generates a hyperspectral image from the compressed image generated by the image capture device 100 by a restoration calculation, and outputs information related to the hyperspectral image. The information is sent to the display device 300.
- the signal processing circuit 210b includes a memory 212 and a processor that functions as an image restoration module 214.
- the control circuit 210a and the signal processing circuit 210b are shown as separate circuits, but may be a single circuit.
- the storage device 220 includes one or more storage media. Each storage medium may be any storage medium, such as a semiconductor memory, a magnetic storage medium, or an optical storage medium.
- the storage device 220 stores a restoration table that is generated by calibration, which will be described later.
- the restoration table is an example of coding information that indicates the optical transmission characteristics of the filter array 110 that functions as a coding mask.
- the display device 300 displays an input user interface (UI) 310 and a display UI 320.
- the input UI 310 is used for a user to input information.
- the information input by the user to the input UI 310 is received by the control circuit 210a.
- the display UI 320 is used to display information about the hyperspectral image.
- the input UI 310 and the display UI 320 are displayed as a graphical user interface (GUI). It can also be said that the information shown on the input UI 310 and the display UI 320 is displayed on the display device 300.
- the input UI 310 and the display UI 320 may be realized by a device capable of both input and output, such as a touch screen. In that case, the touch screen may function as the display device 300.
- the input UI 310 is a device independent of the display device 300.
- the imaging system shown in FIG. 5 does not necessarily have to include the image restoration module 214 and the display device 300 among the above components. This is because these components are used to generate a hyperspectral image and to output and display information related to the hyperspectral image, as described below.
- FIG. 6 is a flow chart that shows an outline of an example of a calibration operation performed by the processing circuit 210 in this embodiment.
- the control circuit 210a or the signal processing circuit 210b included in the processing circuit 210 performs the operations of steps S101 to S108 shown in FIG. 6.
- the signal processing circuit 210b performs an operation upon receiving a control signal from the control circuit 210a.
- the operation performed by the control circuit 210a or the signal processing circuit 210b is treated as an operation performed by the processing circuit 210.
- N is an integer equal to or greater than 2
- the control circuit 210a acquires information on the N wavelength bands from the input UI 310.
- the control circuit 210a causes the light source 510 to emit a laser beam including components of N wavelength bands.
- the laser beam is, for example, a white laser beam.
- the control circuit 210a causes the monochromator 520 to extract a certain wavelength band of light from the laser light, which is one of the N input wavelength bands.
- Control circuit 210a causes imaging device 100 to acquire an image of the light emitted from integrating sphere 530 under the adjustment of imaging conditions as follows.
- Control circuit 210a causes light source 510 to adjust the intensity of the laser light emitted from light source 510 and adjust the exposure time of imaging device 100 so that the average pixel value of a plurality of pixels included in the acquired image falls within a predetermined range.
- the predetermined range in which the restoration error can be effectively reduced will be described later.
- the pixel value is represented in 1024 shades of gray. In this case, the pixel value is an integer between 0 and 1023 inclusive.
- the pixel value is represented in 256 shades of gray. In this case, the pixel value is an integer between 0 and 255 inclusive.
- the signal processing circuit 210 b stores in the memory 212 a mask image corresponding to the above-mentioned certain wavelength band, which is generated based on the signal from the imaging device 100 .
- Step S106> The control circuit 210a judges whether all wavelength bands have been examined. If the judgement is Yes, the signal processing circuit 210b executes the operation of step S107. If the judgement is No, the control circuit 210a executes the operation of step S103 again. In step S103, the control circuit 210a causes the monochromator 520 to extract light of wavelength bands that have not yet been examined from the laser light. This extraction may be performed in ascending or descending order of wavelength. In this way, the control circuit 210a repeatedly executes the operations of steps S103 to S105 for the input N wavelength bands to generate multiple mask images.
- the signal processing circuit 210b generates a restoration table based on N mask images corresponding to the N wavelength bands, respectively.
- the signal processing circuit 210b causes the storage device 220 to store the restoration table.
- the above calibration operation allows a restoration table to be generated from the encoding mask included in the imaging device 100, the restoration table including N mask images whose average pixel values fall within a predetermined range. All of the N mask images may have the same average pixel value. Alternatively, the multiple mask images may have different average pixel values. Some of the multiple mask images may have average pixel values that are different from the rest.
- Fig. 7A and Fig. 7B are diagrams showing an example of the format of the restoration table.
- the restoration table shown in Fig. 7A is expressed as a three-dimensional matrix in which the depth represents a wavelength band and the length and width represent pixel values of a plurality of pixels included in each mask image.
- the restoration table shown in Fig. 7B is expressed as a two-dimensional matrix in which the width represents a wavelength band and the height represents pixel values of a plurality of pixels included in each mask image.
- the restoration table is matrix data including N sub-matrices corresponding to N wavelength bands, respectively.
- Each of the N sub-matrices includes a plurality of numerical values.
- the plurality of numerical values correspond to a plurality of pixel values acquired by imaging based on light passing through an encoding mask.
- the maximum value of each of the plurality of numerical values corresponds to a maximum value determined by the number of bits set for each of the plurality of pixel values.
- each of the plurality of numerical values included in each sub-matrix is normalized by the maximum number of bits to be between 0 and 1. However, such normalization is not necessarily required.
- Each of the plurality of numerical values included in each sub-matrix may be, for example, between 0 and 50.
- each submatrix is a two-dimensional matrix with n rows and m columns that indicates a two-dimensional distribution of multiple numerical values.
- n rows and m columns that indicates a two-dimensional distribution of multiple numerical values.
- each submatrix is a one-dimensional matrix of n x m rows and one column in which multiple numerical values are arranged one-dimensionally, i.e., a vector.
- a one-dimensional matrix can be used to express N mask images corresponding to N wavelength bands as a two-dimensional matrix.
- the format of the restoration table is not limited to the examples shown in Figures 7A and 7B.
- the restoration table shown in Figure 7A may be expressed as a two-dimensional matrix of n x N rows and m columns or an n row, m x N column matrix, in which N two-dimensional matrices are arranged vertically or horizontally.
- the restoration table shown in Figure 7B may be expressed as a one-dimensional matrix of n x m x N rows and 1 column, in which N one-dimensional matrices are arranged vertically.
- FIG. 8 is a diagram showing a schematic diagram of an example of an imaging system for generating a hyperspectral image from a compressed image.
- the imaging system shown in Fig. 8 captures an image of an object 70 and generates a hyperspectral image of the object.
- the imaging system shown in FIG. 8 includes an imaging device 100, an image processing device 200, and a display device 300, similar to the imaging system shown in FIG. 5.
- the storage device 220 included in the image processing device 200 stores the restoration table generated by the above-mentioned calibration operation.
- the imaging system shown in FIG. 8 does not include a light source 510, a monochromator 520, or an integrating sphere 530.
- FIG. 9 is a flow chart that shows an example of the operation of generating a plurality of restored images executed by the processing circuit 210 in this embodiment.
- the control circuit 210a or the signal processing circuit 210b included in the processing circuit 210 executes the operations of steps S201 to S205 shown in FIG. 9.
- Step S201 The control circuit 210 a causes the imaging device 100 to capture an image of the object 70 .
- the signal processing circuit 210b stores in the memory 212 a compressed image of the object 70 generated based on the signal from the imaging device 100.
- the compressed image information about the object 70 in N wavelength bands is compressed.
- Step S203 The signal processing circuit 210 b obtains the restoration table from the storage device 220 .
- the signal processing circuit 210b generates a hyperspectral image in the image restoration module 214 based on the compressed image stored in the memory 212 and the restoration table, and outputs information about the hyperspectral image.
- the hyperspectral image includes N restored images, i.e., N spectral images, respectively corresponding to the N wavelength bands.
- the signal processing circuit 210b causes the display device 300 to display information about the hyperspectral image.
- the display UI 320 may display the spectral information at that location.
- the signal processing circuit 210b obtains the restoration table from the storage device 220, but this example is not limited to this. If the restoration table is stored in an external server such as a cloud, the signal processing circuit 210b may obtain the restoration table from the external server. In that case, the imaging system shown in FIG. 8 does not need to include the storage device 220.
- Fig. 10A to Fig. 10D are diagrams for explaining a method for evaluating a restoration error of a hyperspectral image.
- a plurality of color samples 70a arranged two-dimensionally are imaged by the imaging device 100 as the object 70 shown in Fig. 8.
- a white board 70b is imaged by the imaging device 100 as the object 70 shown in Fig. 8.
- a first hyperspectral image obtained by imaging the plurality of color samples 70a is normalized by a second hyperspectral image obtained by imaging the white board 70b.
- the normalization is as follows. For the first hyperspectral image, the pixel value of the pixel in row i and column j among the multiple pixels included in the restored image corresponding to a certain wavelength band is set as the first pixel value, and for the second hyperspectral image, the pixel value of the pixel in row i and column j among the multiple pixels included in the restored image corresponding to the certain wavelength band is set as the second pixel value.
- an operation of dividing the first pixel value by the second image value is performed for all pixels.
- normalized hyperspectral images for multiple color samples 70a are obtained as shown in FIG. 10C.
- the spectrum of a certain color sample 70a is obtained from the portion surrounded by a thick-line rectangle in the normalized hyperspectral image shown in FIG. 10C, as shown in FIG. 10D.
- the spectrum obtained from the normalized hyperspectral image for the i-th color sample 70a is denoted as ⁇ i ( ⁇ )
- the correct spectrum of the i-th color sample 70a is denoted as ⁇ i ( ⁇ )
- the central wavelength of the n-th wavelength band is denoted as ⁇ n .
- the error rate of the i-th color sample 70a is expressed by the following equation (3).
- the restoration error ⁇ A corresponds to the average error rate of the multiple color samples 70 a, and is expressed by the following formula (4), where M is the number of color samples 70 a.
- Table 1 shows the relationship between the average pixel value of each mask image included in the restoration table and the restoration error.
- the number of bits of the pixel value is 10, and the saturation value corresponding to the maximum pixel value is 1023.
- Fig. 11 is a graph showing the relationship between the average pixel value of each mask image included in the restoration table and the restoration error. As shown in Fig. 11, when the average pixel value is extremely low, such as 50, or extremely high, such as 900, the restoration error exceeds 10%. In contrast, when the average pixel value is between 80 and 800, the restoration error is about 5% or less. The upper limit of the restoration error that is practically acceptable is about 5%.
- the lower limit of 80 is normalized by the saturation value of 1023 to give a value of 0.0782
- the upper limit of 800 is normalized by the saturation value of 1023 to give a value of 0.782. From this, it can be seen that when the average pixel value normalized by the saturation value is between about 0.08 and about 0.8, the hyperspectral image can be restored more accurately from the compressed image compared to when the value is not within that range.
- the processing circuit 210 performs the restoration calculation using a restoration table obtained from such a coding mask.
- the spatial distribution of pixel values in the mask image reflects the different transmittances in the multiple regions of the coding mask.
- a mask image in which the spatial distribution of pixel values is somewhat scattered and irregular is effective for accurate restoration calculation.
- Figure 12 is a schematic diagram showing an enlarged local spatial distribution of pixel values in a mask image corresponding to a certain wavelength band.
- the squares in Figure 12 represent pixels. The closer the pixel color is to white, the higher the pixel value is, and the closer the pixel color is to black, the lower the pixel value is.
- the brighter the mask image overall is the higher the pixel values of the multiple pixels contained in the mask image become, and the spatial distribution of the pixel values becomes more uniform.
- the pixel values may be treated as the same value because they cannot express any greater brightness due to pixel value saturation. For example, if the number of bits for a pixel value is 10, the maximum pixel value is 1023, so all brighter pixels will have pixel values of 1023. In this way, the irregularity in the spatial distribution of pixel values is lost, and the restoration error increases.
- the multiple mask images all have the same average pixel value, but this example is not limited to this.
- the multiple mask images may, for example, have different average pixel values from each other.
- some of the multiple mask images may have average pixel values that are different from the rest. This is because the cause of the increase in restoration error related to the spatial distribution of pixel values is the average pixel value of each mask image being extremely low or extremely high, and it does not matter whether the multiple mask images all have the same average pixel value.
- the highest average pixel value and the lowest average pixel value among multiple average pixel values corresponding to multiple mask images may be within a range of ⁇ 10% of the average of the multiple average pixel values.
- the highest average pixel value is 550
- the lowest average pixel value is 450.
- the highest and lowest average pixel values are within a range of ⁇ 10% of the average of the above three average pixel values, i.e., in the range of 450 to 550. Therefore, it can be said that all three mask images have the same average pixel value.
- the restoration table which is matrix data including N sub-matrices, satisfies the following conditions, a hyperspectral image can be generated more accurately from a compressed image.
- the average pixel value of each mask image will not be extremely high.
- the maximum value of each of the multiple numerical values contained in each sub-matrix is M and the average of the multiple numerical values contained in the i-th sub-matrix (i is a natural number between 1 and N) of the N sub-matrices is ⁇ i, ⁇ i ⁇ 0.8M for all i.
- ⁇ i ⁇ 0.6M may be used so that ⁇ i is lower than the maximum pixel value with some margin.
- the average pixel value of each mask image will not be extremely low.
- ⁇ i ⁇ 0.08M for all i.
- ⁇ i ⁇ 0.1M, ⁇ i ⁇ 0.2M, or ⁇ i ⁇ 0.4M may be used so that ⁇ i is higher than the minimum pixel value with a margin of error.
- ⁇ i may be combined in any way.
- 0.08M ⁇ i ⁇ 0.8M, 0.1M ⁇ i ⁇ 0.8M, 0.2M ⁇ i ⁇ 0.8M, or 0.4M ⁇ i ⁇ 0.8M may be satisfied.
- 0.08M ⁇ i ⁇ 0.6M, 0.1M ⁇ i ⁇ 0.6M, 0.2M ⁇ i ⁇ 0.6M, or 0.4M ⁇ i ⁇ 0.6M may be satisfied.
- FIG. 1 An imaging device having an encoding element including a plurality of regions having different transmission spectra; a storage device that stores matrix data including N sub-matrices corresponding to N wavelength bands (N is an integer equal to or greater than 2); a processing circuit for generating N spectral images corresponding to the N wavelength bands, based on a compressed image in which information of the N wavelength bands is compressed and the matrix data, the compressed image being generated by the imaging device; Equipped with each of the N sub-matrices includes a plurality of numerical values; the plurality of numerical values correspond to a plurality of pixel values acquired by imaging based on light passing through the encoding element, a maximum value of each of the plurality of numerical values corresponds to a maximum value determined by a number of bits set for each of the plurality of pixel values; When the maximum value of each of the plurality of numerical values is M and the average of the plurality of numerical values included in the i-th submatrix (i is a natural number between 1 and N) among the N sub
- This imaging system makes it possible to avoid extremely high ⁇ i and more accurately generate multiple spectroscopic images from images with compressed spectral information.
- This imaging system makes it possible to avoid extremely low ⁇ i and more accurately generate multiple spectroscopic images from images with compressed spectral information.
- This imaging system allows ⁇ i to be lower than the maximum pixel value with a margin of error.
- This imaging system allows ⁇ i to be set higher than the minimum pixel value with a margin of error.
- Each of the N sub-matrices is a two-dimensional matrix indicating a two-dimensional distribution of the plurality of numerical values.
- the imaging system according to any one of the first to fourth aspects.
- This imaging system makes it easier to understand how pixel values are distributed two-dimensionally for a given wavelength band from each matrix.
- Each of the N small matrices is a one-dimensional matrix in which the plurality of numerical values are arranged one-dimensionally.
- the imaging system according to any one of the first to fourth aspects.
- This imaging system allows matrix data to be represented as a two-dimensional matrix.
- Matrix data used to generate N spectral images corresponding to N wavelength bands from a compressed image in which information on the N wavelength bands is compressed comprising: N sub-matrices corresponding to the N wavelength bands, each of the N sub-matrices including a plurality of numerical values; the plurality of numerical values correspond to a plurality of pixel values acquired by imaging based on light passing through an encoding element including a plurality of regions having mutually different transmission spectra, and a maximum value of each of the plurality of numerical values corresponds to a maximum value determined by a number of bits set for each of the plurality of pixel values,
- the maximum value of each of the plurality of numerical values is M and the average of the plurality of numerical values included in the i-th submatrix (i is a natural number between 1 and N) among the N submatrices is ⁇ i, There exists an i that satisfies ⁇ i ⁇ 0.8M.
- This matrix data allows multiple spectroscopic images to be generated more accurately from images with compressed spectral information.
- a computer-implemented method for generating matrix data comprising the steps of: An imaging device having an encoding element including a plurality of regions having mutually different transmission spectra is caused to acquire N light images corresponding to N wavelength bands (N is an integer of 2 or more) under adjustment of imaging conditions; generating matrix data including N sub-matrices corresponding to the N light images respectively; Including, The matrix data is used to generate N spectroscopic images corresponding to the N wavelength bands from a compressed image in which the N wavelength bands are compressed, and each of the N small matrices includes a plurality of numerical values; the plurality of numerical values correspond to a plurality of pixel values acquired by imaging based on light passing through the encoding element including a plurality of regions having different transmission spectra, a maximum value of each of the plurality of numerical values corresponds to a maximum value determined by a number of bits set for each of the plurality of pixel values; When the maximum value of each of the plurality of numerical values is M and the average
- This method makes it possible to obtain matrix data that can more accurately generate multiple spectroscopic images from an image with compressed spectral information.
- the imaging system, matrix data, and method for generating matrix data according to the present disclosure are not limited to the above-described embodiment.
- the present disclosure also includes other embodiments realized by combining any of the components in the above-described embodiment, and modified examples obtained by applying various modifications to the above-described embodiment that would come to mind by a person skilled in the art without departing from the spirit of the present disclosure.
- a filter array including a filter F(1,1) having a transmittance characteristic c(1,1) in a wavelength region W, ..., a filter F(n,m) having a transmittance characteristic c(n,m) in the wavelength region W; an image sensor including pixels p(1,1), ..., p(n,m); a memory for storing first data including values h1(1,1), ..., and value h1(n,m), and Nth data including ..., value hN(1,1), ..., and value hN(n,m); An image processing device is included,
- the wavelength region W includes a first wavelength region, to, an Nth wavelength region, the image sensor captures an image of a subject through the filter array and outputs an image including a plurality of pixel values, the plurality of pixel values including pixel values pg(1,1), ..., pixel value pg(n,m), the pixel p(1,1) corresponds to the pixel value pg(1,1),
- Figure 13 is a diagram illustrating an example of a filter array.
- Figure 14 is a diagram illustrating an example of an image sensor.
- FIG. 15 is a diagram illustrating an example of an image processing device 200.
- the filter array 110 may include a filter F(1,1) having a transmittance characteristic c(1,1) in a wavelength region W, to a filter F(n,m) having a transmittance characteristic c(n,m) in the wavelength region W (see FIG. 13).
- the image sensor 160 may include pixels p(1,1), ..., pixels p(n,m) (see Figure 14).
- the memory 212 may store first data including values h1(1,1), ..., and value h1(n,m), and Nth data including ..., value hN(1,1), ..., and value hN(n,m) (see FIG. 15).
- the image processing device 200 may include a memory 212.
- the image processing device 200 may not include a memory 212.
- the memory 212 may be provided outside the image processing device 200.
- the wavelength region W may include the first wavelength region, through the Nth wavelength region (see Figures 3A and 3B).
- the image sensor 160 may capture an image of an object through the filter array 110 and output an image including a plurality of pixel values (see FIGS. 1A to 1D).
- the plurality of pixel values may include pixel values pg(1,1), ..., and pixel value pg(n,m).
- the pixel p(1,1) may correspond to the pixel value pg(1,1), ..., and the pixel p(n,m) may correspond to the pixel value pg(n,m). (See FIG.
- the image processing device 200 may generate a first image including pixel values pf1(1,1), to pf1(n,m) based on the plurality of pixel values and the first data and corresponding to the first wavelength region, and an Nth image including pixel values pfN(1,1), to pfN(n,m) based on the plurality of pixel values and the N data and corresponding to the N wavelength region (see FIG. 15, formula (1) and formula (2)).
- the first image is described as image 20W 1
- the Nth images are described as image 20W N.
- the first image may be the reconstruction image 20W 1 described in the above embodiment
- the Nth images may be the reconstruction image 20W N described in the above embodiment.
- the values h1(1,1), ..., and the maximum value of the values h1(n,m) may be the first maximum value M1, ..., and the values hN(1,1), ..., and the maximum value of the values hN(n,m) may be the Nth maximum value MN.
- the average value of the values h1(1,1), ..., and h1(n,m) may be less than or equal to M1 x 0.8, and the average value of the values hN(1,1), ..., and hN(n,m) may be less than or equal to MN x 0.8.
- It may also include an imaging device having an encoding element that includes multiple regions with mutually different transmission spectra.
- It may also include a storage device that stores matrix data including N sub-matrices each corresponding to N wavelength bands (N is an integer equal to or greater than 2).
- the system may include a processing circuit that generates N spectral images corresponding to the N wavelength bands based on a compressed image generated by the imaging device and in which information about the N wavelength bands is compressed, and the matrix data.
- Each of the N sub-matrices may contain multiple numerical values.
- the plurality of numerical values may each correspond to a plurality of pixel values obtained by imaging based on light passing through the encoding element.
- the maximum value of each of the plurality of numerical values may correspond to a maximum value determined by the number of bits set for each of the plurality of pixel values.
- ⁇ 1 ⁇ 0.8M, ⁇ 2 ⁇ 0.8M, and ⁇ 4 ⁇ 0.8M, and ⁇ 3 may be greater than 0.8M.
- the spectral images corresponding to the first wavelength band, the second wavelength band, and the fourth wavelength band can be generated more accurately.
- ⁇ i ⁇ 0.08M may also be used. This allows for more accurate generation of a spectral image corresponding to the i-th wavelength band that satisfies 0.08M ⁇ i ⁇ 0.8M.
- the analysis process of the subject may be performed based on K spectral images corresponding to K (1 ⁇ K ⁇ N) submatrices consisting of submatrices corresponding to i that satisfy ⁇ i ⁇ 0.8M.
- the analysis process of the subject may be performed using the spectral images generated based on the submatrices corresponding to i that satisfy ⁇ i ⁇ 0.8M, and the spectral images generated based on the submatrices corresponding to i that do not satisfy ⁇ i ⁇ 0.8M may not be used in the analysis process of the subject. This allows for more accurate analysis to be performed using the spectral images corresponding to the i-th wavelength band that satisfies ⁇ i ⁇ 0.8M.
- the analysis process is performed based on the spectral images corresponding to the first wavelength band, the spectral images corresponding to the second wavelength band, and the spectral images corresponding to the fourth wavelength band, and the spectral images corresponding to the third wavelength band may not be used in the analysis process.
- the analytical process may be, for example, an inspection to determine whether or not there is a foreign object in the subject, an inspection to determine the quality of paint, or a pharmaceutical inspection.
- the subject may be an electronic component or food.
- the analytical process may also be an analysis of the concentration of a substance or an analysis of various components.
- the subject analysis process may be performed based on K spectroscopic images corresponding to K (1 ⁇ K ⁇ N) submatrices consisting of submatrices corresponding to i that satisfy 0.08M ⁇ i ⁇ 0.8M.
- the subject analysis process may be performed using spectroscopic images generated based on submatrices corresponding to i that satisfy 0.08M ⁇ i ⁇ 0.8M, and the spectroscopic images generated based on submatrices corresponding to i that do not satisfy 0.08M ⁇ i ⁇ 0.8M may not be used in the subject analysis process.
- the technology disclosed herein is useful, for example, in cameras and measuring devices that capture multi-wavelength or high-resolution images.
- the technology disclosed herein can also be applied, for example, to sensing for biomedical and cosmetic applications, food foreign body and pesticide residue inspection systems, remote sensing systems, and vehicle-mounted sensing systems.
- REFERENCE SIGNS LIST 10 Compressed image 20 Hyperspectral image 20W1 , 20W2 , ..., 20WN restored image 70 Object 100 Imaging device 110 Filter array 140, 140A, 140B Optical system 160 Image sensor 200 Image processing device 210 Processing circuit 210a Control circuit 210b Signal processing circuit 212 Memory 214 Image restoration module 220 Storage device 300 Display device 310 Input UI 320 Display UI 510 Light source 520 Monochromator 530 Integrating sphere
Landscapes
- Engineering & Computer Science (AREA)
- Multimedia (AREA)
- Signal Processing (AREA)
- Physics & Mathematics (AREA)
- Spectroscopy & Molecular Physics (AREA)
- General Physics & Mathematics (AREA)
- Computing Systems (AREA)
- Theoretical Computer Science (AREA)
- Spectrometry And Color Measurement (AREA)
- Studio Devices (AREA)
Priority Applications (3)
| Application Number | Priority Date | Filing Date | Title |
|---|---|---|---|
| CN202480013551.3A CN120712782A (zh) | 2023-03-20 | 2024-03-04 | 摄像系统、矩阵数据及矩阵数据的生成方法 |
| JP2025508283A JPWO2024195499A1 (https=) | 2023-03-20 | 2024-03-04 | |
| US19/315,903 US20250386084A1 (en) | 2023-03-20 | 2025-09-02 | Imaging system, matrix data, and matrix data generation method |
Applications Claiming Priority (2)
| Application Number | Priority Date | Filing Date | Title |
|---|---|---|---|
| JP2023-044495 | 2023-03-20 | ||
| JP2023044495 | 2023-03-20 |
Related Child Applications (1)
| Application Number | Title | Priority Date | Filing Date |
|---|---|---|---|
| US19/315,903 Continuation US20250386084A1 (en) | 2023-03-20 | 2025-09-02 | Imaging system, matrix data, and matrix data generation method |
Publications (1)
| Publication Number | Publication Date |
|---|---|
| WO2024195499A1 true WO2024195499A1 (ja) | 2024-09-26 |
Family
ID=92841899
Family Applications (1)
| Application Number | Title | Priority Date | Filing Date |
|---|---|---|---|
| PCT/JP2024/008076 Ceased WO2024195499A1 (ja) | 2023-03-20 | 2024-03-04 | 撮像システム、行列データ、および行列データの生成方法 |
Country Status (4)
| Country | Link |
|---|---|
| US (1) | US20250386084A1 (https=) |
| JP (1) | JPWO2024195499A1 (https=) |
| CN (1) | CN120712782A (https=) |
| WO (1) | WO2024195499A1 (https=) |
Citations (1)
| Publication number | Priority date | Publication date | Assignee | Title |
|---|---|---|---|---|
| JP2016156801A (ja) * | 2014-11-19 | 2016-09-01 | パナソニックIpマネジメント株式会社 | 撮像装置および分光システム |
-
2024
- 2024-03-04 WO PCT/JP2024/008076 patent/WO2024195499A1/ja not_active Ceased
- 2024-03-04 JP JP2025508283A patent/JPWO2024195499A1/ja active Pending
- 2024-03-04 CN CN202480013551.3A patent/CN120712782A/zh active Pending
-
2025
- 2025-09-02 US US19/315,903 patent/US20250386084A1/en active Pending
Patent Citations (1)
| Publication number | Priority date | Publication date | Assignee | Title |
|---|---|---|---|---|
| JP2016156801A (ja) * | 2014-11-19 | 2016-09-01 | パナソニックIpマネジメント株式会社 | 撮像装置および分光システム |
Also Published As
| Publication number | Publication date |
|---|---|
| JPWO2024195499A1 (https=) | 2024-09-26 |
| CN120712782A (zh) | 2025-09-26 |
| US20250386084A1 (en) | 2025-12-18 |
Similar Documents
| Publication | Publication Date | Title |
|---|---|---|
| JP6952277B2 (ja) | 撮像装置および分光システム | |
| JP7720532B2 (ja) | 信号処理方法、信号処理装置、および撮像システム | |
| US11843876B2 (en) | Optical filter array, photodetection device, and photodetection system | |
| US20250341661A1 (en) | Photodetection device, photodetection system, and filter array | |
| JP7829156B2 (ja) | 画像処理装置、撮像システム、および復元画像の誤差を推定する方法 | |
| WO2021246192A1 (ja) | 信号処理方法、信号処理装置、および撮像システム | |
| WO2023286613A1 (ja) | フィルタアレイ、光検出装置、および光検出システム | |
| WO2023176492A1 (ja) | 撮像システム | |
| WO2023282069A1 (ja) | 信号処理装置および信号処理方法 | |
| WO2022163421A1 (ja) | 検査対象に含まれる異物を検出する方法および装置 | |
| US20240311971A1 (en) | Signal processing method, non-volatile computer-readable recording medium, and system | |
| WO2024195499A1 (ja) | 撮像システム、行列データ、および行列データの生成方法 | |
| WO2024043009A1 (ja) | 信号処理方法および信号処理装置 | |
| JP7122636B2 (ja) | フィルタアレイおよび光検出システム | |
| JP2024020922A (ja) | 復元画像の評価方法および撮像システム、 | |
| WO2025084081A1 (ja) | 撮像システムおよびそれに用いられる方法 | |
| WO2025100176A1 (ja) | 画像を補正する方法およびシステム | |
| WO2024053302A1 (ja) | 情報処理方法および撮像システム | |
| WO2025192485A1 (ja) | 撮像システムおよび撮像方法 | |
| JP2025071703A (ja) | 画像を生成するシステムに用いられる装置およびフィルタアレイ | |
| US20260012711A1 (en) | Imaging system and method | |
| US12604073B2 (en) | Device and filter array used in system for generating spectral images corresponding to N wavelength bands where N is an integer greater than or equal to four | |
| WO2026088780A1 (ja) | 情報処理方法、処理装置、およびコンピュータプログラム | |
| WO2025115710A1 (ja) | 画像の補正に用いられる方法、およびその方法を実行する処理回路 | |
| WO2025192316A1 (ja) | 撮像装置、撮像システム、および撮像方法 |
Legal Events
| Date | Code | Title | Description |
|---|---|---|---|
| 121 | Ep: the epo has been informed by wipo that ep was designated in this application |
Ref document number: 24774643 Country of ref document: EP Kind code of ref document: A1 |
|
| ENP | Entry into the national phase |
Ref document number: 2025508283 Country of ref document: JP Kind code of ref document: A |
|
| WWE | Wipo information: entry into national phase |
Ref document number: 2025508283 Country of ref document: JP |
|
| NENP | Non-entry into the national phase |
Ref country code: DE |
|
| 122 | Ep: pct application non-entry in european phase |
Ref document number: 24774643 Country of ref document: EP Kind code of ref document: A1 |