WO2024176642A1 - 判定装置および判定方法 - Google Patents
判定装置および判定方法 Download PDFInfo
- Publication number
- WO2024176642A1 WO2024176642A1 PCT/JP2024/000518 JP2024000518W WO2024176642A1 WO 2024176642 A1 WO2024176642 A1 WO 2024176642A1 JP 2024000518 W JP2024000518 W JP 2024000518W WO 2024176642 A1 WO2024176642 A1 WO 2024176642A1
- Authority
- WO
- WIPO (PCT)
- Prior art keywords
- transmission line
- distribution
- value
- processing unit
- signal
- Prior art date
- Legal status (The legal status is an assumption and is not a legal conclusion. Google has not performed a legal analysis and makes no representation as to the accuracy of the status listed.)
- Ceased
Links
Images







Classifications
-
- H—ELECTRICITY
- H04—ELECTRIC COMMUNICATION TECHNIQUE
- H04B—TRANSMISSION
- H04B3/00—Line transmission systems
- H04B3/02—Details
- H04B3/46—Monitoring; Testing
-
- G—PHYSICS
- G01—MEASURING; TESTING
- G01R—MEASURING ELECTRIC VARIABLES; MEASURING MAGNETIC VARIABLES
- G01R31/00—Arrangements for testing electric properties; Arrangements for locating electric faults; Arrangements for electrical testing characterised by what is being tested not provided for elsewhere
- G01R31/08—Locating faults in cables, transmission lines, or networks
- G01R31/11—Locating faults in cables, transmission lines, or networks using pulse reflection methods
Definitions
- This disclosure relates to a determination device and a determination method.
- This application claims priority to Japanese Application No. 2023-025672, filed on February 22, 2023, and incorporates all of the contents of said Japanese application by reference.
- Patent Document 1 JP 2007-305478 A discloses the following break determination device for an electric cable. That is, the break determination device for an electric cable includes an electric cable consisting of multiple electric wires, an electric shield layer covering the multiple electric wires, and a sheath covering the electric shield layer, a break determination line provided in the electric shield layer and consisting of a conductor wire and an insulating layer around the conductor wire, a voltage source electrically connected to the conductor wire, a first detector electrically connected to the conductor wire, and a second detector electrically connected to the electric shield layer.
- the determination device disclosed herein includes a signal output unit that outputs a measurement signal having a frequency component to a transmission line, a signal receiving unit that receives a response signal from the transmission line that includes a signal resulting from reflection of the measurement signal, an acquisition unit that acquires multiple evaluation values based on at least one of the amplitude and phase of the response signal received by the signal receiving unit, and a determination unit that determines an abnormality in the transmission line based on the distribution of the evaluation values acquired by the acquisition unit.
- One aspect of the present disclosure may be realized not only as a determination device having such a characteristic processing unit, but also as a program for causing a computer to execute such characteristic processing steps, as a semiconductor integrated circuit that realizes part or all of the determination device, or as a system that includes the determination device. judgement
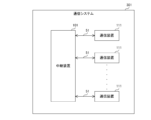
- FIG. 1 is a diagram illustrating a configuration of a communication system according to an embodiment of the present disclosure.
- FIG. 2 is a diagram illustrating a configuration of a relay device according to an embodiment of the present disclosure.
- FIG. 3 is a diagram illustrating an example of a change over time in the frequency distribution F1 generated by the processing unit in the relay device according to the embodiment of the present disclosure.
- FIG. 4 is a diagram illustrating another example of the change over time in the frequency distribution F1 generated by the processing unit in the relay device according to the embodiment of the present disclosure.
- 11 is a diagram illustrating a correspondence relationship between phase differences ⁇ op, ⁇ sh and distances Lop, Lsh calculated by a processing unit in the relay device according to the embodiment of the present disclosure.
- FIG. 11 is a diagram illustrating a correspondence relationship between phase differences ⁇ op, ⁇ sh and distances Lop, Lsh calculated by a processing unit in the relay device according to the embodiment of the present disclosure.
- FIG. 7 is a diagram illustrating another example of the change over time in the frequency distribution F1 generated by the processing unit in the relay device according to the embodiment of the present disclosure.
- FIG. 8 is a diagram illustrating an example of a frequency distribution F1 generated by a processing unit in a relay device according to an embodiment of the present disclosure.
- FIG. 9 is a diagram illustrating another example of the frequency distribution F1 generated by the processing unit in the relay device according to the embodiment of the present disclosure.
- FIG. 10 is a diagram illustrating another example of the frequency distribution F1 generated by the processing unit in the relay device according to the embodiment of the present disclosure.
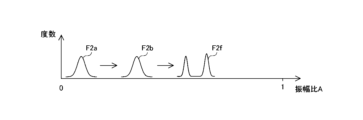
- FIG. 11 is a diagram illustrating an example of a change over time in the frequency distribution F2 generated by the processing unit in the relay device according to the embodiment of the present disclosure.
- FIG. 12 is a diagram illustrating another example of the change over time in the frequency distribution F2 generated by the processing unit in the relay device according to the embodiment of the present disclosure.
- FIG. 13 is a diagram illustrating another example of the change over time in the frequency distribution F2 generated by the processing unit in the relay device according to the embodiment of the present disclosure.
- FIG. 14 is a diagram illustrating an example of a frequency distribution F2 generated by a processing unit in a relay device according to an embodiment of the present disclosure.
- FIG. 15 is a diagram illustrating another example of the frequency distribution F2 generated by the processing unit in the relay device according to the embodiment of the present disclosure.
- FIG. 16 is a diagram illustrating another example of the frequency distribution F2 generated by the processing unit in the relay device according to the embodiment of the present disclosure.
- FIG. 17 is a diagram illustrating another example of the frequency distribution F1 generated by the processing unit in the relay device according to the embodiment of the present disclosure.
- FIG. 18 is a flowchart illustrating an example of an operation procedure when a relay device according to an embodiment of the present disclosure performs a determination process.
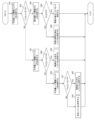
- FIG. 19 is a flowchart illustrating an example of an operation procedure when a relay device according to an embodiment of the present disclosure performs a determination process.
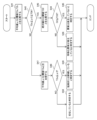
- FIG. 20 is a flowchart illustrating an example of an operation procedure when a relay device according to an embodiment of the present disclosure performs a determination process.
- the present disclosure has been made to solve the above-mentioned problems, and its purpose is to provide a determination device and a determination method that can more accurately determine abnormalities in a transmission line.
- an abnormality in a transmission line can be determined more accurately.
- a determination device includes a signal output unit that outputs a measurement signal having a frequency component to a transmission line, a signal receiving unit that receives a response signal from the transmission line, the response signal including a signal resulting from reflection of the measurement signal, an acquisition unit that acquires a plurality of evaluation values based on at least one of the amplitude and phase of the response signal received by the signal receiving unit, and a determination unit that determines an abnormality in the transmission line based on a distribution of the evaluation values acquired by the acquisition unit.
- a measurement signal having a frequency component is output to the transmission line, an evaluation value is obtained based on a response signal received from the transmission line, and an abnormality in the transmission line is judged based on the distribution of the obtained evaluation values.
- This configuration makes it possible to perform an abnormality judgment based on statistics of evaluation values obtained multiple times, thereby improving the reliability of the abnormality judgment. Therefore, an abnormality in the transmission line can be judged more accurately.
- the determination unit may determine an abnormality in the transmission line based on a change over time in the statistics indicated by the distribution.
- the determination unit may determine an abnormality in the transmission line based on the correlation between the distribution and a predetermined distribution.
- the determination unit may further determine the type of abnormality that has occurred in the transmission line based on the distribution.
- This configuration allows efficient maintenance planning, such as replacing transmission lines, depending on the type of abnormality detected.
- the determination unit may determine that the type of abnormality occurring in the transmission line is at least one of a break in the transmission line, a short circuit in the transmission line, and deterioration of the transmission line.
- This configuration makes it possible to more accurately determine whether or not the transmission line needs to be replaced depending on the type of abnormality detected.
- the acquisition unit may acquire a first evaluation value that is the evaluation value based on the amplitude and a second evaluation value that is the evaluation value based on the phase, and the determination unit may determine an abnormality in the transmission line based on a distribution of the first evaluation value and a distribution of the second evaluation value.
- This configuration allows for more accurate determination of abnormalities in the transmission line. For example, it is possible to determine whether a transmission line is short-circuited or deteriorated, and whether a transmission line is broken or deteriorated.
- the determination unit may determine that the type of abnormality that has occurred in the transmission line is a break in the transmission line, a short circuit in the transmission line, or deterioration of the transmission line, based on the distribution of the first evaluation value and the distribution of the second evaluation value.
- the distribution of the first evaluation value and the distribution of the second evaluation value can be used to accurately determine breaks, short circuits, and degradation of the transmission line.
- the determination unit may determine the position of an abnormality that has occurred in the transmission line based on the distribution of the second evaluation value.
- the distribution of the second evaluation values can be used to accurately determine the location of an anomaly in the transmission line.
- a determination method includes the steps of outputting a measurement signal having a frequency component to a transmission line, receiving a response signal from the transmission line including a signal resulting from reflection of the measurement signal, acquiring an evaluation value based on at least one of the amplitude and phase of the received response signal, and determining an abnormality in the transmission line based on a distribution of the acquired evaluation values.
- the method can perform an abnormality judgment based on statistics of evaluation values acquired multiple times, thereby improving the reliability of the abnormality judgment. Therefore, an abnormality in the transmission line can be judged more accurately.
- FIG. 1 is a diagram showing a configuration of a communication system according to an embodiment of the present disclosure.
- a communication system 301 includes a relay device 101 and a plurality of communication devices 111.
- the relay device 101 is connected one-to-one to each communication device 111 via a transmission line 51 for communication.
- the transmission line 51 includes a cable portion and a connector portion provided at a first end and a second end of the cable portion.
- the connector portion provided at the first end of the cable portion is connected to the relay device 101.
- the connector portion provided at the second end of the cable portion is connected to the communication device 111.
- the transmission line 51 may be a single wire or a pair wire.
- the transmission line 51 is, for example, an Ethernet (registered trademark) cable.
- the communication system 301 is mounted, for example, on a vehicle.
- the communication device 111 is, for example, an on-board ECU (Electronic Control Unit).
- the communication system 301 may also be used, for example, in a home network or factory automation.
- the relay device 101 is capable of communicating with the communication device 111.
- the relay device 101 performs relay processing to relay information exchanged between multiple communication devices 111 connected to different transmission lines 51, for example.
- the relay device 101 also functions as a determination device, and performs determination processing to determine abnormalities in the transmission line 51, for example, periodically. More specifically, the transmission line 51 may break due to deterioration, or may be short-circuited with other electric wires or ground.
- the relay device 101 determines breaks, short circuits, etc. in the transmission line 51 as abnormalities in the transmission line 51.
- the relay device 101 includes a relay unit 10, a plurality of determination processing units 20, and a plurality of communication ports 30.
- the determination processing unit 20 includes a signal output unit 21, a signal receiving unit 22, a processing unit 23, and a storage unit 24.
- the processing unit 23 is an example of an acquisition unit and an example of a determination unit. A part or all of the relay unit 10, the signal output unit 21, the signal receiving unit 22, and the processing unit 23 are realized, for example, by a processing circuit (Circuitry) including one or more processors.
- the storage unit 24 is, for example, a non-volatile memory included in the processing circuit.
- the communication port 30 is, for example, a connector or a terminal. A connector portion of a transmission line 51 is connected to each communication port 30.
- the end of the transmission line 51 on the communication device 111 side is impedance matched. Note that this end of the transmission line 51 does not need to be precisely impedance matched.
- the relay device 101 outputs a measurement signal having a frequency component to the transmission line 51, and receives a response signal including a signal resulting from the reflection of the measurement signal from the transmission line 51.
- the relay device 101 acquires a plurality of evaluation values EV based on the amplitude and phase of the received response signal.
- the relay device 101 determines an abnormality in the transmission line 51 based on the distribution of the acquired evaluation values EV. Details of the processing in the relay device 101 will be described later.
- the relay unit 10 performs relay processing to relay frames between communication devices 111. More specifically, the relay unit 10 transmits a frame received from a certain communication device 111 via a corresponding transmission line 51 and a corresponding communication port 30 to another communication device 111 via the corresponding communication port 30 and the corresponding transmission line 51 in accordance with destination information such as a destination IP address, a MAC address, and a message ID of the frame. That is, the relay unit 10 transmits and receives a communication signal including the frame to and from the communication device 111 via the communication port 30 and the transmission line 51.
- destination information such as a destination IP address, a MAC address, and a message ID of the frame. That is, the relay unit 10 transmits and receives a communication signal including the frame to and from the communication device 111 via the communication port 30 and the transmission line 51.
- the relay device 101 includes the same number of determination processors 20 as the number of communication ports 30. More specifically, the determination processors 20 are provided corresponding to the communication ports 30, and perform a determination process for determining an abnormality in the transmission line 51 connected to the corresponding communication port 30. Below, a representative determination process by one determination processor 20 in the relay device 101 will be described.
- the signal output unit 21 outputs a measurement signal having a frequency component to the transmission line 51. More specifically, the signal output unit 21 outputs an AC signal, a pulse signal, or a frequency sweep signal to the transmission line 51 as the measurement signal.
- the signal output unit 21 outputs a measurement signal to the transmission line 51 via the corresponding communication port 30.
- the relay unit 10 outputs period information indicating a period during which relay processing is not performed via the transmission line 51 to the processing unit 23.
- the processing unit 23 receives period information from the relay unit 10, determines a judgment period T1 for performing judgment processing based on the received period information, and outputs a judgment instruction indicating the determined judgment period T1 to the signal output unit 21 and the signal receiving unit 22.
- the signal output unit 21 When the signal output unit 21 receives a judgment instruction from the processing unit 23 and the start time of the judgment period T1 indicated by the received judgment instruction arrives, the signal output unit 21 outputs a measurement signal to the transmission line 51 via the corresponding communication port 30 until the judgment period T1 expires.
- the signal output unit 21 outputs a measurement signal that is a sine wave of frequency f to the transmission line 51.
- the memory unit 24 stores N digital signals Ds1 obtained by digitally converting a sine wave for multiple periods. In other words, the memory unit 24 stores a digital signal Ds1 corresponding to a sine wave with N samples.
- N is an integer equal to or greater than 2.
- the signal output unit 21 includes a DA (Digital to Analog) conversion unit.
- the signal output unit 21 acquires the digital signal Ds1 from the storage unit 24 at an output timing according to the period of the operating clock of the DA conversion unit until the judgment period T1 expires.
- the signal output unit 21 outputs a measurement signal of frequency f, which is generated by converting the digital signal Ds1 into analog using the DA conversion unit, to the transmission line 51 via the communication port 30.
- the signal output unit 21 also outputs the acquired digital signal Ds1 to the processing unit 23.
- the frequency f is set according to the length Lc of the transmission line 51.
- the signal output unit 21 may include a signal generating unit such as a DDS (Direct Digital Synthesizer) and output a sine wave generated by the signal generating unit to the transmission line 51 via the communication port 30.
- a signal generating unit such as a DDS (Direct Digital Synthesizer) and output a sine wave generated by the signal generating unit to the transmission line 51 via the communication port 30.
- DDS Direct Digital Synthesizer
- the signal receiving unit 22 receives a response signal including a signal resulting from the reflection of the measurement signal from the transmission line 51. That is, the signal receiving unit 22 receives a response signal including the measurement signal output by the signal output unit 21 and a reflected signal resulting from the reflection of the measurement signal from the transmission line 51 via the corresponding communication port 30.
- the signal receiving unit 22 receives a judgment instruction from the processing unit 23 and the start time of the judgment period T1 indicated by the received judgment instruction arrives, the signal receiving unit 22 receives a response signal from the transmission line 51 via the corresponding communication port 30 until the judgment period T1 expires.
- the signal receiving unit 22 includes an AD (Analog to Digital) conversion unit. During the determination period T1, the signal receiving unit 22 samples the response signal received from the transmission line 51 using the AD conversion unit, thereby generating a digital signal Ds2 with N samples. The signal receiving unit 22 outputs the generated digital signal Ds2 to the processing unit 23.
- AD Analog to Digital
- the processing unit 23 calculates an evaluation value EV based on the amplitude and phase of the response signal received by the signal receiving unit 22.
- the processing unit 23 performs a determination process based on the distribution of the calculated evaluation values EV.
- the processing unit 23 calculates the evaluation value EV based on the amplitude and phase of the measurement signal and the amplitude and phase of the reflected signal included in the response signal.
- the processing unit 23 generates a digital signal Ds3 indicative of the reflected signal by subtracting the components of the digital signal Ds1 received from the signal output unit 21 from the digital signal Ds2 received from the signal receiving unit 22.
- the processing unit 23 calculates an evaluation value EV for the reflection coefficient R, which is the ratio of the reflected signal to the measured signal, expressed by the following formula (1), based on the digital signal Ds1 indicative of the measured signal and the digital signal Ds3 indicative of the reflected signal.
- V1 is the voltage level of the measurement signal.
- V2 is the voltage level of the reflected signal.
- e is Napier's constant.
- j is the imaginary unit.
- ⁇ is the phase difference between the measurement signal and the reflected signal.
- A is the amplitude ratio obtained by dividing the amplitude of the reflected signal by the amplitude of the measurement signal.
- the processing unit 23 calculates the phase difference ⁇ as the evaluation value EV. More specifically, the processing unit 23 calculates, for example, the phase difference ⁇ for each period of the measurement signal based on the digital signal Ds1 indicating the measurement signal and the digital signal Ds3 indicating the reflected signal, and stores the calculated phase difference ⁇ in the storage unit 24.
- the phase difference ⁇ is a value equal to or greater than zero degrees and equal to or less than 360 degrees.
- the phase difference ⁇ is an example of a second evaluation value.
- the processing unit 23 For example, for each judgment period T1, the processing unit 23 generates a frequency distribution F1, which is the distribution of the phase difference ⁇ during that judgment period T1, and determines whether there is an abnormality in the transmission line 51 based on the generated frequency distribution F1.
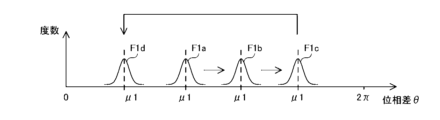
- FIG. 3 is a diagram showing an example of the change over time of the frequency distribution F1 generated by the processing unit in the relay device according to the embodiment of the present disclosure.
- the horizontal axis is the phase difference ⁇ [rad]
- the vertical axis is the degree.
- FIG. 3 shows frequency distributions F1a, F1b, F1c, and F1d that change over time.
- the frequency distribution F1a is the frequency distribution F1 of the phase difference ⁇ when no abnormality occurs in the transmission line 51.
- the frequency distribution F1b is the frequency distribution F1 of the phase difference ⁇ when the transmission line 51 is deteriorated.
- the frequency distribution F1c is the frequency distribution F1 of the phase difference ⁇ when the deterioration of the transmission line 51 has progressed further.
- the frequency distribution F1d is the frequency distribution F1 of the phase difference ⁇ when the transmission line 51 is disconnected.
- the average value ⁇ 1 of the phase difference ⁇ indicated by the frequency distribution F1 increases with deterioration of the transmission line 51, and when the transmission line 51 is broken, the value corresponds to the position of the break. More specifically, the phase difference ⁇ op, which is the phase difference ⁇ when the transmission line 51 is broken, is expressed by the following formula (2).
- Lop is the distance [m] from the end of the transmission line 51 on the relay device 101 side to the breakage position.
- Lop is a value greater than or equal to zero and less than or equal to Lc.
- c is the speed of light [m/sec].
- ⁇ r is the relative dielectric constant of the transmission line 51.
- the average value ⁇ 1 may increase or decrease with deterioration of the transmission line 51, depending on the magnitude relationship between the characteristic impedance Z1 of the transmission line 51 and the load impedance Z2 of the communication device 111.
- the reflection coefficient R is expressed by the following equation (3) using the characteristic impedance Z1 and the load impedance Z2.
- the characteristic impedance Z1 increases as the transmission line 51 deteriorates. Depending on whether the reflection coefficient R increases or decreases when the characteristic impedance Z1 increases, it is determined whether the phase difference ⁇ associated with the deterioration of the transmission line 51 increases or decreases. In the communication system 301, the average value ⁇ 1 is assumed to increase as the transmission line 51 deteriorates.
- FIG. 4 is a diagram showing another example of the change over time of the frequency distribution F1 generated by the processing unit in the relay device according to the embodiment of the present disclosure.
- the horizontal axis is the phase difference ⁇ [rad]
- the vertical axis is the frequency.
- FIG. 4 shows frequency distributions F1a and F1e.
- Frequency distribution F1e is the frequency distribution F1 of the phase difference ⁇ when the transmission line 51 is short-circuited.
- the average value ⁇ 1 indicated by the frequency distribution F1 becomes a value according to the short-circuit position. More specifically, the phase difference ⁇ sh, which is the phase difference ⁇ when the transmission line 51 is short-circuited, is expressed by the following formula (4).
- Lsh is the distance [m] from the end of the transmission line 51 on the relay device 101 side to the short-circuit position.
- Lsh is a value greater than or equal to zero and less than or equal to Lc.
- FIGS. 5 and 6 are diagrams showing the correspondence between the phase differences ⁇ op, ⁇ sh and the distances Lop, Lsh calculated by a processing unit in a relay device according to an embodiment of the present disclosure.
- the horizontal axis is the distance [m] from the end of the transmission line 51 on the relay device 101 side to the position where the abnormality occurs
- the vertical axis is the phase difference ⁇ [rad].
- FIG. 5 shows the correspondence between the phase differences ⁇ op, ⁇ sh and the distances Lop, Lsh when the frequency f of the measurement signal is 10 MHz.
- FIG. 6 shows the correspondence between the phase differences ⁇ op, ⁇ sh and the distances Lop, Lsh when the frequency f of the measurement signal is 1 MHz.
- the minimum value of the phase difference ⁇ sh is smaller than the maximum value of the phase difference ⁇ op. Therefore, for example, when the phase difference ⁇ is the phase difference ⁇ x, it is not possible to determine whether a short circuit has occurred at a position distance L1 from the end of the transmission line 51 on the repeater device 101 side, or whether a break has occurred at a position distance L2 from the end of the transmission line 51 on the repeater device 101 side.
- the minimum value of the phase difference ⁇ sh is greater than the maximum value of the phase difference ⁇ op. Therefore, depending on the value of the phase difference ⁇ , it is possible to determine whether a short circuit has occurred in the transmission line 51 or whether a break has occurred in the transmission line 51.
- the minimum value of the phase difference ⁇ sh is ⁇
- the maximum value of the phase difference ⁇ op is when the distance Lop in the above-mentioned formula (2) is equal to the length Lc of the transmission line 51. Therefore, in the relay device 101, in order to determine whether there is a short circuit or an open circuit in the transmission line 51, the frequency f of the measurement signal is set to a value that satisfies the following formula (5).
- FIG. 7 is a diagram showing another example of the change over time of the frequency distribution F1 generated by the processing unit in the relay device according to the embodiment of the present disclosure.
- the horizontal axis is the phase difference ⁇ [rad]
- the vertical axis is the frequency.
- FIG. 7 shows frequency distributions F1a, F1b, and F1f.
- Frequency distribution F1f is the frequency distribution F1 of the phase difference ⁇ in a state in which a special abnormality other than deterioration, short circuit, or breakage has occurred in the transmission line 51.
- An example of a state in which a special abnormality has occurred in the transmission line 51 is a state in which the transmission line 51 is partially broken, and the cross section of the partially broken portion repeatedly comes into and out of contact.
- the shape of the frequency distribution F1 loses left-right symmetry around the average value ⁇ 1 due to the occurrence of a special abnormality in the transmission line 51.
- the frequency distribution F1 changes when an abnormality occurs in the transmission line 51. Therefore, an abnormality in the transmission line 51 can be determined based on the frequency distribution F1.
- the processing unit 23 when the processing unit 23 generates the frequency distribution F1, it performs a judgment process based on the change over time of the statistics indicated by the frequency distribution F1. As an example, the processing unit 23 calculates the average value ⁇ 1 and the median value m1 of the phase difference ⁇ indicated by the frequency distribution F1 as the statistics indicated by the frequency distribution F1, and performs a judgment process based on the change over time of the average value ⁇ 1 and the median value m1.
- the storage unit 24 stores a reference distribution Fr1, which is a frequency distribution F1 of the phase difference ⁇ when no abnormality occurs in the transmission line 51, and a reference average value ⁇ 1a, which is the average value ⁇ 1 indicated by the reference distribution Fr1.
- the reference distribution Fr1 is generated in advance based on multiple phase differences ⁇ calculated before the operation of the communication system 301.
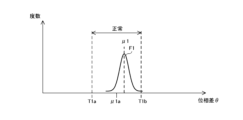
- FIG. 8 is a diagram showing an example of a frequency distribution F1 generated by a processing unit in a relay device according to an embodiment of the present disclosure.
- the horizontal axis represents the phase difference ⁇ [rad]
- the vertical axis represents the frequency.
- the processing unit 23 when the processing unit 23 generates the frequency distribution F1, it compares the average value ⁇ 1 indicated by the generated frequency distribution F1 with the threshold values T1a and T1b set based on the reference distribution Fr1.
- the processing unit 23 also compares the average value ⁇ 1 indicated by the frequency distribution F1 with the median value m1 indicated by the frequency distribution F1.
- threshold T1a is a value obtained by subtracting a predetermined value from the reference average value ⁇ 1a
- threshold T1b is a value obtained by adding a predetermined value to the reference average value ⁇ 1a.
- threshold T1a may be, for example, a value obtained by subtracting three times the standard deviation Sy of the reference distribution Fr1 from the reference average value ⁇ 1a.
- threshold T1b may be, for example, a value obtained by adding three times the standard deviation Sy to the reference average value ⁇ 1a.
- the processing unit 23 determines that no abnormality has occurred in the transmission line 51. Then, the processing unit 23 stores the determination result including the average value ⁇ 1 in the memory unit 24.
- the processing unit 23 may calculate other statistics that represent the shape of the frequency distribution F1, such as the maximum value and standard deviation of the phase difference ⁇ indicated by the frequency distribution F1, and use the other calculated statistics, for example the mode, instead of the median m1.
- FIG. 9 is a diagram showing another example of a frequency distribution F1 generated by a processing unit in a relay device according to an embodiment of the present disclosure.
- the horizontal axis represents the phase difference ⁇ [rad]
- the vertical axis represents the frequency.
- the processing unit 23 determines that an abnormality has occurred in the transmission line 51.
- the processing unit 23 further determines the type of abnormality that has occurred in the transmission line 51 based on the frequency distribution F1. For example, the processing unit 23 determines that the types of abnormality that have occurred in the transmission line 51 are a break in the transmission line 51, a short circuit in the transmission line 51, and deterioration of the transmission line 51.
- the processing unit 23 compares the average value ⁇ 1 with predetermined thresholds T1c, T1d, T1e, and T1f.
- the threshold T1c is a value obtained by subtracting a predetermined margin from zero, which is the minimum value of the phase difference ⁇ op shown in FIG. 6.
- the threshold T1d is a value obtained by adding a predetermined margin to the maximum value of the phase difference ⁇ op shown in FIG. 6.
- the threshold T1e is a value obtained by subtracting a predetermined margin from ⁇ , which is the minimum value of the phase difference ⁇ sh shown in FIG. 6.
- the threshold T1f is a value obtained by adding a predetermined margin to the maximum value of the phase difference ⁇ sh shown in FIG. 6.
- the processing unit 23 determines that the transmission line 51 is short-circuited or degraded. Then, the processing unit 23 stores the determination result, including the average value ⁇ 1, in the memory unit 24.
- the processing unit 23 determines that the transmission line 51 is broken or deteriorated. Then, the processing unit 23 stores the determination result, including the average value ⁇ 1, in the memory unit 24.
- the processing unit 23 determines that the transmission line 51 is degraded. Then, the processing unit 23 stores the determination result including the average value ⁇ 1 in the memory unit 24.
- the processing unit 23 determines the degree of deterioration of the transmission line 51 based on the change over time of the average value ⁇ 1 indicated by the frequency distribution F1. More specifically, when the processing unit 23 determines that the transmission line 51 is deteriorated, it compares the calculated average value ⁇ 1 with the average value ⁇ 1 included in the past determination result. Then, the processing unit 23 determines the degree of deterioration based on the amount of change in the calculated average value ⁇ 1 from the average value ⁇ 1 included in the past determination result.
- FIG. 10 is a diagram showing another example of a frequency distribution F1 generated by a processing unit in a relay device according to an embodiment of the present disclosure.
- the horizontal axis represents the phase difference ⁇ [rad]
- the vertical axis represents the frequency.
- the processing unit 23 determines that a special abnormality has occurred in the transmission line 51. Then, the processing unit 23 stores the determination result, including the average value ⁇ 1 and the median value m1, in the memory unit 24.
- the processing unit 23 determines that an abnormality has occurred in the transmission line 51, it notifies the user of the determination result, including the type of abnormality, via the relay unit 10 and the communication device 111.
- the processing unit 23 determines an abnormality in the transmission line 51 based on a change over time in the shape of the frequency distribution F1. For example, the processing unit 23 determines an abnormality in the transmission line 51 based on a correlation between the shape of the frequency distribution F1 and the shape of the reference distribution Fr1.
- the processing unit 23 acquires the reference distribution Fr1 from the storage unit 24. Then, the processing unit 23 calculates a correlation coefficient C1 indicating the correlation between the generated frequency distribution F1 and the reference distribution Fr1 according to the following formula (6).
- Sxy is the covariance between the frequency distribution F1 and the reference distribution Fr1.
- Sx is the standard deviation of the frequency distribution F1.
- Sy is the standard deviation of the reference distribution Fr1.
- xi is the frequency of the phase difference ⁇ i in the frequency distribution F1.
- yi is the frequency of the phase difference ⁇ i in the reference distribution Fr1.
- n is the number of data points of the phase difference ⁇ that constitute the frequency distribution F1 and the number of data points of the phase difference ⁇ that constitute the reference distribution Fr1.
- the phase difference ⁇ in the frequency distribution F1 and the phase difference ⁇ in the reference distribution Fr1 are relative.
- the phase difference ⁇ in the frequency distribution F1 is corrected so that the position of the tail of the frequency distribution F1 matches the position of the tail of the reference distribution Fr1, or the median m1 of the frequency distribution F1 matches the median of the reference distribution Fr1.
- the processing unit 23 determines that no special abnormality has occurred in the transmission line 51.
- the threshold value TC1 is a value between 0.2 and 1, both inclusive, that is set appropriately by the application, and may be, for example, 0.7.
- the processing unit 23 determines that a special abnormality has occurred in the transmission line 51.
- the processing unit 23 may perform the determination process based on the change over time in the envelope curve that indicates the shape of the frequency distribution F1. More specifically, the processing unit 23 determines whether or not a special abnormality has occurred in the transmission line 51 based on the comparison result between the envelope curve that indicates the shape of the frequency distribution F1 and the envelope curve that indicates the shape of the reference distribution Fr1.
- the processing unit 23 calculates the amplitude ratio A as the evaluation value EV. More specifically, the processing unit 23 calculates, for example, the amplitude ratio A for each period of the measurement signal based on the digital signal Ds1 indicating the measurement signal and the digital signal Ds3 indicating the reflected signal, and stores the calculated amplitude ratio A in the storage unit 24.
- the amplitude ratio A is a value equal to or greater than zero and equal to or less than 1.
- the amplitude ratio A is an example of a first evaluation value.
- the processing unit 23 generates a frequency distribution F2, which is the distribution of the amplitude ratio A during each judgment period T1, and judges an abnormality in the transmission line 51 based on the generated frequency distribution F2.
- FIG. 11 is a diagram showing an example of the change over time in frequency distribution F2 generated by a processing unit in a relay device according to an embodiment of the present disclosure.
- the horizontal axis is amplitude ratio A
- the vertical axis is frequency.
- FIG. 11 shows frequency distributions F2a, F2b, F2c, and F2d.
- Frequency distribution F2a is frequency distribution F2 of amplitude ratio A in a state where no abnormality occurs in transmission line 51.
- Frequency distribution F2b is frequency distribution F2 of amplitude ratio A in a state where transmission line 51 is deteriorated.
- Frequency distribution F2c is frequency distribution F2 of amplitude ratio A in a state where deterioration of transmission line 51 has progressed further.
- Frequency distribution F2d is frequency distribution F2 of amplitude ratio A in a state where transmission line 51 is disconnected.
- the average value ⁇ 2 of the amplitude ratio A shown by the frequency distribution F2 increases with the deterioration of the transmission line 51, and when the transmission line 51 is broken, the value becomes close to 1.
- the average value ⁇ 2 may increase or decrease with the deterioration of the transmission line 51, depending on the magnitude relationship between the characteristic impedance Z1 of the transmission line 51 and the load impedance Z2 of the communication device 111. In the communication system 301, it is assumed that the average value ⁇ 2 increases with the deterioration of the transmission line 51.
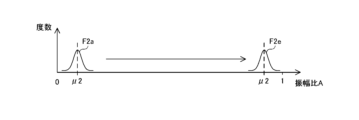
- FIG. 12 is a diagram showing another example of the change over time of the frequency distribution F2 generated by the processing unit in the relay device according to the embodiment of the present disclosure.
- the horizontal axis is the amplitude ratio A
- the vertical axis is the frequency.
- FIG. 12 shows frequency distributions F2a and F2e.
- Frequency distribution F2e is the frequency distribution F2 of the amplitude ratio A when the transmission line 51 is short-circuited.
- the average value ⁇ 2 of the frequency distribution F2 is close to 1 when the transmission line 51 is short-circuited.
- FIG. 13 is a diagram showing another example of the change over time of the frequency distribution F2 generated by the processing unit in the relay device according to the embodiment of the present disclosure.
- the horizontal axis is the amplitude ratio A
- the vertical axis is the frequency.
- FIG. 13 shows frequency distributions F2a, F2b, and F2f.
- Frequency distribution F2f is the frequency distribution F2 of the amplitude ratio A in a state in which a special abnormality has occurred in the transmission line 51.
- the shape of the frequency distribution F2 loses left-right symmetry around the average value ⁇ 2 due to the occurrence of a special abnormality in the transmission line 51.
- the frequency distribution F2 changes when an abnormality occurs in the transmission line 51. Therefore, an abnormality in the transmission line 51 can be determined based on the frequency distribution F2.
- the processing unit 23 when the processing unit 23 generates the frequency distribution F2, it performs a judgment process based on the change over time of the statistics indicated by the frequency distribution F2. As an example, the processing unit 23 calculates the average value ⁇ 2 and the median value m2 of the amplitude ratio A indicated by the frequency distribution F2 as the statistics indicated by the frequency distribution F2, and performs a judgment process based on the change over time of the average value ⁇ 2 and the median value m2.
- the storage unit 24 stores a reference distribution Fr2, which is a frequency distribution F2 of the amplitude ratio A when no abnormality occurs in the transmission line 51, and a reference average value ⁇ 2a, which is the average value ⁇ 2 indicated by the reference distribution Fr2.
- the reference distribution Fr2 is generated in advance based on a plurality of amplitude ratios A calculated before the operation of the communication system 301.
- FIG. 14 is a diagram showing an example of a frequency distribution F2 generated by a processing unit in a relay device according to an embodiment of the present disclosure.
- the horizontal axis represents the amplitude ratio A
- the vertical axis represents the frequency.
- the processing unit 23 when the processing unit 23 generates the frequency distribution F2, it compares the mean value ⁇ 2 indicated by the generated frequency distribution F2 with the threshold values T2a and T2b set based on the reference distribution Fr2.
- the processing unit 23 also compares the mean value ⁇ 2 indicated by the frequency distribution F2 with the median value m2 indicated by the frequency distribution F2.
- threshold T2a is a value obtained by subtracting a predetermined value from the reference average value ⁇ 2a
- threshold T2b is a value obtained by adding a predetermined value to the reference average value ⁇ 2a.
- threshold T2a may be, for example, a value obtained by subtracting three times the standard deviation Sp of the reference distribution Fr2 from the reference average value ⁇ 2a.
- threshold T2b may be, for example, a value obtained by adding three times the standard deviation Sp to the reference average value ⁇ 2a.
- the processing unit 23 determines that no abnormality has occurred in the transmission line 51. Then, the processing unit 23 stores the determination result, including the average value ⁇ 2, in the memory unit 24.
- the processing unit 23 may calculate other statistics that represent the shape of the frequency distribution F2, such as the maximum value and standard deviation of the amplitude ratio A indicated by the frequency distribution F2, as the statistics indicated by the frequency distribution F2, and use the other calculated statistics instead of the median m2.
- FIG. 15 is a diagram showing another example of a frequency distribution F2 generated by a processing unit in a relay device according to an embodiment of the present disclosure.
- the horizontal axis represents the amplitude ratio A
- the vertical axis represents the frequency.
- the processing unit 23 determines that an abnormality has occurred in the transmission line 51.
- the processing unit 23 further determines the type of abnormality that has occurred in the transmission line 51 based on the frequency distribution F2. For example, the processing unit 23 determines that the type of abnormality that has occurred in the transmission line 51 is a break or short circuit in the transmission line 51, and deterioration of the transmission line 51.
- the processing unit 23 compares the average value ⁇ 2 with a predetermined threshold value T2e.
- the threshold value T2e is a value obtained by subtracting a predetermined value from 1.
- the processing unit 23 determines that the transmission line 51 is short-circuited or disconnected. Then, the processing unit 23 stores the determination result, including the average value ⁇ 2, in the memory unit 24.
- the processing unit 23 determines that the transmission line 51 is degraded. Then, the processing unit 23 stores the determination result including the average value ⁇ 2 in the storage unit 24.
- the processing unit 23 determines the degree of deterioration of the transmission line 51 based on the change over time of the average value ⁇ 2 indicated by the frequency distribution F2. More specifically, when the processing unit 23 determines that the transmission line 51 is deteriorated, it compares the calculated average value ⁇ 2 with the average value ⁇ 2 included in the past determination result. Then, the processing unit 23 determines the degree of deterioration based on the amount of change in the calculated average value ⁇ 2 from the average value ⁇ 2 included in the past determination result.
- FIG. 16 is a diagram showing another example of a frequency distribution F2 generated by a processing unit in a relay device according to an embodiment of the present disclosure.
- the horizontal axis represents the amplitude ratio A
- the vertical axis represents the frequency.
- the processing unit 23 determines that a special abnormality has occurred in the transmission line 51. Then, the processing unit 23 stores the determination result, including the average value ⁇ 2 and the median value m2, in the memory unit 24.
- the processing unit 23 determines an abnormality in the transmission line 51 based on a change over time in the shape of the frequency distribution F2. For example, the processing unit 23 determines an abnormality in the transmission line 51 based on a correlation between the shape of the frequency distribution F2 and the shape of the reference distribution Fr2.
- the processing unit 23 acquires the reference distribution Fr2 from the storage unit 24. Then, the processing unit 23 calculates a correlation coefficient C2 indicating the correlation between the generated frequency distribution F2 and the reference distribution Fr2 according to the following formula (7).
- Spq is the covariance between the frequency distribution F2 and the reference distribution Fr2.
- Sp is the standard deviation of the frequency distribution F2.
- Sq is the standard deviation of the reference distribution Fr2.
- pi is the frequency of the amplitude ratio Ai in the frequency distribution F2.
- q is the frequency of the amplitude ratio Ai in the reference distribution Fr2.
- n is the number of data of the amplitude ratio A constituting the frequency distribution F2 and the number of data of the amplitude ratio A constituting the reference distribution Fr2.
- the amplitude ratio A in the frequency distribution F2 and the amplitude ratio A in the reference distribution Fr2 are relative.
- the amplitude ratio A in the frequency distribution F2 is corrected so that the position of the tail of the frequency distribution F2 matches the position of the tail of the reference distribution Fr2, or the median m2 of the frequency distribution F2 matches the median of the reference distribution Fr2.
- the processing unit 23 determines that no special abnormality has occurred in the transmission line 51.
- the threshold value TC2 is a value between 0.2 and 1, both inclusive, that is set appropriately by the application, and may be, for example, 0.7.
- the processing unit 23 determines that a special abnormality has occurred in the transmission line 51.
- the processing unit 23 may perform the determination process based on the change over time in the envelope curve that indicates the shape of the frequency distribution F2. More specifically, the processing unit 23 determines whether or not a special abnormality has occurred in the transmission line 51 based on the comparison result between the envelope curve that indicates the shape of the frequency distribution F2 and the envelope curve that indicates the shape of the reference distribution Fr2.
- the processing unit 23 judges an abnormality in the transmission line 51 based on the frequency distributions F1 and F2. More specifically, the processing unit 23 executes judgment example 1 and judgment example 2. If it is judged that an abnormality has occurred in the transmission line 51 in at least one of judgment example 1 and judgment example 2, it makes an overall judgment that an abnormality has occurred in the transmission line 51, and notifies the user of the overall judgment result. Note that the processing unit 23 may be configured not to perform either judgment example 1 or judgment example 2.
- the processing unit 23 determines the type of abnormality that has occurred in the transmission line 51 based on the frequency distributions F1 and F2.
- the processing unit 23 determines that the transmission line 51 is short-circuited if the average value ⁇ 1 is equal to or greater than the threshold value T1e, the average value ⁇ 1 is equal to or less than the threshold value T1f, and the average value ⁇ 2 is equal to or greater than the threshold value T2e.
- the processing unit 23 determines that the transmission line 51 is degraded.
- the processing unit 23 determines that the transmission line 51 is broken.
- the processing unit 23 determines that the transmission line 51 is degraded.
- (Variation 4) 17 is a diagram illustrating another example of a frequency distribution F1 generated by the processor in the relay device according to the embodiment of the present disclosure, in which the horizontal axis represents the phase difference ⁇ [rad] and the vertical axis represents the frequency.
- the processing unit 23 determines the locations of breaks, deterioration, and short circuits in the transmission line 51 based on the frequency distribution F1.
- the processing unit 23 determines that the transmission line 51 is disconnected or deteriorated based on the comparison result between the average value ⁇ 1 indicated by the frequency distribution F1 and the threshold values T1c and T1d, it compares the average value ⁇ 1 with the threshold values TA1, TA2, TA3, TA4, and TA5, which are the threshold value TA.
- the threshold value TA is a value equal to or greater than the threshold value T1c and equal to or less than the threshold value T1d.
- the threshold value TA is a value that is arranged at equal intervals between the threshold value T1c and the threshold value T1d.
- the threshold value TA1 is a value obtained by adding a predetermined value M to the threshold value T1c
- the threshold value TA2 is a value obtained by adding a predetermined value M to the threshold value TA1
- the threshold value TA3 is a value obtained by adding a predetermined value M to the threshold value TA2
- the threshold value TA4 is a value obtained by adding a predetermined value M to the threshold value TA3
- the threshold value TA5 is a value obtained by adding a predetermined value M to the threshold value TA4
- the value obtained by adding a predetermined value M to the threshold value TA5 is the threshold value T1d.
- the processing unit 23 may compare the average value ⁇ 1 with four or less threshold values TA or six or more threshold values TA.
- the threshold values TA do not have to be values that are arranged at equal intervals between the threshold value T1c and the threshold value T1d.
- the storage unit 24 stores disconnection position information indicating the correspondence between the threshold value TA and the distance Lop from the end of the transmission line 51 on the relay device 101 side to the disconnection position.
- the disconnection position information is created in advance based on the relationship between the phase difference ⁇ op and the distance Lop shown in FIG. 6.
- the processing unit 23 identifies the threshold value TA that is closest to the average value ⁇ 1 among the five threshold values TA.
- the processing unit 23 acquires the distance Lop that corresponds to the identified threshold value TA from the break position information in the memory unit 24.
- the processing unit 23 determines that the transmission line 51 is broken or deteriorated at the position corresponding to the acquired distance Lop.
- the processing unit 23 determines that the transmission line 51 is short-circuited or degraded based on the comparison result between the average value ⁇ 1 indicated by the frequency distribution F1 and the threshold values T1e and T1f, it compares the average value ⁇ 1 with the threshold values TB1, TB2, TB3, TB4, and TB5, which are the threshold value TB.
- the threshold value TB is a value equal to or greater than the threshold value T1e and equal to or less than the threshold value T1f.
- the threshold value TB is a value that is evenly spaced between the threshold value T1e and the threshold value T1f.
- the threshold value TB1 is a value obtained by adding a predetermined value M to the threshold value T1e
- the threshold value TB2 is a value obtained by adding a predetermined value M to the threshold value TB1
- the threshold value TB3 is a value obtained by adding a predetermined value M to the threshold value TB2
- the threshold value TB4 is a value obtained by adding a predetermined value M to the threshold value TB3
- the threshold value TB5 is a value obtained by adding a predetermined value M to the threshold value TB4
- the value obtained by adding a predetermined value M to the threshold value TB5 is the threshold value T1f.
- the processing unit 23 may compare the average value ⁇ 1 with four or less threshold values TB or six or more threshold values TB.
- the threshold values TB do not have to be values that are evenly spaced between the threshold value T1e and the threshold value T1f.
- the storage unit 24 stores short circuit position information indicating the correspondence between the threshold value TB and the distance Lsh from the end of the transmission line 51 on the relay device 101 side to the short circuit position.
- the short circuit position information is created in advance based on the relationship between the phase difference ⁇ sh and the distance Lsh shown in FIG. 6.
- the processing unit 23 identifies the threshold value TB that is closest to the average value ⁇ 1 among the five threshold values TB.
- the processing unit 23 acquires the distance Lsh corresponding to the identified threshold value TB from the short circuit position information in the memory unit 24.
- the processing unit 23 determines that the transmission line 51 is short circuited or deteriorated at the position corresponding to the acquired distance Lsh.
- the processing unit 23 determines the type of abnormality that has occurred in the transmission line 51 based on the frequency distribution F2 in accordance with the above-mentioned modified example 3. This makes it possible to determine the location of the break, deterioration, and short circuit in the transmission line 51 while determining breaks, short circuits, and deterioration in the transmission line 51.
- FIG. 18 is a flowchart illustrating an example of an operation procedure when a relay device according to an embodiment of the present disclosure performs a determination process.
- the relay device 101 waits for the arrival of the determination period T1 (NO in step S11), and when the determination period T1 arrives (YES in step S11), it starts outputting a measurement signal and receiving a response signal (step S12).
- the relay device 101 calculates the phase difference ⁇ and the amplitude ratio A for each period of the measurement signal based on the amplitude and phase of the measurement signal and the amplitude and phase of the reflected signal included in the response signal (step S13).
- the relay device 101 generates a frequency distribution F1 of the phase difference ⁇ during the determination period T1 and a frequency distribution F2 of the amplitude ratio A during the determination period T1 (step S14).
- the relay device 101 performs a determination process based on the frequency distributions F1 and F2 (step S15).
- the relay device 101 stores the determination result including the average values ⁇ 1 and ⁇ 2 in the memory unit 24 (step S16).
- the relay device 101 determines that an abnormality has occurred, for example, in the transmission line 51, it notifies the user of the determination result via the relay unit 10 and the communication device 111 (step S17).
- the relay device 101 waits for a new judgment period T1 to arrive (NO in step S11).
- FIG. 19 is a flowchart that defines an example of an operational procedure when a relay device according to an embodiment of the present disclosure performs a determination process.
- FIG. 19 is a flowchart that shows details of step S15 in FIG. 18 and illustrates the above-mentioned determination example 1.
- the relay device 101 compares the average value ⁇ 1 indicated by the frequency distribution F1 with the thresholds T1a and T1b (step S21).
- the relay device 101 compares the absolute value D1 of the difference between the average value ⁇ 1 and the median value m1 with the threshold value TD1 (step S23).
- the relay device 101 determines that no abnormality has occurred in the transmission line 51 (step S25).
- the relay device 101 determines that a special abnormality has occurred in the transmission line 51 (step S26).
- the relay device 101 compares the average value ⁇ 1 with the threshold values T1c and T1d (step S27).
- the relay device 101 determines that the transmission line 51 is broken or deteriorated (step S29).
- the relay device 101 compares the average value ⁇ 1 with the threshold values T1e and T1f (step S30).
- the relay device 101 determines that the transmission line 51 is short-circuited or degraded (step S32).
- the relay device 101 determines that the transmission line 51 is degraded (step S33).
- FIG. 20 is a flowchart that defines an example of an operational procedure when a relay device according to an embodiment of the present disclosure performs a determination process.
- FIG. 20 is a flowchart that shows details of step S15 in FIG. 18 and illustrates the above-mentioned determination example 2.
- the relay device 101 compares the average value ⁇ 2 indicated by the frequency distribution F2 with the thresholds T2a and T2b (step S41).
- the relay device 101 compares the absolute value D2 of the difference between the average value ⁇ 2 and the median value m2 with the threshold value TD2 (step S43).
- the relay device 101 determines that no abnormality has occurred in the transmission line 51 (step S45).
- the relay device 101 determines that a special abnormality has occurred in the transmission line 51 (step S46).
- the relay device 101 compares the average value ⁇ 2 with the threshold value T2e (step S47).
- the relay device 101 determines that the transmission line 51 is short-circuited or disconnected (step S49).
- step S50 determines that the transmission line 51 is degraded.
- the relay device 101 executes the process of the flowchart shown in FIG. 19 and the process of the flowchart shown in FIG. 20. Then, when the relay device 101 determines in step S29 that the transmission line 51 is broken or deteriorated, and determines in step S49 that the transmission line 51 is short-circuited or broken, it comprehensively determines that the transmission line 51 is broken.
- the relay device 101 determines in step S32 that the transmission line 51 is short-circuited or degraded, and also determines in step S49 that the transmission line 51 is short-circuited or disconnected, it makes an overall determination that the transmission line 51 is short-circuited.
- the relay device 101 when the relay device 101 determines the position of a break in the transmission line 51, in step S29 shown in FIG. 19, it compares the average value ⁇ 1 with multiple threshold values TA, and obtains the distance Lop corresponding to the threshold value TA that is closest to the average value ⁇ 1 from the break position information. Then, the relay device 101 determines that the transmission line 51 is broken or deteriorated at the position corresponding to the obtained distance Lop.
- the relay device 101 when the relay device 101 determines the position of a short circuit in the transmission line 51, in step S32 shown in FIG. 19, it compares the average value ⁇ 1 with multiple threshold values TB and obtains the distance Lsh corresponding to the threshold value TB that is closest to the average value ⁇ 1 from the short circuit position information. Then, the relay device 101 determines that the transmission line 51 is short-circuited or degraded at the position corresponding to the obtained distance Lsh.
- the relay device 101 is connected one-to-one to the communication device 111 via the transmission line 51, but this is not limited to the configuration.
- the relay device 101 may be connected one-to-multiple to a plurality of communication devices 111 via a bus-type transmission line 51.
- the relay device 101 is configured to perform the determination process, but this is not limited to the above.
- the determination process may be performed by a device other than the relay device 101 in the communication system 301.
- the communication device 111 may function as a determination device and perform the determination process.
- the signal output unit 21 is configured to output a measurement signal to the transmission line 51 during a period when relay processing is not being performed by the relay unit 10, but this is not limited to the above.
- the signal output unit 21 may be configured to output a measurement signal to the transmission line 51 during a period when relay processing is being performed by the relay unit 10.
- the relay device 101 frequency-division multiplexes the communication signal and the measurement signal. More specifically, the signal output unit 21 generates a measurement signal in a frequency band different from the frequency band of the communication signal transmitted and received by the relay unit 10, and outputs the measurement signal to the transmission line 51.
- the signal receiving unit 22 is configured to receive a response signal including a measurement signal output by the signal output unit 21 and a reflected signal that is a signal obtained by reflecting the measurement signal from the transmission line 51 via the corresponding communication port 30, but this is not limited to the above.
- the signal receiving unit 22 may be configured to receive a response signal that does not include a measurement signal.
- the signal receiving unit 22 may be configured to receive a reflected signal as a response signal.
- the signal output unit 21 outputs a measurement signal to the transmission line 51 via a directional coupler and the communication port 30.
- the signal receiving unit 22 receives a response signal that does not include a measurement signal from the transmission line 51 via the communication port 30 and the directional coupler.
- the processing unit 23 is configured to determine the type of abnormality that has occurred in the transmission line 51, but this is not limited to the above.
- the processing unit 23 may be configured to determine that an abnormality has occurred in the transmission line 51 when the average value ⁇ 1 is less than the threshold value T1a or greater than the threshold value T1b in the above-mentioned determination example 1, but not to determine the type of abnormality.
- the processing unit 23 may be configured to determine that an abnormality has occurred in the transmission line 51 when the average value ⁇ 2 is less than the threshold value T2a or greater than the threshold value T2b in the above-mentioned determination example 2, but not to determine the type of abnormality.
- the processing unit 23 is configured to determine the types of abnormality that have occurred in the transmission line 51, such as a break in the transmission line 51, a short circuit in the transmission line 51, and deterioration of the transmission line 51, but this is not limited to this.
- the processing unit 23 may be configured to determine a special abnormality in the transmission line 51, without determining whether the transmission line 51 is broken, a short circuit in the transmission line 51, or deterioration of the transmission line 51.
- the processing unit 23 is configured to calculate the phase difference ⁇ and the amplitude ratio A as the evaluation value EV, and to perform the judgment process based on the frequency distributions F1 and F2, but this is not limited to the above.
- the processing unit 23 may be configured to calculate the impedance of the transmission line 51, the reactance of the transmission line 51, or the resistance of the transmission line 51 as the evaluation value EV, instead of the phase difference ⁇ and the amplitude ratio A, and to perform the judgment process based on the distribution of the calculated evaluation value EV.
- the processing unit 23 is configured to calculate the evaluation value EV, but this is not limited to the above.
- the processing unit 23 may be configured to obtain the amplitude of the reflected signal from the digital signal Ds3 as the evaluation value EV, and perform a determination process based on the distribution of the obtained amplitude.
- the processing unit 23 may be configured to obtain the phase of the reflected signal from the digital signal Ds3 as the evaluation value EV, and perform a determination process based on the distribution of the obtained phase.
- the processing unit 23 is configured to generate a digital signal Ds3 indicating a reflected signal by subtracting the digital signal Ds1 from the digital signal Ds2, but this is not limited to the above.
- the signal receiving unit 22 may be configured to receive a measurement signal from the signal output unit 21, generate an analog signal indicating the reflected signal by subtracting the measurement signal from the received response signal, and digitally convert the generated analog signal to generate a digital signal Ds3 and output it to the processing unit 23.
- Each process (each function) in the above-mentioned embodiments is realized by a processing circuit (circuitry) including one or more processors.
- the above-mentioned processing circuit may be composed of an integrated circuit or the like that combines one or more memories, various analog circuits, and various digital circuits in addition to the above-mentioned one or more processors.
- the above-mentioned one or more memories store programs (instructions) that cause the above-mentioned one or more processors to execute each of the above-mentioned processes.
- the above-mentioned one or more processors may execute each of the above-mentioned processes according to the program read from the above-mentioned one or more memories, or may execute each of the above-mentioned processes according to a logic circuit designed in advance to execute each of the above-mentioned processes.
- the processor may be any of various processors suitable for computer control, such as a CPU (Central Processing Unit), a GPU (Graphics Processing Unit), a DSP (Digital Signal Processor), an FPGA (Field Programmable Gate Array), and an ASIC (Application Specific Integrated Circuit).
- the physically separated processors may cooperate with each other to execute the above processes.
- the processors mounted on each of the physically separated computers may cooperate with each other via a network such as a LAN (Local Area Network), a WAN (Wide Area Network), or the Internet to execute the above processes.
- the above program may be installed into the memory from an external server device or the like via the network, or may be distributed in a state stored on a recording medium such as a CD-ROM (Compact Disc Read Only Memory), DVD-ROM (Digital Versatile Disc Read Only Memory), or semiconductor memory, and may be installed into the memory from the recording medium.
- a processing circuit includes: A measurement signal having a frequency component is output to a transmission line; receiving a response signal from the transmission line, the response signal including a reflected signal of the measurement signal; Obtaining a plurality of evaluation values based on at least one of the amplitude and the phase of the received response signal; A determination device that determines an abnormality in the transmission line based on the obtained distribution of the evaluation values.
- Relay unit Determination processing unit 21 Signal output unit 22 Signal receiving unit 23 Processing unit (acquisition unit, determination unit) 24 Memory unit 30 Communication port 51 Transmission line 101 Relay device 111 Communication device 301 Communication system F1, F1a, F1b, F1c, F1d, F1e, F1f, F2, F2a, F2b, F2c, F2d, F2e, F2f Frequency distribution
Landscapes
- Physics & Mathematics (AREA)
- General Physics & Mathematics (AREA)
- Engineering & Computer Science (AREA)
- Computer Networks & Wireless Communication (AREA)
- Signal Processing (AREA)
- Testing Of Short-Circuits, Discontinuities, Leakage, Or Incorrect Line Connections (AREA)
- Locating Faults (AREA)
- Monitoring And Testing Of Transmission In General (AREA)
Abstract
Description
判定
特許文献1に記載の技術を超えて、伝送線の異常をより正確に判定することが可能な技術が望まれる。
本開示によれば、伝送線の異常をより正確に判定することができる。
図1は、本開示の実施の形態に係る通信システムの構成を示す図である。図1を参照して、通信システム301は、中継装置101と、複数の通信装置111とを備える。
図2は、本開示の実施の形態に係る中継装置の構成を示す図である。図2を参照して、中継装置101は、中継部10と、複数の判定処理部20と、複数の通信ポート30とを備える。判定処理部20は、信号出力部21と、信号受信部22と、処理部23と、記憶部24とを含む。処理部23は、取得部の一例であり、かつ判定部の一例である。中継部10、信号出力部21、信号受信部22および処理部23の一部または全部は、たとえば、1または複数のプロセッサを含む処理回路(Circuitry)により実現される。記憶部24は、たとえば上記処理回路に含まれる不揮発性メモリである。通信ポート30は、たとえばコネクタまたは端子である。各通信ポート30には、伝送線51のコネクタ部が接続される。
中継部10は、通信装置111間のフレームを中継する中継処理を行う。より詳細には、中継部10は、ある通信装置111から対応の伝送線51および対応の通信ポート30経由で受信したフレームを、当該フレームの宛先IPアドレス、MACアドレスおよびメッセージID等の宛先情報に従って他の通信装置111へ、対応の通信ポート30および対応の伝送線51経由で送信する。すなわち、中継部10は、通信ポート30および伝送線51を介して、フレームを含む通信信号を通信装置111との間で送受信する。
たとえば、中継装置101は、通信ポート30の数と同数の判定処理部20を備える。より詳細には、判定処理部20は、通信ポート30に対応して設けられ、対応の通信ポート30に接続された伝送線51の異常を判定する判定処理を行う。以下、中継装置101における1つの判定処理部20による判定処理について代表して説明する。
信号出力部21は、周波数成分を有する計測信号を伝送線51へ出力する。より詳細には、信号出力部21は、交流信号、パルス信号または周波数掃引信号を計測信号として伝送線51へ出力する。
信号受信部22は、計測信号が反射された信号を含む応答信号を伝送線51から受信する。すなわち、信号受信部22は、信号出力部21により出力された計測信号と、当該計測信号が反射された信号である反射信号とを含む応答信号を、伝送線51から対応の通信ポート30経由で受信する。
処理部23は、信号受信部22により受信された応答信号の、振幅および位相に基づく評価値EVを算出する。処理部23は、算出した評価値EVの分布に基づいて、判定処理を行う。

処理部23は、評価値EVとして、位相差θを算出する。より詳細には、処理部23は、計測信号を示すデジタル信号Ds1と、反射信号を示すデジタル信号Ds3とに基づいて、たとえば計測信号の1周期ごとの位相差θを算出し、算出した位相差θを記憶部24に保存する。位相差θは、ゼロ°以上であり、かつ360°以下の値である。位相差θは、第2評価値の一例である。




処理部23は、度数分布F1の形状の経時変化に基づいて、伝送線51の異常を判定する。たとえば、処理部23は、度数分布F1の形状と、基準分布Fr1の形状との相関に基づいて、伝送線51の異常を判定する。

処理部23は、評価値EVとして、振幅比Aを算出する。より詳細には、処理部23は、計測信号を示すデジタル信号Ds1と、反射信号を示すデジタル信号Ds3とに基づいて、たとえば計測信号の1周期ごとの振幅比Aを算出し、算出した振幅比Aを記憶部24に保存する。振幅比Aは、ゼロ以上であり、かつ1以下の値である。振幅比Aは、第1評価値の一例である。
処理部23は、度数分布F2の形状の経時変化に基づいて、伝送線51の異常を判定する。たとえば、処理部23は、度数分布F2の形状と、基準分布Fr2の形状との相関に基づいて、伝送線51の異常を判定する。

処理部23は、度数分布F1,F2に基づいて、伝送線51において発生した異常の種類を判定する。
図17は、本開示の実施の形態に係る中継装置における処理部により生成される度数分布F1の他の例を示す図である。図17において、横軸は位相差θ[rad]であり、縦軸は度数である。
図18は、本開示の実施の形態に係る中継装置が判定処理を行う際の動作手順の一例を定めたフローチャートである。
[付記1]
周波数成分を有する計測信号を伝送線へ出力する信号出力部と、
前記計測信号が反射された信号を含む応答信号を前記伝送線から受信する信号受信部と、
前記信号受信部により受信された前記応答信号の、振幅および位相の少なくともいずれかに基づく評価値を複数取得する取得部と、
前記取得部により取得された前記評価値の分布に基づいて、前記伝送線の異常を判定する判定部とを備え、
前記判定部は、前記分布の経時変化に基づいて、前記伝送線の劣化の進行度合いを判定する、判定装置。
処理回路を備え、
前記処理回路は、
周波数成分を有する計測信号を伝送線へ出力し、
前記計測信号が反射された信号を含む応答信号を前記伝送線から受信し、
受信した前記応答信号の、振幅および位相の少なくともいずれかに基づく評価値を複数取得し、
取得した前記評価値の分布に基づいて、前記伝送線の異常を判定する、判定装置。
20 判定処理部
21 信号出力部
22 信号受信部
23 処理部(取得部、判定部)
24 記憶部
30 通信ポート
51 伝送線
101 中継装置
111 通信装置
301 通信システム
F1,F1a,F1b,F1c,F1d,F1e,F1f,F2,F2a,F2b,F2c,F2d,F2e,F2f 度数分布
Claims (9)
- 周波数成分を有する計測信号を伝送線へ出力する信号出力部と、
前記計測信号が反射された信号を含む応答信号を前記伝送線から受信する信号受信部と、
前記信号受信部により受信された前記応答信号の、振幅および位相の少なくともいずれかに基づく評価値を複数取得する取得部と、
前記取得部により取得された前記評価値の分布に基づいて、前記伝送線の異常を判定する判定部とを備える、判定装置。 - 前記判定部は、前記分布が示す統計量の経時変化に基づいて、前記伝送線の異常を判定する、請求項1に記載の判定装置。
- 前記判定部は、前記分布と、所定の分布との相関に基づいて、前記伝送線の異常を判定する、請求項1または請求項2に記載の判定装置。
- 前記判定部は、前記分布に基づいて、前記伝送線において発生した異常の種類をさらに判定する、請求項1から請求項3のいずれか1項に記載の判定装置。
- 前記判定部は、前記伝送線において発生した異常の種類として、前記伝送線の断線、前記伝送線の短絡、および前記伝送線の劣化のうちの少なくともいずれか1つを判定する、請求項4に記載の判定装置。
- 前記取得部は、前記振幅に基づく前記評価値である第1評価値と、前記位相に基づく前記評価値である第2評価値とを取得し、
前記判定部は、前記第1評価値の分布および前記第2評価値の分布に基づいて、前記伝送線の異常を判定する、請求項1から請求項5のいずれか1項に記載の判定装置。 - 前記判定部は、前記第1評価値の分布および前記第2評価値の分布に基づいて、前記伝送線において発生した異常の種類として、前記伝送線の断線、前記伝送線の短絡、および前記伝送線の劣化を判定する、請求項6に記載の判定装置。
- 前記判定部は、前記第2評価値の分布に基づいて、前記伝送線において発生した異常の位置を判定する、請求項6または請求項7に記載の判定装置。
- 周波数成分を有する計測信号を伝送線へ出力するステップと、
前記計測信号が反射された信号を含む応答信号を前記伝送線から受信するステップと、 受信した前記応答信号の、振幅および位相の少なくともいずれかに基づく評価値を複数取得するステップと、
取得した前記評価値の分布に基づいて、前記伝送線の異常を判定するステップとを含む、判定方法。
Priority Applications (3)
| Application Number | Priority Date | Filing Date | Title |
|---|---|---|---|
| DE112024000957.3T DE112024000957T5 (de) | 2023-02-22 | 2024-01-12 | Bestimmungsvorrichtung und bestimmungsverfahren |
| CN202480007470.2A CN120513400A (zh) | 2023-02-22 | 2024-01-12 | 判定装置及判定方法 |
| JP2025502156A JPWO2024176642A1 (ja) | 2023-02-22 | 2024-01-12 |
Applications Claiming Priority (2)
| Application Number | Priority Date | Filing Date | Title |
|---|---|---|---|
| JP2023025672 | 2023-02-22 | ||
| JP2023-025672 | 2023-02-22 |
Publications (1)
| Publication Number | Publication Date |
|---|---|
| WO2024176642A1 true WO2024176642A1 (ja) | 2024-08-29 |
Family
ID=92500901
Family Applications (1)
| Application Number | Title | Priority Date | Filing Date |
|---|---|---|---|
| PCT/JP2024/000518 Ceased WO2024176642A1 (ja) | 2023-02-22 | 2024-01-12 | 判定装置および判定方法 |
Country Status (4)
| Country | Link |
|---|---|
| JP (1) | JPWO2024176642A1 (ja) |
| CN (1) | CN120513400A (ja) |
| DE (1) | DE112024000957T5 (ja) |
| WO (1) | WO2024176642A1 (ja) |
Citations (3)
| Publication number | Priority date | Publication date | Assignee | Title |
|---|---|---|---|---|
| JP2008089528A (ja) * | 2006-10-05 | 2008-04-17 | Toshiba Corp | 埋め殺しケーブル判定装置及び方法 |
| US20190107573A1 (en) * | 2016-04-08 | 2019-04-11 | Commissariat A L'energie Atomique Et Aux Energies Alternatives | Method for detecting soft faults in a cable by data fusion |
| WO2022255077A1 (ja) * | 2021-06-02 | 2022-12-08 | 住友電気工業株式会社 | 検知装置および検知方法 |
-
2024
- 2024-01-12 JP JP2025502156A patent/JPWO2024176642A1/ja active Pending
- 2024-01-12 WO PCT/JP2024/000518 patent/WO2024176642A1/ja not_active Ceased
- 2024-01-12 CN CN202480007470.2A patent/CN120513400A/zh active Pending
- 2024-01-12 DE DE112024000957.3T patent/DE112024000957T5/de active Pending
Patent Citations (3)
| Publication number | Priority date | Publication date | Assignee | Title |
|---|---|---|---|---|
| JP2008089528A (ja) * | 2006-10-05 | 2008-04-17 | Toshiba Corp | 埋め殺しケーブル判定装置及び方法 |
| US20190107573A1 (en) * | 2016-04-08 | 2019-04-11 | Commissariat A L'energie Atomique Et Aux Energies Alternatives | Method for detecting soft faults in a cable by data fusion |
| WO2022255077A1 (ja) * | 2021-06-02 | 2022-12-08 | 住友電気工業株式会社 | 検知装置および検知方法 |
Also Published As
| Publication number | Publication date |
|---|---|
| JPWO2024176642A1 (ja) | 2024-08-29 |
| CN120513400A (zh) | 2025-08-19 |
| DE112024000957T5 (de) | 2025-12-04 |
Similar Documents
| Publication | Publication Date | Title |
|---|---|---|
| EP2409242B1 (en) | Network status detection | |
| CN113381804B (zh) | 一种同缆概率检测的方法以及装置 | |
| US10051060B2 (en) | Sensor data segmentation and virtualization | |
| US20220247651A1 (en) | System and method for network and computation performance probing for edge computing | |
| US12562953B2 (en) | In-vehicle device, management device, deterioration determination method, change factor discrimination method, abnormality factor discrimination method, and storage medium for network path deterioration detection in vehicles | |
| US11274939B2 (en) | Sensor data segmentation and virtualization | |
| JP5672729B2 (ja) | 光伝送装置、レーザーモジュール、レーザーモジュールの故障検出方法及びレーザーモジュールの故障検出プログラム | |
| US11218501B2 (en) | Detector, detection method, and detection program | |
| CN113746199B (zh) | 用于对数据中心中的电气系统进行监测的系统和方法 | |
| US8274889B2 (en) | Method, system and computer program product involving congestion detection in ethernet | |
| WO2024176642A1 (ja) | 判定装置および判定方法 | |
| JP7416338B2 (ja) | 検知装置および検知方法 | |
| WO2017110675A1 (ja) | 受信装置、送信装置及び可用帯域推定方法 | |
| CN102183946B (zh) | 诊断通信连接的方法、电子部件和系统 | |
| US12425071B2 (en) | Method, circuit arrangement, and system for identifying impedance changes in a signal line | |
| WO2023145354A1 (ja) | 検知装置、検知システム、伝送線および検知方法 | |
| KR101641823B1 (ko) | 차량용 네트워크의 고장노드 탐지장치 및 이를 이용한 탐지방법 | |
| EP1368934A1 (en) | System, method and measuring node for determining a worst case gap-count value in a multi-station network | |
| US20210119819A1 (en) | In-vehicle communication system, in-vehicle relay device, communication program, and communication method | |
| US12238011B2 (en) | Computer-implemented method for adapting at least one pre-defined frame delay | |
| JP7528731B2 (ja) | 車載装置、管理装置、異常判定方法および異常判定プログラム | |
| JP7735791B2 (ja) | 検知装置、検知方法および検知プログラム | |
| WO2011132758A1 (ja) | 速度推定方法、速度推定装置、速度推定システム及び速度推定装置の制御プログラムの記録媒体 | |
| US12615197B2 (en) | Analysis device, analysis method, and analysis program | |
| CN112448943B (zh) | 用于在信号指纹系统中对网络模型进行分析和适配的方法 |
Legal Events
| Date | Code | Title | Description |
|---|---|---|---|
| 121 | Ep: the epo has been informed by wipo that ep was designated in this application |
Ref document number: 24759950 Country of ref document: EP Kind code of ref document: A1 |
|
| WWE | Wipo information: entry into national phase |
Ref document number: 2025502156 Country of ref document: JP |
|
| WWE | Wipo information: entry into national phase |
Ref document number: 202480007470.2 Country of ref document: CN |
|
| WWP | Wipo information: published in national office |
Ref document number: 202480007470.2 Country of ref document: CN |
|
| WWE | Wipo information: entry into national phase |
Ref document number: 112024000957 Country of ref document: DE |
|
| WWP | Wipo information: published in national office |
Ref document number: 112024000957 Country of ref document: DE |
|
| 122 | Ep: pct application non-entry in european phase |
Ref document number: 24759950 Country of ref document: EP Kind code of ref document: A1 |