WO2024166301A1 - Dispositif de mesure, système de stockage d'énergie et procédé de mesure - Google Patents
Dispositif de mesure, système de stockage d'énergie et procédé de mesure Download PDFInfo
- Publication number
- WO2024166301A1 WO2024166301A1 PCT/JP2023/004389 JP2023004389W WO2024166301A1 WO 2024166301 A1 WO2024166301 A1 WO 2024166301A1 JP 2023004389 W JP2023004389 W JP 2023004389W WO 2024166301 A1 WO2024166301 A1 WO 2024166301A1
- Authority
- WO
- WIPO (PCT)
- Prior art keywords
- storage battery
- current
- impedance
- voltage
- pulse signal
- Prior art date
- Legal status (The legal status is an assumption and is not a legal conclusion. Google has not performed a legal analysis and makes no representation as to the accuracy of the status listed.)
- Ceased
Links
Images


Classifications
-
- G—PHYSICS
- G01—MEASURING; TESTING
- G01R—MEASURING ELECTRIC VARIABLES; MEASURING MAGNETIC VARIABLES
- G01R31/00—Arrangements for testing electric properties; Arrangements for locating electric faults; Arrangements for electrical testing characterised by what is being tested not provided for elsewhere
- G01R31/36—Arrangements for testing, measuring or monitoring the electrical condition of accumulators or electric batteries, e.g. capacity or state of charge [SoC]
- G01R31/389—Measuring internal impedance, internal conductance or related variables
-
- G—PHYSICS
- G01—MEASURING; TESTING
- G01R—MEASURING ELECTRIC VARIABLES; MEASURING MAGNETIC VARIABLES
- G01R23/00—Arrangements for measuring frequencies; Arrangements for analysing frequency spectra
- G01R23/16—Spectrum analysis; Fourier analysis
-
- G—PHYSICS
- G01—MEASURING; TESTING
- G01R—MEASURING ELECTRIC VARIABLES; MEASURING MAGNETIC VARIABLES
- G01R27/00—Arrangements for measuring resistance, reactance, impedance, or electric characteristics derived therefrom
- G01R27/02—Measuring real or complex resistance, reactance, impedance, or other two-pole characteristics derived therefrom, e.g. time constant
- G01R27/08—Measuring resistance by measuring both voltage and current
-
- G—PHYSICS
- G01—MEASURING; TESTING
- G01R—MEASURING ELECTRIC VARIABLES; MEASURING MAGNETIC VARIABLES
- G01R31/00—Arrangements for testing electric properties; Arrangements for locating electric faults; Arrangements for electrical testing characterised by what is being tested not provided for elsewhere
- G01R31/36—Arrangements for testing, measuring or monitoring the electrical condition of accumulators or electric batteries, e.g. capacity or state of charge [SoC]
- G01R31/367—Software therefor, e.g. for battery testing using modelling or look-up tables
-
- G—PHYSICS
- G01—MEASURING; TESTING
- G01R—MEASURING ELECTRIC VARIABLES; MEASURING MAGNETIC VARIABLES
- G01R31/00—Arrangements for testing electric properties; Arrangements for locating electric faults; Arrangements for electrical testing characterised by what is being tested not provided for elsewhere
- G01R31/36—Arrangements for testing, measuring or monitoring the electrical condition of accumulators or electric batteries, e.g. capacity or state of charge [SoC]
- G01R31/382—Arrangements for monitoring battery or accumulator variables, e.g. SoC
- G01R31/3842—Arrangements for monitoring battery or accumulator variables, e.g. SoC combining voltage and current measurements
-
- G—PHYSICS
- G01—MEASURING; TESTING
- G01R—MEASURING ELECTRIC VARIABLES; MEASURING MAGNETIC VARIABLES
- G01R31/00—Arrangements for testing electric properties; Arrangements for locating electric faults; Arrangements for electrical testing characterised by what is being tested not provided for elsewhere
- G01R31/36—Arrangements for testing, measuring or monitoring the electrical condition of accumulators or electric batteries, e.g. capacity or state of charge [SoC]
- G01R31/392—Determining battery ageing or deterioration, e.g. state of health
Definitions
- Embodiments of the present invention relate to a measuring device, a power storage system, and a measuring method.
- the frequency characteristics of the impedance of the battery are measured.
- a current waveform whose current value changes periodically is input to the battery at each of multiple frequencies, and the time change in the voltage of the battery is measured while the current waveform is input to the battery.
- the impedance of the battery at each of multiple frequencies is measured, and the frequency characteristics of the impedance of the battery are measured.
- the problem that the present invention aims to solve is to provide a measurement device, a power storage system, and a measurement method that enable the impedance of a storage battery to be measured with a simple configuration and improves the convenience of charging the storage battery and measuring its impedance.
- the measurement device includes a processing circuit that inputs a pseudo-random pulse signal of current, which changes between a first current value greater than zero and a second current value greater than the first current value, to the storage battery.
- the processing circuit measures the impedance of the storage battery based on the pseudo-random pulse signal of current input to the storage battery and the change over time in the voltage of the storage battery while the pseudo-random pulse signal of current is input to the storage battery.
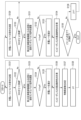
- FIG. 1 is a schematic diagram illustrating an example of a power storage system according to a first embodiment.
- FIG. 2 is a schematic diagram showing an example of the change over time of the charging current output from the power supply circuit, the pseudo-random pulse signal of the current input to the storage battery, and the bypass current diverted from the charging current in the first embodiment.
- FIG. 3 is a schematic diagram showing an example of an analog signal indicating the time change in the voltage (terminal voltage) of a storage battery when a pseudo-random pulse signal of current is input to the storage battery in the first embodiment, and an example of an analog signal for the voltage after the analog signal indicating the time change in the voltage is processed by a band-pass filter.
- FIG. 4 is a schematic diagram showing an example of a process for measuring frequency characteristics of impedance of a storage battery, which is performed by the data processing unit of the process execution unit in the first embodiment.
- FIG. 5 is a schematic diagram showing an example of impedance spectrum data regarding the frequency characteristics of the impedance of the storage battery measured in the first embodiment, in the form of a complex impedance plot.
- FIG. 6 is a schematic diagram showing an example of a relationship between frequency and the absolute value of the impedance of the storage battery, which is indicated by impedance spectrum data regarding the frequency characteristics of the impedance of the storage battery measured in the first embodiment.
- FIG. 5 is a schematic diagram showing an example of impedance spectrum data regarding the frequency characteristics of the impedance of the storage battery measured in the first embodiment, in the form of a complex impedance plot.
- FIG. 6 is a schematic diagram showing an example of a relationship between frequency and the absolute value of the impedance of the storage battery, which is indicated by impedance spectrum data regarding the frequency characteristics
- FIG. 7 is a schematic diagram showing an example of the relationship of the phase of the impedance of the storage battery with respect to the frequency, which is indicated by impedance spectrum data regarding the frequency characteristics of the impedance of the storage battery measured in the first embodiment.
- FIG. 8 is a schematic diagram illustrating an example of averaging processing performed by the data processing unit 26 on impedance spectrum data, which is measurement data of the frequency characteristics of the impedance of the storage battery, in the first embodiment.
- FIG. 9 is a schematic diagram showing another example of the process of measuring the frequency characteristic of the impedance of the storage battery, which is performed by the data processing unit of the process execution unit in the first embodiment, different from that shown in FIG. FIG.
- FIG. 10 is a schematic diagram illustrating an example of resampling of voltage time-series data (first voltage time-series data) performed by the data processing unit in the first embodiment.
- FIG. 11 is a schematic diagram illustrating an example of a data selection process performed on two pieces of averaged data by the data processing unit in the first embodiment.
- FIG. 12 is a flowchart illustrating an example of a process performed by the process execution unit in determining the state of the storage battery in the first embodiment.
- FIG. 13 is a schematic diagram illustrating an example of a power storage system according to a first modified example.
- FIG. 14 is a schematic diagram illustrating an example of a power storage system according to a second modified example.
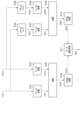
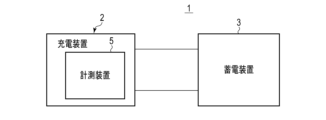
- FIG. 1 shows an example of a power storage system 1 according to the first embodiment.
- the power storage system 1 includes a charging device 2 such as a charger, a power storage device 3, and a measuring device 5, and the power storage device 3 includes a storage battery 6.
- the charging device 2, the power storage device 3, and the measuring device 5 are provided separately from each other.
- the power storage device 3 is mounted on, for example, a battery-mounted device (not shown). Examples of battery-mounted devices on which the power storage device 3 is mounted include factory transport vehicles such as AGVs (Automatic Guided Vehicles), stationary power supply devices, smartphones, vehicles such as electric cars, robots, drones, and the like.
- AGVs Automatic Guided Vehicles
- the storage battery 6 mounted on the power storage device 3 is, for example, a secondary battery such as a lithium-ion secondary battery.
- the storage battery 6 may be formed from a single cell (single battery), or may be a battery module or cell block formed by electrically connecting a plurality of single cells.
- the plurality of single cells may be electrically connected in series in the storage battery 6, or may be electrically connected in parallel in the storage battery 6.
- the storage battery 6 may be formed in both a series connection structure in which a plurality of single cells are connected in series, and a parallel connection structure in which a plurality of single cells are connected in parallel.
- the storage battery 6 may be either a battery string or a battery array in which a plurality of battery modules are electrically connected.
- the charging device 2 supplies power to the storage battery 6 when charging the storage battery 6.
- the charging device 2 includes a power supply circuit 11, a control unit 12 such as a control circuit, and a memory unit 13.
- a charging current Ic is output from the power supply circuit 11 to the storage battery 6.
- the supply path of the charging current Ic from the power supply circuit 11 to the storage battery 6 is formed through the measuring device 5.
- the charging device 2 includes a processor or integrated circuit, etc., and a storage medium such as a memory.
- the processor or integrated circuit, etc. includes any of a CPU (Central Processing Unit), an ASIC (Application Specific Integrated Circuit), a microcomputer, an FPGA (Field Programmable Gate Array), and a DSP (Digital Signal Processor).
- the charging device 2 may be provided with only one processor, etc., or may be provided with multiple processors. Also, the charging device 2 may be provided with only one storage medium, or may be provided with multiple storage mediums.
- the processor or integrated circuit, etc. performs processing by, for example, executing a program stored in the storage medium. Also, in the charging device 2, the processing of the control unit 12 is performed by the processor, etc., and the storage medium functions as the storage unit 13.
- control unit 12 controls the operation of the power supply circuit 11 to control the supply of power to the storage battery 6.
- the control unit 12 also controls the operation of the power supply circuit 11 to adjust the charging rate of the charging current Ic output from the power supply circuit 11 to the storage battery 6, etc.
- the measuring device 5 includes a current detection circuit 15 and a voltage detection circuit 16.
- the current detection circuit 15 detects an input current Ii to the storage battery 6, which is a current flowing through the storage battery 6, and the voltage detection circuit 16 detects a voltage Vd applied to the storage battery 6.
- the current detection circuit 15 includes, for example, a shunt resistor, and detects the current (input current Ii) of the storage battery 6 based on the voltage applied to the shunt resistor.
- the voltage detection circuit 16 detects, for example, the voltage between the terminals of the storage battery 6 as the voltage Vd of the storage battery 6.
- the current detection circuit 15 and the voltage detection circuit 16 may be provided in the power storage device 3.
- the measuring device 5 measures the impedance Z of the storage battery 6.
- the measuring device 5 measures the impedance Z of the storage battery 6 when the storage battery 6 is being charged by the charging current Ic output from the power supply circuit 11 to the storage battery 6.
- the measuring device 5 includes a processing execution unit 21 such as a processing circuit, and a memory unit 22, and the processing execution unit 21 includes an input current adjustment unit 25 and a data processing unit 26.
- the input current adjustment unit 25 and the data processing unit 26 each execute a part of the processing performed by the processing execution unit 21.
- the measurement device 5 includes a processor or integrated circuit, etc., and a storage medium such as a memory.
- the processor or integrated circuit, etc. includes any of a CPU, ASIC, microcomputer, FPGA, and DSP.
- the measurement device 5 may be provided with only one processor, etc., or may be provided with multiple processors. Also, the measurement device 5 may be provided with only one storage medium, or may be provided with multiple storage media.
- the processor or integrated circuit, etc. performs processing by, for example, executing a program stored in the storage medium.
- the processing of the processing execution unit 21 is performed by the processor, etc., and the storage medium functions as the storage unit 22.
- the measuring device 5 also includes a drive circuit 31, and in the example shown in FIG. 1, the drive circuit 31 includes a switch 32 and a resistor 34.
- the drive circuit 31 is formed in a supply path of the charging current Ic from the power supply circuit 11 of the charging device 2 to the storage battery 6 of the power storage device 3.
- the input current adjustment unit 25 of the processing execution unit 21 controls the drive of the drive circuit 31 when the charging current Ic is being output from the power supply circuit 11 to the storage battery 6, and controls, for example, the on/off of the switch 32. This adjusts and controls the input current Ii input to the storage battery 6.
- the input current adjustment unit 25 controls the shunting of the charging current Ic in the drive circuit 31 by controlling the switching operation of the switch 32, i.e., by controlling the on/off of the switch 32.
- the input current adjustment unit 25 controls the shunting of the charging current Ic in the drive circuit 31 to generate a pseudo-random pulse signal of current, and inputs the generated pseudo-random pulse signal of current to the storage battery 6 as the input current Ii to the storage battery 6. Therefore, in this embodiment, the processing execution unit 21 such as a processing circuit shunts the charging current Ic output from the power supply circuit 11 to the storage battery 6 in measuring the impedance Z of the storage battery 6, thereby generating a pseudo-random pulse signal of current as the input current Ii to the storage battery 6.
- the pseudo-random pulse signal uses, for example, an M-series signal.
- FIG. 2 shows an example of the change over time of the charging current Ic output from the power supply circuit 11, the pseudo-random pulse signal of the current which is the input current Ii input to the storage battery 6, and the bypass current Ib diverted from the charging current Ic.
- the horizontal axis shows time t
- the vertical axis shows the current I.
- the charging current Ic is kept constant or approximately constant over time at a current value I ⁇ . Then, when the switch 32 of the drive circuit 31 is in the off state, the charging current Ic is not diverted, the pseudo-random pulse signal (input current Ii) has a current value I ⁇ , and the bypass current Ib has a current value of 0.
- the switch 32 of the drive circuit 31 when the switch 32 of the drive circuit 31 is in the on state, a current equivalent to the current value I ⁇ is diverted from the charging current Ic as the bypass current Ib, and the pseudo-random pulse signal (input current Ii) has a current value I ⁇ -I ⁇ .
- the current value I ⁇ is less than half the current value I ⁇ , for example, about 10% of the current value I ⁇ .
- the charging current Ic, the pseudo-random pulse signal (input current Ii), and the bypass current Ib each change over time, so in the example of FIG. 2, the bypass current Ib changes over time between zero and a current value I ⁇ .
- the pseudo-random pulse signal changes over time between a current value (first current value) I ⁇ -I ⁇ that is greater than zero and a current value (second current value) I ⁇ that is greater than the current value I ⁇ -I ⁇ .
- the pseudorandom pulse signal includes a plurality of pulses p, and the current value of each of the plurality of pulses p is lower than the current value I ⁇ .
- a pulse width w is specified for each of the plurality of pulses p, and at least one of the plurality of pulses p has a pulse width w different from the other pulses p.
- a pulse pmin having the smallest pulse width w among the pulses p of the pseudorandom pulse signal is specified, and a pulse width wmin of the pulse pmin is specified.
- the pulse width w of each of the plurality of pulses p is an integer multiple of the pulse width wmin of the pulse pmin.
- a signal length Y is specified for the pseudorandom pulse signal.
- the signal length Y of the pseudorandom pulse signal corresponds to the time from the start to the end of the switching operation of the switch 32.
- the measurement device 5 also includes an A/D converter 33 and a band pass filter (BPF) 35.
- the A/D converter 33 receives analog signals indicating the detection results of the current detection circuit 15 and the voltage detection circuit 16.
- the A/D converter 33 converts the analog signal indicating the detection result in the current detection circuit 15, i.e., the analog signal indicating the detection result of the input current Ii input to the storage battery 6, into a digital signal.
- the A/D converter 33 also converts the analog signal indicating the detection result in the voltage detection circuit 16, i.e., the analog signal indicating the change over time in the voltage (terminal voltage) Vd of the storage battery 6, into a digital signal.
- the A/D converter 33 performs sampling at a predetermined sampling period and converts the analog signal into a digital signal.
- the analog signal indicating the detection result of the voltage detection circuit 16 is directly input to the A/D converter 33 as described above, and the analog signal indicating the detection result of the voltage detection circuit 16 is also input through the bandpass filter 35.
- the bandpass filter 35 extracts only voltage components in a specific frequency range from the analog signal indicating the time change of the voltage (terminal voltage) Vd of the storage battery 6, and removes voltage components outside the specific frequency range.
- the specific frequency range does not include 0 Hz, and in one example, the specific frequency range is a frequency range of 0.1 Hz or more and 5000 Hz or less. Therefore, the bandpass filter 35 removes the voltage component of 0 Hz, that is, the voltage component caused by direct current, from the analog signal indicating the detection result of the voltage detection circuit 16.
- Figure 3 shows an example of an analog signal indicating the time change in voltage (terminal voltage) Vd of the storage battery 6 when a pseudo-random pulse signal of current is input to the storage battery 6 as the input current Ii, and an analog signal for voltage Vm after the analog signal indicating the time change in voltage Vd is processed by band-pass filter 35.
- the horizontal axis indicates time t
- the vertical axis indicates voltage V.
- the voltage Vd fluctuates around a voltage value V ⁇ and has a voltage offset corresponding to the voltage value V ⁇ with respect to 0V.
- the voltage Vm fluctuates around a voltage value V ⁇ that is closer to 0V than the voltage value V ⁇ and has a voltage offset corresponding to the voltage value V ⁇ with respect to 0V. Therefore, in the analog signal showing the time change of the voltage Vm, the center of the fluctuation is closer to 0V and the voltage offset with respect to 0V is reduced compared to the analog signal showing the time change of the voltage Vd.
- the voltage offset with respect to 0V is reduced by an amount equivalent to the open circuit voltage of the storage battery 6 compared to the analog signal showing the time change of the voltage Vd.
- the center of the fluctuation of the analog signal showing the time change of the voltage Vm is a voltage value at or near 0V. Therefore, the voltage Vm becomes a voltage component equivalent to the fluctuating voltage of the voltage (terminal voltage) Vd of the storage battery 6.
- the A/D converter 33 converts the analog signal of the voltage Vm, whose voltage offset relative to 0V has been reduced by the bandpass filter 35, into a digital signal.
- the three types of digital signals converted by the A/D converter 33 are then input to the data processing unit 26 of the processing execution unit 21.
- the processing execution unit 21 receives a digital signal for the input current Ii input to the storage battery 6, a digital signal for the voltage (terminal voltage) Vd of the storage battery 6, and a digital signal for the voltage Vm with the voltage offset relative to 0V reduced. Note that when a pseudo-random pulse signal of current is input to the storage battery 6, the digital signal for the pseudo-random pulse signal is input to the processing execution unit 21 as a digital signal for the input current Ii to the storage battery 6.
- data represented by a digital signal for the pseudo-random pulse signal is current time series data (first current time series data) Ii1(t)
- data represented by a digital signal for the voltage (terminal voltage) Vd of the storage battery 6 is terminal voltage time series data Vd(t)
- data represented by a digital signal for a voltage Vm with a reduced voltage offset relative to 0 V is voltage time series data (first voltage time series data) Vm1(t).
- the current time series data Ii1(t) is data based on the pseudo-random pulse signal input to the storage battery 6 as the input current Ii, and the terminal voltage time series data Vd(t) and the voltage time series data Vm1(t) are data based on the change over time in the voltage of the storage battery 6 in a state where the pseudo-random pulse signal is input to the storage battery 6.
- the data processing unit 26 of the processing execution unit (processing circuit) 21 measures the frequency characteristics of the impedance Z of the storage battery 6 using the current time series data Ii1(t) and the voltage time series data Vm1(t). Therefore, the impedance Z of the storage battery 6 and the frequency characteristics of the impedance Z of the storage battery 6 are measured based on the pseudo-random pulse signal of the current input to the storage battery 6 and the time change in the voltage of the storage battery 6 when the pseudo-random pulse signal of the current is input to the storage battery 6.
- FIG. 4 shows an example of a process for measuring the frequency characteristics of the impedance Z of the storage battery 6, which is performed by the data processing unit 26 of the process execution unit 21.
- the data processing unit 26 performs a Fourier transform, such as a fast Fourier transform, on the current time series data Ii1(t) for the pseudo-random pulse signal that is the input current Ii to the storage battery 6 (S101). This calculates current spectrum data (first current spectrum data) Ii1(f) that indicates the frequency characteristics for the pseudo-random pulse signal that is the input current Ii to the storage battery 6.
- a Fourier transform such as a fast Fourier transform
- the data processing unit 26 also performs a Fourier transform, such as a fast Fourier transform, on the voltage time series data Vm1(t) for the voltage Vm in a state in which the pseudo-random pulse signal is input to the storage battery (S102). This calculates voltage spectrum data (first voltage spectrum data) Vm1(f) that indicates the frequency characteristics for the voltage Vm, which is a voltage component equivalent to the fluctuating voltage of the storage battery 6.
- a Fourier transform such as a fast Fourier transform
- the current components at each of the many frequencies included in the measurement frequency range to be measured are shown for the pseudo-random pulse signal that is the input current Ii.
- the voltage spectrum data Vm1(f) the voltage components at each of the many frequencies included in the measurement frequency range to be measured are shown for the voltage Vm.
- the measurement frequency ranges in the current spectrum data Ii1(f) and the voltage spectrum data Vm1(f) correspond to the measurement frequency range in which the impedance Z is measured in measuring the frequency characteristics of the impedance Z of the storage battery 6.
- the measurement frequency ranges in the current spectrum data Ii1(f) and the voltage spectrum data Vm1(f) are included within the aforementioned specific frequency range in which the voltage components are not removed by the bandpass filter 35.
- the data processing unit 26 performs a calculation using the current spectrum data Ii1(f) and the voltage spectrum data Vm1(f) (S103) to calculate impedance spectrum data (first impedance spectrum data) Za1(f) indicating the frequency characteristics of the impedance Z of the storage battery 6.
- the impedance spectrum data Za1(f) is calculated, for example, by dividing the voltage spectrum data Vm1(f) by the current spectrum data Ii1(f).
- the impedance spectrum data Za1(f) indicates impedance components at each of a large number of frequencies included in the aforementioned measurement frequency range for the impedance Z of the storage battery 6. At frequencies at which impedance components are indicated in the impedance spectrum data Za1(f), the current component is indicated in the current spectrum data Ii1(f) and the voltage component is indicated in the voltage spectrum data Vm1(f).
- impedance spectrum data indicating the frequency characteristics of the impedance Z of the storage battery 6 may be calculated in the same manner as in Patent Document 3.
- the data processing unit 26 calculates the autocorrelation function of the current spectrum data Ii1(f) and calculates the cross-correlation function between the current spectrum data Ii1(f) and the voltage spectrum data Vm1(f). Then, the data processing unit 26 calculates the impedance spectrum data for the impedance Z of the storage battery 6 using the calculated autocorrelation function and cross-correlation function.
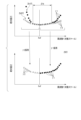
- the impedance spectrum data Za1(f), which is the measurement data measured as described above regarding the frequency characteristics of the impedance Z of the storage battery 6, can be shown in a complex impedance plot (Cole-Cole plot).
- Figure 5 shows an example of the impedance spectrum data Za1(f) regarding the frequency characteristics of the impedance Z of the storage battery 6 in the form of a complex impedance plot.
- the horizontal axis indicates the real component Zre of the impedance Z
- the vertical axis indicates the imaginary component -Zim of the impedance Z.
- the real and imaginary components of the impedance Z of the storage battery 6 are shown for each of the many frequencies included in the measurement frequency range.
- the distance from the origin is the absolute value (magnitude)
- the positive side of the real axis is set to 0, and the phase ⁇ of the impedance Z is defined. Therefore, the impedance spectrum data Za1(f) that can be shown in a complex impedance plot shows the relationship of the absolute value
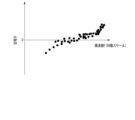
- FIG. 6 shows an example of the relationship between the absolute value
- FIG. 7 shows an example of the relationship between the phase ⁇ of the impedance Z of the storage battery 6 and frequency f, as shown in the impedance spectrum data Za1(f).
- the horizontal axis indicates the frequency f on a logarithmic scale.
- the vertical axis in FIG. 6 indicates the absolute value
- the vertical axis in FIG. 7 indicates the phase ⁇ . As shown in FIG.
- the impedance spectrum data Za1(f) indicates the absolute value
- the impedance spectrum data Za1(f) indicates the phase ⁇ of the impedance Z of the storage battery 6 for each of the many frequencies included in the measurement frequency range.
- the data processing unit 26 performs averaging processing on the impedance spectrum data Za1(f), which is measurement data of the frequency characteristics of the impedance Z of the storage battery 6 (S104). Then, averaging processing data (first averaging processing data) Zb1(f), which is impedance spectrum data obtained by averaging the impedance spectrum data Za1(f), is generated. Note that in another example, the averaging processing of S104 does not need to be performed.
- FIG. 8 illustrates an example of averaging performed by the data processing unit 26 on the impedance spectrum data Za1(f), which is measurement data of the frequency characteristics of the impedance Z of the storage battery 6.
- the averaging is explained using a graph in which the horizontal axis indicates the frequency f on a logarithmic scale and the vertical axis indicates the absolute value
- the averaging process by the data processing unit 26 calculates one data point of the post-averaging data Zb1(f) from multiple data points in the impedance spectrum data Za1(f) that are close to each other in frequency f.
- the averaged data Zb1(f) generated by the averaging process shows the impedance Z of the storage battery 6, including the absolute value
- the number of frequencies at which the impedance Z is shown in the averaged data Zb1(f) is reduced compared to the number of frequencies at which the impedance Z is shown in the impedance spectrum data Za1(f).
- the number of data points shown in the averaged data Zb1(f) is reduced compared to the number of data points shown in the impedance spectrum data Za1(f).
- the data processing unit 26 performs averaging on the impedance spectrum data Za1(f), which is the measurement data of the frequency characteristics of the impedance Z of the storage battery 6, so that the data points after the averaging process are equally spaced on the logarithmic scale of frequency f. Furthermore, in the averaging process, the higher the frequency f, the greater the number of data points of the impedance spectrum data Za1(f) used to calculate one data point of the averaged data Zb1(f). In other words, in the data after the averaging process, the higher the frequency f, the more data points of the data before the averaging process are used to calculate the data.
- FIG. 9 shows another example of the process of measuring the frequency characteristics of the impedance Z of the storage battery 6, which is performed by the data processing unit 26 of the process execution unit 21, different from that of FIG. 4.
- the processes of S101 to S104 are performed, as in the example of FIG. 4. Therefore, as described above, the impedance spectrum data (first impedance spectrum data) Za1(f) is calculated as measurement data using the current time series data (first current time series data) Ii1(t) and the voltage time series data (first voltage time series data) Vm1(t), and the averaged data (first averaged data) Zb1(f) is calculated by averaging.
- the data processing unit 26 resamples the current time series data Ii1(t) for the pseudo-random pulse signal, which is the input current Ii to the storage battery 6 (S105).
- current time series data (second current time series data) Ii2(t) is calculated by resampling the current time series data Ii1(t).
- the data processing unit 26 also resamples the voltage time series data Vm1(t) for the voltage Vm in a state in which the pseudo-random pulse signal is input to the storage battery (S106).
- voltage time series data (second voltage time series data) Vm2(t) is calculated by resampling the voltage time series data Vm1(t).
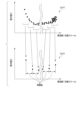
- FIG. 10 illustrates an example of resampling of the voltage time series data Vm1(t) performed by the data processing unit 26.
- resampling is explained using a graph in which the horizontal axis indicates time t and the vertical axis indicates voltage V.
- the analog signal Vm3(t) for the time change of the voltage Vm is shown by a dashed line in the graph described above.
- peaks A occur in both the high side region and the low side region with respect to the center of the fluctuation.
- the center of the fluctuation of the analog signal Vm3(t) is indicated by the center line C0.
- the A/D converter 33 samples the analog signal Vm3(t) at a predetermined sampling period to generate voltage time series data Vm1(t) as a digital signal in which the relationship of the voltage Vm with respect to time t is represented by data points ⁇ .
- the data points ⁇ represented by the voltage time series data Vm1(t) include data points ⁇ a that exist in the time range in which peak A occurs in the analog signal Vm3(t).
- the data processing unit 26 deletes data points ⁇ a that exist in the time range in which peak A occurs from the data points ⁇ represented by the voltage time series data Vm1(t).
- the data processing unit 26 performs an averaging process on the data points ⁇ other than the deleted data points ⁇ a.
- the data processing unit 26 resamples the voltage time series data Vm1(t) by performing an averaging process on data points ⁇ that exist outside the time range in which peak A occurs in the analog signal Vm3(t).
- the relationship of the voltage Vm to time t is represented by data points ⁇ in the resampled voltage time series data Vm2(t).
- the number of data points ⁇ in the resampled voltage time series data Vm2(t) is reduced compared to the number of data points ⁇ in the voltage time series data Vm1(t) before resampling.
- data points ⁇ a are not used in the averaging process performed in resampling, the effect of peak A that occurs in the analog signal Vm3(t) regarding the time change in voltage Vm is removed in the resampled voltage time series data Vm2(t).
- the A/D converter 33 samples the analog signal of the pseudo-random pulse signal at a predetermined sampling period to generate current time series data Ii1(t) as a digital signal whose data points indicate the relationship of the input current Ii against time t.
- the data points indicated by the current time series data Ii1(t) include data points that exist in the time range in which peaks occur in the analog signal of the pseudo-random pulse signal.
- Resampling of the current time series data Ii1(t) is performed in the same manner as resampling of the voltage time series data Vm1(t). That is, in resampling of the current time series data Ii1(t), the data processing unit 26 deletes data points that exist within the time range in which the above-mentioned peak occurs from the data points indicated by the current time series data Ii1(t). Then, the data processing unit 26 performs averaging processing on data points other than the deleted data points. That is, the data processing unit 26 resamples the current time series data Ii1(t) by performing averaging processing on data points that exist outside the time range in which the peak occurs in the analog signal for the pseudo-random pulse signal.
- the number of data points in the resampled current time series data Ii2(t) is reduced compared to the number of data points in the current time series data Ii1(t) before resampling. Furthermore, in the resampled current time series data Ii2(t), the effect of peaks that occur in the analog signal for the pseudo-random pulse signal is removed.
- the data processing unit 26 resamples the current time series data Ii1(t) based on the pseudo-random pulse signal and the voltage time series data Vm1(t) based on the time change in the voltage of the storage battery 6 so that the number of data points decreases.
- the current time series data Ii1(t) is resampled so that the influence of peaks occurring in the analog signal for the input current Ii to the storage battery 6 is removed by the resampling
- the voltage time series data Vm1(t) is resampled so that the influence of peaks A occurring in the analog signal for the voltage Vm related to the storage battery 6 is removed by the resampling.
- the data processing unit 26 performs a Fourier transform, such as a fast Fourier transform, on the current time series data (second current time series data) Ii2(t) obtained by resampling the current time series data Ii1(t) as described above (S107).
- the current time series data Ii2(t) is Fourier transformed in the same manner as the Fourier transform of the current time series data (first current time series data) Ii1(t) in S101.
- current spectrum data (second current spectrum data) Ii2(f) indicating the frequency characteristics of the pseudo-random pulse signal that is the input current Ii to the storage battery 6 is calculated separately from the current spectrum data Ii1(f).
- the data processing unit 26 also performs a Fourier transform, such as a fast Fourier transform, on the voltage time series data (second voltage time series data) Vm2(t) obtained by resampling the voltage time series data Vm1(t) as described above (S108).
- a Fourier transform such as a fast Fourier transform
- the voltage time series data Vm2(t) is Fourier transformed in the same manner as the Fourier transform of the voltage time series data (first voltage time series data) Vm1(t) in S102.
- voltage spectrum data (second voltage spectrum data) Vm2(f) indicating the frequency characteristics of the voltage Vm, which is a voltage component corresponding to the fluctuating voltage of the storage battery 6, is calculated separately from the voltage spectrum data Vm1(f).
- the data processing unit 26 performs a calculation using the current spectrum data Ii2(f) and the voltage spectrum data Vm2(f) (S109). At this time, the same calculation as in S103 is performed.
- impedance spectrum data (second impedance spectrum data) Za2(f) indicating the frequency characteristics of the impedance Z of the storage battery 6 is calculated separately from the impedance spectrum data Za1(f).
- the impedance spectrum data Za2(f) is calculated, for example, by dividing the voltage spectrum data Vm2(f) by the current spectrum data Ii2(f).
- the impedance spectrum data Za2(f) also indicates impedance components at each of the many frequencies included in the aforementioned measurement frequency range for the impedance Z of the storage battery 6.
- the data processing unit 26 performs averaging processing on the impedance spectrum data Za2(f), which is measurement data of the frequency characteristic of the impedance Z of the storage battery 6 (S110). At this time, the averaging processing is performed on the impedance spectrum data Za2(f) in the same manner as the averaging processing on the impedance spectrum data Za1(f) in S104. Therefore, the data processing unit 26 performs averaging processing on the impedance spectrum data Za2(f), which is measurement data of the frequency characteristic of the impedance of the storage battery 6, so that the data points after processing are equally spaced on the logarithmic scale of the frequency f.
- the averaged data (second averaged data) Zb2(f) which is the impedance spectrum data subjected to the averaging processing, is generated separately from the averaged data Zb1(f).
- the data processing unit 26 performs a data selection process on the averaged data Zb1(f) and Zb2(f) calculated as described above (S111).
- the selection process data Z0(f) is calculated as the final impedance spectrum data for the frequency characteristic of the impedance Z of the storage battery 6.
- FIG. 11 illustrates an example of data selection processing performed by the data processing unit 26 on two pieces of averaged data Zb1(f) and Zb2(f).
- the data selection processing is explained using a graph in which the horizontal axis indicates frequency f on a logarithmic scale and the vertical axis indicates the absolute value
- the data point ⁇ 1 in the averaged data (first averaged data) Zb1(f) is indicated by a filled circle
- the data point ⁇ 2 in the averaged data (second averaged data) Zb2(f) is indicated by a filled triangle.
- a reference frequency fref is specified in the data selection processing by the data processing unit 26, a reference frequency fref is specified.
- the reference frequency fref is included in the measurement frequency range in which the impedance Z of the storage battery 6 is measured.
- the data point ⁇ 1 in the averaged data Zb1(f) and the data point ⁇ 2 in the averaged data Zb2(f) are not shifted from each other, or are shifted very little.
- the data points ⁇ 1 and ⁇ 2 are shifted from each other.
- the reference frequency fref is included in the frequency range ⁇ fa.
- the measurement frequency range for measuring impedance Z is a range of 0.1 Hz or more and 5000 Hz or less, and the reference frequency fref is set to 2 Hz.
- the data processing unit 26 calculates the impedance indicated by the averaged data Zb1(f) as the impedance Z of the storage battery 6 for frequencies equal to or higher than the reference frequency fref. On the other hand, the data processing unit 26 calculates the impedance indicated by the averaged data Zb2(f) as the impedance Z of the storage battery 6 for frequencies lower than the reference frequency fref.
- the data point ⁇ 1 of the averaged data Zb1(f) is used for the impedance Z at frequencies equal to or higher than the reference frequency fref
- the data point ⁇ 2 of the averaged data Zb2(f) is used for the impedance Z at frequencies lower than the reference frequency fref.
- the data processing unit 26 performs the processes of S105 to S111 as described above. Therefore, in measuring the frequency characteristics of the impedance Z of the storage battery 6, the data processing unit 26 calculates the impedance Z of the storage battery 6 based on the current time series data (first current time series data) Ii1(t) and the voltage time series data (first voltage time series data) Vm1(t) for frequencies equal to or higher than the reference frequency fref.
- the data processing unit 26 calculates the impedance Z of the storage battery 6 based on the current time series data (second current time series data) Ii2(t) obtained by resampling the current time series data Ii1(t) and the voltage time series data (second voltage time series data) Vm2(t) obtained by resampling the voltage time series data Vm1(t) for frequencies lower than the reference frequency fref.
- the data processing unit 26 uses impedance spectrum data, which is the measurement result of the frequency characteristics of the impedance Z of the storage battery 6, to determine the state of the storage battery 6, including the deterioration state of the storage battery 6.
- impedance spectrum data is the measurement result of the frequency characteristics of the impedance Z of the storage battery 6, to determine the state of the storage battery 6, including the deterioration state of the storage battery 6.
- the state of the storage battery 6 is determined using the data Zb1(f) after the averaging process as the impedance spectrum data
- the state of the storage battery 6 is determined using the data Z0(f) after the selection process as the impedance spectrum data.
- the data processing unit 26 uses the measured impedance spectrum data and an equivalent circuit model of the storage battery 6 stored in the memory unit 22 to calculate the resistance components of the storage battery 6, such as the ohmic resistance of the storage battery 6 and the charge transfer resistance of the positive and negative electrodes of the storage battery 6.
- circuit constants electrical characteristic parameters
- circuit constants corresponding to the impedance components of the storage battery 6 are set.
- an arithmetic expression for calculating the impedance Z of the storage battery 6 from the circuit constants is shown.
- the aforementioned arithmetic expression shown in the equivalent circuit model can be, for example, an expression for calculating the real component and the imaginary component of the impedance Z of the storage battery 6 using the circuit constants and frequency, etc.
- the data processing unit 26 When calculating the resistance component of the storage battery 6, the data processing unit 26 performs a fitting calculation using an equivalent circuit model including the above-mentioned equivalent circuit, and impedance spectrum data that is the measurement result of the frequency characteristic of the impedance Z of the storage battery 6. At this time, the fitting calculation is performed using the circuit constants of the equivalent circuit of the storage battery 6 as variables, and the circuit constants (electrical characteristic parameters) that become the variables are calculated. In addition, in the fitting calculation, for example, the values of the circuit constants that become the variables are determined so that the difference between the calculation result of the impedance Z using the arithmetic expression shown in the equivalent circuit model and the measurement result of the impedance Z is as small as possible at each frequency at which the impedance Z is measured.
- the data processing unit 26 calculates the circuit constants of the equivalent circuit by fitting calculation as described above, and calculates the resistance component of the storage battery 6 based on the calculated circuit constants.
- the equivalent circuit of the storage battery and the circuit constants set in the equivalent circuit are shown in Patent Document 4 (JP Patent Publication 2017-106889).
- Patent Document 4 also shows a method of calculating the circuit constants of the equivalent circuit and the resistance component of the storage battery by performing fitting calculations using the measurement results of the impedance frequency characteristics of the storage battery and an equivalent circuit model of the storage battery.
- the frequency characteristics of the impedance Z of the storage battery 6 are measured as described above when the storage battery 6 is in each of the multiple target SOCs.
- the data processing unit 26 then calculates the resistance components, etc. of the storage battery 6 for each of the multiple target SOCs based on the impedance spectrum data, which is the measurement result of the frequency characteristics of the impedance Z.
- FIG. 12 shows an example of processing performed by the processing execution unit 21 including the input current adjustment unit 25 and the data processing unit 26 in determining the state of the storage battery 6.
- the processing in the example of FIG. 12 is performed in a state in which the storage battery 6 is being charged by the charging device 2.
- the frequency characteristics of the impedance Z of the storage battery 6 are measured for each of the target SOCs ⁇ 1 to ⁇ n, the number of targets being n (n is a natural number of 2 or more).
- the processing execution unit 21 determines the target SOCs ⁇ 1 to ⁇ n for which the frequency characteristics of the impedance Z are to be measured.
- the processing execution unit 21 In determining the target SOCs ⁇ 1 to ⁇ n, the processing execution unit 21 measures the real-time open circuit voltage (OCV) of the storage battery 6, and estimates the real-time SOC of the storage battery 6 based on the measurement result of the open circuit voltage and the relationship between the open circuit voltage and the SOC stored in the memory unit 22. Then, based on the estimated real-time SOC, the processing execution unit 21 determines the target number n of SOCs higher than the real-time SOC as the target SOCs ⁇ 1 to ⁇ n.
- the determined target SOCs ⁇ 1 to ⁇ n are the target SOCs ⁇ 1, ⁇ 2, ⁇ 3, ..., ⁇ n in order of decreasing SOC.
- the processing execution unit 21 may receive information regarding the SOC of the storage battery 6 from the charging device 2 or the storage device 3.
- the process execution unit 21 sends a command regarding the charge rate of the charging current Ic being output from the power supply circuit 11 to the control unit 12 of the charging device 2 (S121).
- the control unit 12 of the charging device 2 causes the power supply circuit 11 to output the charging current Ic at a charge rate corresponding to the command, and charges the storage battery 6.
- the process execution unit 21 determines whether the SOC of the storage battery 6 has reached the target SOC ⁇ 1 (S122). If the SOC has not reached the target SOC ⁇ 1 (S122-No), the process returns to S121, and the process execution unit 21 sequentially performs the processes from S121 onwards. Therefore, charging of the storage battery 6 continues until the SOC reaches the target SOC ⁇ 1.
- the processing execution unit 21 measures the real-time closed circuit voltage (CCV) of the storage battery 6 as the voltage Vd of the storage battery 6 based on the terminal voltage time series data Vd(t) for the voltage (terminal voltage) Vd of the storage battery 6. The processing execution unit 21 then calculates the real-time open circuit voltage of the storage battery 6 using the measurement result of the closed circuit voltage, the measurement result of the input current Ii to the storage battery 6, and the resistance component of the storage battery 6. At this time, the resistance value of the resistance component of the storage battery 6 used in the calculation is calculated based on the measurement result of the frequency characteristic of the impedance Z in the past judgment of the state of the storage battery 6 and the calculation result of the resistance component.
- CCV real-time closed circuit voltage
- the processing execution unit 21 estimates the real-time SOC of the storage battery 6 based on the calculated open circuit voltage of the storage battery 6 and the relationship between the open circuit voltage of the storage battery 6 and the SOC stored in the memory unit 22, and determines whether the estimated real-time SOC has reached the target SOC ⁇ 1.
- the process execution unit 21 may estimate the real-time SOC of the storage battery 6 by a so-called current integration method, instead of estimating the real-time SOC of the storage battery 6 based on the open circuit voltage of the storage battery 6 or the like.
- the process execution unit 21 may receive information related to the SOC of the storage battery 6 from the charging device 2 or the storage device 3, and estimate the real-time SOC of the storage battery 6 based on the received information.
- the input current adjustment unit 25 of the processing execution unit 21 controls the driving of the drive circuit 31 to generate a pseudo-random pulse signal, and inputs the generated pseudo-random pulse signal as an input current Ii to the storage battery 6. Then, the input current adjustment unit 25 controls the driving of the drive circuit 31 to adjust the pseudo-random pulse signal input to the storage battery 6 so that the measurement frequency range for measuring the impedance Z is the first measurement frequency range (S123).
- the first measurement frequency range is set to a relatively wide frequency range, and for example, a frequency range of 0.1 Hz or more and 5000 Hz or less is set as the first frequency range.
- the input current adjustment unit 25 adjusts the measurement frequency range for measuring the impedance Z of the storage battery 6 by adjusting the signal length Y of the pseudorandom pulse signal input to the storage battery 6, the pulse width w of one or more of the pulses p included in the pseudorandom pulse signal, and the number of pulses p included in the pseudorandom pulse signal.
- the input current adjustment unit 25 changes the measurement frequency range for measuring the impedance Z by changing the pulse width w of all pulses p included in the pseudorandom pulse signal at a uniform rate.
- the input current adjustment unit 25 changes the measurement frequency range for measuring the impedance Z by changing the number of pulses p included in the pseudorandom pulse signal.
- the reciprocal (1/Y) of the signal length Y of the pseudorandom pulse signal corresponds to the lower limit frequency of the measurement frequency range.
- the pulse pmin with the smallest pulse width w among the pulses p of the pseudorandom pulse signal is specified, and the pulse width wmin of the pulse pmin is specified.
- half the reciprocal of the pulse width wmin of the pulse pmin (1/(2 ⁇ wmin)) corresponds to the upper limit frequency of the measurement frequency range.
- the input current adjustment unit 25 determines whether the signal length Y of the pseudo-random pulse signal is longer than the reference signal length Yref (S124). If the signal length Y is longer than the reference signal length Yref (S124-Yes), the input current adjustment unit 25 reduces the charging rate of the charging current Ic being output from the power supply circuit 11 from the real-time rate by sending a command to the control unit 12 of the charging device 2 (S125). Then, with the charging rate of the charging current Ic reduced, the input current adjustment unit 25 inputs the pseudo-random pulse signal to the storage battery 6 as described above.
- the data processing unit 26 measures the frequency characteristic of the impedance Z of the storage battery 6 as described above (S126).
- impedance spectrum data such as the example of the averaging process data Zb1(f) in FIG. 4 and the example of the selection process data Z0(f) in FIG. 9 are obtained as the measurement result of the frequency characteristic of the impedance Z of the storage battery 6 at the target SOC ⁇ 1.
- the data processing unit 26 calculates the resistance component of the storage battery 6 as described above based on the impedance spectrum data that is the measurement result of the frequency characteristic of the impedance Z.
- the process of S126 is performed without performing the process of S125. That is, the frequency characteristic of the impedance Z of the storage battery 6 is measured and the resistance component of the storage battery 6, etc. are calculated without reducing the charge rate of the charging current Ic.
- the data processing unit 26 determines a characteristic frequency for the impedance Z of the storage battery 6 based on the impedance spectrum data, which is the measurement result of the frequency characteristics of the impedance Z of the storage battery 6 in the target SOC ⁇ 1 (S127).
- the characteristic frequency for the impedance Z includes, for example, a peak frequency.
- the frequency at the peak of the portion that is convex upward on the impedance locus i.e., the frequency at which the imaginary component of the impedance Z is minimal on the impedance locus, is the peak frequency.
- the frequency at the data point Xtop is the peak frequency.
- a setting parameter j is specified.
- the setting parameter j can be set to any one of natural numbers equal to or greater than 2 and equal to or less than n.
- the process execution unit 21 sets the setting parameter j to 2 (S128).
- the process execution unit 21 transmits a command regarding the charging rate of the charging current Ic to the control unit 12 of the charging device 2 (S129), and the control unit 12 of the charging device 2 charges the storage battery 6 at a charging rate corresponding to the command.
- the generation of the pseudo-random pulse signal by the drive circuit 31 is stopped, and all of the charging current Ic from the power supply circuit 11 is input to the storage battery 6 as the input current Ii.
- the process execution unit 21 determines whether the SOC of the storage battery 6 has reached the target SOC ⁇ j (S130). If the SOC has not reached the target SOC ⁇ j (S130-No), the process returns to S129, and the process execution unit 21 sequentially performs the processes from S129 onwards. Therefore, charging of the storage battery 6 continues until the SOC reaches the target SOC ⁇ j.
- the processing execution unit 21 calculates the real-time open circuit voltage of the storage battery 6 using the measurement result of the closed circuit voltage, the measurement result of the input current Ii to the storage battery 6, and the resistance component of the storage battery 6. At this time, the resistance value of the resistance component of the storage battery 6 used in the calculation is calculated based on the measurement result of the frequency characteristic of the impedance Z at the target SOC ⁇ 1 or the target SOC ⁇ j-1 and the calculation result of the resistance component.
- the processing execution unit 21 estimates the real-time SOC of the storage battery 6 based on the calculated open circuit voltage of the storage battery 6 and the relationship between the open circuit voltage of the storage battery 6 and the SOC stored in the memory unit 22, and determines whether the estimated real-time SOC has reached the target SOC ⁇ j.
- the process execution unit 21 may estimate the real-time SOC of the storage battery 6 by a so-called current integration method, instead of estimating the real-time SOC of the storage battery 6 based on the open circuit voltage of the storage battery 6 or the like.
- the process execution unit 21 may receive information related to the SOC of the storage battery 6 from the charging device 2 or the storage device 3, and estimate the real-time SOC of the storage battery 6 based on the received information.
- the input current adjustment unit 25 of the processing execution unit 21 controls the driving of the drive circuit 31 to generate a pseudo-random pulse signal, and inputs the generated pseudo-random pulse signal as an input current Ii to the storage battery 6. Then, the input current adjustment unit 25 controls the driving of the drive circuit 31 to adjust the pseudo-random pulse signal input to the storage battery 6 so that the measurement frequency range for measuring the impedance Z is the second measurement frequency range (S131).
- the input current adjustment unit 25 adjusts the signal length Y of the pseudo-random pulse signal input to the storage battery 6 and the pulse width w of one or more of the pulses p included in the pseudo-random pulse signal, thereby adjusting the measurement frequency range for measuring the impedance Z of the storage battery 6.
- the second measurement frequency range is set narrower than the first measurement frequency range.
- the second measurement frequency range includes the feature frequency determined in S127.
- the second frequency range is set to the peak frequency, which is the feature frequency, and a relatively narrow frequency range in its vicinity. Therefore, in measuring the frequency characteristics of the impedance Z of the storage battery 6 after determining the feature frequency, the input current adjustment unit 25 of the processing execution unit 21 narrows the measurement frequency range compared to before the feature frequency was determined, on the condition that the feature frequency is included in the measurement frequency range for measuring the impedance Z of the storage battery 6.
- the input current adjustment unit 25 determines whether the signal length Y of the pseudo-random pulse signal is longer than the reference signal length Yref (S132). If the signal length Y is longer than the reference signal length Yref (S132-Yes), the input current adjustment unit 25 reduces the charging rate of the charging current Ic being output from the power supply circuit 11 from the real-time rate by sending a command to the control unit 12 of the charging device 2 (S133). Then, with the charging rate of the charging current Ic reduced, the input current adjustment unit 25 inputs the pseudo-random pulse signal to the storage battery 6 as described above.
- the data processing unit 26 measures the frequency characteristics of the impedance Z of the storage battery 6 as described above (S134). As a result, impedance spectrum data is acquired as a measurement result of the frequency characteristics of the impedance Z of the storage battery 6 at the target SOC ⁇ j. The data processing unit 26 also calculates the resistance component of the storage battery 6 as described above based on the impedance spectrum data, which is the measurement result of the frequency characteristics of the impedance Z. If the signal length Y of the pseudo-random pulse signal is equal to or less than the reference signal length Yref (S132-No), the process of S133 is not performed and the process of S134 is performed. That is, the frequency characteristics of the impedance Z of the storage battery 6 are measured and the resistance component, etc. of the storage battery 6 are calculated without reducing the charge rate of the charging current Ic.
- the processing execution unit 21 stops the generation of the pseudo-random pulse signal by the drive circuit 31. Then, the processing execution unit 21 determines whether the measurement of the frequency characteristic of the impedance Z has been completed for all of the target SOCs ⁇ 2 to ⁇ n (S135). If the measurement of the frequency characteristic of the impedance Z has been completed for all of the target SOCs ⁇ 2 to ⁇ n (S135-Yes), the example process of FIG. 12, i.e., the process performed in determining the state of the storage battery 6, is completed.
- the process execution unit 21 increments the setting parameter j by 1 (S136). Then, the process returns to S129, and the processes from S129 onwards are performed sequentially. Therefore, the processes from S129 to S136 are repeated until the frequency characteristic of impedance Z has been measured for all of the target SOCs ⁇ 2 to ⁇ n. Note that by repeating the processes from S129 to S136, the frequency characteristic of impedance Z of the storage battery 6 is measured for the target SOCs ⁇ 2 to ⁇ n in ascending order of SOC, and the resistance component of the storage battery 6 is calculated.
- the impedance Z of the storage battery 6 is measured based on the pseudo-random pulse signal of the current input to the storage battery 6 and the time change in the voltage Vd of the storage battery 6 in a state in which the pseudo-random pulse signal of the current is input to the storage battery 6. Since the pseudo-random pulse signal is input to the storage battery 6 as the input current Ii, the current signal to be input to the storage battery 6 can be generated with a simple configuration compared to the case where the frequency characteristic of the impedance Z is measured by inputting a current signal whose current value changes periodically at each of a number of frequencies to the storage battery 6. Therefore, the impedance Z of the storage battery 6 can be measured with a simple configuration.
- the frequency characteristic of the impedance Z of the storage battery 6 can be measured in a short time compared to the case where the frequency characteristic of the impedance Z is measured by inputting a current signal whose current value changes periodically at each of a number of frequencies to the storage battery 6.
- a pseudo-random pulse signal of a current that changes between a first current value (e.g., I ⁇ -I ⁇ ) greater than zero and a second current value (e.g., I ⁇ ) greater than the first current value is input to the storage battery 6. Therefore, by inputting a pseudo-random pulse signal to the storage battery 6, it becomes possible to measure the impedance Z of the storage battery 6 in parallel with charging the storage battery 6. This improves the convenience of charging the storage battery 6 and measuring the impedance Z.
- the pseudo-random pulse signal to be input to the storage battery 6 in measuring the impedance Z is generated by shunting the charging current Ic output from the power supply circuit 11 of the charging device 2.
- This makes it possible to generate a pseudo-random pulse signal from the charging current Ic with a simple configuration, and makes it possible to miniaturize the configuration that generates the pseudo-random pulse signal from the charging current Ic, such as the drive circuit 31.
- the pseudo-random pulse signal is generated by shunting the charging current Ic, the impedance Z of the storage battery 6 is appropriately measured in parallel with the charging of the storage battery 6.
- the pseudo-random pulse signal has high resistance to noise. Therefore, even if the pseudo-random pulse signal is generated by shunting the charging current Ic, the frequency characteristics of the impedance Z of the storage battery 6 can be appropriately measured by inputting the generated pseudo-random pulse signal to the storage battery 6.
- the band pass filter 35 removes voltage components outside the specific frequency range, thereby reducing the voltage offset relative to 0V. Therefore, the time change of the voltage Vm with the voltage offset relative to 0V reduced is measured with high resolution by the A/D converter 33.
- the A/D converter 33 measures the voltage time series data Vm1(t) indicating the time change of the voltage Vm with high accuracy. Then, the impedance Z of the storage battery 6 is calculated using the voltage time series data Vm1(t) measured with high accuracy, thereby improving the accuracy of the measurement of the frequency characteristic of the impedance Z.
- the impedance spectrum data which is the measurement data of the frequency characteristics of the impedance Z of the storage battery 6, is averaged as described above so that the processed data points are equally spaced on the logarithmic scale of the frequency f.
- the impedance spectrum data Za1(f) is averaged, and in the example of FIG. 9, the impedance spectrum data Za1(f) and Za2(f) are averaged.
- the influence of noise on the impedance Z is reduced in the high frequency range.
- the accuracy of the analysis of the frequency characteristics of the impedance Z of the storage battery 6 is further improved.
- the current time series data (first current time series data) Ii1(t) based on the pseudorandom pulse signal and the voltage time series data (first voltage time series data) Vm1(t) based on the time change in the voltage Vd of the storage battery 6 are resampled to remove the influence of peaks that occur in the analog signal and to reduce the number of data points.
- the impedance Z of the storage battery 6 is calculated based on the current time series data Ii1(t) and the voltage time series data Vm1(t), and for frequencies lower than the reference frequency fref, the impedance Z of the storage battery 6 is calculated based on the current time series data (second current time series data) Ii2(t) obtained by resampling the current time series data Ii1(t) and the voltage time series data (second voltage time series data) Vm2(t) obtained by resampling the voltage time series data Vm1(t).
- the impedance Z calculated based on the current time series data Ii1(t) and the voltage time series data Vm1(t) before resampling tends to match the frequency characteristics of the impedance Z measured by inputting a current signal whose current value changes periodically at each of a number of frequencies to the storage battery 6.
- the impedance Z calculated based on the current time series data Ii2(t) and the voltage time series data Vm2(t) after resampling tends to match the frequency characteristics of the impedance Z measured by inputting a current signal whose current value changes periodically at each of a number of frequencies to the storage battery 6.
- the accuracy of the analysis is further improved by analyzing the frequency characteristics of the impedance Z of the storage battery 6 in the same manner as the example shown in FIG. 9, etc.
- the frequency characteristics of the impedance Z of the storage battery 6 are measured using a pseudo-random pulse signal for each of the multiple target SOCs ⁇ 1 to ⁇ n.
- a characteristic frequency for the impedance Z is then determined based on the measurement results of the frequency characteristics of the impedance Z for the target SOC ⁇ 1.
- the frequency range of the measurement of the frequency characteristics of the impedance Z for each of the target SOCs ⁇ 2 to ⁇ n is narrowed compared to the measurement of the frequency characteristics of the impedance Z for the target SOC ⁇ 1, provided that the characteristic frequency is included in the measurement frequency range for measuring the impedance Z of the storage battery 6. This shortens the measurement time and reduces the amount of data when measuring the frequency characteristics of the impedance Z for each of the target SOCs ⁇ 2 to ⁇ n.
- the measurement frequency range for measuring the impedance of the storage battery 6 is adjusted by adjusting the signal length Y of the pseudo-random pulse signal, the pulse width w of one or more of the pulses p included in the pseudo-random pulse signal, or the number of pulses p included in the pseudo-random pulse signal. Therefore, by adjusting the driving state of the drive circuit 30, for example by adjusting the switching operation of the switch 32, the measurement frequency range for measuring the impedance of the storage battery 6 can be easily adjusted.
- the charging rate of the charging current Ic output from the power supply circuit 11 to the storage battery 6 is reduced from the real-time rate based on the fact that the signal length Y of the pseudo-random pulse signal of the current input to the storage battery 6 is longer than the reference signal length Yref.
- the measurement device 5 is provided separately from the charging device 2 having the power supply circuit 11, and the storage device 3 having the storage battery 6. Therefore, it is possible to measure the impedance Z of the storage battery 6 using the measurement device 5 without changing the configuration of the charging device 2 and the storage device 3. Therefore, it is not necessary to provide a power supply for measuring the impedance Z separately from the power supply circuit 11 of the charging device 2.
- the measurement device 5 is separate from the charging device 2 including the power supply circuit 11 and the storage device 3 including the storage battery 6, but is not limited thereto.
- the measurement device 5 is built into the charging device 2.
- the impedance Z of the storage battery 6 is measured by inputting a pseudo-random pulse signal of a current that changes between a first current value larger than zero and a second current value larger than the first current value to the storage battery 6. Therefore, in this modified example, as in the above-mentioned embodiment, the impedance Z of the storage battery 6 can be measured with a simple configuration, and the convenience of charging the storage battery 6 and measuring the impedance Z is improved.
- a pseudo-random pulse signal is generated to be input to the storage battery 6 when measuring the impedance Z.
- the charging device 2 can be equipped with a high-performance computing device, server, communication module, or the like. This makes it possible to easily analyze and manage data in the charging device 2, and improves the accuracy of the data analysis.
- a measuring device 5 is built into the power storage device 3.
- the impedance Z of the storage battery 6 is measured by inputting a pseudo-random pulse signal of a current that changes between a first current value greater than zero and a second current value greater than the first current value to the storage battery 6. Therefore, in this modified example, as in the above-mentioned embodiment, the impedance Z of the storage battery 6 can be measured with a simple configuration, and the convenience of charging the storage battery 6 and measuring the impedance Z is improved.
- the measuring device 5 since the measuring device 5 is built into the power storage device 3, it is possible to measure the impedance Z of the storage battery 6 using the measuring device 5 built into the power storage device 3 without changing the configuration of the charging device 2. Therefore, there is no need to provide a power source for measuring the impedance Z separately from the power supply circuit 11 of the charging device 2.
- a pseudo-random pulse signal of a current that changes between a first current value greater than zero and a second current value greater than the first current value is input to the storage battery.
- the impedance of the storage battery is then measured based on the pseudo-random pulse signal of the current input to the storage battery and the change over time in the voltage of the storage battery while the pseudo-random pulse signal of the current is input to the storage battery.
Landscapes
- Physics & Mathematics (AREA)
- General Physics & Mathematics (AREA)
- Mathematical Physics (AREA)
- Charge And Discharge Circuits For Batteries Or The Like (AREA)
Abstract
Un dispositif de mesure selon un mode de réalisation est équipé d'un circuit de traitement, le circuit de traitement entrant, dans une cellule de stockage d'énergie, un signal d'impulsion pseudo-aléatoire d'un courant qui varie entre une première valeur de courant supérieure à zéro et une seconde valeur de courant supérieure à la première valeur de courant. Le circuit de traitement mesure l'impédance de la cellule de stockage d'énergie sur la base du signal d'impulsion pseudo-aléatoire du courant entré dans la cellule de stockage d'énergie, et du changement en fonction du temps de la tension de la cellule de stockage d'énergie tout en se trouvant dans un état dans lequel le signal d'impulsion pseudo-aléatoire du courant est entré dans la cellule de stockage d'énergie.
Priority Applications (3)
| Application Number | Priority Date | Filing Date | Title |
|---|---|---|---|
| JP2024575995A JPWO2024166301A1 (fr) | 2023-02-09 | 2023-02-09 | |
| PCT/JP2023/004389 WO2024166301A1 (fr) | 2023-02-09 | 2023-02-09 | Dispositif de mesure, système de stockage d'énergie et procédé de mesure |
| US19/286,917 US20250355053A1 (en) | 2023-02-09 | 2025-07-31 | Measurement apparatus, electricity storage system, and measurement method |
Applications Claiming Priority (1)
| Application Number | Priority Date | Filing Date | Title |
|---|---|---|---|
| PCT/JP2023/004389 WO2024166301A1 (fr) | 2023-02-09 | 2023-02-09 | Dispositif de mesure, système de stockage d'énergie et procédé de mesure |
Related Child Applications (1)
| Application Number | Title | Priority Date | Filing Date |
|---|---|---|---|
| US19/286,917 Continuation US20250355053A1 (en) | 2023-02-09 | 2025-07-31 | Measurement apparatus, electricity storage system, and measurement method |
Publications (1)
| Publication Number | Publication Date |
|---|---|
| WO2024166301A1 true WO2024166301A1 (fr) | 2024-08-15 |
Family
ID=92262235
Family Applications (1)
| Application Number | Title | Priority Date | Filing Date |
|---|---|---|---|
| PCT/JP2023/004389 Ceased WO2024166301A1 (fr) | 2023-02-09 | 2023-02-09 | Dispositif de mesure, système de stockage d'énergie et procédé de mesure |
Country Status (3)
| Country | Link |
|---|---|
| US (1) | US20250355053A1 (fr) |
| JP (1) | JPWO2024166301A1 (fr) |
| WO (1) | WO2024166301A1 (fr) |
Citations (9)
| Publication number | Priority date | Publication date | Assignee | Title |
|---|---|---|---|---|
| JP2003222660A (ja) * | 1996-12-17 | 2003-08-08 | Matsushita Electric Ind Co Ltd | 電池の残存容量測定装置 |
| WO2010064528A1 (fr) * | 2008-12-01 | 2010-06-10 | カルソニックカンセイ株式会社 | Procédé d'identification de modèle de batterie |
| JP2011215125A (ja) | 2010-03-15 | 2011-10-27 | Calsonic Kansei Corp | 電池容量算出装置および電池容量算出方法 |
| JP2013093120A (ja) | 2011-10-24 | 2013-05-16 | Honda Motor Co Ltd | 逐次インピーダンス計測方法、計測装置および燃料電池システム |
| JP2014126532A (ja) | 2012-12-27 | 2014-07-07 | Waseda Univ | 電気化学システム |
| JP2017106889A (ja) | 2015-11-30 | 2017-06-15 | 積水化学工業株式会社 | 診断用周波数決定方法、蓄電池劣化診断方法、診断用周波数決定システムおよび蓄電池劣化診断装置 |
| JP2020165859A (ja) * | 2019-03-29 | 2020-10-08 | 日産自動車株式会社 | 二次電池用インピーダンス測定装置および二次電池の状態推定装置、並びに二次電池システムおよび二次電池用充電装置 |
| WO2021191216A1 (fr) * | 2020-03-24 | 2021-09-30 | Leen Consulting Ab | Dispositif de mesure et procédé de détermination d'une propriété électrique |
| US20210336462A1 (en) * | 2020-04-27 | 2021-10-28 | GM Global Technology Operations LLC | Battery state estimation using injected current oscillation |
-
2023
- 2023-02-09 JP JP2024575995A patent/JPWO2024166301A1/ja active Pending
- 2023-02-09 WO PCT/JP2023/004389 patent/WO2024166301A1/fr not_active Ceased
-
2025
- 2025-07-31 US US19/286,917 patent/US20250355053A1/en active Pending
Patent Citations (9)
| Publication number | Priority date | Publication date | Assignee | Title |
|---|---|---|---|---|
| JP2003222660A (ja) * | 1996-12-17 | 2003-08-08 | Matsushita Electric Ind Co Ltd | 電池の残存容量測定装置 |
| WO2010064528A1 (fr) * | 2008-12-01 | 2010-06-10 | カルソニックカンセイ株式会社 | Procédé d'identification de modèle de batterie |
| JP2011215125A (ja) | 2010-03-15 | 2011-10-27 | Calsonic Kansei Corp | 電池容量算出装置および電池容量算出方法 |
| JP2013093120A (ja) | 2011-10-24 | 2013-05-16 | Honda Motor Co Ltd | 逐次インピーダンス計測方法、計測装置および燃料電池システム |
| JP2014126532A (ja) | 2012-12-27 | 2014-07-07 | Waseda Univ | 電気化学システム |
| JP2017106889A (ja) | 2015-11-30 | 2017-06-15 | 積水化学工業株式会社 | 診断用周波数決定方法、蓄電池劣化診断方法、診断用周波数決定システムおよび蓄電池劣化診断装置 |
| JP2020165859A (ja) * | 2019-03-29 | 2020-10-08 | 日産自動車株式会社 | 二次電池用インピーダンス測定装置および二次電池の状態推定装置、並びに二次電池システムおよび二次電池用充電装置 |
| WO2021191216A1 (fr) * | 2020-03-24 | 2021-09-30 | Leen Consulting Ab | Dispositif de mesure et procédé de détermination d'une propriété électrique |
| US20210336462A1 (en) * | 2020-04-27 | 2021-10-28 | GM Global Technology Operations LLC | Battery state estimation using injected current oscillation |
Also Published As
| Publication number | Publication date |
|---|---|
| US20250355053A1 (en) | 2025-11-20 |
| JPWO2024166301A1 (fr) | 2024-08-15 |
Similar Documents
| Publication | Publication Date | Title |
|---|---|---|
| US7714736B2 (en) | Adaptive filter algorithm for estimating battery state-of-age | |
| US8447544B2 (en) | Method and apparatus for detecting state of charge of battery | |
| US8664960B2 (en) | Charged state estimating device and charged state estimating method of secondary battery | |
| EP3279679B1 (fr) | Dispositif de commande de batterie et système de véhicule électrique | |
| EP2530478B1 (fr) | Dispositif et procédé de détermination d'état d'un dispositif de stockage électrique | |
| JP6479650B2 (ja) | 二次電池状態検出装置および二次電池状態検出方法 | |
| Nguyen et al. | Development of the intelligent charger with battery State-Of-Health estimation using online impedance spectroscopy | |
| EP3130934A1 (fr) | Dispositif de surveillance de batterie | |
| JP7640541B2 (ja) | 急速充電方法 | |
| JP2010019595A (ja) | 蓄電デバイスの残存容量演算装置 | |
| JP7235789B2 (ja) | 劣化セルの内部劣化状態推定方法、及び測定システム | |
| JP3669202B2 (ja) | バッテリ状態監視装置 | |
| WO2015008728A1 (fr) | Dispositif de détection d'état de batterie | |
| JP2016166864A (ja) | 蓄電素子管理装置、蓄電素子管理方法、蓄電素子モジュール、蓄電素子管理プログラム及び移動体 | |
| KR20150019190A (ko) | 배터리 충전 상태 추정 방법 및 이를 위한 장치 | |
| WO2016132895A1 (fr) | Appareil de surveillance de système de batterie | |
| JP2017090152A (ja) | 内部抵抗算出装置、コンピュータプログラム及び内部抵抗算出方法 | |
| Densmore et al. | Determining battery SoC using electrochemical impedance spectroscopy and the extreme learning machine | |
| CN111971200A (zh) | 用于确定电池的老化状态的方法、计算机程序、存储装置、控制设备和车辆 | |
| JP2015230169A (ja) | 電池の状態検出装置 | |
| JP7547654B2 (ja) | 電池の診断方法、電池の診断装置、電池の管理システム、及び、電池の診断プログラム | |
| JP2001351696A (ja) | 二次電池の充放電装置 | |
| WO2024166301A1 (fr) | Dispositif de mesure, système de stockage d'énergie et procédé de mesure | |
| JP2012083142A (ja) | 二次電池の内部抵抗演算装置 | |
| JP2010197354A (ja) | 二次電池の容量推定装置 |
Legal Events
| Date | Code | Title | Description |
|---|---|---|---|
| 121 | Ep: the epo has been informed by wipo that ep was designated in this application |
Ref document number: 23921132 Country of ref document: EP Kind code of ref document: A1 |
|
| ENP | Entry into the national phase |
Ref document number: 2024575995 Country of ref document: JP Kind code of ref document: A |
|
| WWE | Wipo information: entry into national phase |
Ref document number: 2024575995 Country of ref document: JP |
|
| NENP | Non-entry into the national phase |
Ref country code: DE |