WO2024095378A1 - 予測装置、予測方法、及びプログラム - Google Patents
予測装置、予測方法、及びプログラム Download PDFInfo
- Publication number
- WO2024095378A1 WO2024095378A1 PCT/JP2022/040922 JP2022040922W WO2024095378A1 WO 2024095378 A1 WO2024095378 A1 WO 2024095378A1 JP 2022040922 W JP2022040922 W JP 2022040922W WO 2024095378 A1 WO2024095378 A1 WO 2024095378A1
- Authority
- WO
- WIPO (PCT)
- Prior art keywords
- prediction
- quality
- prediction result
- unit
- result
- Prior art date
- Legal status (The legal status is an assumption and is not a legal conclusion. Google has not performed a legal analysis and makes no representation as to the accuracy of the status listed.)
- Ceased
Links
Images







Classifications
-
- H—ELECTRICITY
- H04—ELECTRIC COMMUNICATION TECHNIQUE
- H04W—WIRELESS COMMUNICATION NETWORKS
- H04W16/00—Network planning, e.g. coverage or traffic planning tools; Network deployment, e.g. resource partitioning or cells structures
- H04W16/22—Traffic simulation tools or models
-
- H—ELECTRICITY
- H04—ELECTRIC COMMUNICATION TECHNIQUE
- H04W—WIRELESS COMMUNICATION NETWORKS
- H04W48/00—Access restriction; Network selection; Access point selection
- H04W48/16—Discovering, processing access restriction or access information
Definitions
- the present invention relates to a technology for predicting the quality of services used by a device.
- the transmission (transmission) of information collected by an information transmitting device to an information receiving device via a network is used in a variety of fields.
- information from a device (information transmitting device) that can be obtained using sensors such as cameras and LiDAR (Light Detection and Ranging) is transmitted via a network to an information processing platform (information receiving device) on the edge/cloud side.
- the quality of the network (NW) used to transmit the information, or the quality of the transmitted information (e.g. video) itself, is important. Both the quality of the network (NW) and the quality of the transmitted information itself can be obtained by measurement.
- conventional technology may overestimate quality, which may have a negative impact on the applications of the quality prediction. Furthermore, conventional technology may reduce the effectiveness of prediction results based on actual values (and prediction results that take these into account). In other words, conventional quality prediction technology may not be able to make appropriate quality predictions.
- the present invention has been made in consideration of the above points, and aims to provide a technology for appropriately predicting the quality of services related to devices.
- a prediction device for predicting quality of service for a device comprising: an acquisition unit that acquires a first prediction result from a first prediction unit that predicts quality based on a usage record of the service, and acquires a second prediction result from a second prediction unit that predicts a possible quality according to a current state of the device; and a quality prediction unit that uses the first prediction result and the second prediction result to calculate a quality prediction result to be used in a predetermined function.
- the disclosed technology provides a technique for appropriately predicting the quality of services related to a device.
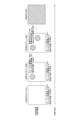
- FIG. 1 is a diagram illustrating an example of a system configuration related to NW quality prediction.
- FIG. 1 is a diagram for explaining a problem.
- FIG. 13 is a diagram for explaining Problem 2.
- FIG. 1 is a diagram for explaining an overview of the present embodiment.
- 1 is a diagram showing an apparatus configuration (system configuration) according to an embodiment of the present invention;
- FIG. 2 is a sequence diagram for explaining the operation in the present embodiment.
- FIG. 13 is a diagram for explaining a specific information exchange. 13 is a flowchart of logic example 2.
- FIG. 2 is a diagram illustrating an example of the configuration of a quality/change prediction unit 30.
- FIG. 2 is a diagram illustrating an example of the configuration of a quality prediction unit 10A.
- FIG. 13 is a diagram illustrating an example of a NW quality history database.
- FIG. 2 illustrates an example of a hardware configuration of the apparatus.
- quality changes refers to, for example, deterioration of quality or improvement of quality.
- Quality prediction and quality change prediction may be referred to as “quality/change prediction.”
- the technology according to the present invention can also be applied to quality/change prediction for things other than communications in a network.
- the technology according to the present invention can also be applied to quality/change prediction for video when providing video acquired by a device.
- Both "communications in a network” and “provision of video” are examples of "services related to devices.” It should be noted that "services related to devices” can also be rephrased as "services used by devices.”
- quality change is “quality” in a broad sense, and quality and quality change may be collectively referred to as “quality.”
- the network quality to be predicted includes, but is not limited to, bandwidth, packet loss rate, delay, jitter, etc.
- the number of prediction means (quality prediction units 10) is not limited to a specific number.
- the number of prediction means (quality prediction units 10) may be one, two, or three or more.
- edge/cloud computing In recent years, edge/cloud computing has been used in various fields. In edge/cloud computing, for example, information on the device side obtained by sensors such as cameras and LiDAR (Light Detection and Ranging) is transmitted via a network to an information processing platform on the edge/cloud side.
- sensors such as cameras and LiDAR (Light Detection and Ranging)
- LiDAR Light Detection and Ranging
- the information processing platform processes and manipulates the collected information for users such as humans and AI. In addition, this information is used to transmit downstream information such as sending signals to control the device from the information processing platform as necessary, or sending alert notifications.
- the quality of the network (NW) used for information transmission and the quality of the transmitted information (e.g. video) itself can both be measured through test information transmission or information transmission based on actual use. Meanwhile, technology to predict the quality of a NW and the quality of information transmitted using that NW based on past performance and the current environment/situation is being widely studied in fields dealing with future predictions, particularly in the field of machine learning/AI.
- Figure 1 shows an example of a system configuration related to network quality prediction.
- an information transmitting device 1 and a wireless base station 2 are connected via a wireless access network 4, and the wireless base station 2 and an information receiving device 3 are connected via a core network 5.
- the control device 6 predicts the quality of the wireless access network, for example, using the multi-radio proactive control technology disclosed in Non-Patent Document 1.
- the control device 7 predicts the network quality in a specific area/specific time period, for example, using the quality prediction technology disclosed in Non-Patent Document 2.
- Quality prediction of a network used for information transmission is used for various purposes such as operation planning of an autonomous vehicle and network control, for example, when controlling the method of information transmission (e.g., controlling the transmission bit rate of video), an erroneous quality prediction may cause the information transmission (control) to fail. For example, if a transmission bit rate larger than the available bandwidth of the network is set due to an overly positive evaluation of quality that may adversely affect the application of the quality prediction, this may result in a degradation of the quality of information transmission, such as distorting or stopping the video on the information receiving side.
- prediction means A is "E2E network quality prediction based on the actual information transmission results (results accumulated in the time-space direction) in a specific information transmission use case such as remote monitoring control of autonomous vehicles based on video transmission”
- prediction means B and C are network quality predictions according to the current situation (e.g., radio wave propagation environment) rather than the results, in an environment where the information transmission amount is controlled using min ⁇ A, B, C ⁇ (bps) as the predicted result of the network bandwidth, the information transmission amount tends to be kept low.
- the actual throughput value for video transmission will be equal to or less than that, excluding overhead.
- prediction result A by prediction means A based on the actual throughput value also tends to decrease, and min ⁇ A, B, C ⁇ also tends to decrease due to the influence of A.
- min ⁇ A, B, C ⁇ will continue to drop and will eventually become 0 in theory. This will result in the network bandwidth prediction result remaining at 0 bps, making it impossible to utilize network quality prediction for various purposes, such as controlling information transmission based on the network bandwidth prediction. In other words, the effectiveness of prediction results based on performance values (and prediction results that take this into account) will decrease.
- Prediction means A is a means for performing E2E network quality prediction (A) based on the throughput performance value in actual information transmission
- prediction means B is a means for performing network quality prediction (B) based on the radio wave propagation environment in the location of the device (e.g., information transmitting device 1 or information receiving device 3) performing the communication for which the quality is predicted.
- the NW quality prediction value of prediction means A is "NW-A: 3Mbps, NW-B: 2Mbps, NW-C: 5Mbps
- the NW quality prediction value of prediction means B is "NW-A: 5Mbps, NW-B: 5Mbps, NW-C: 6Mbps”.
- the prediction result is "NW-A: 3Mbps, NW-B: 2Mbps, NW-C: 5Mbps".
- the NW quality prediction value of prediction means A is "NW-A: 3Mbps, NW-B: 2Mbps, NW-C: 5Mbps
- the NW quality prediction value of prediction means B is "NW-A: 5Mbps, NW-B: 1Mbps, NW-C: 4Mbps”.
- the prediction result is "NW-A: 3Mbps, NW-B: 1Mbps, NW-C: 4Mbps".
- ⁇ Example of Task 2 Diagram> A specific example of problem 2 will be described with reference to Fig. 3. Nos. 1 to 4 in Fig. 3 show state changes (changes over time) in the driving environment of an autonomous vehicle when the above-mentioned control is performed.
- the "throughput performance value” shown in Fig. 3 is the throughput performance value that is the basis for the predicted bandwidth of prediction means A, and the "packet loss rate” is the packet loss rate when the throughput performance value is measured.
- the "bandwidth prediction value” is not based on the performance value, but is a prediction value of prediction means B based on the current situation such as the radio wave propagation environment, and is, for example, a prediction value using the technology disclosed in Non-Patent Document 1.
- the actual throughput is 1 Mbps
- the actual packet loss rate is 10%
- the predicted bandwidth is 10 Mbps at the quality degradation point, and everywhere else, the actual throughput is 10 Mbps
- the actual packet loss rate is 0%
- the predicted bandwidth is 10 Mbps.
- the prediction device predicts network quality (including changes such as quality degradation) by combining a network quality prediction means A that estimates the available bandwidth from a safe side based on the track record of what was available in actual information transmission, and a network quality prediction means B that estimates the available bandwidth that can be taken depending on the current situation, such as the device position of an autonomous vehicle or the like, and the physical environment, such as the radio wave propagation environment, rather than based on the track record.
- a network quality prediction means A that estimates the available bandwidth from a safe side based on the track record of what was available in actual information transmission
- a network quality prediction means B that estimates the available bandwidth that can be taken depending on the current situation, such as the device position of an autonomous vehicle or the like, and the physical environment, such as the radio wave propagation environment, rather than based on the track record.
- prediction means A and B are not limited to the above.
- prediction means A may be a prediction means that cannot respond to changes in the physical environment but can take into account traffic congestion conditions that affect information transmission in E2E
- prediction means B may be a prediction means that can respond to changes in the radio wave propagation environment but cannot take into account background traffic.
- the method of adoption/reflection in the final network quality/change prediction result is determined according to the characteristics of the prediction method and the characteristics of the prediction result.
- Figure 4 also uses the driving environment of an autonomous vehicle as an example.
- the actual throughput value is 1Mbps
- the actual packet loss rate value is 10%
- the predicted bandwidth value is 10Mbps.
- the actual throughput value is 10Mbps
- the actual packet loss rate value is 0%
- the predicted bandwidth value is 10Mbps.
- state “2” which is the state after using "1”
- the actual throughput will be 10Mbps
- the actual packet loss rate will be 0%
- the predicted bandwidth will be 10Mbps.
- the quality degradation points will be released (recovery based on challenging usage plans/usage results).
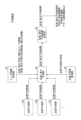
- Fig. 5 is a configuration diagram of a prediction device according to this embodiment. As shown in Fig. 5, the prediction device according to this embodiment has a plurality of quality prediction units 10 (10A to 10C are shown as examples), a user information management unit 20, a quality/change prediction unit 30, a quality prediction unit management unit 40, and a quality/change prediction result transmission unit 50.
- a configuration including multiple quality prediction units 10, user information management units 20, quality/change prediction units 30, quality prediction unit management units 40, and quality/change prediction result transmission units 50 may be called a prediction system.
- the configuration in which the quality/change prediction unit 30 exists may be called a prediction device or a prediction system.
- the quality/change prediction unit 30 may be called a prediction device.
- each quality prediction unit 10 transmits the quality prediction results to the quality/change prediction unit 30.
- the user information management unit 20 transmits user information related to the quality/change prediction (information related to the utilization use of the quality/change prediction) to the quality/change prediction unit 30.
- the quality prediction unit management unit 40 transmits the characteristics of the quality prediction unit to the quality/change prediction unit 30.
- the quality/change prediction unit 30 executes prediction processing based on the information received in S101 to S105.
- the quality/change prediction unit 30 transmits the quality/change prediction result to the quality/change prediction result transmission unit 50.
- the quality/change prediction result transmission unit 50 transmits the quality/change prediction result to the external function 60.
- External function 60 is, for example, a control function (control device) that controls a device that performs communication that is the subject of quality prediction.
- External function 60 may be a planning function that uses the quality/change prediction results, an alert notification function that uses the quality/change prediction results, or a function other than these.
- External functions are examples of "predetermined functions.”
- the quality/change prediction unit 30 does not receive a prediction result from a certain quality prediction unit 10, it predicts the quality/change based on the results of the other quality prediction units 10.
- the quality/change prediction unit 30 may include in the quality/change prediction result what information was used to predict the result. For example, information such as "This result is based on the results of A and B" or "This result is based only on B" may be included in the quality/change prediction result.
- the prediction device of this embodiment predicts network quality (including changes such as quality degradation) by combining a network quality prediction means A that estimates the available bandwidth from a safe side based on the track record of availability in actual information transmission, and a network quality prediction means B that estimates the available bandwidth that can be taken depending on the current situation, such as the device position of an autonomous vehicle or the like, and the physical environment, such as the radio wave propagation environment.
- the quality/change prediction unit 30 does not simply adopt the worst value (lower limit value) of the prediction results by the multiple quality prediction units 10 as the NW quality/change prediction result, but determines how to adopt/reflect the prediction result by the quality prediction unit 10 into the final NW quality/change prediction result according to the characteristics of the quality prediction unit 10 or the characteristics of the prediction result.
- the final prediction result is the prediction result that is output to the quality/change prediction result transmission unit 50.
- the quality/change prediction unit 30 may predict (final) quality that does not include changes such as quality degradation. Alternatively, it may predict changes such as quality degradation without predicting quality that does not include changes such as quality degradation (i.e., without outputting the final predicted result of the quality).
- At least one of the multiple quality prediction units 10 corresponds to prediction means A, and at least one of the multiple quality prediction units 10 corresponds to prediction means B.
- quality prediction unit 10A is prediction means A
- quality prediction unit 10B is prediction means B.
- quality prediction unit 10A prediction means A
- quality prediction unit 10B prediction means B
- Fig. 7 shows 10A and 10B as the quality prediction unit 10.
- Quality prediction unit 10A performs E2E network quality prediction based on information transmission records, while quality prediction unit 10B performs network quality prediction that predicts possible quality not based on information transmission records but based on the device's current status, such as the device's location and the radio wave propagation environment at that location. Both quality prediction unit 10A and quality prediction unit 10B perform network quality prediction for communications that are the subject of quality prediction and are performed by a certain device.
- the quality prediction unit 10A transmits the throughput, packet loss rate, and delay of each information transmission flow to the quality/change prediction unit 30.
- the quality prediction unit 10B transmits the bandwidth, packet loss rate, delay, and prediction reliability (prediction value also includes confidence interval) of each network to the quality/change prediction unit 30.
- the user information management unit 20 transmits user information related to the quality/change prediction (information related to the use of the quality/change prediction) to the quality/change prediction unit 30.
- An example of information sent from the user information management unit 20 is as follows:
- the quality prediction unit management unit 40 transmits the characteristics of the quality prediction unit 10 (e.g., A: based on actual values, B: available bandwidth prediction for the wireless section based on the radio wave propagation environment) to the quality/change prediction unit 30.
- A based on actual values
- B available bandwidth prediction for the wireless section based on the radio wave propagation environment
- the quality/change prediction unit 30 executes a prediction process for the network quality/change. As a result of the prediction process, the quality/change prediction unit 30 transmits, for example, the following information to the quality/change prediction result transmission unit 50.
- logic example 1 and logic example 2 will be explained based on specific examples.
- operation example 1 and operation example 2 will be explained.
- the user information and predicted values for operation example 1 and operation example 2 are as follows.
- the predicted values are the predicted bandwidth (X Mbps) and the packet loss rate (X%) when the actual throughput value on which the predicted bandwidth is based is measured.
- ⁇ User information and predicted values in operation example 1> ⁇ User information related to judgment Recommended transmission bit rate: 5Mbps ⁇ NW quality prediction value of NW quality prediction unit 10A NW-A: 3 Mbps, 10% NW-B: 2Mbps, 1% NW-C: 5Mbps, 0% ⁇ NW quality prediction value of NW quality prediction unit 10B NW-A: 5Mbps, 5% NW-B: 5Mbps, 2% NW-C: 6Mbps, 1% ⁇ User Information and Prediction Values in Operation Example 2> ⁇ User information related to judgment Recommended transmission bit rate: 3Mbps ⁇ NW quality prediction value of NW quality prediction unit 10A NW-A: 3 Mbps, 10% NW-B: 2Mbps, 1% NW-C: 5Mbps, 0% ⁇ Network quality prediction value of prediction means B NW-A: 5Mbps, 5% NW-B: 1Mbps, 2% NW-C: 4Mbps, 1% ⁇ Logic example 1 for predicting network quality/changes> In logic example 1, the quality/variation prediction unit 30 adopts the worst value (lower limit
- the value of the quality/change prediction unit 10 adopted above is used as the predicted value of the packet loss rate (if the predicted band of A is adopted, the predicted value of the packet loss rate of A).
- the predicted delay value can be determined in the same way as the packet loss rate, or the larger value can be used as a safer option (depending on the policy).
- NW-A 3Mbps
- 10% NW-B 2Mbps
- 1% NW-C 5Mbps
- 0% ⁇ Quality degradation detection result
- NW-A NG (quality degradation)
- NW-B NG (quality degradation)
- NW-C OK (no quality degradation)
- NW quality prediction results and the quality deterioration detection results are as follows:
- the quality/change prediction unit 30 receives the result of E2E network quality prediction (A) based on the throughput performance value in actual information transmission, the result of network quality prediction (B) based on the radio wave propagation environment, the characteristics of the quality prediction unit 10 (A, B), and user information related to the quality/change prediction.
- the network quality prediction result includes the predicted bandwidth, packet loss rate, and delay.
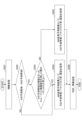
- the quality/change prediction unit 30 determines whether the predicted band of A is smaller than the predicted band of B. If the result of the determination is Yes, the process proceeds to S203, and if the result is No, the process proceeds to S204.
- the quality/change prediction unit 30 judges whether the packet loss rate when measuring the throughput performance value on which A's predicted bandwidth is based is n% (e.g., 1%) or less. If the judgment result is Yes, proceed to S204, and if the judgment result is No, proceed to S205.
- the quality/change prediction unit 30 adopts the predicted bandwidth/packet loss rate/delay of B as the NW quality prediction result.
- the quality/change prediction unit 30 adopts the predicted bandwidth/packet loss rate/delay of A as the NW quality prediction result.
- the quality/change prediction unit 30 compares the NW quality prediction result with the user information related to the quality/change prediction to determine whether it corresponds to a change (deterioration), and transmits the NW quality prediction result and the deterioration determination result together to the quality/change prediction result transmission unit 50 as the quality/change prediction result.
- the prediction result by B is used to calculate the final prediction result. Note that here, as an example of "calculation”, the prediction result by B is used as is. If the packet loss rate based on past performance is greater than (or greater than) the threshold, it is determined that there is no bandwidth greater than or equal to the actual throughput value, and the prediction result by A is used.
- the predicted delay value may be determined in the same way as the packet loss rate, or the larger value may be adopted as a policy to err on the side of caution (depending on the policy).
- Logic Example 2 can calculate a network bandwidth prediction result that is close to the actual available bandwidth while avoiding overestimation based on a certain degree of reliable evidence, and can detect quality degradation based on that bandwidth.
- logic example 2 determines whether there is a margin left in the available bandwidth estimated on the safe side based on the packet loss rate actual value in quality prediction unit 10A, and determines whether there is a prediction that there is an available bandwidth greater than the actual bandwidth, as indicated by another prediction means (quality prediction unit 10B).
- NW-A 3Mbps
- 10% NW-B 5Mbps
- 2% NW-C 6Mbps
- NW-B OK (no quality degradation)
- NW-C OK (no quality degradation)
- the NW quality prediction result and the quality degradation detection result are as follows:
- the quality/change prediction unit 30 adopts the value of " ⁇ (A's predicted bandwidth) + (B's predicted bandwidth) ⁇ /2" as the predicted bandwidth.
- the predicted bandwidth of B may be divided by the number of flows sharing the bandwidth and used as the "predicted bandwidth of B" in the above formula.
- the value of " ⁇ (predicted bandwidth of A) + ⁇ (predicted bandwidth of B) ⁇ /( ⁇ + ⁇ )" may be used as the predicted bandwidth.
- ⁇ and ⁇ are, for example, predetermined weights.
- Logic Example 3 avoids overestimating the available bandwidth by gradually increasing the margin that is considered to be left in the estimated available bandwidth on the safe side.
- the packet loss rate when measuring the actual throughput value on which A's predicted bandwidth is based is n% (e.g., 1%) or less, and if "A's predicted bandwidth ⁇ B's predicted bandwidth" and B's reliability (%) is p% (e.g., 90%) or more, the quality/change prediction unit 30 adopts a value taking into account B's predicted bandwidth, as in logic examples 2 and 3, and if B's reliability (%) is less than p%, the quality/change prediction unit 30 adopts A's predicted bandwidth.
- the method of taking into account may be changed depending on the value of p.
- the value of B's predicted band ⁇ p/100 may be taken into account.
- Logic example 4 makes it possible to determine whether or not a prediction means (example: B) that estimates the possible (maximum) available bandwidth predicts that there is an "available bandwidth greater than the actual bandwidth” depending on the reliability of the prediction result.
- a prediction means example: B
- the quality/change prediction unit 30 adopts a value taking into account the predicted bandwidth of B, as in logic examples 2 and 3. Note that the above "lower limit” may be replaced with an intermediate value or an upper limit depending on the policy.
- Logic example 5 makes it possible to determine whether or not a prediction means (example: B) that estimates the possible (maximum) available bandwidth predicts that there is an "available bandwidth greater than the actual bandwidth” depending on the confidence interval of the prediction result and the policy of how far to go into the margin that is considered to remain in the available bandwidth estimated from a safe side.
- a prediction means example: B
- the quality/change prediction unit 30 adopts the value of A's predicted bandwidth x ⁇ ( ⁇ >1).
- the packet loss rate and delay are the same as in example 2.
- ⁇ is a predetermined coefficient.
- Logic example 6 makes it possible to avoid a situation in which the network bandwidth prediction results continue to decline even when only a prediction method (e.g., A) that estimates the available bandwidth from a conservative perspective is available.
- a prediction method e.g., A
- the quality/change prediction unit 30 assumes that the predicted bandwidth of quality prediction unit 10A (which estimates the available bandwidth from a safe side) is used as a base, and that it provides protection using the predicted bandwidths of quality prediction unit 10B and quality prediction unit 10C (which estimate the (maximum) possible available bandwidth).
- Quality prediction unit 10C is one of the "prediction means B.”
- the quality/change prediction unit 30 compares the actual throughput value, B's predicted bandwidth, and C's predicted bandwidth when the packet loss rate when the actual throughput value was measured in the past is m% (e.g. 5%) or less, and adopts the predicted bandwidth of the quality prediction unit 10 (B or C) that has predicted a value close to the actual throughput value more frequently.
- the packet loss rate and delay are the same as in logic example 1 (and example 2).
- the quality/change prediction unit 30 compares the throughput actual value, the predicted bandwidth of B, and the predicted bandwidth of C when the packet loss rate when the throughput actual value was measured in the past is m% (e.g., 5%) or less, and adopts the predicted bandwidth of the quality prediction unit 10 (B or C) with the smaller total value of the difference between the throughput actual value and the predicted bandwidth.
- the packet loss rate and delay are the same as in example 1.
- Logic Example 8 makes it possible to utilize forecasting methods that are believed to provide predictions that are closer to the actual situation when viewed cumulatively.
- ⁇ Network quality/change prediction logic example 9> In logic example 9, with respect to part (2) of logic example 7, if the packet loss rate when measuring the throughput actual value on which the predicted bandwidth of A is based is n% (e.g., 1%) or less and "the predicted bandwidth of A is less than the predicted bandwidth of B and the predicted bandwidth of A is less than the predicted bandwidth of C", the quality/change prediction unit 30 compares the throughput actual value, the predicted bandwidth of B, and the predicted bandwidth of C in the case where the packet loss rate when the throughput actual value was measured in the past is k% (e.g., 20%) or more, and adopts the predicted bandwidth of the prediction means having the smaller total value of the difference between the throughput actual value and the predicted bandwidth (only cases where the predicted bandwidth is larger are counted).
- the packet loss rate and delay are the same as in example 1.
- Example 9 allows for the use of a predictive method that is less prone to overestimating quality, which can have a detrimental effect on the application of the quality prediction.
- Examples 7, 8, and 9 we have shown examples of combination methods when there are three or more types of prediction methods, but the reliability and confidence intervals shown in Examples 4 and 5 may be used as a method of taking each prediction method into account (a method of determining whether to take each prediction method into account).
- the above are examples of methods for adopting (combining) the prediction results from each prediction means, and the method for taking each prediction means into account (including the degree to which it is taken into account) may be changed depending on the current situation, such as the device location and surrounding environment, or on policies, or it may be possible to change whether or not to take a certain prediction means into account.
- Fig. 9 is a configuration diagram of the prediction device.
- the prediction device is a device that predicts the quality (or quality change) of a service related to a device.
- the quality/change prediction unit 30 includes an acquisition unit 31, a quality prediction unit 32, and a judgment unit 33.
- the quality prediction unit 32 may not be included.
- the judgment unit 33 may not be included.
- the acquisition unit 31 acquires a first prediction result from a first prediction unit (e.g., prediction means A) that predicts quality based on the usage history of the service, and acquires a second prediction result from a second prediction unit (e.g., prediction means B) that predicts the possible quality according to the current situation of the device.
- the acquired prediction result is stored, for example, in a storage unit such as a memory provided in the quality/change prediction unit 30, and is read out and used by the quality prediction unit 32 or the determination unit 33.
- the quality prediction unit 32 uses the first prediction result and the second prediction result to calculate a quality prediction result to be used in a specified function.
- An example of the calculation logic is as described above.
- the determination unit 33 uses the first prediction result, the second prediction result, and the user information to determine whether or not there has been a change in the quality of the service. For example, if the user information is that "the information transmission delay must be less than X ms," the determination unit 33 uses the first prediction result and the second prediction result to predict the delay, for example, using the logic example described above, and outputs a determination result that there has been a deterioration in quality if the delay exceeds X.
- the determination unit 33 may use the prediction results from the quality prediction unit 32.
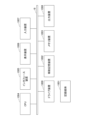
- the quality prediction unit 10A includes an operation plan acquisition unit 11, an event information acquisition unit 12, a time/location information acquisition unit 13, a device sensor such as an IMU 14, a future location prediction unit 15, a NW quality prediction unit 16, a NW quality history database 17, and a NW quality prediction result transmission unit 18.
- the outline of the operation is as follows.
- the operation plan acquisition unit 11, event information acquisition unit 12, time/position information acquisition unit 13, and device sensor 14 such as an IMU transmit the operation plan, event information, time/position information (present), acceleration, angular velocity, and other sensor information of the device (target device) that communicates with the target device for which quality prediction is to be performed to the future position prediction unit 15.
- the future location prediction unit 15 predicts the future location of the target device based on the received information and transmits the time/location information (future) to the NW quality prediction unit 16.
- the NW quality prediction unit 16 refers to the NW quality history database 17 based on the time/location information (future) and obtains the throughput, packet loss rate, and delay (actual values) of each information transmission flow.
- the NW quality prediction unit 16 transmits the NW quality prediction results (throughput, packet loss rate, and delay of each information transmission flow) to the NW quality prediction result transmission unit 18.
- the NW quality prediction result transmission unit 18 transmits the NW quality prediction results to external functions that use the NW quality prediction results.
- the quality prediction unit 10A predicts the NW quality using information in the NW quality history database 17.
- Figure 11 shows an image of the NW quality history database 17.
- the NW quality history database 17 in this example stores information source identifiers, time, position, speed/attitude, and NW quality.
- identifier we assume an identifier at the network (line) level (including information on what kind of QoS control has been applied), but it is also acceptable to assign an identifier so that filtering can be done at the device/equipment level as a broad classification, and at the flow-based level based on the application as a finer classification.
- the quality prediction unit 10A uses time/location information (future) as a key to refer to information in the NW quality history database 17.
- time/location information (future)
- the range of information to be referred to is, for example, as shown in (1) or (2) below.
- n which is the filtering threshold
- n is increased gradually.
- a method of gradually increasing n is used, only the most recent results will be referenced, so a method of increasing n discontinuously may be used.
- this method can be used to automatically restore quality when the results of a sudden network quality degradation deviate from the basis information used when calculating predicted values based on past results.
- n the maximum value of n is greater than the accumulation period of the information transmission record (in places where the frequency of information transmission based on the use case is low, it is assumed that trial information transmission will be carried out, in which case the period will be used), then theoretically there will be at least one information transmission record in n, making it possible to predict network quality using this function.
- outlier testing may be included as necessary.
- an outlier test (Smirnoff-Grubbs test) is performed and the average value or the xx percentile value is extracted.
- ⁇ Quality index, granularity, and QoS control> The relationship between the quality index of each network, the granularity such as flow/line/device unit, and QoS control is as follows.
- the target of quality/change prediction is network quality.
- the target of quality/change prediction may be video quality (VMAF, etc.).
- the target of prediction may be the state of a device (speed, acceleration, attitude, etc.).
- the quality prediction calculation policy may be such that a result on the safe side is always calculated, that it depends on the judgment basis, that it always calculates a result on the dangerous side, etc. It may also be assumed that a policy according to the KPI of information transmission or the characteristics of the transmitted information is applied. Furthermore, the applied policy may be changed as necessary.
- Any of the functional units and any of the combinations of the functional units among the quality prediction unit 10, the user information management unit 20, the quality/change prediction unit 30, the quality prediction unit management unit 40, and the quality/change prediction result transmission unit 50 described in this embodiment can be realized, for example, by causing a computer to execute a program.
- This computer may be a physical computer or a virtual machine on the cloud.
- the prediction device and prediction system described in this embodiment can be realized, for example, by having a computer execute a program.
- This computer may be a physical computer or a virtual machine on the cloud.
- the device can be realized by using hardware resources such as a CPU and memory built into a computer to execute a program corresponding to the processing performed by the device.
- the program can be recorded on a computer-readable recording medium (such as a portable memory) and then stored or distributed.
- the program can also be provided via a network such as the Internet or email.
- FIG. 12 is a diagram showing an example of the hardware configuration of the computer.
- the computer in FIG. 12 has a drive device 1000, an auxiliary storage device 1002, a memory device 1003, a CPU 1004, an interface device 1005, a display device 1006, an input device 1007, an output device 1008, etc., all of which are interconnected by a bus BS.
- the computer may further include a GPU.
- the program that realizes the processing on the computer is provided by a recording medium 1001, such as a CD-ROM or a memory card.
- a recording medium 1001 storing the program is set in the drive device 1000, the program is installed from the recording medium 1001 via the drive device 1000 into the auxiliary storage device 1002.
- the program does not necessarily have to be installed from the recording medium 1001, but may be downloaded from another computer via a network.
- the auxiliary storage device 1002 stores the installed program as well as necessary files, data, etc.
- the memory device 1003 When an instruction to start a program is received, the memory device 1003 reads out and stores the program from the auxiliary storage device 1002.
- the CPU 1004 realizes the functions related to the device in accordance with the program stored in the memory device 1003.
- the interface device 1005 is used as an interface for connecting to a network, etc.
- the display device 1006 displays a GUI (Graphical User Interface) based on a program, etc.
- the input device 1007 is composed of a keyboard and mouse, buttons, a touch panel, etc., and is used to input various operational instructions.
- the output device 1008 outputs the results of calculations.
- a prediction apparatus for predicting quality of service for a device comprising: Memory, at least one processor coupled to the memory; Including, The processor, obtaining a first prediction result from a first prediction unit that predicts quality based on a usage record of the service, and obtaining a second prediction result from a second prediction unit that predicts a possible quality according to a current state of the device; a prediction device that calculates a quality prediction result to be used in a predetermined function, using the first prediction result and the second prediction result.
- the prediction device according to claim 1, wherein the processor determines whether or not to use the second prediction result in calculating the quality prediction result, based on the first prediction result.
- a prediction apparatus for predicting a change in quality of service for a device comprising: Memory, at least one processor coupled to the memory; Including, The processor, obtaining a first prediction result from a first prediction unit that predicts quality based on a usage record of the service, and obtaining a second prediction result from a second prediction unit that predicts a possible quality according to a current state of the device; a prediction device that determines whether or not there is a change in quality of the service, using the first prediction result, the second prediction result, and user information.
- the user information is information related to an application of the quality prediction.
- a prediction method executed by a prediction device for predicting quality of service for a device comprising: an acquisition step of acquiring a first prediction result from a first prediction unit that predicts quality based on a usage record of the service, and acquiring a second prediction result from a second prediction unit that predicts a possible quality according to a current state of the device; a quality prediction step of calculating a quality prediction result to be used in a predetermined function using the first prediction result and the second prediction result.
- a prediction method executed by a prediction device for predicting a change in quality of service for a device comprising: an acquisition step of acquiring a first prediction result from a first prediction unit that predicts quality based on a usage record of the service, and acquiring a second prediction result from a second prediction unit that predicts a possible quality according to a current state of the device; and a determining step of determining whether or not there is a change in quality of the service by using the first prediction result, the second prediction result, and user information.
- a non-transitory storage medium storing a program for causing a computer to function as each unit in the prediction device according to any one of claims 1 to 5.
Landscapes
- Engineering & Computer Science (AREA)
- Computer Networks & Wireless Communication (AREA)
- Signal Processing (AREA)
- Computer Security & Cryptography (AREA)
- Data Exchanges In Wide-Area Networks (AREA)
Priority Applications (2)
| Application Number | Priority Date | Filing Date | Title |
|---|---|---|---|
| PCT/JP2022/040922 WO2024095378A1 (ja) | 2022-11-01 | 2022-11-01 | 予測装置、予測方法、及びプログラム |
| JP2024553991A JPWO2024095378A1 (https=) | 2022-11-01 | 2022-11-01 |
Applications Claiming Priority (1)
| Application Number | Priority Date | Filing Date | Title |
|---|---|---|---|
| PCT/JP2022/040922 WO2024095378A1 (ja) | 2022-11-01 | 2022-11-01 | 予測装置、予測方法、及びプログラム |
Publications (1)
| Publication Number | Publication Date |
|---|---|
| WO2024095378A1 true WO2024095378A1 (ja) | 2024-05-10 |
Family
ID=90930078
Family Applications (1)
| Application Number | Title | Priority Date | Filing Date |
|---|---|---|---|
| PCT/JP2022/040922 Ceased WO2024095378A1 (ja) | 2022-11-01 | 2022-11-01 | 予測装置、予測方法、及びプログラム |
Country Status (2)
| Country | Link |
|---|---|
| JP (1) | JPWO2024095378A1 (https=) |
| WO (1) | WO2024095378A1 (https=) |
Citations (3)
| Publication number | Priority date | Publication date | Assignee | Title |
|---|---|---|---|---|
| JP2009278421A (ja) * | 2008-05-15 | 2009-11-26 | Nec Corp | 無線品質劣化予測システム |
| US20100214923A1 (en) * | 2009-02-20 | 2010-08-26 | Clear Wireless Llc | Predictive throughput management |
| JP2012209760A (ja) * | 2011-03-30 | 2012-10-25 | Sony Corp | 無線通信装置、通信システムおよび情報処理方法 |
-
2022
- 2022-11-01 WO PCT/JP2022/040922 patent/WO2024095378A1/ja not_active Ceased
- 2022-11-01 JP JP2024553991A patent/JPWO2024095378A1/ja active Pending
Patent Citations (3)
| Publication number | Priority date | Publication date | Assignee | Title |
|---|---|---|---|---|
| JP2009278421A (ja) * | 2008-05-15 | 2009-11-26 | Nec Corp | 無線品質劣化予測システム |
| US20100214923A1 (en) * | 2009-02-20 | 2010-08-26 | Clear Wireless Llc | Predictive throughput management |
| JP2012209760A (ja) * | 2011-03-30 | 2012-10-25 | Sony Corp | 無線通信装置、通信システムおよび情報処理方法 |
Also Published As
| Publication number | Publication date |
|---|---|
| JPWO2024095378A1 (https=) | 2024-05-10 |
Similar Documents
| Publication | Publication Date | Title |
|---|---|---|
| JP6761793B2 (ja) | 車両用制御装置 | |
| JP4571235B2 (ja) | 経路制御装置、経路異常予測装置、方法、およびプログラム | |
| EP3748923B1 (en) | Ensuring backup path performance for predictive routing in sd-wans | |
| CN118479315B (zh) | 一种基于电梯物联网的通信系统及数据发送方法 | |
| WO2011102317A1 (ja) | モニタリングシステム、装置および方法 | |
| KR102779346B1 (ko) | 스마트 apt 통신 제어 및 상태 모니터링 시스템 | |
| US11777854B2 (en) | Globally avoiding simultaneous reroutes in a network | |
| CN119155177B (zh) | 一种用于实现网络服务器的搭建方法及系统 | |
| CN119835671A (zh) | 用于两轮车通信设备的控制系统 | |
| CN119749315A (zh) | 一种充电数据异常检测和安全处理系统 | |
| US12184561B1 (en) | Systems and methods to utilize edge computing to respond to latency in connected vehicles | |
| CN118644069A (zh) | 一种智能交通系统的异构终端分级管理方法及系统 | |
| WO2024095378A1 (ja) | 予測装置、予測方法、及びプログラム | |
| CN120498901B (zh) | 算力网络异常节点识别方法、装置、设备及存储介质 | |
| CN120220351B (zh) | 一种智能化楼宇防火消防管理系统及方法 | |
| CN119012305B (zh) | 一种便携式救援通信终端的控制系统 | |
| JP2014112779A (ja) | データ送信制御装置、データ送信制御方法、および、コンピュータ・プログラム | |
| CN118739955A (zh) | 一种雨刮电机控制方法和设备 | |
| KR102484733B1 (ko) | 위치정보 기반 대기시간 제공 방법 | |
| JP7658422B2 (ja) | 車載装置、制御サーバ、測定データの収集方法及びプログラム | |
| KR102861408B1 (ko) | Ai 기반 학내 전산 장비 장애 예측 및 유지 보수 시스템 | |
| CN119176094B (zh) | 一种车载控制器快速容灾管理方法及系统 | |
| CN121585998A (zh) | 一种融合移动5g的跨域资源调度系统 | |
| CN119450642B (zh) | 基于5G RedCap的通信增强方法、装置、设备及存储介质 | |
| CN120389979A (zh) | 一种配电网ftu设备短报文通信方法及系统 |
Legal Events
| Date | Code | Title | Description |
|---|---|---|---|
| 121 | Ep: the epo has been informed by wipo that ep was designated in this application |
Ref document number: 22964399 Country of ref document: EP Kind code of ref document: A1 |
|
| WWE | Wipo information: entry into national phase |
Ref document number: 2024553991 Country of ref document: JP |
|
| NENP | Non-entry into the national phase |
Ref country code: DE |
|
| 122 | Ep: pct application non-entry in european phase |
Ref document number: 22964399 Country of ref document: EP Kind code of ref document: A1 |