WO2024048079A1 - 有用物質を産生するクローンの産生安定性を予測する方法、情報処理装置、プログラムおよび予測モデル生成方法 - Google Patents
有用物質を産生するクローンの産生安定性を予測する方法、情報処理装置、プログラムおよび予測モデル生成方法 Download PDFInfo
- Publication number
- WO2024048079A1 WO2024048079A1 PCT/JP2023/025263 JP2023025263W WO2024048079A1 WO 2024048079 A1 WO2024048079 A1 WO 2024048079A1 JP 2023025263 W JP2023025263 W JP 2023025263W WO 2024048079 A1 WO2024048079 A1 WO 2024048079A1
- Authority
- WO
- WIPO (PCT)
- Prior art keywords
- data
- clones
- clone
- culture
- prediction
- Prior art date
Links
- 238000004519 manufacturing process Methods 0.000 title claims abstract description 120
- 238000000034 method Methods 0.000 title claims abstract description 116
- 239000000126 substance Substances 0.000 title claims abstract description 98
- 230000010365 information processing Effects 0.000 title claims abstract description 36
- 230000008859 change Effects 0.000 claims abstract description 14
- 238000012549 training Methods 0.000 claims description 77
- 210000004027 cell Anatomy 0.000 claims description 55
- 230000014509 gene expression Effects 0.000 claims description 52
- 238000010801 machine learning Methods 0.000 claims description 44
- 108090000623 proteins and genes Proteins 0.000 claims description 34
- JVTAAEKCZFNVCJ-UHFFFAOYSA-N lactic acid Chemical group CC(O)C(O)=O JVTAAEKCZFNVCJ-UHFFFAOYSA-N 0.000 claims description 28
- 230000006870 function Effects 0.000 claims description 20
- 235000014655 lactic acid Nutrition 0.000 claims description 14
- 239000004310 lactic acid Substances 0.000 claims description 14
- 238000003860 storage Methods 0.000 claims description 13
- 210000004978 chinese hamster ovary cell Anatomy 0.000 claims description 10
- 102000004169 proteins and genes Human genes 0.000 claims description 9
- 241000251539 Vertebrata <Metazoa> Species 0.000 claims description 3
- 241000700605 Viruses Species 0.000 claims description 3
- 102000004196 processed proteins & peptides Human genes 0.000 claims description 3
- 108090000765 processed proteins & peptides Proteins 0.000 claims description 3
- 239000002994 raw material Substances 0.000 claims description 3
- 238000012360 testing method Methods 0.000 description 43
- 238000012545 processing Methods 0.000 description 42
- 238000010586 diagram Methods 0.000 description 26
- 230000016784 immunoglobulin production Effects 0.000 description 25
- 239000002609 medium Substances 0.000 description 17
- 238000004891 communication Methods 0.000 description 14
- 230000008569 process Effects 0.000 description 14
- 238000013500 data storage Methods 0.000 description 13
- 241000894007 species Species 0.000 description 11
- 238000011156 evaluation Methods 0.000 description 10
- 229940125644 antibody drug Drugs 0.000 description 9
- 238000013473 artificial intelligence Methods 0.000 description 8
- 238000007405 data analysis Methods 0.000 description 8
- 238000004458 analytical method Methods 0.000 description 6
- 230000000052 comparative effect Effects 0.000 description 6
- 238000002790 cross-validation Methods 0.000 description 6
- 230000007774 longterm Effects 0.000 description 6
- 102000007056 Recombinant Fusion Proteins Human genes 0.000 description 5
- 108010008281 Recombinant Fusion Proteins Proteins 0.000 description 5
- 238000010367 cloning Methods 0.000 description 5
- 238000012252 genetic analysis Methods 0.000 description 5
- 238000013112 stability test Methods 0.000 description 5
- 229960000074 biopharmaceutical Drugs 0.000 description 4
- 238000011194 good manufacturing practice Methods 0.000 description 4
- 238000003672 processing method Methods 0.000 description 4
- 238000012795 verification Methods 0.000 description 4
- 108091028043 Nucleic acid sequence Proteins 0.000 description 3
- 239000003814 drug Substances 0.000 description 3
- 238000005516 engineering process Methods 0.000 description 3
- 239000001963 growth medium Substances 0.000 description 3
- 238000003780 insertion Methods 0.000 description 3
- 230000037431 insertion Effects 0.000 description 3
- 238000002372 labelling Methods 0.000 description 3
- 230000009467 reduction Effects 0.000 description 3
- 239000004065 semiconductor Substances 0.000 description 3
- 210000004102 animal cell Anatomy 0.000 description 2
- 238000013459 approach Methods 0.000 description 2
- 230000006399 behavior Effects 0.000 description 2
- 238000004364 calculation method Methods 0.000 description 2
- 238000013145 classification model Methods 0.000 description 2
- 230000001186 cumulative effect Effects 0.000 description 2
- 230000007423 decrease Effects 0.000 description 2
- 230000003247 decreasing effect Effects 0.000 description 2
- 238000011161 development Methods 0.000 description 2
- 230000018109 developmental process Effects 0.000 description 2
- 230000000694 effects Effects 0.000 description 2
- 239000003550 marker Substances 0.000 description 2
- 238000005259 measurement Methods 0.000 description 2
- 238000011165 process development Methods 0.000 description 2
- 229920002477 rna polymer Polymers 0.000 description 2
- 238000005070 sampling Methods 0.000 description 2
- 238000010187 selection method Methods 0.000 description 2
- 230000010473 stable expression Effects 0.000 description 2
- 238000012546 transfer Methods 0.000 description 2
- HXQQNYSFSLBXQJ-UHFFFAOYSA-N COC1=C(NC(CO)C(O)=O)CC(O)(CO)CC1=NCC(O)=O Chemical compound COC1=C(NC(CO)C(O)=O)CC(O)(CO)CC1=NCC(O)=O HXQQNYSFSLBXQJ-UHFFFAOYSA-N 0.000 description 1
- 101150030983 GEP gene Proteins 0.000 description 1
- 102000003839 Human Proteins Human genes 0.000 description 1
- 108090000144 Human Proteins Proteins 0.000 description 1
- 238000012300 Sequence Analysis Methods 0.000 description 1
- OMOVVBIIQSXZSZ-UHFFFAOYSA-N [6-(4-acetyloxy-5,9a-dimethyl-2,7-dioxo-4,5a,6,9-tetrahydro-3h-pyrano[3,4-b]oxepin-5-yl)-5-formyloxy-3-(furan-3-yl)-3a-methyl-7-methylidene-1a,2,3,4,5,6-hexahydroindeno[1,7a-b]oxiren-4-yl] 2-hydroxy-3-methylpentanoate Chemical compound CC12C(OC(=O)C(O)C(C)CC)C(OC=O)C(C3(C)C(CC(=O)OC4(C)COC(=O)CC43)OC(C)=O)C(=C)C32OC3CC1C=1C=COC=1 OMOVVBIIQSXZSZ-UHFFFAOYSA-N 0.000 description 1
- 210000000628 antibody-producing cell Anatomy 0.000 description 1
- 230000001174 ascending effect Effects 0.000 description 1
- 230000011712 cell development Effects 0.000 description 1
- 230000004663 cell proliferation Effects 0.000 description 1
- 239000003086 colorant Substances 0.000 description 1
- 230000001276 controlling effect Effects 0.000 description 1
- 238000012258 culturing Methods 0.000 description 1
- 230000003292 diminished effect Effects 0.000 description 1
- 238000009826 distribution Methods 0.000 description 1
- 229940079593 drug Drugs 0.000 description 1
- 238000007905 drug manufacturing Methods 0.000 description 1
- 238000005401 electroluminescence Methods 0.000 description 1
- 230000003203 everyday effect Effects 0.000 description 1
- 238000002474 experimental method Methods 0.000 description 1
- 238000011985 exploratory data analysis Methods 0.000 description 1
- 239000000284 extract Substances 0.000 description 1
- 230000002068 genetic effect Effects 0.000 description 1
- 210000003292 kidney cell Anatomy 0.000 description 1
- 239000004973 liquid crystal related substance Substances 0.000 description 1
- 238000007477 logistic regression Methods 0.000 description 1
- 230000007246 mechanism Effects 0.000 description 1
- 239000012533 medium component Substances 0.000 description 1
- 239000002207 metabolite Substances 0.000 description 1
- 238000012986 modification Methods 0.000 description 1
- 230000004048 modification Effects 0.000 description 1
- 230000003287 optical effect Effects 0.000 description 1
- 238000007639 printing Methods 0.000 description 1
- 230000002062 proliferating effect Effects 0.000 description 1
- 230000035755 proliferation Effects 0.000 description 1
- 230000000644 propagated effect Effects 0.000 description 1
- 238000000746 purification Methods 0.000 description 1
- 230000001105 regulatory effect Effects 0.000 description 1
- 230000004044 response Effects 0.000 description 1
- 238000012216 screening Methods 0.000 description 1
- 239000007787 solid Substances 0.000 description 1
- 238000012430 stability testing Methods 0.000 description 1
- 238000004114 suspension culture Methods 0.000 description 1
- 238000003786 synthesis reaction Methods 0.000 description 1
Images


Classifications
-
- C—CHEMISTRY; METALLURGY
- C07—ORGANIC CHEMISTRY
- C07K—PEPTIDES
- C07K16/00—Immunoglobulins [IGs], e.g. monoclonal or polyclonal antibodies
-
- C—CHEMISTRY; METALLURGY
- C12—BIOCHEMISTRY; BEER; SPIRITS; WINE; VINEGAR; MICROBIOLOGY; ENZYMOLOGY; MUTATION OR GENETIC ENGINEERING
- C12N—MICROORGANISMS OR ENZYMES; COMPOSITIONS THEREOF; PROPAGATING, PRESERVING, OR MAINTAINING MICROORGANISMS; MUTATION OR GENETIC ENGINEERING; CULTURE MEDIA
- C12N5/00—Undifferentiated human, animal or plant cells, e.g. cell lines; Tissues; Cultivation or maintenance thereof; Culture media therefor
- C12N5/06—Animal cells or tissues; Human cells or tissues
-
- C—CHEMISTRY; METALLURGY
- C12—BIOCHEMISTRY; BEER; SPIRITS; WINE; VINEGAR; MICROBIOLOGY; ENZYMOLOGY; MUTATION OR GENETIC ENGINEERING
- C12N—MICROORGANISMS OR ENZYMES; COMPOSITIONS THEREOF; PROPAGATING, PRESERVING, OR MAINTAINING MICROORGANISMS; MUTATION OR GENETIC ENGINEERING; CULTURE MEDIA
- C12N5/00—Undifferentiated human, animal or plant cells, e.g. cell lines; Tissues; Cultivation or maintenance thereof; Culture media therefor
- C12N5/10—Cells modified by introduction of foreign genetic material
-
- C—CHEMISTRY; METALLURGY
- C12—BIOCHEMISTRY; BEER; SPIRITS; WINE; VINEGAR; MICROBIOLOGY; ENZYMOLOGY; MUTATION OR GENETIC ENGINEERING
- C12P—FERMENTATION OR ENZYME-USING PROCESSES TO SYNTHESISE A DESIRED CHEMICAL COMPOUND OR COMPOSITION OR TO SEPARATE OPTICAL ISOMERS FROM A RACEMIC MIXTURE
- C12P1/00—Preparation of compounds or compositions, not provided for in groups C12P3/00 - C12P39/00, by using microorganisms or enzymes
-
- G—PHYSICS
- G16—INFORMATION AND COMMUNICATION TECHNOLOGY [ICT] SPECIALLY ADAPTED FOR SPECIFIC APPLICATION FIELDS
- G16B—BIOINFORMATICS, i.e. INFORMATION AND COMMUNICATION TECHNOLOGY [ICT] SPECIALLY ADAPTED FOR GENETIC OR PROTEIN-RELATED DATA PROCESSING IN COMPUTATIONAL MOLECULAR BIOLOGY
- G16B40/00—ICT specially adapted for biostatistics; ICT specially adapted for bioinformatics-related machine learning or data mining, e.g. knowledge discovery or pattern finding
Definitions
- the present disclosure relates to information processing technology and machine learning technology for predicting the production stability of clones that produce useful substances.
- biopharmaceuticals which account for more than half of the products in the world's top 10 pharmaceutical sales rankings and about two-thirds of sales.
- biopharmaceuticals make use of complex proteins and are extremely difficult to chemically synthesize. Therefore, antibody drugs, which are an example of biopharmaceuticals, are produced by inserting a gene corresponding to a desired human protein into, for example, CHO cells (Chinese Hamster Ovary cells), causing the cells to produce the desired protein, which is then extracted and purified. The production method for manufacturing antibody drugs is widely used.
- the clone of the present invention refers to a population of genetically identical cells or cells constituting the population.
- high-quality antibody production ability means that there is a high antibody production ability at the present time, and that the antibody production ability is stable even during a long-term culture period.
- clones created from individual cells with random gene insertion positions vary in antibody production ability, and it is necessary to determine whether each clone has good antibody production ability.
- it is possible to determine whether a clone is a high-producing clone with high antibody production ability or not by a two-week standard test but it is difficult to determine whether the production stability is stable over a long-term culture period. In fact, experimental verification (stability testing) through long-term culture for several months is essential.
- Patent Document 1 proposes a method for predicting the production stability of a clone's recombinant protein several months into the future from gene expression data of the clone obtained at the present time. Furthermore, Non-Patent Document 1 proposes a method for predicting the production stability of a recombinant protein at an early stage of clone development by identifying a marker gene that can predict the stable expression of a recombinant protein at an early stage of clone development. ing.
- Patent Document 1 cannot be said to be sufficient in terms of prediction accuracy.
- genetic analysis of a large number of clones generally requires high costs, the cost reduction effect obtained by predicting the production stability of recombinant proteins is diminished by the cost increase due to genetic analysis for prediction.
- it is conceivable to narrow down the number of clones whose production stability is predicted but this would also reduce the number of clones with high production stability among the prediction targets, and the resultant production stability This resulted in a small number of high clones, making it difficult to simply narrow down the number of clones to be predicted.
- the first problem to be solved by the present disclosure is to provide a means for predicting the production stability of useful substances in clones with high accuracy.
- the second objective is to provide a means to reduce the cost of predicting the production stability of useful substances in clones.
- the present disclosure has been made in view of these circumstances, and provides a method, information processing device, program, and predictive model generation method that can predict the production stability of clones that produce useful substances with high accuracy and at low cost.
- the purpose is to provide
- a method is a method for predicting production stability of a clone producing a useful substance, the method comprising: one or more processors acquiring culture data of one or more types of clones; Analyzing the culture data to limit the clones to be predicted, and predicting the production stability of useful substances by the clones to be predicted using the data measured for the clones to be predicted.
- production stability is predicted by limiting prediction targets based on information obtained from culture data, so production stability is predicted with higher accuracy compared to the case where targets are not limited. becomes possible. Moreover, since the data necessary for prediction can be acquired only for the clones that are the prediction targets, cost reduction is possible.
- the predicted production stability may represent the future state of the clone several months into the future, similar to production stability that has actually been experimentally verified by long-term culture over several months. For example, production stability may be evaluated from the viewpoint of whether the initial production amount is maintained even after long-term culture. According to the first aspect, the results of stability tests that require long-term culture can be predicted with high accuracy and low cost.
- the production stability is defined by the presence or absence of a change in the production amount of the useful substance between the start of culture and after culture for a predetermined period. It's okay.
- a method according to a third aspect of the present disclosure includes, in the method according to the first aspect or the second aspect, one or more processors setting an index obtained from culture data and a threshold regarding the index;
- the configuration may be such that the prediction target is limited based on the value of the index and the threshold value.
- the method according to the fourth aspect of the present disclosure may be configured such that in the method according to the third aspect, the threshold value is adjusted so that the prediction accuracy of production stability is higher than when the prediction target is not limited. .
- the method according to the fifth aspect of the present disclosure may be configured such that in the method according to the third aspect or the fourth aspect, the threshold value is defined using the ranking of the index value.
- the "rank" can be a rank when the index values of a plurality of clones are arranged in descending order or a rank when they are arranged in ascending order.
- the threshold value may be defined as the top 40% of the relative ranking in a population containing multiple clones.
- the prediction target in the method according to any one of the third to fifth aspects, may be a group with a high value of the index.
- the indicator in the method according to any one of the third to sixth aspects, may be the production amount of the useful substance.
- the index in the method according to any one of the third to sixth aspects, may be an integral viable cell density.
- the indicator in the method according to the ninth aspect of the present disclosure, in the method according to any one of the third to sixth aspects, may be lactic acid concentration.
- a method according to a tenth aspect of the present disclosure is a method according to any one of the first to ninth aspects, wherein the data used for predicting production stability includes one or more gene expression levels. It's okay.
- a method according to an eleventh aspect of the present disclosure is a method according to any one of the first to tenth aspects, in which one or more processors receive input of data to be predicted and determine whether the data is stable or unstable.
- the configuration may be such that production stability is predicted using a model that performs two-class classification.
- the model is configured such that the correct stability label is associated with data about a training clone with the same limitations as the prediction target clone.
- the model may be trained by machine learning using a plurality of training data.
- a method according to a thirteenth aspect of the present disclosure is the method according to the twelfth aspect, wherein the plurality of training data includes training data about a plurality of types of clones that produce different useful substances, and the one or more processors It may be configured to predict the production stability of a clone that produces a useful substance different from the useful substance used for training.
- the method according to the fourteenth aspect of the present disclosure is the method according to any one of the first to thirteenth aspects, wherein the useful substance is any one of proteins, peptides, and viruses that are pharmaceutical raw materials. good.
- the useful substance in the method according to any one of the first to fourteenth aspects, may be an antibody or an antibody-like protein.
- the clone in the method according to any one of the first to fifteenth aspects, may be a vertebrate-derived cell.
- the clone in the method according to any one of the first to fifteenth aspects, may be a mammalian-derived cell.
- the clone in the method according to any one of the first to fifteenth aspects, may be a CHO cell or a HEK cell (Human Embryonic Kidney cells).
- An information processing device includes one or more processors and one or more storage devices in which instructions to be executed by the one or more processors are stored, and the one or more processors are , acquire culture data of one or more types of clones that produce useful substances, analyze the culture data to limit the clones to be predicted, and use the data measured for the clones to be predicted to determine the target clones. Predict the stability of production of useful substances by clones.
- the information processing device can be configured to include an aspect similar to the method of any one of the second to eighteenth aspects.
- a program according to a twentieth aspect of the present disclosure provides a computer with a function of acquiring culture data of one or more types of clones producing useful substances, and a function of analyzing the culture data to limit clones to be predicted. and a function of predicting the production stability of a useful substance by a clone to be predicted using data measured for the clone to be predicted.
- the program according to the 20th aspect can be configured to include aspects similar to the method of any one of the 2nd to 18th aspects.
- a predictive model generation method is a predictive model generation method for generating a predictive model that allows a computer to realize a function of predicting the production stability of a clone producing a useful substance, the method comprising: A system including a processor acquires culture data of one or more types of clones, analyzes the culture data to limit the clones to be predicted, and compares the data measured for the clones to be predicted with the correct answer. The method includes performing machine learning using a plurality of training data associated with stability labels, and training the prediction model so that the output of the prediction model in response to the data input approaches the correct stability label.
- the predictive model generation method according to the 21st aspect may include aspects similar to the method of any one of the 2nd to 18th aspects.
- prediction targets are appropriately limited based on information obtained by analyzing culture data, and it becomes possible to predict with high accuracy the production stability of clones that produce useful substances. Further, according to the present disclosure, by limiting the prediction target, the cost of predicting production stability can be suppressed, and prediction can be performed at low cost.
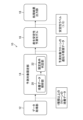
- FIG. 1 is an explanatory diagram showing an overview of the production process of antibody drugs.
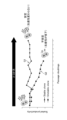
- FIG. 2 is a graph showing an example of changes in antibody production amount depending on clones.
- FIG. 3 is an explanatory diagram outlining the role of stability prediction AI (Artificial Intelligence) realized by this embodiment.
- FIG. 4 is a conceptual diagram of a machine learning model that predicts production stability based on gene expression data.
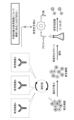
- FIG. 5 is an explanatory diagram showing an overview of the method for predicting production stability of clones according to the present embodiment.
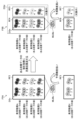
- FIG. 6 is a diagram illustrating an example of a dataset used for model training and evaluation.
- FIG. 7 is a graph showing an example of narrowing down targets using a certain index of culture data.
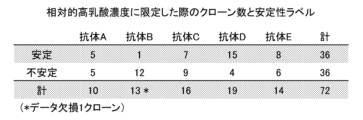
- FIG. 8 is a chart showing examples of the number of clones and stability labeling of five types of antibody-producing CHO cells prepared as evaluation samples.
- FIG. 9 is a chart showing the number of clones whose antibody production amount falls within the top 40% of the relative ranking for each antibody type and an example of assigning stability labels.
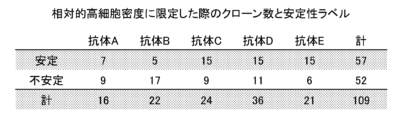
- FIG. 10 is a chart showing the number of clones whose integrated viable cell density value falls within the top 60% of the relative ranking for each antibody type and an example of assigning stability labels.
- FIG. 11 is a chart showing the number of clones whose lactic acid concentration values fall within the top 40% of the relative ranking for each antibody type and examples of stability labeling.
- FIG. 12 is a block diagram showing the functional configuration of the information processing device according to the embodiment.
- FIG. 12 is a block diagram showing the functional configuration of the information processing device according to the embodiment.
- FIG. 13 is a block diagram showing an example of the hardware configuration of the information processing device.
- FIG. 14 is a block diagram illustrating an example of a hardware configuration of a machine learning device that executes machine learning processing to generate a production stability prediction model.
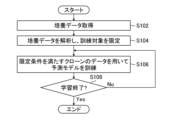
- FIG. 15 is a flowchart illustrating an example of a machine learning method executed by the machine learning device.
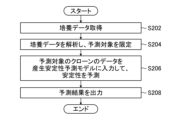
- FIG. 16 is a flowchart illustrating an example of an information processing method executed by the information processing apparatus according to the embodiment.
- FIG. 1 is an explanatory diagram showing an overview of the production process of antibody drugs.
- the process to produce an antibody drug includes [1] a cloning phase, [2] a process development phase, and [3] a GMP (Good Manufacturing Practice) manufacturing phase.
- the cloning phase involves adding a vector to animal cells suitable for the production of antibody drugs and genetically recombining them to create multiple clone candidates, and determining the amount of antibody produced from among these multiple candidates. , screening for clones that are excellent in terms of cell proliferation, quality stability in which cell characteristics do not change even after repeated proliferation, and the like.
- the process development phase is a phase in which the screened clones are used to develop production processes (culture conditions, purification conditions, etc.) necessary for GMP production.
- the clones are cultured and propagated under the established production process, and the clones are made to produce antibodies. Furthermore, by purifying the antibody and formulating it, an antibody drug is completed.
- FIG. 2 is a graph showing an example of changes in antibody production amount depending on the clone.
- the vertical axis represents antibody productivity, and the horizontal axis represents elapsed time (time point).
- "Antibody productivity" is expressed by the amount of antibody produced by a clone per unit time.
- Figure 2 shows a graph plotting how the amount of antibodies produced by a clone changes over a long period of time (2-3 months).
- Graph G1 is a graph showing changes in antibody production amount for clones with stable productivity.
- Graph G2 is a graph showing changes in antibody production amount for clones with unstable productivity.
- clones with stable productivity have approximately the same productivity even after 2 to 3 months from the current point, and can maintain productivity that is generally unchanged from the current point.
- the productivity of clones with unstable productivity gradually decreases over a period of 2 to 3 months.
- the "current time” refers to the two-week standard test time or the end of the standard test, that is, the time when culture for determining production stability is started.
- “current antibody productivity” is the amount of antibody produced by a clone per unit time in a two-week standard test.
- the productivity behavior shown in Figure 2 varies depending on the type of clone, and conventionally, each time the type of antibody that a clone is made to produce changes, an experiment similar to that shown in Figure 2 is conducted to stabilize the production of each clone. I had to evaluate my sexuality.
- the embodiments of the present disclosure propose a mechanism for accurately predicting the production stability of antibodies several months into the future based on information obtained from clones at the present time.
- “information obtained from the clone at present” is information obtained from the clone in a two-week standard test.
- Antibody production stability which is a target variable for prediction, can be defined by the presence or absence of a change in the amount of antibody produced between the current time and after several months of culture.
- “several months” is, for example, a period of two months or more, and may be, for example, two to three months. Alternatively, the period may be set until passage is performed a predetermined number of times.
- the period may be determined based on the proliferative ability of the clone, or may be determined based on the cultivation period of the clone during actual antibody production.
- the "current time” is the initial time of culture shown at the left end of the graph in FIG. 2, that is, the time when the two-week standard test is completed, and the time when culture for determining the production stability of antibodies is started.
- Stable productivity means that there is no change in the amount of antibody produced between the present and several months from now. "No change” includes cases where the amount of change is within a permissible range and can be considered as substantially no change.
- "Unstable” productivity means that there is a change in the amount of antibody produced between now and several months later, and in many cases, the amount of antibody produced decreases.
- the threshold value for determining that there is a change in productivity can be set arbitrarily, and may be, for example, ⁇ 30% or ⁇ 20% with respect to the current production amount.
- FIG. 3 is an explanatory diagram illustrating the role of stability prediction AI (Artificial Intelligence) realized by this embodiment.
- AI Artificial Intelligence
- the stability prediction AI predicts the state (changes in productivity) after 2 to 3 months.
- a stability prediction AI that enables this. More specifically, a model is constructed that receives input of current gene expression data (at the time of standard testing) of a clone and outputs a stability label indicating the production stability of a useful substance. More specifically, some of the clones are used for standard tests, and another part is subjected to genetic analysis to obtain gene expression data, so that gene expression data of the clones used for standard tests can be obtained. do.
- the stability label can be expressed as a binary value of "1" indicating “stable” or "0” indicating "unstable”.
- the prediction model for predicting production stability may be a two-class classification model that performs classification into “stable” or "unstable”.
- Gene expression data includes one or more gene levels.
- the gene expression data used in this embodiment includes data obtained by quantifying the gene expression level of each of a plurality of genes.
- Gene expression data can be obtained, for example, by RNA (ribonucleic acid) sequence analysis.
- the value indicating the amount of gene expression is, for example, a count value that takes a positive integer, and can be logarithmically transformed and used as a feature amount.
- FIG. 4 is a conceptual diagram of the machine learning model MLM that predicts production stability based on gene expression data.
- An example of a dataset of training data is shown inside the rectangular frame RF1 in FIG.
- the current gene expression data (at the time of standard testing) of each of a plurality of clones A to N is expressed as a gene expression pattern GEP visualized by a heat map.
- the horizontal axis of the gene expression pattern GEP represents the type of gene, and the gene expression level of each of a plurality of genes is expressed by a two-color gradation (heat map).
- gene expression data can be determined by, for example, obtaining all gene expression data for stable clones and unstable clones, and calculating the number of types of genes a, b, c, d, etc. Preferably, 300 to 400 types are selected using the statistical significance probability of the two groups. If you want to further narrow down the number of gene types, use the selected genes to actually train the machine learning model MLM while increasing or decreasing the number of gene types, and search for the number of types that gives high prediction performance, for example 50 to 100. It is preferable to narrow down the search to genes of different types. In addition, although all gene expression data were acquired here, it is not necessarily necessary to acquire all gene expression data, and some genes may be selected at random and the gene expression data thereof may be acquired.
- red represents a relatively high gene expression level
- blue represents a relatively low gene expression level
- White indicates that the gene expression level is an intermediate value.
- Each of the multiple clones A to N has been confirmed to be “stable” or “unstable” based on experimental verification by culturing for several months after the standard test, and the A stability label (correct label) indicating “stable” or “unstable” is assigned.
- a data set is prepared that includes a plurality of training data in which the current gene expression data of each of the plurality of clones A to N and the correct stability label are associated (linked).
- the machine learning model MLM is trained using the plurality of training data, and the machine learning model MLM is made to learn stable or unstable gene patterns.
- FIG. 4 shows an example in which the machine learning model MLM predicts that unknown clone X is "stable”.
- ⁇ Summary of the embodiment Build a model that predicts the production stability of useful substances by limiting the prediction target ⁇ Since clones that produce useful substances have various characteristics, it is difficult to accurately predict the production stability of all clones regardless of type.
- highly accurate prediction is achieved by limiting the prediction target based on the index obtained from the culture data of each clone at the current time (at the time of the standard test).
- the culture data is general data that can be measured for clones using a culture device or by sampling a portion of a culture solution containing cells and using a dedicated device.
- FIG. 5 is an explanatory diagram showing an overview of the method for predicting production stability of useful substances of clones according to the present embodiment.
- the left diagram F5A in FIG. 5 shows a comparative example in which the prediction target is not limited, and the right diagram F5B in FIG. 5 shows an overview of the method according to this embodiment.
- a data set DSc including training data of multiple types of clones producing useful substances A to D is schematically shown.
- This data set DSc includes training data for a total of 20 clones, 5 clones for each of useful substances A to D.
- the training data is data in which the gene expression data at the time of each standard test and the correct stability label are associated (linked) for the 20 clones.
- Values such as "9", "7", and "6" displayed at the bottom of each clone in FIG. 5 represent measured values of certain culture data of each clone during the standard test. Note that instead of the measured value, the relative level in each clone that can be obtained from the measured value may be expressed.
- the machine learning model MLMc is trained using all the training data of the dataset DSc without limiting the training data, and the unknown useful substance X is produced using the learned (trained) model.
- This study shows that the production stability of multiple types of clones can be predicted. In this case, there are no particular limitations on the multiple types of clones that produce the unknown useful substance Predict production stability for the target. To predict production stability, obtain current gene expression data (at the time of standard testing) for all five types of clones that produce unknown useful substance X, and input it into a learned (trained) model. However, the prediction accuracy is low.
- the prediction target is limited using the value of certain culture data at the time of the standard test as an index.
- a threshold value is determined by focusing on the value of certain culture data, and a population of clones included in the data set DSd is divided into groups. For example, the culture data used as an index is divided into two groups: those whose values are relatively large with respect to the threshold value, and those whose values are relatively small.
- the threshold value is set to ⁇ 5'', and the population whose culture data value as an index is ⁇ 5'' or more is the training target, and the population whose culture data value is smaller than ⁇ 5'' is excluded from the training target.
- a total of 12 clones of training data, 3 clones for each useful substance A to D, are left as targets as shown in the rectangular frame RF4, and the data set DSe containing the training data of these limited groups is machined. Used for training the learning model MLMe.
- the training data of the eight clones shown within the dashed rectangular frame RF5 that is, the training data of the clones that do not satisfy the threshold condition, are excluded from the processing.
- the machine learning model MLMe is trained using the dataset DSe with limited targets.
- a threshold is applied to the value of the culture data used as an index, and prediction is performed limited to those that satisfy the limiting conditions by the threshold (groups whose index value is higher than the threshold).
- the three types of clones shown within the rectangular frame RF6 represent clones applicable to the prediction target.
- the two types of clones shown within the dashed rectangular frame RF7 represent clones that are not subject to prediction.
- Figure 6 shows an example of a dataset used for model training and evaluation.
- the upper part of FIG. 6 shows an example of a data set DSA for a clone that produces antibody A as a useful substance
- the lower part shows an example of a data set DSB for a clone that produces antibody B as a useful substance.
- data sets for clones producing other types of antibodies as useful substances are also similar.
- the data set DSA includes culture data measured for each of the plurality of clones ACLj at the time of the standard test, gene expression data at the time of the standard test, and the correct stability label obtained from the stability test.
- the subscript j represents an index number that identifies a clone.
- the culture data may include, for example, one or more items such as antibody production amount, integral viable cell density (IVCD), lactic acid concentration, and pH.
- the culture data may be general data that can be measured using a dedicated device by sampling a part of the culture medium or the culture medium containing the cells, such as the total number of cells, the amount of cell secreted substances, and the amount of cell produced substances. , an amount of a cell metabolite, and an amount of a medium component.
- the character symbols (symbols with subscript j) in each cell of the table shown in FIG. 6 represent the value of the corresponding data item.
- the number na of clones ACLj included in the data set DSA and the number nb of clones BCLj included in the data set DSB may be different.
- Targets are narrowed down (limited) by focusing on certain indicators of culture data from the datasets of multiple domains (useful substance types) prepared in this way.
- FIG. 7 is a graph showing an example of narrowing down prediction targets using a certain index of culture data.
- On the horizontal axis multiple types of clones that produce each of the multiple useful substances A to E are lined up.
- the vertical axis is the value of a certain index obtained from the culture data during the standard test. Note that the clone shown in FIG. 7 is a clone used for model training (learning).
- the distribution range of a certain index obtained from culture data may differ depending on clones producing different types of useful substances.
- a threshold value is determined for the index value, and the clones are divided into two groups based on the relative size with the threshold value, and the group of clones used for training and the group of clones used for training are If a group of clones is excluded from the training, the number of clones to be trained will vary depending on the types of useful substances produced. For example, if the index threshold is set to 2.5 and a population of clones with values equal to or higher than the threshold are used for training, clones that produce useful substance B will not be used for training.
- the relative top X% refers to the top X% (Top-X%) when a certain index obtained from culture data is arranged in descending order in a population of clones producing each of the useful substances A to D. means. It is preferable that the standard "X%", which corresponds to a threshold value serving as a limiting condition, is adjusted so that the number of samples from each of the useful substances A to E is approximately the same.
- the relative top X% is an example of a "threshold defined using the ranking of index values" in the present disclosure.
- the clone to be predicted is the same as the clone used for training the model. Predictions are made only for the top X% of clones with respect to a certain index obtained from culture data.
- the method for limiting the population of clones used for training may be to set a threshold value by focusing on the value of certain culture data during a standard test, and to set a threshold value based on the relative size relationship with the threshold value. It may be set to the top X% of the value of a certain index obtained from the culture data at the time of the test. In addition, although the relative top X% was used, it may be set as the relative bottom X% depending on a certain index obtained from the culture data.
- the culture data index and threshold for limiting prediction targets may be determined from a prepared data set by repeating hypothesis and verification in a trial and error manner.
- the culture data index and threshold for limiting prediction targets can be determined by performing exploratory analysis from a prepared data set.
- an information processing device including a processor uses a feature selection method such as a filter method to Evaluate the degree of association between each feature and the target variable (stability label) in each of the five domains, and select features with high degree of association in, for example, four or more domains out of the five domains, as features with high domain universality.
- the information processing device focuses on a certain index from all the data, extracts data that satisfies a specific condition as a subset, and evaluates the domain generalizability of the extracted subset based on the number of features with high domain generality. I do.
- the trained model can be used for a limited population (subset) under the same conditions as during training. Therefore, production stability can be robustly predicted for other domains (useful substance species).
- culture data indicators that are effective for limiting prediction targets include, for example, antibody production amount, integrated viable cell density, and lactic acid concentration. It was confirmed that it is possible to predict production stability with high accuracy.
- the useful substance is not limited to antibodies, but may also be antibody-like proteins.
- the useful substance may be any of proteins, peptides, and viruses that are raw materials for pharmaceuticals.
- the clone producing the useful substance may be a vertebrate-derived cell.
- a clone may be, for example, a mammalian-derived cell.
- the clone may be a CHO cell or a HEK cell.
- Example 2 Examples 1 to 3 to which the technology of the present disclosure is applied will be described below.
- the configuration common to each of Examples 1 to 3 is as follows. That is, the useful substance is an antibody, and the producing cells are CHO cells. Multiple types of clones were prepared for each of the five types of antibody-producing CHO cell clones as evaluation samples, and 100 types were analyzed using RNA sequence (RNA-Seq) analysis from the total gene expression level measured in a two-week standard test. Using a logistic regression model that selects the gene expression level as an explanatory variable and classifies it into two classes, stable or unstable, as a learning device, we perform 5-fold cross validation to train (learn) the predictive model and evaluate its performance.
- RNA-Seq RNA sequence analysis
- the 5-fold cross-validation was performed by dividing each of the five antibody species to evaluate the performance using unlearned antibody species. That is, data sets of four antibody species were used as training (learning) data, and the remaining one antibody species data set was used as test data for performance evaluation.
- FIG. 8 is a chart showing examples of the number of clones and stability labeling of five types of antibody-producing CHO cells prepared as evaluation samples.
- Example 1 In Example 1, an example will be described in which stability prediction is performed with the prediction target limited to "relatively high-producing clones.”
- the term "relatively high-producing clone” means a clone that produces a relatively high amount of a useful substance.
- limiting the clones to be trained corresponds to limiting the clones to be predicted by the prediction model in training, that is, to limiting the clones to be predicted by the prediction model.
- the method for limiting the clones for training is to focus on the "antibody production amount" from the culture data of all 182 clones during the standard test, search for a threshold value that will increase the prediction performance of the prediction model, and then select a threshold value for each antibody type.
- the method was to limit the clones to the top 40% of relative rankings.
- the "antibody production amount” can be, for example, the cumulative amount of antibody production over two weeks (14 days) in a standard test. Alternatively, it may be the cumulative amount of antibody production over a certain period, for example, 10 days, during a standard test, or may be divided by the measurement period to obtain the antibody production amount per unit time.
- “Top 40%” is an example of a threshold value.
- FIG. 9 is a chart showing the number of clones whose antibody production amount falls within the top 40% of the relative ranking for each antibody type and an example of assigning stability labels.
- FIG. 9 shows examples of a total of 73 clones corresponding to the top 40% of relative rankings for each antibody type.
- Five-fold cross-validation was performed using a data set for each antibody species including training data in which gene expression data during standard testing of 73 clones shown in FIG. 9 and stability labels were linked.
- the predictive performance of the trained predictive model had a PRAUC value of 0.743.
- Example 2 In Example 2, an example will be described in which stability prediction is performed with the prediction target limited to "clones with relatively high cell density.”
- a method for limiting the clones to be trained for training a prediction model when performing stability prediction by limiting the prediction targets to "clones with relatively high cell density” will be described.
- IVCD integral viable cell density
- the "clone with relatively high cell density” can be obtained, for example, based on the “integral viable cell density (IVCD)” for 2 weeks (14 days) in a standard test. Alternatively, it may be obtained based on the “integral viable cell density (IVCD)" over a certain period of time, for example 10 days, during a standard test. “Top 60%” is an example of a threshold value.
- FIG. 10 is a chart showing the number of clones whose integrated viable cell density value falls within the top 60% of the relative ranking for each antibody type and an example of assigning stability labels.
- FIG. 10 shows examples of a total of 109 clones corresponding to the top 60% of relative rankings for each antibody type.
- Five-fold cross-validation was performed using a data set for each antibody species, including training data in which gene expression data and stability labels during standard testing of 109 clones shown in FIG. 10 were linked.
- the predictive performance of the trained predictive model had a PRAUC value of 0.647. That is, it was confirmed that the performance of the prediction model in which the prediction target was limited according to Example 2 was higher in accuracy than the PRAUC (0.503) of the prediction model according to the comparative example in which the prediction target was not limited.
- Example 3 In Example 3, an example in which stability prediction is performed limited to "clones with relatively high lactic acid concentration" will be described.
- a method for limiting clones to be trained for training a prediction model when performing stability prediction by limiting the prediction targets to "clones with relatively high lactic acid concentration” will be described.
- the "lactic acid concentration" of each clone is obtained by using the median value of the "lactic acid concentration" of the culture solution measured at each time point, for example, every day, as a representative value.
- FIG. 11 is a chart showing examples of the number of clones whose lactic acid concentration value falls within the top 40% of the relative ranking for each antibody type and the assignment of stability labels.
- FIG. 11 shows examples of a total of 72 clones corresponding to the top 40% of relative rankings for each antibody type. The reason why the number of clones is one less than that in FIG. 9 is because there was data missing for one clone in the measurement of lactic acid concentration.
- stability prediction according to the present disclosure is considered to be practical because it can be implemented at low cost by limiting it to targets that can be predicted with high accuracy.
- FIG. 12 is a block diagram showing the functional configuration of the information processing device 10 according to the embodiment.
- the information processing device 10 includes a data acquisition section 12, a prediction target limiting section 14, a production stability prediction model 16, and a processing result output section 18.
- Various functions of the information processing device 10 can be realized by a combination of computer hardware and software.
- the physical form of the information processing device 10 is not particularly limited, and may be a server computer, a workstation, a personal computer, a tablet terminal, or the like.
- the data acquisition unit 12 acquires various data including culture data and gene expression data of one or more types of clones that produce useful substances.
- the prediction target limiting unit 14 includes a culture data analysis unit 20 and a limiting condition determining unit 22, and analyzes the input culture data of one or more types of clones to limit clones to be predicted.
- the culture data analysis unit 20 analyzes culture data.
- the limiting condition determination unit 22 limits the target using a threshold value based on the analysis result of the culture data. Note that, for convenience of explanation, the culture data analysis section 20 and the limiting condition determining section 22 are described separately, but the limiting condition determining section 22 may be included in the culture data analyzing section 20. Further, it may be understood that the culture data analysis section 20 functions as the prediction target limiting section 14.
- the culture data analysis unit 20 can execute a process of determining an index and a threshold value for limiting prediction targets from the input data set.
- the indicators and threshold values that serve as the limiting conditions for prediction targets may be set based on the analysis results by the culture data analysis unit 20, or may be set based on the results of search processing using another information processing device (not shown), etc. This may be set in the prediction target limiting unit 14 as known information that is grasped in advance by.
- a machine learning model is applied to the production stability prediction model 16.
- the production stability prediction model 16 receives input of current gene expression data of the clone to be predicted, predicts the production stability of the clone based on the input gene expression data, and outputs a stability label 2 It may be a classification model.
- the production stability prediction model 16 is trained using target-limited training data by the method explained in the right diagram F5B of FIG.
- the gene expression data input to the production stability prediction model 16 includes one or more gene expression levels.
- the gene expression data input to the production stability prediction model 16 may include data on the expression levels of a plurality of genes.
- the feature quantities used as explanatory variables may be selected by a known feature quantity selection method.
- the processing result output unit 18 outputs processing results including the prediction results of the production stability prediction model 16.
- the processing result output unit 18 may be configured to perform at least one of, for example, displaying the processing results, recording the processing results in a database or the like, and printing the processing results.
- FIG. 13 is a block diagram showing an example of the hardware configuration of the information processing device 10.
- the processing functions of the information processing device 10 are realized using one computer, but the processing functions of the information processing device 10 can also be realized by a computer system configured using a plurality of computers. Good too.
- the information processing device 10 includes a processor 102, a computer readable medium 104 that is a non-temporary tangible object, a communication interface 106, an input/output interface 108, and a bus 110.
- Processor 102 is connected to computer readable media 104, communication interface 106, and input/output interface 108 via bus 110.
- the processor 102 includes a CPU (Central Processing Unit).
- the processor 102 may include a GPU (Graphics Processing Unit).
- Computer-readable medium 104 includes memory 112, which is a main storage device, and storage 114, which is an auxiliary storage device.
- Computer-readable medium 104 may be, for example, a semiconductor memory, a hard disk drive (HDD) device, a solid state drive (SSD) device, or a combination of these.
- Computer-readable medium 104 is an example of a "storage device" in this disclosure.
- the computer-readable medium 104 includes a data storage area 120 that stores various data such as culture data and gene expression data of one or more types of clones. Further, the computer-readable medium 104 stores a plurality of programs including the prediction target limitation program 140, the production stability prediction model 16, the processing result output program 180, and the display control program 190, as well as data.
- the term "program” includes the concept of a program module and includes instructions similar to a program.
- the processor 102 functions as various processing units by executing instructions of programs stored in the computer-readable medium 104.
- the prediction target limitation program 140 includes instructions for executing processing for analyzing culture data and limiting prediction targets.
- the prediction target limitation program 140 may include a culture data analysis program 142 and a limitation condition determination program 144.
- the culture data analysis program 142 includes instructions for executing processing for analyzing culture data of one or more types of clones.
- the culture data analysis program 142 may include an instruction to execute a process of searching for an index and a threshold value for narrowing down prediction targets from the data set.
- the limiting condition determination program 144 utilizes the analysis results of the culture data analysis program 142 and includes an instruction to execute a process of limiting prediction targets based on an index and a threshold value defined as limiting conditions.
- the production stability prediction model 16 includes an instruction to receive input of gene expression data of a clone related to a prediction target that satisfies the limiting conditions and execute a process of predicting production stability.
- the processing result output program 180 includes instructions for executing processing to output processing results including the production stability predicted by the production stability prediction model 16.
- the display control program 190 includes instructions for generating display signals necessary for display output to the display device 154 and for controlling the display of the display device 154.
- the communication interface 106 performs communication processing with an external device by wire or wirelessly, and exchanges information with the external device.
- the information processing device 10 is connected to a communication line (not shown) via a communication interface 106.
- the communication line may be a local area network, a wide area network, or a combination thereof.
- the communication interface 106 can play the role of a data acquisition unit that accepts data input.
- the information processing device 10 may include an input device 152 and a display device 154.
- the input device 152 is configured by, for example, a keyboard, a mouse, a multi-touch panel, or other pointing device, a voice input device, or an appropriate combination thereof.
- the display device 154 is configured by, for example, a liquid crystal display, an organic electro-luminescence (OEL) display, a projector, or an appropriate combination thereof.
- Input device 152 and display device 154 are connected to processor 102 via input/output interface 108 .
- the input device 152 and the display device 154 may be integrally configured like a touch panel, or the information processing device 10, the input device 152, and the display device 154 may be integrally configured like a touch panel tablet terminal. may be configured.
- FIG. 14 is a block diagram illustrating an example of the hardware configuration of a machine learning device 300 that executes machine learning processing to generate the production stability prediction model 16.
- a machine learning device 300 that executes machine learning processing to generate the production stability prediction model 16.
- the processing functions of the machine learning device 300 are realized using one computer, but the processing functions of the machine learning device 300 can also be realized by a computer system configured using multiple computers. Good too.
- the machine learning device 300 includes a processor 302, a computer readable medium 304 that is a non-transitory tangible object, a communication interface 306, an input/output interface 308, and a bus 310.
- Computer readable medium 304 includes memory 312 and storage 314.
- Processor 302 is connected to computer readable media 304, communication interface 306, and input/output interface 308 via bus 310.
- Input device 352 and display device 354 are connected to bus 310 via input/output interface 308.
- the hardware configuration of the machine learning device 300 may be similar to the corresponding elements of the information processing device 10 described in FIG. 6.
- the machine learning device 300 may be a server computer, a personal computer, or a workstation.
- Machine learning device 300 is an example of a "system including one or more processors" in the present disclosure.
- the machine learning device 300 is connected to a communication line (not shown) via a communication interface 306, and is communicably connected to an external device such as a data storage unit 550.
- the data storage unit 550 includes a storage in which datasets including a plurality of training data are stored.
- the data storage unit 550 may store a dataset that includes all data of multiple domains as illustrated in FIG. 6, or a dataset that includes data of only samples limited to prediction targets. It may be saved. Note that the data storage unit 550 may be constructed in the storage 314 within the machine learning device 300.
- the computer readable medium 304 stores a plurality of programs, data, etc. including a prediction target limited program 320, a learning processing program 330, and a display control program 340.
- the prediction target limitation program 320 may be similar to the prediction target limitation program 140 described in FIG. 12.
- the display control program 340 may be similar to the display control program 190 described in FIG. 12.
- the computer readable medium 304 includes a prediction target data storage area 322.
- the prediction target data storage area 322 stores training data corresponding to limited prediction targets. Corresponding training data may be timely sampled by the prediction target limitation program 320 from the datasets stored in the data storage unit 550, or a dataset containing only prediction targets may be extracted in advance as a subset.
- the learning processing program 330 includes a data acquisition program 400, a prediction model 410 that is a machine learning model, a loss calculation program 430, and an optimizer 440.
- the data acquisition program 400 includes instructions for executing the process of acquiring training data from the prediction target data storage area 322. Training data acquired via the data acquisition program 400 is input to the prediction model 410.
- the loss calculation program 430 includes instructions for executing processing for calculating a loss indicating the error between the predicted value of the stability label output from the prediction model 410 and the correct stability label.
- the optimizer 440 includes instructions for calculating an update amount of the parameters of the prediction model 410 from the calculated loss and executing a process of updating the parameters of the prediction model 410.
- the optimizer 440 may optimize parameters using a method such as, for example, stochastic gradient descent (SGD).
- SGD stochastic gradient descent
- FIG. 15 is a flowchart illustrating an example of a machine learning method executed by the machine learning device 300.
- the explanation will be given assuming that a data set used for machine learning as illustrated in FIG. 6 is prepared.
- the processor 302 acquires culture data from the prepared data set.
- the processor 302 analyzes the culture data and limits training targets.
- the processor 302 may select data of a target sample that satisfies the limiting conditions or data of a non-target sample that does not meet the limiting conditions, according to a prespecified index and threshold value of the culture data.
- the data may be searched for an index and a threshold value that serve as limiting conditions, and the data of the target sample and the data of the non-target sample may be sorted out.
- step S106 the processor 302 performs machine learning using only the data of the clones that meet the limiting conditions, and trains the predictive model 410. That is, the processor 302 inputs the gene expression data of the sample that satisfies the limiting conditions into the prediction model 410, and calculates a loss indicating the error between the predicted value of the stability label output from the prediction model 410 and the correct stability label. calculate. The processor 302 calculates the update amount of the parameters of the prediction model 410 based on the calculated loss, and updates the parameters. In this way, the processor 302 trains the predictive model 410 so that the output (predicted value) from the predictive model 410 for the data input to the predictive model 410 approaches the correct stability label. Note that the parameters of the prediction model 410 may be updated in mini-batch units.
- the processor 302 determines whether to end learning.
- the learning end condition may be determined based on the loss value, or may be determined based on the number of parameter updates.
- the condition for terminating learning may be that the loss converges within a prescribed range.
- the learning end condition may be that the number of updates reaches a specified number of times.
- a data set for evaluating the performance of the model may be prepared separately from the training data, and it may be determined whether learning is to be completed based on an evaluation value using the evaluation data.
- step S108 determines whether the determination result in step S108 is No. If the determination result in step S108 is No, the processor 302 returns to step S106 and continues the learning process. On the other hand, if the determination result in step S108 is Yes, the processor 302 ends the flowchart of FIG.
- the learned prediction model 410 is incorporated into the information processing device 10 as the production stability prediction model 16.
- the machine learning method executed by the machine learning device 300 can be understood as a method of generating the production stability prediction model 16, and is an example of the prediction model generation method in the present disclosure.
- FIG. 16 is a flowchart illustrating an example of an information processing method executed by the information processing apparatus 10.
- the processor 102 acquires culture data measured for clones that produce useful substances.
- the processor 102 may automatically obtain data from a data storage server (not shown) or the like, or may receive data specification input via a user interface and obtain data about the specified clone. .
- step S204 the processor 102 analyzes the culture data and limits prediction targets.
- the processor 102 limits the prediction targets by applying the same limiting conditions as those used to limit the training targets when training the production stability prediction model 16. Note that after the prediction targets are limited in step S204, gene expression data is measured for the clones corresponding to the prediction targets, thereby reducing workload and Cost reduction is possible.
- step S206 the processor 102 inputs the gene expression data of the clone corresponding to the prediction target into the production stability prediction model 16, and uses the production stability prediction model 16 to predict stability.
- step S208 the processor 102 outputs the prediction result output from the production stability prediction model 16. Based on the predicted results of production stability, production clones can be selected.
- step S208 the processor 102 ends the flowchart of FIG. 16.
- a program that causes a computer to implement part or all of the processing functions in each of the information processing device 10 and the machine learning device 300 according to the embodiment is stored on an optical disk, a magnetic disk, or non-temporary information such as a semiconductor memory or other tangible object. It is possible to record the program on a computer readable medium which is a storage medium and provide the program through this information storage medium.
- the program signal instead of providing the program by storing it in a tangible, non-transitory computer-readable medium, it is also possible to provide the program signal as a download service using a telecommunications line such as the Internet.
- part or all of the processing functions in each of the above-mentioned devices may be realized by cloud computing, and it is also possible to provide it as SaaS (Software as a Service).
- SaaS Software as a Service
- ⁇ About the hardware configuration of each processing unit In the information processing device 10, a data acquisition unit 12, a prediction target limiting unit 14, a stability prediction unit including a production stability prediction model 16, a processing result output unit 18, a culture data analysis unit 20, a limiting condition determination unit 22, and a machine learning device
- the hardware structure of a processing unit that executes various processes such as a learning unit, a loss calculation unit, a parameter update amount calculation unit, a parameter update unit, etc. including the prediction model 410 in 300 is, for example, as shown below.
- processors such as
- processors include programmable logic, which is a processor whose circuit configuration can be changed after manufacturing, such as CPU, GPU, and FPGA (Field Programmable Gate Array), which are general-purpose processors that execute programs and function as various processing units.
- programmable logic which is a processor whose circuit configuration can be changed after manufacturing
- CPU CPU
- GPU GPU
- FPGA Field Programmable Gate Array
- PLDs Programmable Logic Devices
- ASICs Application Specific Integrated Circuits
- One processing unit may be composed of one of these various processors, or may be composed of two or more processors of the same type or different types.
- one processing unit may be configured by a plurality of FPGAs, a combination of a CPU and an FPGA, or a combination of a CPU and a GPU.
- the plurality of processing units may be configured with one processor.
- one processor is configured with a combination of one or more CPUs and software, as typified by computers such as clients and servers. There is a form in which a processor functions as multiple processing units.
- processors that use a single IC (Integrated Circuit) chip, such as System On Chip (SoC), which implements the functions of an entire system including multiple processing units.
- SoC System On Chip
- various processing units are configured using one or more of the various processors described above as a hardware structure.
- circuitry that is a combination of circuit elements such as semiconductor elements.
- the production stability of the clones to be predicted can be predicted with high accuracy.
- RNA-Seq analysis can be performed only on the clones to be predicted, so costs can be reduced compared to the case where genetic analysis is performed on all clones.
Abstract
有用物質を産生するクローンの産生安定性を高精度かつ低コストに予測できる方法、情報処理装置、プログラムおよび予測モデル生成方法を提供する。1つ以上のプロセッサが、有用物質を産生するクローンについて1種類以上のクローンの培養データを取得することと、培養データを解析して予測対象のクローンを限定することと、予測対象のクローンについて測定されたデータを用いて、予測対象のクローンによる有用物質の産生安定性を予測することと、を実行する。産生安定性は、培養開始時と所定期間培養後とにおける有用物質の産生量の変化の有無により定義されてよい。
Description
本開示は、有用物質を産生するクローンの産生安定性を予測する情報処理技術および機械学習技術に関する。
近年、従来の化学合成では作製が困難であった複雑な有用物質を細胞に作らせる製造法の産業利用が進んでいる。その一例がバイオ医薬品であり、世界の医薬品売り上げランキングTOP10では半数以上の品目数で、約3分の2の売上額を占めている。バイオ医薬品は、従来の低分子医薬品に比べて、複雑なタンパク質等を活用したものであり、人工的に化学合成するのは非常に難しい。そのため、バイオ医薬品の一例である抗体医薬品は、例えばCHO細胞(Chinese Hamster Ovary cells)等に所望のヒトタンパク質に対応する遺伝子を挿入し、細胞機能によって所望タンパク質を産生させ、これを抽出および精製して抗体医薬品を製造する生産方法が広く普及している。
上述の様な細胞への遺伝子の挿入は、細かい制御が不可能なため、大量の細胞に一斉に遺伝子を挿入するのが一般的である。その際、生成される個々の細胞は遺伝子の挿入位置がランダムであることを踏まえ、医薬品としての抗体を安定化し、品質保証するため、多くの規制当局から、遺伝子挿入後に抗体産生を担う細胞が単一細胞由来であり、継代培養によってその性質が変化しないこと、所謂モノクロナリティが求められている。
そこで、遺伝子の挿入位置がランダムな個々の細胞から単一の細胞を抽出し、その単一細胞を増殖させて細胞クローン(以下、クローンという)を作成し、このクローンに抗体を産生させることによってモノクロナリティを担保している。本発明のクローンとは、遺伝子的に同一な細胞の集団、または、その集団を構成する細胞を意味する。
一方で、産業化においては、良質な抗体産生能を持つクローンが求められている。ここで、良質な抗体産生能とは、現時点において高い抗体産生能力があること、および、長期の培養期間においても抗体産生能力が安定していることである。前述の様に、遺伝子の挿入位置がランダムな個々の細胞から作成されるクローンは抗体産生能力にばらつきがあり、クローン毎に良質な抗体産生能かを判別する必要がある。現時点で抗体産生能力が高い高産生クローンであるか否かは2週間の規格試験によって判別可能であるが、長期の培養期間において抗体産生能力が安定しているか否かの産生安定性の判別については、実際に数か月間程度の長期培養による実験的な検証(安定性試験)が必須となっている。
このような背景の下、特許文献1では、現時点で得られるクローンの遺伝子発現データから数か月先のクローンの組換えタンパク質の産生安定性を予測する手法が提案されている。また、非特許文献1では、クローン開発の早期の段階において組換えタンパク質の安定発現を予測できるマーカー遺伝子を同定し、クローン開発の早期段階において組換えタンパク質の産生安定性を予測する方法が提案されている。
Uros Jamnikar, Petra Nikolic, Ales Belic, Marjanca Blas, Dominik Gaser, Andrej Francky, Holger Laux, Andrej Blejec, Spela Baebler and Kristina Gruden,"Transcriptome study and identification of potential marker genes related to the stable expression of recombinant proteins in CHO clones" BMC Biotechnology volume 15, Article number 98 (2015).
しかし、特許文献1に記載の方法は、予測精度の点で十分とは言えない。また、多数のクローンに対する遺伝子解析などは一般に高額な費用を要するため、組換えタンパク質の産生安定性を予測することにより得られるコストダウン効果を、予測のための遺伝子解析などによるコストアップが減退させるという問題もあった。コスト抑制のために、産生安定性の予測対象のクローン数を絞り込むことが考えられるが、そうすると予測対象中の産生安定性の高いクローン数も減ることになり、結果的に得られる産生安定性の高いクローン数が少なくなってしまうことになり、単純に予測対象のクローン数を絞り込むことも難しかった。
本開示が解決しようとする第1の課題は、高い精度でクローンにおける有用物質の産生安定性を予測する手段を提供することである。第2の課題は、クローンにおける有用物質の産生安定性の予測コストを低減する手段を提供することである。
本開示はこのような事情を鑑みてなされたものであり、有用物質を産生するクローンの産生安定性を高精度かつ低コストに予測することができる方法、情報処理装置、プログラムおよび予測モデル生成方法を提供することを目的とする。
本開示の第1態様に係る方法は、有用物質を産生するクローンの産生安定性を予測する方法であって、1つ以上のプロセッサが、1種類以上のクローンの培養データを取得することと、培養データを解析して予測対象のクローンを限定することと、予測対象のクローンについて測定されたデータを用いて、予測対象のクローンによる有用物質の産生安定性を予測することと、を実行する。
第1態様によれば、培養データから得られる情報を基に予測対象を限定して産生安定性の予測を行うため、対象を限定しない場合と比較して、高い精度で産生安定性を予測することが可能になる。また、予測対象であるクローンに限定して予測に必要なデータの取得を行えばよいため、コスト抑制が可能である。
予測する産生安定性は、実際には数か月間の長期培養によって実験的に検証されている産生安定性と同様に、数か月先の将来のクローンの状態を表すものであってよい。例えば、長期培養後も初期の産生量が維持されているか否かという観点から産生安定性が評価されてよい。第1態様によれば、長期培養が必要な安定性試験の結果を高精度かつ低コストで予測できる。
本開示の第2態様に係る方法は、第1態様に係る方法において、産生安定性は、培養開始時と所定期間培養後とにおける有用物質の産生量の変化の有無により定義される構成であってもよい。
本開示の第3態様に係る方法は、第1態様または第2態様に係る方法において、1つ以上のプロセッサが、培養データから得られる指標と、指標に関する閾値とを設定することとを含み、指標の値と閾値とに基づき予測対象を限定する構成であってもよい。
本開示の第4態様に係る方法は、第3態様に係る方法において、閾値は、産生安定性の予測精度が予測対象を限定しない場合よりも高くなるように調整される構成であってもよい。
本開示の第5態様に係る方法は、第3態様または第4態様に係る方法において、閾値は、指標の値についての順位を用いて定義される構成であってもよい。なお、「順位」は、複数のクローンについての指標の値を降順に並べた場合の順位と、昇順に並べた場合の順位とがあり得る。例えば、閾値は、複数のクローンを含む集団における相対順位の上位40%などのように定義されてよい。
本開示の第6態様に係る方法は、第3態様から第5態様のいずれか一態様に係る方法において、予測対象は、指標の値の上位集団であってもよい。
本開示の第7態様に係る方法は、第3態様から第6態様のいずれか一態様に係る方法において、指標は、有用物質の産生量であってもよい。
本開示の第8態様に係る方法は、第3態様から第6態様のいずれか一態様に係る方法において、指標は、積分生存細胞密度であってもよい。
本開示の第9態様に係る方法は、第3態様から第6態様のいずれか一態様に係る方法において、指標は、乳酸濃度であってもよい。
本開示の第10態様に係る方法は、第1態様から第9態様のいずれか一態様に係る方法において、産生安定性の予測に用いるデータは、1つ以上の遺伝子発現レベルを含む構成であってもよい。
本開示の第11態様に係る方法は、第1態様から第10態様のいずれか一態様に係る方法において、1つ以上のプロセッサが、予測対象のデータの入力を受けて、安定または不安定の2クラス分類を行うモデルを用いて産生安定性を予測する構成であってもよい。
本開示の第12態様に係る方法は、第11態様に係る方法において、モデルは、予測対象のクローンと同様の限定をした訓練用のクローンについてのデータと正解の安定性ラベルとが関連付けされた複数の訓練データを用いた機械学習によって訓練されたモデルであってもよい。
本開示の第13態様に係る方法は、第12態様に係る方法において、複数の訓練データは、産生する有用物質が異なる複数種類のクローンについての訓練データを含み、1つ以上のプロセッサが、モデルの訓練に使用された有用物質とは別の有用物質を産生するクローンについての産生安定性を予測する構成であってもよい。
本開示の第14態様に係る方法は、第1態様から第13態様のいずれか一態様に係る方法において、有用物質は、医薬品原料であるタンパク質、ペプチド、およびウイルスのうちいずれかであってもよい。
本開示の第15態様に係る方法は、第1態様から第14態様のいずれか一態様に係る方法において、有用物質は、抗体、または抗体様タンパク質であってもよい。
本開示の第16態様に係る方法は、第1態様から第15態様のいずれか一態様に係る方法において、クローンは、脊椎動物由来細胞であってもよい。
本開示の第17態様に係る方法は、第1態様から第15態様のいずれか一態様に係る方法において、クローンは、哺乳類由来細胞であってもよい。
本開示の第18に係る方法は、第1態様から第15態様のいずれか一態様に係る方法において、クローンは、CHO細胞またはHEK細胞(Human Embryonic Kidney cells)であってもよい。
本開示の第19態様に係る情報処理装置は、1つ以上のプロセッサと、1つ以上のプロセッサに実行させる命令が記憶される1つ以上の記憶装置と、を備え、1つ以上のプロセッサは、有用物質を産生するクローンについて1種類以上のクローンの培養データを取得し、培養データを解析して予測対象のクローンを限定し、予測対象のクローンについて測定されたデータを用いて、予測対象のクローンによる有用物質の産生安定性を予測する。
第19態様に係る情報処理装置について、第2態様から第18態様のいずれか一態様の方法と同様の態様を含む構成とすることができる。
本開示の第20態様に係るプログラムは、コンピュータに、有用物質を産生するクローンについて1種類以上のクローンの培養データを取得する機能と、培養データを解析して予測対象のクローンを限定する機能と、予測対象のクローンについて測定されたデータを用いて、予測対象のクローンによる有用物質の産生安定性を予測する機能と、を実現させる。
第20態様に係るプログラムについて、第2態様から第18態様のいずれか一態様の方法と同様の態様を含む構成とすることができる。
本開示の第21態様に係る予測モデル生成方法は、有用物質を産生するクローンの産生安定性を予測する機能をコンピュータに実現させる予測モデルを生成する予測モデル生成方法であって、1つ以上のプロセッサを含むシステムが、1種類以上のクローンの培養データを取得することと、培養データを解析して予測対象のクローンを限定することと、予測対象に該当するクローンについて測定されたデータと正解の安定性ラベルとが関連付けされた複数の訓練データを用いて機械学習を行い、データの入力に対する予測モデルの出力が正解の安定性ラベルに近づくように予測モデルを訓練することと、を含む。
第21態様に係る予測モデル生成方法について、第2態様から第18態様のいずれか一態様の方法と同様の態様を含む構成とすることができる。
本開示によれば、培養データを解析して得られる情報を基に予測対象が適切に限定され、有用物質を産生するクローンの産生安定性を高精度に予測することが可能になる。また、本開示によれば、予測対象が限定されることにより、産生安定性の予測コストを抑制でき、低コストで予測が可能である。
以下、添付図面に従って本発明の好ましい実施形態について詳細に説明する。
《抗体医薬品の生産工程の概要》
バイオ医薬品の中でも薬効面と安全面の両立性の高さから市場が拡大している抗体医薬品は、複雑な構造を持つタンパク質である抗体を安定的に産生できる動物細胞のクローンを用いて生産されている。以下では、有用物質として抗体を例にとり説明する。図1は、抗体医薬品の生産工程の概要を示す説明図である。抗体医薬品を生産するまでのプロセスは、[1]クローン作製フェーズと、[2]プロセス開発フェーズと、[3]GMP(Good Manufacturing Practice)製造フェーズと、を含む。
バイオ医薬品の中でも薬効面と安全面の両立性の高さから市場が拡大している抗体医薬品は、複雑な構造を持つタンパク質である抗体を安定的に産生できる動物細胞のクローンを用いて生産されている。以下では、有用物質として抗体を例にとり説明する。図1は、抗体医薬品の生産工程の概要を示す説明図である。抗体医薬品を生産するまでのプロセスは、[1]クローン作製フェーズと、[2]プロセス開発フェーズと、[3]GMP(Good Manufacturing Practice)製造フェーズと、を含む。
クローン作製フェーズは、抗体医薬品の生産に適した動物細胞に対して、ベクターを加えて遺伝子組み換えを行い、複数のクローンの候補を作製する工程と、これら複数の候補の中から、抗体の産生量、細胞増殖性、繰り返し増殖しても細胞特性が変化しない品質安定性などの点で優れたクローンをスクリーニングする工程と、を含む。
プロセス開発フェーズは、スクリーニングしたクローンを用いて、GMP製造に必要な生産プロセス(培養条件、精製条件など)を開発するフェーズである。
GMP製造フェーズでは、確立した生産プロセスのもと、クローンを培養して増殖させ、クローンに抗体を産生させる。さらに、その抗体を精製して製剤化することにより、抗体医薬品が出来上がる。
抗体をクローンに産生させる場合、長期間にわたってその産生性が変化しないこと(安定であること)が求められている。そのため、なるべく多種類のクローンを作製しておき、そこから産生性が安定なクローンを選抜することが行われるが、従来は、数か月の連続培養を要する実験的な検証が必要なため、負荷が高くなっている。
図2は、クローンによる抗体産生量の変化の例を示すグラフである。縦軸は抗体の産生性を表し、横軸は経過時間(タイムポイント)を表す。「抗体の産生性」は、クローンが産生する抗体の単位時間当たりの抗体産生量で表される。
図2には、クローンが産生する抗体の量が長期間(2~3か月)にわたってどのくらい変化するかをプロットしたグラフが示されている。グラフG1は、産生性が安定しているクローンについての抗体産生量の変化を示すグラフである。グラフG2は産生性が不安定なクローンについての抗体産生量の変化を示すグラフである。グラフG1に示すように、産生性が安定しているクローンは、現時点から2~3か月経過しても産生性が概ね変わらず、現時点と概ね変わらない産生性を維持することができる。これに対し、グラフG2に示すように、産生性が不安定なクローンは2~3か月の間に次第に産生性が低下する。
本発明では、「現時点」とは、2週間の規格試験時点、または、規格試験の終了した時点、すなわち、産生安定性を判別するための培養が開始される時点である。また、「現時点の抗体の産生性」とは、2週間の規格試験におけるクローンが産生する単位時間あたりの抗体産生量である。
遺伝子導入により抗体を産生する細胞を作った場合に、図2に示すように、安定なクローンと不安定なクローンとの両方のものが作られてしまう。したがって、クローン作製フェーズにおいては、多種類のクローンを作製し、その中からグラフG1のような振る舞いを示す産生性が安定なクローンを選抜することが行われる。
図2のような産生性の振る舞いは、クローンの種類によって様々であり、従来は、クローンに作らせる抗体の種類が変わる度に、図2と同じような実験を行ってそれぞれのクローンの産生安定性を評価しなければならなかった。
これに対し、本開示の実施形態では、現時点におけるクローンから得られる情報を基に、数か月先の抗体の産生安定性を精度よく予測する仕組みを提案する。ここで、「現時点におけるクローンから得られる情報」とは、2週間の規格試験においてクローンから得られる情報である。予測の目的変数である抗体の産生安定性とは、現時点と数か月の期間培養後との抗体の産生量の変化の有無で定義することができる。ここでの「数か月」とは例えば2か月以上の期間であり、例示的には2~3か月であってよい。また、継代を所定の回数行うまでの期間としてもよい。期間の設定は、クローンの増殖能力に基づいて決めてもよいし、実際に抗体の製造を行う際のクローンの培養期間に基づいて決めてもよい。「現時点」は図2のグラフの左端に示す培養初期の時点、つまり、2週間の規格試験が終了した時点であり、抗体の産生安定性を判別するための培養が開始される時点である。産生性が「安定」であるとは、現時点と数か月先とで抗体の産生量の変化がないことである。「変化がない」とは、変化の量が許容範囲内であり、実質的に変化がないものと見なしうる場合を含む。産生性が「不安定」であるとは、現時点と数か月先とで抗体の産生量の変化があること、多くの場合は産生量が低下することである。産生性の変化があるとみなす閾値は、任意に設定できるが、例えば現時点の産生量に対して±30%や±20%であってよい。
《未知クローンへの汎化性能について》
図3は、本実施形態によって実現される安定性予測AI(Artificial Intelligence)の役割を説明する説明図である。図3に示すように、クローン作製フェーズでは、宿主細胞に対して、作りたい有用物質の遺伝子の設計図を導入する遺伝子導入が行われる。例えば、宿主細胞に対して有用物質Aを作る設計図を遺伝子導入した場合は、有用物質Aを産生する細胞が得られる。このような産生細胞は確率的にできるため、有用物質Aを産生しない細胞や産生量が不十分な細胞も作られてしまう。このため、まずはこの段階で簡便な試験を行い、有用物質Aを十分に産生し得る高産生なクローンを選抜することが行われる。
図3は、本実施形態によって実現される安定性予測AI(Artificial Intelligence)の役割を説明する説明図である。図3に示すように、クローン作製フェーズでは、宿主細胞に対して、作りたい有用物質の遺伝子の設計図を導入する遺伝子導入が行われる。例えば、宿主細胞に対して有用物質Aを作る設計図を遺伝子導入した場合は、有用物質Aを産生する細胞が得られる。このような産生細胞は確率的にできるため、有用物質Aを産生しない細胞や産生量が不十分な細胞も作られてしまう。このため、まずはこの段階で簡便な試験を行い、有用物質Aを十分に産生し得る高産生なクローンを選抜することが行われる。
その後、従来であれば、図2で説明したように、2~3か月間の安定性試験を行い、数か月にわたって有用物質Aを作り続けられるかどうかを確認し、産生安定性のあるクローンを選抜する。
本実施形態では、従来の安定性試験に代替する手段として、安定性予測AIを構築し、現時点でのクローンの状態、つまり2週間の規格試験におけるクローンの状態を測定して得られるプロファイルを基に、安定性予測AIによって2~3か月後の状態(産生性の変化)を予測する。
細胞に産生させる有用物質(例えば抗体)の種類は、目的によって多種多様であることから、細胞が産生する有用物質の種類によらず、産生安定性を予測できるモデルを構築することが望まれる。すなわち、未知の抗体種に対してロバストに抗体産生安定性を予測するモデルが好ましい。
安定性予測AIに適用するモデルを学習する際には、対象とする有用物質を事前に知ることはできず、モデルの学習時に使用した有用物質の種類と、学習後にモデルに予測させる対象のクローンが産生する有用物質とは別の種類となり得る。つまり、未知の有用物質種に対してロバストに産生安定性を精度よく予測するモデルが好ましく、有用物質種をドメインとしたドメイン汎化性のある予測モデルを構築することが好ましい。
《産生安定性を予測する機械学習モデルの概要》
本実施形態では、クローン作製フェーズにおいて、現時点のクローンの情報から、2~3か月先の産生性の変化の有無を推定(予測)すること、すなわち、有用物質の産生安定性を予測することを可能とする安定性予測AIを構築する。より具体的には、クローンの現時点(規格試験時)の遺伝子発現データの入力を受けて有用物質の産生安定性を示す安定性ラベルを出力するモデルを構築する。より詳しくは、クローンの一部を規格試験に用いるクローンとし、別の一部を遺伝子発現データの取得のための遺伝子解析にかけるクローンとすることで、規格試験に用いるクローンの遺伝子発現データを取得する。安安定性ラベルは、「安定」であることを示す値の「1」または「不安定」であることを示す値の「0」の2値で表すことができる。産生安定性を予測する予測モデルは、「安定」または「不安定」のクラス分類を行う2クラス分類モデルであってよい。
本実施形態では、クローン作製フェーズにおいて、現時点のクローンの情報から、2~3か月先の産生性の変化の有無を推定(予測)すること、すなわち、有用物質の産生安定性を予測することを可能とする安定性予測AIを構築する。より具体的には、クローンの現時点(規格試験時)の遺伝子発現データの入力を受けて有用物質の産生安定性を示す安定性ラベルを出力するモデルを構築する。より詳しくは、クローンの一部を規格試験に用いるクローンとし、別の一部を遺伝子発現データの取得のための遺伝子解析にかけるクローンとすることで、規格試験に用いるクローンの遺伝子発現データを取得する。安安定性ラベルは、「安定」であることを示す値の「1」または「不安定」であることを示す値の「0」の2値で表すことができる。産生安定性を予測する予測モデルは、「安定」または「不安定」のクラス分類を行う2クラス分類モデルであってよい。
遺伝子発現データは、1つ以上の遺伝子レベルを含む。本実施形態に用いる遺伝子発現データは、複数の遺伝子のそれぞれの遺伝子発現レベルを数値化したデータを含む。遺伝子発現データは、例えば、RNA(ribonucleic acid)シーケンス解析によって得ることができる。遺伝子発現量を示す値は、例えば、正の整数をとるカウント値であり、対数変換して特徴量として用いることができる。
図4は、遺伝子発現データを基に産生安定性を予測する機械学習モデルMLMの概念図である。図4の矩形枠RF1の内側には、訓練データのデータセットの例が示されている。図4では、複数のクローンA~Nのそれぞれの現時点(規格試験時)の遺伝子発現データをヒートマップによって可視化した遺伝子発現パターンGEPとして表している。遺伝子発現パターンGEPの横軸は遺伝子の種類を表しており、複数の遺伝子のそれぞれの遺伝子発現レベルが2色のグラデーション(ヒートマップ)によって表現されている。遺伝子発現データに含まれる遺伝子a,b,c,d・・・の種類数は、例えば安定なクローンと不安定なクローンについて全遺伝子発現データを取得し、安定なクローンと不安定なクローン間の2群の統計学的な有意確率を用いて選択した300~400種類が好ましい。さらに遺伝子の種類数を絞り込む場合は、選択した遺伝子を用いて遺伝子の種類数を増減させながら機械学習モデルMLMを実際に訓練し、予測性能が高くなる種類数を探索して、例えば50~100種類の遺伝子に絞り込むことが好ましい。なお、ここでは全遺伝子発現データを取得したが、必ずしも全遺伝子発現データを取得する必要はなく、無作為に一部の遺伝子を選択し、その遺伝子発現データを取得してもよい。図示の制約上ヒートマップの色を表現できないため、代わりに、赤を「R」、青を「B」、白を「W」と表示している。赤(R)は、遺伝子発現レベルが相対的に高いことを表し、青(B)は遺伝子発現レベルが相対的に低いことを表す。白(W)は、遺伝子発現レベルが中間的な値であることを表す。
複数のクローンA~Nのそれぞれは、規格試験後の数か月間の培養による実験的検証に基づき、「安定」または「不安定」であることが確認されており、各クローンA~Nに対して「安定」または「不安定」を示す安定性ラベル(正解ラベル)が付与されている。こうして、複数のクローンA~Nのそれぞれの現時点の遺伝子発現データと正解の安定性ラベルとが関連付け(紐付け)された複数の訓練データを含むデータセットが用意される。そして、複数の訓練データを用いて機械学習モデルMLMを訓練し、機械学習モデルMLMに安定または不安定の遺伝子パターンを学習させる。こうして訓練された学習済み(訓練済み)の機械学習モデルMLMに対して、未知のクローンXの現時点(規格試験時)の遺伝子発現データを入力すると、機械学習モデルMLMは入力された遺伝子発現データから産生安定性を予測し、「安定」または「不安定」のラベルを予測結果として出力する。なお、図4では、未知のクローンXに対して、機械学習モデルMLMが「安定」であると予測した例が示されている。
《実施形態の概要:予測対象を限定して有用物質の産生安定性を予測するモデルを構築する》
有用物質を産生するクローンには様々な特性があるため、種類を問わず全てのクローンの産生安定性を高精度に予測することは難しい。本実施形態では、現時点(規格試験時)の各クローンの培養データから得られる指標に基づき予測対象を限定することにより、高精度な予測を実現する。ここで培養データとは、クローンについて培養装置あるいは細胞を含む培養液を一部サンプリングして専用装置を用いて測定できる一般的なデータである。
有用物質を産生するクローンには様々な特性があるため、種類を問わず全てのクローンの産生安定性を高精度に予測することは難しい。本実施形態では、現時点(規格試験時)の各クローンの培養データから得られる指標に基づき予測対象を限定することにより、高精度な予測を実現する。ここで培養データとは、クローンについて培養装置あるいは細胞を含む培養液を一部サンプリングして専用装置を用いて測定できる一般的なデータである。
図5は、本実施形態に係るクローンの有用物質の産生安定性予測方法の概要を示す説明図である。図5の左図F5Aには予測対象を限定しない場合の比較例を示し、図5の右図F5Bに本実施形態による方法の概要を示す。
左図F5Aの予測対象を限定しない場合について説明する。左図F5Aの矩形枠RF2内には、有用物質A~Dを産生する複数種類のクローンの訓練データを含むデータセットDScが模式的に示されている。このデータセットDScは、各有用物質A~Dについて5クローンずつ、計20クローンの訓練データを含む。ここで訓練データは、20クローンについて、それぞれの規格試験時の遺伝子発現データと正解の安定性ラベルとが関連付け(紐付け)されたデータである。図5の各クローンの下部に表示している「9」、「7」、「6」などの値は、規格試験時の各クローンのある培養データの測定値を表している。なお、測定値ではなく、測定値から取得できる各クローンにおける相対的なレベルを表してもよい。ここでは、左図F5Aについて説明したが、右図F5Bについても同様である。
左図F5Aでは、訓練データを限定せずに、データセットDScの全ての訓練データを用いて機械学習モデルMLMcを訓練し、学習済み(訓練済み)のモデルを用いて未知の有用物質Xを産生する複数種類のクローンの産生安定性を予測することを示している。この場合、予測対象である未知の有用物質Xを産生する複数種類のクローンについても特に限定せず、矩形枠RF3内に示すように、未知の有用物質Xを産生する5種類のクローンのすべてを対象に産生安定性の予測を行う。産生安定性の予測は、未知の有用物質Xを産生する5種類のクローンのすべてに対して、現時点(規格試験時)の遺伝子発現データを取得し、学習済み(訓練済み)のモデルに入力することで行うが、その予測精度は低い。
次に右図F5Bの本実施形態による方法について説明する。左図F5Aの予測対象を限定しない方法に対し、右図F5Bに示す方法では、規格試験時のある培養データの値を指標にして予測対象を限定する。まず、ある培養データの値に注目して閾値を決め、データセットDSdに含まれるクローンの集団をグループ分けする。例えば、指標とする培養データの値が閾値に対して相対的に大きいものと、小さいものとの2つのグループに分ける。ここでは閾値を「5」とし、指標とする培養データの値が「5」以上である集団を訓練の対象とし、培養データの値が「5」より小さい集団は対象外とする例を示している。この閾値処理により、矩形枠RF4内に示すように各有用物質A~Dについて3クローンずつ、計12クローンの訓練データを対象として残し、これら限定された集団の訓練データを含むデータセットDSeを機械学習モデルMLMeの訓練に用いる。その一方、破線の矩形枠RF5内に示す8クローンの訓練データ、すなわち、閾値の条件を満たしていないクローンの訓練データは処理の対象外とする。
こうして、対象が限定されたデータセットDSeを用いて機械学習モデルMLMeを訓練する。そして、学習済みのモデルを用いて未知の有用物質Xを産生するクローンの産生安定性を予測する際にも、その予測対象のクローンは、モデルの訓練に用いたデータセットDSeのクローンの集団と同じように、指標とする培養データの値について閾値を適用し、閾値による限定条件を満たすもの(指標の値が閾値より上位の集団)に限定して予測を行う。矩形枠RF6内に示す3種類のクローンは、予測対象に該当するクローンを表している。また、破線の矩形枠RF7内に示す2種類のクローンは、予測対象外のクローンを表している。このように予測対象を限定して予測を行うことにより、高い予測精度を実現できる。さらに、破線の矩形枠RF7内に示す予測対象外のクローンは、遺伝子発現データ取得が不要であることから、遺伝子解析のコストを抑制できる。
《訓練および評価に用いるデータセットの例》
図6に、モデルの訓練および評価に用いるデータセットの例を示す。図6の上段には、有用物質としての抗体Aを産生するクローンについてのデータセットDSAの例を示し、下段には有用物質としての抗体Bを産生するクローンについてのデータセットDSBの例を示す。図示は省略するが、有用物質としての他種類の抗体を産生するクローンについてのデータセットも同様である。
図6に、モデルの訓練および評価に用いるデータセットの例を示す。図6の上段には、有用物質としての抗体Aを産生するクローンについてのデータセットDSAの例を示し、下段には有用物質としての抗体Bを産生するクローンについてのデータセットDSBの例を示す。図示は省略するが、有用物質としての他種類の抗体を産生するクローンについてのデータセットも同様である。
データセットDSAは、複数のクローンACLjのそれぞれについて測定された規格試験時の培養データと、規格試験時の遺伝子発現データと、安定性試験によって得られた正解の安定性ラベルとを含む。添字のjは、クローンを識別するインデックス番号を表す。培養データは、例えば、抗体産生量、積分生存細胞密度(integral viable cell density:IVCD)、乳酸濃度、pHなど1つ以上の項目を含んでよい。培養データは、培養装置あるいは細胞を含む培養液を一部サンプリングして専用装置を用いて測定できる一般的なデータであってよく、例えば、細胞総数、細胞分泌物質の量、細胞産生物質の量、細胞代謝物質の量および培地成分量のうち1つ以上を含んでいてもよい。図6に示す表の各セル内の文字記号(添字jを付した記号)は、対応するデータ項目の値を表している。
データセットDSBについても同様である。データセットDSAに含まれるクローンACLjの個数naとデータセットDSBに含まれるクローンBCLjの個数nbは異なっていてよい。
このように用意された複数のドメイン(有用物質種)のデータセットからある培養データの指標に注目して対象の絞り込み(限定)を行う。
《予測対象の絞り込みの例》
図7は、培養データのある指標による予測対象の絞り込みの例を示すグラフである。横軸に、複数の有用物質A~Eのそれぞれを産生する複数種類のクローンが並んでいる。縦軸は、規格試験時の培養データより得られたある指標の値である。なお、図7に示すクローンは、モデルの訓練(学習)に用いるクローンである。
図7は、培養データのある指標による予測対象の絞り込みの例を示すグラフである。横軸に、複数の有用物質A~Eのそれぞれを産生する複数種類のクローンが並んでいる。縦軸は、規格試験時の培養データより得られたある指標の値である。なお、図7に示すクローンは、モデルの訓練(学習)に用いるクローンである。
図7に示すように、産生する有用物質種の異なるクローンによって、培養データより得られたある指標の分布範囲が異なることがある。この場合、図5で説明したように、指標の値に対して閾値を決め、その閾値との相対的な大小関係に基づいてクローンを2つの集団に分け、訓練に用いるクローンの集団と訓練の対象外とするクローンの集団とを決めたのでは、産生する有用物質種によって訓練の対象となるクローンの数にバラツキがでてしまう。例えば、指標の閾値を2.5とし、閾値以上の値のクローンの集団を訓練に用いるとした場合、有用物質Bを産生するクローンは訓練に使用しないことになってしまう。
そこで、例えば、図7に示すように、各有用物質A~Dを産生するクローンについて、培養データより得られるある指標の相対的上位X%(Top-X%)に訓練対象を限定するとしてもよい。ここで相対的上位X%とは、各有用物質A~Dのそれぞれを産生するクローンの集団において、培養データより得られるある指標について降順に並べたときの上位X%(Top-X%)を意味する。限定条件となる閾値に相当する「X%」という基準は、各有用物質A~Eからのサンプリングの数が概ね同じ位の数になるように調整されることが好ましい。相対的上位X%は本開示における「指標の値の順位を用いて定義される閾値」の一例である。
このように訓練対象を限定しても、その中に産生性が安定なクローンと不安定なクローンとが存在し得る。そして、学習(訓練)済みモデルを用いて未知の有用物質Yを産生するクローンの産生安定性を予測する際にも、その予測対象のクローンは、モデルの訓練に用いたクローンと同じように、培養データより得られるある指標に関して上位X%のクローンに限定して予測を行う。
ここでは、複数の有用物質A~Eのそれぞれを産生する複数種類のクローンをモデルの訓練に用いたが、必ずしも異なる有用物質を産生するクローンを複数種類用いる必要はなく、例えば、有用物質Aを産生するクローンのみを訓練に用いてもよい。この場合、訓練に用いるクローンの集団の限定方法は、規格試験時のある培養データの値に注目して閾値を設定し、閾値との相対的な大小関係に基づいて行ってもよいし、規格試験時の培養データより得られたある指標の値に関して上位X%としてもよい。また、相対的上位X%としたが、培養データより得られたある指標によっては、相対的下位X%としてもよい。
予測対象を限定する際の培養データの指標と閾値は、用意されたデータセットから、試行錯誤的に仮説と検証とを繰り返す作業によって決定されてもよい。あるいはまた、予測対象を限定する際の培養データの指標と閾値は、用意されたデータセットから探索的な解析を行うことにより決定することができる。
例えば、図7に示すような5つの有用物質A~E(ドメイン)のデータセットが存在する場合、プロセッサを含む情報処理装置により、フィルタ法(Filter Method)などの特徴選択の手法を用いて、5つのドメインのそれぞれにおいて各特徴量と目的変数(安定性ラベル)との関連度をそれぞれ評価し、5ドメイン中例えば4ドメイン以上で関連度が高い特徴量をドメイン普遍性が高い特徴量とする。情報処理装置は、全データの中からある指標に着目して特定の条件を満たすデータをサブセットとして抽出し、抽出したサブセットについて、ドメイン普遍性が高い特徴量の個数を基にドメイン汎化性評価を行う。ドメイン普遍性が高い特徴量の個数が多い場合、ドメイン汎化性の高いサブセットと評価される。ドメイン汎化性の高いサブセットのデータを訓練データとして用いて予測モデルの学習(訓練)を行うことにより、学習済みのモデルは、学習時と同様の条件で対象を限定した集団(サブセット)に対しては、他のドメイン(有用物質種)に対してもロバストに産生安定性を予測可能である。
抗体産生クローンの場合、予測対象の限定に有効な培養データの指標は、例えば、抗体産生量、積分生存細胞密度、乳酸濃度などであり、これらのいずれかの指標の値の上位集団を対象とすることで、高精度の産生安定性予測が可能であることが確認された。
《有用物質の例》
有用物質は、抗体に限らず、抗体様タンパク質であってもよい。有用物質は、医薬品原料であるタンパク質、ペプチド、およびウイルスのうちいずれかであってよい。
有用物質は、抗体に限らず、抗体様タンパク質であってもよい。有用物質は、医薬品原料であるタンパク質、ペプチド、およびウイルスのうちいずれかであってよい。
《クローンの例》
有用物質を産生するクローンは、脊椎動物由来細胞であってよい。クローンは、例えば、哺乳類由来細胞であってよい。クローンは、CHO細胞またはHEK細胞であってもよい。
有用物質を産生するクローンは、脊椎動物由来細胞であってよい。クローンは、例えば、哺乳類由来細胞であってよい。クローンは、CHO細胞またはHEK細胞であってもよい。
《実施例》
以下、本開示の技術を適用した実施例1~3を説明する。各実施例1~3に共通する構成は次の通りである。すなわち、有用物質を抗体とし、産生細胞をCHO細胞とする。評価サンプルとして5種類の抗体産生CHO細胞のクローンについて、それぞれ複数種のクローンを用意し、RNAシーケンス(RNA-Seq)解析にて2週間の規格試験にて測定した全遺伝子発現レベルから100種類の遺伝子発現レベルを選択して説明変数とし、安定または不安定の2クラスに分類するロジステック回帰モデルを学習器とした、5分割クロスバリデーションを実施して予測モデルの訓練(学習)を行い、性能評価はPRAUC(Area Under the Precision-Recall Curve)を用いた例を示す。説明変数に用いる遺伝子発現レベルの種類数は、実施例1~3において、統計学的な有意確率を用いて選択した300~400種の遺伝子を用いて、種類数を増減させながら予測モデルの訓練(学習)を実際に行い、予測性能が高くなる種類数を探索することで100種類とした。なお、規格試験は、クローン(CHO細胞)の播種数は5×10^5cells/mL、40mLのフラスコで浮遊培養で行った。
以下、本開示の技術を適用した実施例1~3を説明する。各実施例1~3に共通する構成は次の通りである。すなわち、有用物質を抗体とし、産生細胞をCHO細胞とする。評価サンプルとして5種類の抗体産生CHO細胞のクローンについて、それぞれ複数種のクローンを用意し、RNAシーケンス(RNA-Seq)解析にて2週間の規格試験にて測定した全遺伝子発現レベルから100種類の遺伝子発現レベルを選択して説明変数とし、安定または不安定の2クラスに分類するロジステック回帰モデルを学習器とした、5分割クロスバリデーションを実施して予測モデルの訓練(学習)を行い、性能評価はPRAUC(Area Under the Precision-Recall Curve)を用いた例を示す。説明変数に用いる遺伝子発現レベルの種類数は、実施例1~3において、統計学的な有意確率を用いて選択した300~400種の遺伝子を用いて、種類数を増減させながら予測モデルの訓練(学習)を実際に行い、予測性能が高くなる種類数を探索することで100種類とした。なお、規格試験は、クローン(CHO細胞)の播種数は5×10^5cells/mL、40mLのフラスコで浮遊培養で行った。
5分割クロスバリデーションは、5種類の抗体種ごとに分割して、未学習の抗体種による性能を評価した。すなわち、4種類の抗体種のデータセットを訓練(学習)用のデータとして用い、残りの1種類の抗体種のデータセットを性能評価用のテストデータとして用いた。
図8は、評価サンプルとして用意した5種類の抗体産生CHO細胞のクローン数と安定性ラベルの付与例を示す図表である。評価サンプルとして5種類の抗体産生細胞を182クローン用意し、規格試験と同様の条件で2か月細胞培養することで、各クローンに対して安定性ラベル(「安定」または「不安定」)を付与した(図8参照)。例えば、抗体Aを産生するクローンは計24クローンあり、そのうち「安定」のラベルが付与されたものが7クローン、「不安定」のラベルが付与されたものが17クローンである。また、182クローンのそれぞれについて、規格試験時に培養データと遺伝子発現データを取得し、クローン毎に遺伝子発現データと安定性ラベルとか紐付けされ、訓練データを構成している。
[実施例1]
実施例1では、予測対象を「相対的高産生なクローン」に限定した安定性予測を行う例を説明する。ここで、「相対的高産生なクローン」とは、有用物質の産生量が相対的に高いクローンを意味する。
実施例1では、予測対象を「相対的高産生なクローン」に限定した安定性予測を行う例を説明する。ここで、「相対的高産生なクローン」とは、有用物質の産生量が相対的に高いクローンを意味する。
予測対象を「相対的高産生なクローン」に限定した安定性予測を行う際の、予測モデルの訓練に用いる訓練対象のクローンの限定方法について説明する。なお、訓練対象のクローンを限定することは、訓練において予測モデルに予測させる対象のクローンを限定すること、つまり予測モデルによる予測対象のクローンを限定することに相当する。
訓練対象のクローンの限定方法は、全182クローンの規格試験時の培養データから「抗体産生量」に注目し、予測モデルでの予測性能が高くなるように閾値を探索して、各抗体種で相対順位の上位40%のクローンに限定する方法とした。ここで、「抗体産生量」は、例えば規格試験における2週間(14日間)の抗体産生量の積算量とすることができる。または、規格試験中のある期間、例えば期間、例えば10日間の抗体産生量の積算量としてもよく、計測期間で除算して単位時間あたりの抗体産生量としてもよい。「上位40%」は閾値の一例である。図9は、各抗体種において抗体生産量の値が相対順位の上位40%に該当するクローン数と安定性ラベルの付与例を示す図表である。
図9には、各抗体種において相対順位の上位40%に該当する計73クローンの例が示されている。図9に示す73クローンの規格試験時の遺伝子発現データと安定性ラベルとが紐付けされた訓練データを含む抗体種ごとのデータセットを用いて5分割クロスバリデーションを実施した。このように訓練対象を限定した結果、学習済みの予測モデルの予測性能はPRAUCの値が0.743となった。なお、学習済みの予測モデルを用いて未知の有用物質の産生安定性を予測する際の予測対象のクローンについても、訓練対象の限定と同様に規格試験時(現時点)の培養データを解析し、「抗体産生量」の上位40%に限定して予測を行うこととする。
[比較例]
これに対し、訓練対象を限定せずに、図8に示す182クローンの全データを含むデータセットを用いて、同様の学習を行い、5分割クロスバリデーションを実施した場合に得られる比較例に係る予測モデルの予測性能はPRAUCの値が0.503であった。なお、予測対象は、訓練対象と同様に対象を限定せずに行うこととする。実施例1によって予測対象を限定した予測モデルの性能は、比較例に係る予測モデルよりも高精度であることが確認された。
これに対し、訓練対象を限定せずに、図8に示す182クローンの全データを含むデータセットを用いて、同様の学習を行い、5分割クロスバリデーションを実施した場合に得られる比較例に係る予測モデルの予測性能はPRAUCの値が0.503であった。なお、予測対象は、訓練対象と同様に対象を限定せずに行うこととする。実施例1によって予測対象を限定した予測モデルの性能は、比較例に係る予測モデルよりも高精度であることが確認された。
この結果は、実施例1の方法により生成される予測モデルを用いて、未知の有用物質に対して高精度に予測可能であることを示すと同時に、相対的に高産生なクローンに限定することは有用物質の産生クローンの選抜工程において全く障害にならず、高精度で予測できる対象に限定することにおり低コストで実施可能なため、本開示による安定性予測は実用可能であると考えられる。
[実施例2]
実施例2では、予測対象を「相対的に細胞密度の高いクローン」に限定した安定性予測を行う例を説明する。まず、予測対象を「相対的に細胞密度の高いクローン」に限定した安定性予測を行う際の、予測モデルを訓練するための訓練対象のクローンの限定方法について説明する。実施例1と同様に、図8に示す全182クローンの規格試験時の培養データから「積分生存細胞密度(IVCD)」に着目し、予測モデルでの予測性能が高くなるように閾値を探索して、各抗体種で相対順位の上位60%のクローンに限定する方法とした。ここで、「相対的に細胞密度の高いクローン」は、例えば規格試験における2週間(14日間)の「積分生存細胞密度(IVCD)」に基づいて取得することができる。または、規格試験中のある期間、例えば10日間の「積分生存細胞密度(IVCD)」に基づいて取得してもよい。「上位60%」は閾値の一例である。図10は、各抗体種において積分生存細胞密度の値が相対順位の上位60%に該当するクローン数と安定性ラベルの付与例を示す図表である。
実施例2では、予測対象を「相対的に細胞密度の高いクローン」に限定した安定性予測を行う例を説明する。まず、予測対象を「相対的に細胞密度の高いクローン」に限定した安定性予測を行う際の、予測モデルを訓練するための訓練対象のクローンの限定方法について説明する。実施例1と同様に、図8に示す全182クローンの規格試験時の培養データから「積分生存細胞密度(IVCD)」に着目し、予測モデルでの予測性能が高くなるように閾値を探索して、各抗体種で相対順位の上位60%のクローンに限定する方法とした。ここで、「相対的に細胞密度の高いクローン」は、例えば規格試験における2週間(14日間)の「積分生存細胞密度(IVCD)」に基づいて取得することができる。または、規格試験中のある期間、例えば10日間の「積分生存細胞密度(IVCD)」に基づいて取得してもよい。「上位60%」は閾値の一例である。図10は、各抗体種において積分生存細胞密度の値が相対順位の上位60%に該当するクローン数と安定性ラベルの付与例を示す図表である。
図10には、各抗体種において相対順位の上位60%に該当する計109クローンの例が示されている。図10に示す109クローンの規格試験時の遺伝子発現データと安定性ラベルとが紐付けされた訓練データを含む抗体種ごとのデータセットを用いて5分割クロスバリデーションを実施した。このように訓練対象を限定した結果、学習済みの予測モデルの予測性能はPRAUCの値が0.647となった。すなわち、実施例2によって予測対象を限定した予測モデルの性能は、対象を限定しない比較例に係る予測モデルのPRAUC(0.503)よりも高精度であることが確認された。なお、学習済みの予測モデルを用いて未知の有用物質の産生安定性を予測する際の予測対象のクローンについても、訓練対象の限定と同様に規格試験時(現時点)の培養データを解析し、「積分生存細胞密度(IVCD)」の上位60%に限定して予測を行うこととする。
この結果は、実施例2の方法により生成される予測モデルを用いて未知の有用物質に対して高精度に予測可能であることを示すと同時に、相対的に生存細胞密度が高いクローンに限定することは有用物質の産生クローンの選抜工程において障害にならず、高精度で予測できる対象に限定することにより低コストで実施可能なため、本開示による安定性予測は実用可能であると考えられる。
[実施例3]
実施例3では、「相対的に乳酸濃度の高いクローン」に限定した安定性予測を行う例を説明する。まず、予測対象を「相対的に乳酸濃度の高いクローン」に限定した安定性予測を行う際の、予測モデルを訓練するための訓練対象のクローンの限定方法について説明する。実施例1と同様に、図8に示す全182クローンの2週間の規格試験の培養データからクローンを培養している培養液の「乳酸濃度」に着目し、2週間(14日間)の内の各時点、例えば一日毎に測定された培養液の「乳酸濃度」の中央値を代表値として、各クローンの「乳酸濃度」を取得する。そして、予測モデルでの予測性能が高くなるように閾値を探索して、各抗体種で相対順位の上位40%のクローンに限定する方法とした。「上位40%」は閾値の一例である。図11は、各抗体種において乳酸濃度の値が相対順位の上位40%に該当するクローン数と安定性ラベルの付与例を示す図表である。
実施例3では、「相対的に乳酸濃度の高いクローン」に限定した安定性予測を行う例を説明する。まず、予測対象を「相対的に乳酸濃度の高いクローン」に限定した安定性予測を行う際の、予測モデルを訓練するための訓練対象のクローンの限定方法について説明する。実施例1と同様に、図8に示す全182クローンの2週間の規格試験の培養データからクローンを培養している培養液の「乳酸濃度」に着目し、2週間(14日間)の内の各時点、例えば一日毎に測定された培養液の「乳酸濃度」の中央値を代表値として、各クローンの「乳酸濃度」を取得する。そして、予測モデルでの予測性能が高くなるように閾値を探索して、各抗体種で相対順位の上位40%のクローンに限定する方法とした。「上位40%」は閾値の一例である。図11は、各抗体種において乳酸濃度の値が相対順位の上位40%に該当するクローン数と安定性ラベルの付与例を示す図表である。
図11は、各抗体種において相対順位の上位40%に該当する計72クローンの例が示されている。なお、図9と比較してクローンの数が1クローン少ない理由は、乳酸濃度の測定において、1クローンのデータ欠損があったためである。
図11に示す72クローンの規格試験時の遺伝子発現データと安定性ラベルとが紐付けされた訓練データを含む抗体種ごとのデータセットを用いて5分割クロスバリデーションを実施した。このように対象を限定した結果、学習済みの予測モデルの予測性能はPRAUCの値が0.613となった。すなわち、実施例3によって予測対象を限定した予測モデルの性能は、対象を限定しない比較例に係る予測モデルのPRAUC(0.503)よりも高精度であることが確認された。なお、学習済みの予測モデルを用いて未知の有用物質の産生安定性を予測する際の予測対象のクローンについても、訓練対象の限定と同様に規格試験時(現時点)の培養データを解析し、「乳酸濃度」の上位40%に限定して予測を行うこととする。
この結果は、未知の有用物質に対して高精度に予測可能であることを示すと同時に、相対的に乳酸濃度が高いクローンに限定することは有用物質の産生クローンの選抜工程において障害にならず、高精度で予測できる対象に限定することにより低コストで実施可能なため、本開示による安定性予測は実用可能であると考えられる。
《情報処理装置の構成例》
図12は、実施形態に係る情報処理装置10の機能的構成を示すブロック図である。情報処理装置10は、データ取得部12と、予測対象限定部14と、産生安定性予測モデル16と、処理結果出力部18と、を備える。情報処理装置10の各種機能は、コンピュータのハードウェアとソフトウェアとの組み合わせによって実現し得る。情報処理装置10の物理的形態は特に限定されず、サーバコンピュータであってもよいし、ワークステーションであってもよく、パーソナルコンピュータあるいはタブレット端末などであってもよい。
図12は、実施形態に係る情報処理装置10の機能的構成を示すブロック図である。情報処理装置10は、データ取得部12と、予測対象限定部14と、産生安定性予測モデル16と、処理結果出力部18と、を備える。情報処理装置10の各種機能は、コンピュータのハードウェアとソフトウェアとの組み合わせによって実現し得る。情報処理装置10の物理的形態は特に限定されず、サーバコンピュータであってもよいし、ワークステーションであってもよく、パーソナルコンピュータあるいはタブレット端末などであってもよい。
データ取得部12は、有用物質を産生するクローンについての1種類以上のクローンの培養データおよび遺伝子発現データを含む各種データを取得する。
予測対象限定部14は、培養データ解析部20と、限定条件判定部22とを含み、入力された1種類以上のクローンの培養データを解析して予測対象のクローンを限定する。培養データ解析部20は、培養データの解析を行う。限定条件判定部22は、培養データの解析結果を基に、閾値により対象を限定する。なお、説明の便宜上、培養データ解析部20と限定条件判定部22とを分けて記載しているが、限定条件判定部22は培養データ解析部20に含まれていてもよい。また、培養データ解析部20が予測対象限定部14として機能すると理解してもよい。
培養データ解析部20は、入力されたデータセットから予測対象を限定するための指標と閾値とを決定する処理を実行し得る。なお、予測対象の限定条件となる指標と閾値については、培養データ解析部20による解析結果に基づいて設定されてもよいし、不図示の別の情報処理装置等を用いた探索処理の結果などによって事前に把握されている既知の情報として予測対象限定部14に設定されてもよい。
産生安定性予測モデル16には、機械学習モデルが適用される。産生安定性予測モデル16は、予測対象であるクローンの現時点の遺伝子発現データの入力を受け付けて、入力された遺伝子発現データを基にクローンの産生安定性を予測して安定性ラベルを出力する2クラス分類モデルであってよい。産生安定性予測モデル16は、図5の右図F5Bにて説明した方法により対象を限定した訓練データを用いて訓練される。産生安定性予測モデル16に入力される遺伝子発現データは、1つ以上の遺伝子発現レベルを含む。産生安定性予測モデル16に入力される遺伝子発現データには、複数の遺伝子の発現レベルのデータが含まれていてもよい。説明変数として用いる特徴量は、公知の特徴量選択の手法により選択されてもよい。
処理結果出力部18は、産生安定性予測モデル16の予測結果を含む処理結果を出力する。処理結果出力部18は、例えば、処理結果を表示させる処理、処理結果をデータベース等に記録する処理、および処理結果を印刷させる処理のうち少なくとも1つの処理を行う構成であってよい。
図13は、情報処理装置10のハードウェア構成の例を示すブロック図である。ここでは、1台のコンピュータを用いて情報処理装置10の処理機能を実現する例を述べるが、情報処理装置10の処理機能は、複数台のコンピュータを用いて構成されるコンピュータシステムによって実現してもよい。
情報処理装置10は、プロセッサ102と、非一時的な有体物であるコンピュータ可読媒体104と、通信インターフェース106と、入出力インターフェース108と、バス110と、を備える。プロセッサ102は、バス110を介してコンピュータ可読媒体104、通信インターフェース106および入出力インターフェース108と接続される。
プロセッサ102はCPU(Central Processing Unit)を含む。プロセッサ102はGPU(Graphics Processing Unit)を含んでもよい。コンピュータ可読媒体104は、主記憶装置であるメモリ112および補助記憶装置であるストレージ114を含む。コンピュータ可読媒体104は、例えば、半導体メモリ、ハードディスク(Hard Disk Drive:HDD)装置、もしくはソリッドステートドライブ(Solid State Drive:SSD)装置またはこれらの複数の組み合わせであってよい。コンピュータ可読媒体104は本開示における「記憶装置」の一例である。
コンピュータ可読媒体104は、1種類以上のクローンの培養データおよび遺伝子発現データなどの各種のデータを記憶するデータ記憶領域120を含む。また、コンピュータ可読媒体104には、予測対象限定プログラム140、産生安定性予測モデル16、処理結果出力プログラム180および表示制御プログラム190を含む複数のプログラム、並びにデータ等が記憶される。「プログラム」という用語はプログラムモジュールの概念を含み、プログラムに準じる命令を含む。プロセッサ102は、コンピュータ可読媒体104に記憶されたプログラムの命令を実行することにより、各種の処理部として機能する。
予測対象限定プログラム140は、培養データを解析して予測対象を限定する処理を実行させる命令を含む。予測対象限定プログラム140は、培養データ解析プログラム142と限定条件判定プログラム144とを含んで構成されてもよい。培養データ解析プログラム142は、1種類以上のクローンの培養データを解析する処理を実行させる命令を含む。培養データ解析プログラム142は、データセットから予測対象を絞り込むための指標と閾値を探索する処理を実行させる命令を含んでもよい。
限定条件判定プログラム144は、培養データ解析プログラム142の解析結果を利用し、限定条件として定められた指標と閾値に基づいて予測対象を限定する処理を実行させる命令とを含む。
産生安定性予測モデル16は、限定条件を満たす予測対象に係るクローンの遺伝子発現データの入力を受け付けて、産生安定性を予測する処理を実行させる命令を含む。
処理結果出力プログラム180は、産生安定性予測モデル16によって予測された産生安定性を含む処理結果を出力する処理を実行させる命令を含む。表示制御プログラム190は、表示装置154への表示出力に必要な表示用信号を生成し、表示装置154の表示制御を実行させる命令を含む。
通信インターフェース106は、有線または無線により外部装置との通信処理を行い、外部装置との間で情報のやり取りを行う。情報処理装置10は、通信インターフェース106を介して不図示の通信回線に接続される。通信回線は、ローカルエリアネットワークであってもよいし、ワイドエリアネットワークであってもよく、これらの組み合わせであってもよい。通信インターフェース106は、データの入力を受け付けるデータ取得部の役割を担うことができる。
情報処理装置10は、入力装置152と、表示装置154とを備えていてもよい。入力装置152は、例えば、キーボード、マウス、マルチタッチパネル、もしくはその他のポインティングデバイス、もしくは、音声入力装置、またはこれらの適宜の組み合わせによって構成される。表示装置154は、例えば、液晶ディスプレイ、有機EL(organic electro-luminescence:OEL)ディスプレイ、もしくは、プロジェクタ、またはこれらの適宜の組み合わせによって構成される。入力装置152と表示装置154とは、入出力インターフェース108を介してプロセッサ102と接続される。なお、タッチパネルのように入力装置152と表示装置154とが一体的に構成されてもよく、タッチパネル式のタブレット端末のように、情報処理装置10と入力装置152と表示装置154とが一体的に構成されてもよい。
《機械学習装置の構成例》
図14は、産生安定性予測モデル16を生成するための機械学習の処理を実行する機械学習装置300のハードウェア構成の例を示すブロック図である。ここでは、1台のコンピュータを用いて機械学習装置300の処理機能を実現する例を述べるが、機械学習装置300の処理機能は、複数台のコンピュータを用いて構成されるコンピュータシステムによって実現してもよい。
図14は、産生安定性予測モデル16を生成するための機械学習の処理を実行する機械学習装置300のハードウェア構成の例を示すブロック図である。ここでは、1台のコンピュータを用いて機械学習装置300の処理機能を実現する例を述べるが、機械学習装置300の処理機能は、複数台のコンピュータを用いて構成されるコンピュータシステムによって実現してもよい。
機械学習装置300は、プロセッサ302と、非一時的な有体物であるコンピュータ可読媒体304と、通信インターフェース306と、入出力インターフェース308と、バス310と、を備える。コンピュータ可読媒体304は、メモリ312およびストレージ314を含む。プロセッサ302は、バス310を介してコンピュータ可読媒体304、通信インターフェース306および入出力インターフェース308と接続される。入力装置352および表示装置354は入出力インターフェース308を介してバス310に接続される。
機械学習装置300のハードウェア構成は、図6で説明した情報処理装置10の対応する要素と同様であってよい。機械学習装置300の形態は、サーバコンピュータであってもよいし、パーソナルコンピュータであってもよく、ワークステーションであってもよい。機械学習装置300は本開示における「1つ以上のプロセッサを含むシステム」の一例である。
機械学習装置300は、通信インターフェース306を介して不図示の通信回線に接続され、データ保存部550などの外部装置と通信可能に接続される。データ保存部550は、複数の訓練データを含むデータセットが保存されているストレージを含む。データ保存部550には、図6に例示したような複数のドメインの全データを含むデータセットが保存されていてもよいし、予測対象として限定された対象のサンプルのみのデータを含むデータセットが保存されていてもよい。なお、データ保存部550は、機械学習装置300内のストレージ314に構築されてもよい。
コンピュータ可読媒体304には、予測対象限定プログラム320、学習処理プログラム330および表示制御プログラム340を含む複数のプログラム並びにデータ等が記憶される。予測対象限定プログラム320は、図12で説明した予測対象限定プログラム140と同様であってよい。表示制御プログラム340は、図12で説明した表示制御プログラム190と同様であってよい。
コンピュータ可読媒体304は、予測対象データ記憶領域322を含む。予測対象データ記憶領域322には、限定された予測対象に該当する訓練データが記憶される。データ保存部550に保存されているデータセットから予測対象限定プログラム320によって該当する訓練データが適時にサンプリングされてもよいし、予め予測対象のみのデータセットがサブセットとして抽出されていてもよい。
学習処理プログラム330は、データ取得プログラム400と、機械学習モデルである予測モデル410と、損失算出プログラム430と、オプティマイザ440と、を含む。データ取得プログラム400は、予測対象データ記憶領域322から訓練データを取得する処理を実行させる命令を含む。データ取得プログラム400を介して取得された訓練データは予測モデル410に入力される。
損失算出プログラム430は、予測モデル410から出力される安定性ラベルの予測値と、正解の安定性ラベルとの誤差を示す損失を算出する処理を実行させる命令を含む。オプティマイザ440は、算出された損失から予測モデル410のパラメータの更新量を算出し、予測モデル410のパラメータを更新する処理を実行させる命令を含む。オプティマイザ440は、例えば確率的勾配降下法(Stochastic Gradient Descent:SGD)などの手法により、パラメータの最適化を行ってもよい。
《機械学習方法のフローチャート》
図15は、機械学習装置300が実行する機械学習方法の例を示すフローチャートである。ここでは、図6に例示したような、機械学習に用いるデータセットが用意されているものとして説明する。ステップS102において、プロセッサ302は、用意されたデータセットから培養データを取得する。
図15は、機械学習装置300が実行する機械学習方法の例を示すフローチャートである。ここでは、図6に例示したような、機械学習に用いるデータセットが用意されているものとして説明する。ステップS102において、プロセッサ302は、用意されたデータセットから培養データを取得する。
ステップS104において、プロセッサ302は、培養データを解析し、訓練対象を限定する。プロセッサ302は、予め指定された培養データの指標と閾値に従い、限定条件を満たす対象サンプルのデータであるか、限定条件を満たさない対象外サンプルのデータであるかを選別してもよいし、培養データから限定条件とする指標と閾値を探索し、対象サンプルのデータと対象外サンプルのデータとを選別してもよい。
ステップS106において、プロセッサ302は、限定条件を満たすクローンのデータのみを用いて機械学習を行い、予測モデル410を訓練する。すなわち、プロセッサ302は、限定条件を満たすサンプルの遺伝子発現データを予測モデル410に入力し、予測モデル410から出力される安定性ラベルの予測値と、正解の安定性ラベルとの誤差を示す損失を算出する。プロセッサ302は、算出された損失に基づき予測モデル410のパラメータの更新量を算出し、パラメータを更新する。こうして、プロセッサ302は、予測モデル410に入力したデータに対する予測モデル410からの出力(予測値)が正解の安定性ラベルに近づくように予測モデル410を訓練する。なお、予測モデル410のパラメータの更新はミニバッチの単位で実施されてもよい。
ステップS108において、プロセッサ302は、学習を終了するか否かを判定する。学習の終了条件は、損失の値に基づいて定められていてもよいし、パラメータの更新回数に基づいて定められていてもよい。損失の値に基づく方法としては、例えば、損失が規定の範囲内に収束していることを学習終了条件としてよい。また、更新回数に基づく方法としては、例えば、更新回数が規定回数に到達したことを学習終了条件としてよい。あるいは、訓練データとは別にモデルの性能評価用のデータセットを用意しておき、評価用のデータを用いた評価値に基づいて学習終了の可否を判定してもよい。
ステップS108の判定結果がNo判定である場合、プロセッサ302はステップS106に戻り、学習処理を継続する。一方、ステップS108の判定結果がYes判定である場合、プロセッサ302は図12のフローチャートを終了する。
学習済みの予測モデル410は、産生安定性予測モデル16として情報処理装置10に組み込まれる。機械学習装置300が実行する機械学習方法は、産生安定性予測モデル16を生成する方法と理解することができ、本開示における予測モデル生成方法の一例である。
《産生安定性の予測を行う情報処理方法のフローチャート》
図16は、情報処理装置10が実行する情報処理方法の例を示すフローチャートである。ステップS202において、プロセッサ102は、有用物質を産生するクローンについて測定された培養データを取得する。プロセッサ102は、不図示のデータ保存サーバなどからデータを自動的に取得してもよいし、ユーザインターフェースを介してデータの指定の入力を受け付け、指定されたクローンについてのデータを取得してもよい。
図16は、情報処理装置10が実行する情報処理方法の例を示すフローチャートである。ステップS202において、プロセッサ102は、有用物質を産生するクローンについて測定された培養データを取得する。プロセッサ102は、不図示のデータ保存サーバなどからデータを自動的に取得してもよいし、ユーザインターフェースを介してデータの指定の入力を受け付け、指定されたクローンについてのデータを取得してもよい。
ステップS204において、プロセッサ102は、培養データを解析し、予測対象を限定する。プロセッサ102は、産生安定性予測モデル16を訓練した際に訓練対象を限定した条件と同じ限定条件を適用して予測対象を限定する。なお、このステップS204により、予測対象が限定された後に、予測対象に該当するクローンについて遺伝子発現データの計測を実施することにより、全クローンの遺伝子解析を実施する場合と比較して、作業負荷およびコストの低減が可能である。
ステップS206において、プロセッサ102は、予測対象に該当するクローンの遺伝子発現データを産生安定性予測モデル16に入力し、産生安定性予測モデル16によって安定性を予測する。
ステップS208において、プロセッサ102は、産生安定性予測モデル16から出力された予測結果を出力する。この産生安定性の予測結果を基に、産生クローンの選抜を行うことができる。
ステップS208の後、プロセッサ102は、図16のフローチャートを終了する。
《コンピュータを動作させるプログラムについて》
実施形態に係る情報処理装置10および機械学習装置300の各装置における処理機能の一部または全部をコンピュータに実現させるプログラムを、光ディスク、磁気ディスク、もしくは、半導体メモリその他の有体物たる非一時的な情報記憶媒体であるコンピュータ可読媒体に記録し、この情報記憶媒体を通じてプログラムを提供することが可能である。
実施形態に係る情報処理装置10および機械学習装置300の各装置における処理機能の一部または全部をコンピュータに実現させるプログラムを、光ディスク、磁気ディスク、もしくは、半導体メモリその他の有体物たる非一時的な情報記憶媒体であるコンピュータ可読媒体に記録し、この情報記憶媒体を通じてプログラムを提供することが可能である。
またこのような有体物たる非一時的なコンピュータ可読媒体にプログラムを記憶させて提供する態様に代えて、インターネットなどの電気通信回線を利用してプログラム信号をダウンロードサービスとして提供することも可能である。
さらに、上述の各装置における処理機能の一部または全部をクラウドコンピューティングによって実現してもよく、また、SaaS(Software as a Service)として提供することも可能である。
《各処理部のハードウェア構成について》
情報処理装置10におけるデータ取得部12、予測対象限定部14、産生安定性予測モデル16を含む安定性予測部、処理結果出力部18、培養データ解析部20、限定条件判定部22、機械学習装置300における予測モデル410を含む学習部、損失算出部、パラメータ更新量算出部、パラメータ更新部などの各種の処理を実行する処理部(processing unit)のハードウェア的な構造は、例えば、次に示すような各種のプロセッサ(processor)である。
情報処理装置10におけるデータ取得部12、予測対象限定部14、産生安定性予測モデル16を含む安定性予測部、処理結果出力部18、培養データ解析部20、限定条件判定部22、機械学習装置300における予測モデル410を含む学習部、損失算出部、パラメータ更新量算出部、パラメータ更新部などの各種の処理を実行する処理部(processing unit)のハードウェア的な構造は、例えば、次に示すような各種のプロセッサ(processor)である。
各種のプロセッサには、プログラムを実行して各種の処理部として機能する汎用的なプロセッサであるCPU、GPU、FPGA(Field Programmable Gate Array)などの製造後に回路構成を変更可能なプロセッサであるプログラマブルロジックデバイス(Programmable Logic Device:PLD)、ASIC(Application Specific Integrated Circuit)などの特定の処理を実行させるために専用に設計された回路構成を有するプロセッサである専用電気回路などが含まれる。
1つの処理部は、これら各種のプロセッサのうちの1つで構成されていてもよいし、同種または異種の2つ以上のプロセッサで構成されてもよい。例えば、1つの処理部は、複数のFPGA、あるいは、CPUとFPGAの組み合わせ、またはCPUとGPUの組み合わせによって構成されてもよい。また、複数の処理部を1つのプロセッサで構成してもよい。複数の処理部を1つのプロセッサで構成する例としては、第一に、クライアントやサーバなどのコンピュータに代表されるように、1つ以上のCPUとソフトウェアの組み合わせで1つのプロセッサを構成し、このプロセッサが複数の処理部として機能する形態がある。第二に、システムオンチップ(System On Chip:SoC)などに代表されるように、複数の処理部を含むシステム全体の機能を1つのIC(Integrated Circuit)チップで実現するプロセッサを使用する形態がある。このように、各種の処理部は、ハードウェア的な構造として、上記各種のプロセッサを1つ以上用いて構成される。
さらに、これらの各種のプロセッサのハードウェア的な構造は、より具体的には、半導体素子などの回路素子を組み合わせた電気回路(circuitry)である。
《実施形態の利点》
上述した実施形態に係る産生クローンの産生安定性を予測する方法およびその方法を実行する情報処理装置10によれば、次のような効果が得られる。
上述した実施形態に係る産生クローンの産生安定性を予測する方法およびその方法を実行する情報処理装置10によれば、次のような効果が得られる。
[1]現時点(規格試験時)の培養データの指標に基づき適切に予測対象のクローンが限定されるため、予測対象のクローンについて高い精度で産生安定性を予測することができる。
[2]予測対象のクローンに限定して遺伝子解析(RNA-Seq解析)を行えばよいため、全クローンについて遺伝子解析を行う場合と比較して、コスト抑制が可能である。
[3]従来の安定性試験の代わりに、本実施形態に係る方法を適用することにより、産生細胞の開発工程の期間短縮および低コスト化を実現できる。
《その他》
本開示は上述した実施形態に限定されるものではなく、本開示の技術的思想の趣旨を逸脱しない範囲で種々の変形が可能である。
本開示は上述した実施形態に限定されるものではなく、本開示の技術的思想の趣旨を逸脱しない範囲で種々の変形が可能である。
10 情報処理装置
12 データ取得部
14 予測対象限定部
16 産生安定性予測モデル
18 処理結果出力部
20 培養データ解析部
22 限定条件判定部
102 プロセッサ
104 コンピュータ可読媒体
106 通信インターフェース
108 入出力インターフェース
110 バス
112 メモリ
114 ストレージ
120 データ記憶領域
140 予測対象限定プログラム
142 培養データ解析プログラム
144 限定条件判定プログラム
152 入力装置
154 表示装置
180 処理結果出力プログラム
190 表示制御プログラム
300 機械学習装置
302 プロセッサ
304 コンピュータ可読媒体
306 通信インターフェース
308 入出力インターフェース
310 バス
312 メモリ
314 ストレージ
320 予測対象限定プログラム
322 予測対象データ記憶領域
330 学習処理プログラム
340 表示制御プログラム
352 入力装置
354 表示装置
400 データ取得プログラム
410 予測モデル
430 損失算出プログラム
440 オプティマイザ
550 データ保存部
DSA、DSB データセット
DSc、DSd、DSe データセット
F5A 左図
F5B 右図
G1 グラフ
G2 グラフ
GEP 遺伝子発現パターン
MLM 機械学習モデル
MLMc、MLMe 機械学習モデル
RF1~RF7 矩形枠
S102~S108 機械学習方法のステップ
S202~S208 産生安定性を予測する情報処理方法のステップ
Claims (22)
- 有用物質を産生するクローンの産生安定性を予測する方法であって、
1つ以上のプロセッサが、
1種類以上の前記クローンの培養データを取得することと、
前記培養データを解析して予測対象のクローンを限定することと、
前記予測対象のクローンについて測定されたデータを用いて、前記予測対象のクローンによる前記有用物質の産生安定性を予測することと、
を実行する、方法。 - 前記産生安定性は、培養開始時と所定期間培養後とにおける前記有用物質の産生量の変化の有無により定義される、
請求項1に記載の方法。 - 前記1つ以上のプロセッサが、
前記培養データから得られる指標と、前記指標に関する閾値とを設定し、
前記指標の値と前記閾値とに基づき前記予測対象を限定する、
請求項1に記載の方法。 - 前記閾値は、前記産生安定性の予測精度が前記予測対象を限定しない場合よりも高くなるように調整される、
請求項3に記載の方法。 - 前記閾値は、前記指標の値についての順位を用いて定義される、
請求項3に記載の方法。 - 前記予測対象は、前記指標の値の上位集団である、
請求項3に記載の方法。 - 前記指標は、前記有用物質の産生量である、
請求項3から6のいずれか一項に記載の方法。 - 前記指標は、積分生存細胞密度である、
請求項3から6のいずれか一項に記載の方法。 - 前記指標は、乳酸濃度である、
請求項3から6のいずれか一項に記載の方法。 - 前記産生安定性の予測に用いる前記データは、1つ以上の遺伝子発現レベルを含む、
請求項1から6のいずれか一項に記載の方法。 - 前記1つ以上のプロセッサが、
前記予測対象の前記データの入力を受けて、安定または不安定の2クラス分類を行うモデルを用いて前記産生安定性を予測する、
請求項1から6のいずれか一項に記載の方法。 - 前記モデルは、前記予測対象のクローンと同様の限定をした訓練用のクローンについての前記データと正解の安定性ラベルとが関連付けされた複数の訓練データを用いた機械学習によって訓練されたモデルである、
請求項11に記載の方法。 - 前記複数の訓練データは、産生する有用物質が異なる複数種類のクローンについての前記訓練データを含み、
前記1つ以上のプロセッサが、前記モデルの訓練に使用された有用物質とは別の有用物質を産生するクローンについての産生安定性を予測する、
請求項12に記載の方法。 - 前記有用物質は、医薬品原料であるタンパク質、ペプチド、およびウイルスのうちいずれかである、
請求項1から6のいずれか一項に記載の方法。 - 前記有用物質は、抗体、または抗体様タンパク質である、
請求項1から6のいずれか一項に記載の方法。 - 前記クローンは、脊椎動物由来細胞である、
請求項1から6のいずれか一項に記載の方法。 - 前記クローンは、哺乳類由来細胞である、
請求項1から6のいずれか一項に記載の方法。 - 前記クローンは、CHO細胞またはHEK細胞である、
請求項1から6のいずれか一項に記載の方法。 - 1つ以上のプロセッサと、
前記1つ以上のプロセッサに実行させる命令が記憶される1つ以上の記憶装置と、を備え、
前記1つ以上のプロセッサは、
有用物質を産生するクローンについて1種類以上のクローンの培養データを取得し、
前記培養データを解析して予測対象のクローンを限定し、
前記予測対象のクローンについて測定されたデータを用いて、前記予測対象のクローンによる前記有用物質の産生安定性を予測する、
情報処理装置。 - コンピュータに、
有用物質を産生するクローンについて1種類以上のクローンの培養データを取得する機能と、
前記培養データを解析して予測対象のクローンを限定する機能と、
前記予測対象のクローンについて測定されたデータを用いて、前記予測対象のクローンによる前記有用物質の産生安定性を予測する機能と、
を実現させるプログラム。 - 非一時的かつコンピュータ読取可能な記録媒体であって、請求項20に記載のプログラムが記録された記録媒体。
- 有用物質を産生するクローンの産生安定性を予測する機能をコンピュータに実現させる予測モデルを生成する予測モデル生成方法であって、
1つ以上のプロセッサを含むシステムが、
1種類以上の前記クローンの培養データを取得することと、
前記培養データを解析して予測対象のクローンを限定することと、
前記予測対象に該当するクローンについて測定されたデータと正解の安定性ラベルとが関連付けされた複数の訓練データを用いて機械学習を行い、前記データの入力に対する前記予測モデルの出力が前記正解の安定性ラベルに近づくように前記予測モデルを訓練することと、
を含む予測モデル生成方法。
Applications Claiming Priority (2)
| Application Number | Priority Date | Filing Date | Title |
|---|---|---|---|
| JP2022138789 | 2022-08-31 | ||
| JP2022-138789 | 2022-08-31 |
Publications (1)
| Publication Number | Publication Date |
|---|---|
| WO2024048079A1 true WO2024048079A1 (ja) | 2024-03-07 |
Family
ID=90099474
Family Applications (1)
| Application Number | Title | Priority Date | Filing Date |
|---|---|---|---|
| PCT/JP2023/025263 WO2024048079A1 (ja) | 2022-08-31 | 2023-07-07 | 有用物質を産生するクローンの産生安定性を予測する方法、情報処理装置、プログラムおよび予測モデル生成方法 |
Country Status (1)
| Country | Link |
|---|---|
| WO (1) | WO2024048079A1 (ja) |
Citations (8)
| Publication number | Priority date | Publication date | Assignee | Title |
|---|---|---|---|---|
| JP2008502365A (ja) * | 2004-06-09 | 2008-01-31 | ザ リージェンツ オブ ザ ユニバーシティ オブ ミシガン | 疾患に対する体液性応答のファージ・マイクロアレイ・プロファイリング法 |
| JP2010517530A (ja) * | 2007-02-01 | 2010-05-27 | セントカー・インコーポレーテツド | 高産生細胞株の選択 |
| WO2016075216A1 (en) * | 2014-11-12 | 2016-05-19 | Lek Pharmaceuticals D.D. | Predicting genetically stable recombinant protein production in early cell line development |
| JP2017511688A (ja) * | 2014-01-30 | 2017-04-27 | バリタセル リミテッド | クローンに由来する産生株細胞のパネルの相対的な流加産生力価を予測する方法 |
| JP2021503291A (ja) * | 2017-11-20 | 2021-02-12 | ロンザ リミテッドLonza Limited | 乳酸塩の蓄積を予防しつつ、細胞培養物を増殖させるための方法及びシステム |
| WO2021166824A1 (ja) * | 2020-02-19 | 2021-08-26 | 富士フイルム株式会社 | 細胞培養プロセス探索方法、細胞培養プロセス探索プログラム、細胞培養プロセス探索装置、及び、学習済みモデル |
| JP2021534782A (ja) * | 2018-08-27 | 2021-12-16 | エフ.ホフマン−ラ ロシュ アーゲーF. Hoffmann−La Roche Aktiengesellschaft | 培養装置の性能を検証する方法 |
| JP2022533003A (ja) * | 2019-04-30 | 2022-07-21 | アムジエン・インコーポレーテツド | バイオ医薬品生産における細胞株選択のためのデータ駆動予測モデリング |
-
2023
- 2023-07-07 WO PCT/JP2023/025263 patent/WO2024048079A1/ja unknown
Patent Citations (8)
| Publication number | Priority date | Publication date | Assignee | Title |
|---|---|---|---|---|
| JP2008502365A (ja) * | 2004-06-09 | 2008-01-31 | ザ リージェンツ オブ ザ ユニバーシティ オブ ミシガン | 疾患に対する体液性応答のファージ・マイクロアレイ・プロファイリング法 |
| JP2010517530A (ja) * | 2007-02-01 | 2010-05-27 | セントカー・インコーポレーテツド | 高産生細胞株の選択 |
| JP2017511688A (ja) * | 2014-01-30 | 2017-04-27 | バリタセル リミテッド | クローンに由来する産生株細胞のパネルの相対的な流加産生力価を予測する方法 |
| WO2016075216A1 (en) * | 2014-11-12 | 2016-05-19 | Lek Pharmaceuticals D.D. | Predicting genetically stable recombinant protein production in early cell line development |
| JP2021503291A (ja) * | 2017-11-20 | 2021-02-12 | ロンザ リミテッドLonza Limited | 乳酸塩の蓄積を予防しつつ、細胞培養物を増殖させるための方法及びシステム |
| JP2021534782A (ja) * | 2018-08-27 | 2021-12-16 | エフ.ホフマン−ラ ロシュ アーゲーF. Hoffmann−La Roche Aktiengesellschaft | 培養装置の性能を検証する方法 |
| JP2022533003A (ja) * | 2019-04-30 | 2022-07-21 | アムジエン・インコーポレーテツド | バイオ医薬品生産における細胞株選択のためのデータ駆動予測モデリング |
| WO2021166824A1 (ja) * | 2020-02-19 | 2021-08-26 | 富士フイルム株式会社 | 細胞培養プロセス探索方法、細胞培養プロセス探索プログラム、細胞培養プロセス探索装置、及び、学習済みモデル |
Similar Documents
| Publication | Publication Date | Title |
|---|---|---|
| Nguyen et al. | A comprehensive survey of regulatory network inference methods using single cell RNA sequencing data | |
| Costello et al. | A machine learning approach to predict metabolic pathway dynamics from time-series multiomics data | |
| Zhao et al. | GANsDTA: Predicting drug-target binding affinity using GANs | |
| Liepe et al. | Maximizing the information content of experiments in systems biology | |
| JP2022533003A (ja) | バイオ医薬品生産における細胞株選択のためのデータ駆動予測モデリング | |
| Hutchinson et al. | Models and machines: how deep learning will take clinical pharmacology to the next level | |
| Hesami et al. | Machine learning: its challenges and opportunities in plant system biology | |
| Trabuco et al. | Negative protein–protein interaction datasets derived from large-scale two-hybrid experiments | |
| Walsh et al. | Harnessing the potential of machine learning for advancing “quality by design” in biomanufacturing | |
| CN109727637B (zh) | 基于混合蛙跳算法识别关键蛋白质的方法 | |
| Lesage et al. | Computational modeling and reverse engineering to reveal dominant regulatory interactions controlling osteochondral differentiation: potential for regenerative medicine | |
| Cang et al. | A multiscale model via single-cell transcriptomics reveals robust patterning mechanisms during early mammalian embryo development | |
| Wise et al. | SMARTS: reconstructing disease response networks from multiple individuals using time series gene expression data | |
| González-Álvarez et al. | Comparing multiobjective swarm intelligence metaheuristics for DNA motif discovery | |
| Saadatpour et al. | Discrete dynamic modeling of signal transduction networks | |
| Oweida et al. | Merging materials and data science: opportunities, challenges, and education in materials informatics | |
| Spiwok et al. | Collective variable for metadynamics derived from AlphaFold output | |
| Ikonomi et al. | Discrete logic modeling of cell signaling pathways | |
| WO2024048079A1 (ja) | 有用物質を産生するクローンの産生安定性を予測する方法、情報処理装置、プログラムおよび予測モデル生成方法 | |
| Viswan et al. | FindSim: a framework for integrating neuronal data and signaling models | |
| Muzio et al. | networkGWAS: a network-based approach to discover genetic associations | |
| Durumeric et al. | Explaining classifiers to understand coarse-grained models | |
| US20210363528A1 (en) | Biologics engineering via aptamomimetic discovery | |
| Wu et al. | Bayesian information sharing enhances detection of regulatory associations in rare cell types | |
| Handzlik et al. | Dynamic modeling of transcriptional gene regulatory networks |
Legal Events
| Date | Code | Title | Description |
|---|---|---|---|
| 121 | Ep: the epo has been informed by wipo that ep was designated in this application |
Ref document number: 23859849 Country of ref document: EP Kind code of ref document: A1 |