WO2024034305A1 - Pulse pressure measurement device and pulse pressure measurement method - Google Patents
Pulse pressure measurement device and pulse pressure measurement method Download PDFInfo
- Publication number
- WO2024034305A1 WO2024034305A1 PCT/JP2023/025307 JP2023025307W WO2024034305A1 WO 2024034305 A1 WO2024034305 A1 WO 2024034305A1 JP 2023025307 W JP2023025307 W JP 2023025307W WO 2024034305 A1 WO2024034305 A1 WO 2024034305A1
- Authority
- WO
- WIPO (PCT)
- Prior art keywords
- pulse
- pulse wave
- blood pressure
- index
- wave
- Prior art date
Links
- 230000035485 pulse pressure Effects 0.000 title claims abstract description 269
- 238000000034 method Methods 0.000 title claims description 46
- 238000009530 blood pressure measurement Methods 0.000 title claims description 15
- 230000036772 blood pressure Effects 0.000 claims abstract description 187
- 210000005259 peripheral blood Anatomy 0.000 claims abstract description 148
- 239000011886 peripheral blood Substances 0.000 claims abstract description 148
- 230000004069 differentiation Effects 0.000 claims abstract description 10
- 230000000284 resting effect Effects 0.000 claims description 26
- 210000002565 arteriole Anatomy 0.000 claims description 15
- 230000002093 peripheral effect Effects 0.000 claims description 5
- 230000001133 acceleration Effects 0.000 abstract description 25
- 238000005259 measurement Methods 0.000 description 98
- 238000010586 diagram Methods 0.000 description 50
- 230000035488 systolic blood pressure Effects 0.000 description 37
- 210000000707 wrist Anatomy 0.000 description 37
- 230000004048 modification Effects 0.000 description 27
- 238000012986 modification Methods 0.000 description 27
- 230000006870 function Effects 0.000 description 25
- 230000007423 decrease Effects 0.000 description 23
- 206010012601 diabetes mellitus Diseases 0.000 description 22
- 210000000038 chest Anatomy 0.000 description 16
- 210000004204 blood vessel Anatomy 0.000 description 15
- 230000017531 blood circulation Effects 0.000 description 14
- 238000004891 communication Methods 0.000 description 12
- 238000011156 evaluation Methods 0.000 description 11
- 238000002474 experimental method Methods 0.000 description 9
- 210000001519 tissue Anatomy 0.000 description 9
- 210000001061 forehead Anatomy 0.000 description 8
- 238000012545 processing Methods 0.000 description 8
- 230000000694 effects Effects 0.000 description 7
- 210000001367 artery Anatomy 0.000 description 6
- 210000004369 blood Anatomy 0.000 description 5
- 239000008280 blood Substances 0.000 description 5
- 230000008859 change Effects 0.000 description 5
- 230000002792 vascular Effects 0.000 description 5
- 206010003210 Arteriosclerosis Diseases 0.000 description 4
- 208000011775 arteriosclerosis disease Diseases 0.000 description 4
- 230000001364 causal effect Effects 0.000 description 4
- 230000035487 diastolic blood pressure Effects 0.000 description 4
- 238000005070 sampling Methods 0.000 description 4
- 210000003491 skin Anatomy 0.000 description 4
- 102000001554 Hemoglobins Human genes 0.000 description 3
- 108010054147 Hemoglobins Proteins 0.000 description 3
- 238000009826 distribution Methods 0.000 description 3
- 210000003423 ankle Anatomy 0.000 description 2
- RYYVLZVUVIJVGH-UHFFFAOYSA-N caffeine Chemical compound CN1C(=O)N(C)C(=O)C2=C1N=CN2C RYYVLZVUVIJVGH-UHFFFAOYSA-N 0.000 description 2
- 238000001816 cooling Methods 0.000 description 2
- 210000002615 epidermis Anatomy 0.000 description 2
- 230000007246 mechanism Effects 0.000 description 2
- 230000003845 vascular endothelial function Effects 0.000 description 2
- 206010020772 Hypertension Diseases 0.000 description 1
- 206010020850 Hyperthyroidism Diseases 0.000 description 1
- LPHGQDQBBGAPDZ-UHFFFAOYSA-N Isocaffeine Natural products CN1C(=O)N(C)C(=O)C2=C1N(C)C=N2 LPHGQDQBBGAPDZ-UHFFFAOYSA-N 0.000 description 1
- 208000018262 Peripheral vascular disease Diseases 0.000 description 1
- 206010062519 Poor quality sleep Diseases 0.000 description 1
- 206010043268 Tension Diseases 0.000 description 1
- 238000002835 absorbance Methods 0.000 description 1
- 208000007502 anemia Diseases 0.000 description 1
- 210000000709 aorta Anatomy 0.000 description 1
- 238000013459 approach Methods 0.000 description 1
- QVGXLLKOCUKJST-UHFFFAOYSA-N atomic oxygen Chemical compound [O] QVGXLLKOCUKJST-UHFFFAOYSA-N 0.000 description 1
- 230000002567 autonomic effect Effects 0.000 description 1
- 210000000467 autonomic pathway Anatomy 0.000 description 1
- 238000003287 bathing Methods 0.000 description 1
- 229960001948 caffeine Drugs 0.000 description 1
- VJEONQKOZGKCAK-UHFFFAOYSA-N caffeine Natural products CN1C(=O)N(C)C(=O)C2=C1C=CN2C VJEONQKOZGKCAK-UHFFFAOYSA-N 0.000 description 1
- 230000000747 cardiac effect Effects 0.000 description 1
- 208000026106 cerebrovascular disease Diseases 0.000 description 1
- 230000027288 circadian rhythm Effects 0.000 description 1
- 238000004140 cleaning Methods 0.000 description 1
- 230000003247 decreasing effect Effects 0.000 description 1
- 201000010099 disease Diseases 0.000 description 1
- 208000037265 diseases, disorders, signs and symptoms Diseases 0.000 description 1
- 239000006185 dispersion Substances 0.000 description 1
- 230000035622 drinking Effects 0.000 description 1
- 230000001815 facial effect Effects 0.000 description 1
- 230000005484 gravity Effects 0.000 description 1
- 210000004247 hand Anatomy 0.000 description 1
- 230000003862 health status Effects 0.000 description 1
- 210000001624 hip Anatomy 0.000 description 1
- 210000005240 left ventricle Anatomy 0.000 description 1
- 230000003340 mental effect Effects 0.000 description 1
- 208000010125 myocardial infarction Diseases 0.000 description 1
- 210000002445 nipple Anatomy 0.000 description 1
- 229910052760 oxygen Inorganic materials 0.000 description 1
- 239000001301 oxygen Substances 0.000 description 1
- 230000036513 peripheral conductance Effects 0.000 description 1
- 238000013186 photoplethysmography Methods 0.000 description 1
- 238000003825 pressing Methods 0.000 description 1
- 210000002321 radial artery Anatomy 0.000 description 1
- 230000000241 respiratory effect Effects 0.000 description 1
- 230000029058 respiratory gaseous exchange Effects 0.000 description 1
- 230000000391 smoking effect Effects 0.000 description 1
- 208000019553 vascular disease Diseases 0.000 description 1
- 210000003462 vein Anatomy 0.000 description 1
Images


Classifications
-
- A—HUMAN NECESSITIES
- A61—MEDICAL OR VETERINARY SCIENCE; HYGIENE
- A61B—DIAGNOSIS; SURGERY; IDENTIFICATION
- A61B5/00—Measuring for diagnostic purposes; Identification of persons
- A61B5/02—Detecting, measuring or recording pulse, heart rate, blood pressure or blood flow; Combined pulse/heart-rate/blood pressure determination; Evaluating a cardiovascular condition not otherwise provided for, e.g. using combinations of techniques provided for in this group with electrocardiography or electroauscultation; Heart catheters for measuring blood pressure
- A61B5/021—Measuring pressure in heart or blood vessels
-
- A—HUMAN NECESSITIES
- A61—MEDICAL OR VETERINARY SCIENCE; HYGIENE
- A61B—DIAGNOSIS; SURGERY; IDENTIFICATION
- A61B5/00—Measuring for diagnostic purposes; Identification of persons
- A61B5/103—Detecting, measuring or recording devices for testing the shape, pattern, colour, size or movement of the body or parts thereof, for diagnostic purposes
- A61B5/11—Measuring movement of the entire body or parts thereof, e.g. head or hand tremor, mobility of a limb
-
- A—HUMAN NECESSITIES
- A61—MEDICAL OR VETERINARY SCIENCE; HYGIENE
- A61B—DIAGNOSIS; SURGERY; IDENTIFICATION
- A61B5/00—Measuring for diagnostic purposes; Identification of persons
- A61B5/16—Devices for psychotechnics; Testing reaction times ; Devices for evaluating the psychological state
Definitions
- the present invention relates to a pulse pressure measuring device and a pulse pressure measuring method.
- Pulse wave information is optically acquired from parts of the living body, pulse rate and pulse wave time information are calculated from the acquired pulse wave information, and blood pressure information is estimated based on the pulse rate and pulse wave time information.
- a pulse wave measuring device that outputs pulse waves is known (see Patent Document 1).
- Estimated blood pressure information includes information such as blood pressure, blood pressure status, arteriosclerosis, vascular age, and whether or not the patient is predisposed to stroke.
- Pulse pressure which is the difference between systolic blood pressure and diastolic blood pressure, is one indicator for determining health status.
- Conventional pulse wave measurement devices cannot measure pulse pressure.
- An object of the present invention is to provide a pulse pressure measuring device and a pulse pressure measuring method that can measure pulse pressure.
- a peripheral blood pressure index calculation unit that calculates a peripheral blood pressure index related to the steepness of the rise of a pulse wave signal measured by a pulse wave sensor worn by the user; a pulse wave feature calculation unit that calculates an ae time index that includes information regarding the elapsed time from the peak of the a wave to the peak of the e wave of the accelerated pulse wave obtained by second-order differentiation of the waveform of the pulse wave signal;
- a pulse pressure measuring device is provided that includes a pulse pressure calculation section that calculates pulse pressure based on the peripheral blood pressure index and the ae time index.
- a pulse wave sensor attached to the user acquires a pulse wave signal
- a pulse pressure measuring device calculates a peripheral blood pressure index related to the steepness of the rise of the pulse wave signal
- the pulse pressure measurement device calculates an ae time index that includes information regarding the elapsed time from the peak of the a wave to the peak of the e wave of the accelerated pulse wave obtained by second-order differentiation of the waveform of the pulse wave signal
- a pulse pressure measuring method is provided in which the pulse pressure measuring device calculates the pulse pressure based on the peripheral blood pressure index and the ae time index.
- Peripheral blood pressure indicators that have a correlation with blood pressure also have a correlation with pulse pressure. Furthermore, the elapsed time from the peak of the a-wave to the peak of the e-wave of the accelerated pulse wave also has a correlation with the pulse pressure.
- pulse pressure can be calculated with high accuracy.
- FIG. 1 is a block diagram and a schematic diagram of a pulse pressure measuring device according to a first embodiment.
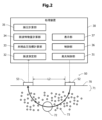
- FIG. 2 is a block diagram and a schematic diagram of a pulse pressure measuring device according to a modification of the first embodiment.
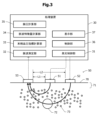
- FIG. 3 is a block diagram and a schematic diagram of a pulse pressure measuring device according to another modification of the first embodiment.
- FIG. 4 is a perspective view and a block diagram of a pulse pressure measuring device according to a modification of the first embodiment shown in FIG. 3.
- FIG. 5 is a graph showing an example of a pulse wave, a velocity pulse wave, and an acceleration pulse wave.
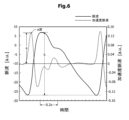
- FIG. 6 is a graph showing an example of a pulse wave and an accelerated pulse wave.
- Figures 7A and 7B show the vicinity of the elbow on the side where the finger, which is the measurement site, is adjusted when the height from the heart to the measurement site (finger) is changed, and when the measurement site is adjusted to the chest height. It is a graph showing the relationship between the value of peripheral blood pressure index "1/VE0.5" found from the pulse wave measured when cooling the body and the systolic blood pressure measured at the wrist.
- Figures 8A and 8B show the vicinity of the elbow on the side where the finger, which is the measurement site, is adjusted when the height from the heart to the measurement site (finger) is changed, and when the measurement site is adjusted to the chest height.
- FIGS. 1 It is a graph showing the relationship between the value of the peripheral blood pressure index "a/S” determined from the pulse wave measured when the patient is cooled, and the systolic blood pressure measured at the wrist.
- Figures 9A and 9B show the area near the elbow on the side where the finger, which is the measurement site, is adjusted when the height from the heart to the measurement site (finger) is changed, and when the measurement site is adjusted to the chest height.
- 2 is a graph showing the relationship between the value of the peripheral blood pressure index "(ab)/(ad)" determined from the pulse wave measured when the patient is cooled, and the systolic blood pressure measured at the wrist.
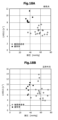
- FIGS. 10A and 10B are scatter diagrams of multiple subjects, with the horizontal axis representing wrist systolic blood pressure and the vertical axis representing peripheral blood pressure index "1/VE0.5.”
- FIGS. 11A and 11B are scatter diagrams of a plurality of subjects, with the horizontal axis representing wrist systolic blood pressure and the vertical axis representing peripheral blood pressure index "a/S.”
- 12A and 12B are scatter diagrams of a plurality of subjects, with the horizontal axis representing wrist systolic blood pressure and the vertical axis representing peripheral blood pressure index "(ab)/(ad)".
- FIGS. 14A and 14B are scatter diagrams of a plurality of subjects in which the vertical axis is the elapsed time from the peak of the a wave to the peak of the b wave of the accelerated pulse wave, and the horizontal axis is the systolic blood pressure at the wrist.
- FIGS. 14A and 14B are scatter diagrams of a plurality of subjects in which the vertical axis is the elapsed time from the peak of the b wave to the peak of the d wave of the accelerated pulse wave, and the horizontal axis is the systolic blood pressure at the wrist.
- FIGS. 15A and 15B are scatter diagrams of a plurality of subjects in which the vertical axis is the elapsed time from the peak of the d wave to the peak of the e wave of the accelerated pulse wave, and the horizontal axis is the systolic blood pressure at the wrist.
- FIGS. 16A and 16B are scatter diagrams of a plurality of subjects in which the vertical axis is the elapsed time from the peak of the a wave to the peak of the e wave of the accelerated pulse wave, and the horizontal axis is the systolic blood pressure at the wrist.
- FIG. 17 is a scatter diagram of multiple subjects, with pulse interval as the vertical axis and wrist systolic blood pressure as the horizontal axis.
- FIGS. 18A and 18B are scatter diagrams of a plurality of subjects, with pulse pressure as the horizontal axis and peripheral blood pressure index "1/VE0.5" as the vertical axis.
- 19A and 19B are scatter diagrams of a plurality of subjects, with pulse pressure as the horizontal axis and peripheral blood pressure index "(ab)/(ad)" as the vertical axis.
- FIGS. 20A and 20B are scatter diagrams of a plurality of subjects, with pulse pressure as the horizontal axis and feature quantity "de time” as the vertical axis.
- FIGS. 21A and 21B are scatter diagrams of a plurality of subjects, with pulse pressure as the horizontal axis and feature quantity "ae time” as the vertical axis.
- FIG. 22 is a scatter diagram of a plurality of subjects, with pulse pressure as the horizontal axis and pulse interval as the vertical axis.
- 23A and 23B are scatter diagrams of a plurality of subjects, with pulse pressure as the horizontal axis and pulse pressure index value Pa as the vertical axis.
- 24A and 24B are scatter diagrams of a plurality of subjects, with pulse pressure as the horizontal axis and pulse pressure index value Pad as the vertical axis.
- FIG. 25 is a scatter diagram showing a plurality of measurement results of one subject over a long period of time, with pulse pressure as the horizontal axis and pulse pressure index value Pad as the vertical axis.
- FIG. 26 is a perspective view and a block diagram of a pulse pressure measuring device according to a third embodiment.
- FIG. 26 is a perspective view and a block diagram of a pulse pressure measuring device according to a third embodiment.
- FIG. 27 is a schematic diagram for explaining the procedure for measuring the difference in height between the ring device and the heart.
- FIG. 28 is a flowchart showing the procedure of a pulse pressure measuring method executed by the pulse pressure measuring device according to the third embodiment.
- FIG. 29 is a flowchart showing the procedure of a pulse pressure measuring method executed by a pulse pressure measuring device according to a modification of the third embodiment.
- FIG. 30 is a perspective view and a block diagram of a pulse pressure measuring device according to a fourth embodiment.
- FIG. 31 is a flowchart showing the procedure of the pulse pressure measuring method executed by the pulse pressure measuring device according to the fourth embodiment.
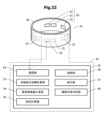
- FIG. 32 is a perspective view and a block diagram of a pulse pressure measuring device according to a fifth embodiment.
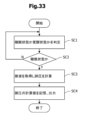
- FIG. 33 is a flowchart showing the procedure of a pulse pressure measuring method executed by the pulse pressure measuring device according to the fifth embodiment.
- a pulse pressure measuring device according to a first embodiment will be described with reference to FIGS. 1, 2, 3, and 4.
- the pulse pressure measuring device calculates pulse pressure based on the waveform of a pulse wave obtained from a subject.
- Pulse waves are used to measure various biological information. For example, it is used to measure pulse rate and oxygen saturation. In addition, it is also used to measure autonomic nervous function based on pulse interval variations, and to measure respiration rate based on baseline variations in pulse waves and pulse interval variations. Furthermore, a technique for estimating blood pressure from the waveform shape of a pulse wave has also been developed. Pulse waves are classified into pressure pulse waves (piezoelectric pulse waves) measured using a piezoelectric sensor or the like, and volume pulse waves (photoplethysm waves) measured using a photoplethysmographic sensor.
- pressure pulse waves piezoelectric pulse waves
- volume pulse waves photoplethysm waves
- Pulse pressure is the difference between systolic blood pressure and diastolic blood pressure, and its normal value is said to be 40 mmHg or more and 50 mmHg or less.
- An example of pulse pressure exceeding the normal range is when stroke volume increases. Possible causes of increased stroke volume include exercise, hyperthyroidism, and anemia.
- pulse pressure exceeds the normal range when the elasticity of large blood vessels decreases.
- blood vessels become stiff, systolic blood pressure increases.
- systolic blood pressure increases, a reaction occurs that dilates peripheral blood vessels, and diastolic blood pressure actually decreases.
- pulse pressure increases. For example, if the aorta has extensive arteriosclerosis, the pulse pressure increases.
- the pulse pressure exceeds 65 mmHg, the risk of myocardial infarction and cerebrovascular disease increases. Measuring pulse pressure helps discover those who are prone to these diseases.
- the pulse pressure measuring device is applicable to both piezoelectric pulse waves and photoplethysmograms. More information can be obtained from photoplethysmography than from piezoelectric plethysmography.
- a photoplethysmogram will be explained as an example.
- FIG. 1 is a block diagram and a schematic diagram of a pulse pressure measuring device according to a first embodiment.
- the pulse pressure measuring device according to the first embodiment includes a processing device 30 and a photoplethysmographic sensor 50.
- Photoplethysmographic sensor 50 includes a light emitting element 51 and a light receiving element 53.
- the processing device 30 includes a light emission control section 31 , a pulse wave measurement section 32 , a peripheral blood pressure index calculation section 33 , a pulse wave feature amount calculation section 34 , a pulse pressure calculation section 35 , a control section 36 , and a display section 37 .
- the light emitting element 51 and the light receiving element 53 are used in contact with the user's body surface 70.
- the light emitting element 51 irradiates measurement light toward the body surface 70 .
- the irradiated light is absorbed, reflected, or scattered (hereinafter sometimes simply referred to as "reflection") by the epidermal region 71, arterioles 72, and capillaries 73 within the body surface 70.
- a part of the reflected light enters the light receiving element 53.
- the arteriole 72 is a thin blood vessel with a diameter of, for example, 20 ⁇ m or more and 200 ⁇ m or less, and exists between the artery and the capillary blood vessel 73.
- a plurality of capillaries 73 branch from the arteriole 72.
- the capillary blood vessel 73 is a thin blood vessel with a diameter of about 10 ⁇ m, for example, and connects an artery and a vein.
- a plurality of capillaries 73 are distributed in an area shallower than the area where arterioles 72 are distributed.
- the light emitting element 51 outputs light for measurement under the control of the processing device 30.
- a signal indicating the intensity of light measured by the light receiving element 53 is input to the processing device 30 .
- a signal indicating the intensity of light detected by the light receiving element 53 will be referred to as a "pulse wave signal".
- Arterial blood contains hemoglobin, and hemoglobin has the property of absorbing light for measurement. The amount of blood flow changes as the heart beats, and the amount of light absorbed changes in accordance with the change in blood flow. Therefore, the intensity of the pulse wave signal changes as the heart beats.
- the light emitting element 51 one that outputs light in a wavelength range from blue to yellowish green (wavelength range of 450 nm or more and 550 nm or less), preferably 500 nm or more and 550 nm or less is used.
- a light emitting diode (LED), a vertical cavity surface emitting laser (VCSEL), or the like is used as the light emitting element 51.
- a photodiode (PD), a phototransistor, or the like is used as the light receiving element 53.
- pulse waves obtained using light in the wavelength range from blue to yellow-green include areas shallow from the skin surface, particularly shallower than areas where arterioles 72 are distributed, and mainly areas where capillaries 73 are distributed.
- the information will be reflected.
- the arrows shown in FIG. 1 do not necessarily indicate the path through which light propagates, but rather the light output from the light emitting element 51 passes through the epidermis region 71 and the region where capillaries 73 are mainly distributed, and passes through the light receiving element 53. It is shown that it is incident on .
- the distance L1 between the light emitting element 51 and the light receiving element 53 is set. It is preferable to keep it short. For example, it is preferable that the interval L1 be 1 mm or more and 3 mm or less.
- Light with wavelengths shorter than 450 nm can damage living tissues.
- the wavelength of the light used to measure pulse waves is preferably 450 nm or more.
- FIG. 2 is a block diagram and a schematic diagram of a pulse pressure measuring device according to a modification of the first embodiment.
- a light emitting element 52 having a different emission wavelength is used in place of the light emitting element 51 of the pulse pressure measuring device according to the first embodiment (FIG. 1).
- the light emitting element 52 used in the modification shown in FIG. 2 outputs light in a wavelength range from red to near-infrared light, for example, in a wavelength range of 750 nm or more and 950 nm or less.
- Light in the wavelength range from red to near-infrared light is absorbed less by living tissues than light in the wavelength range from blue to yellow-green. Therefore, pulse waves obtained using light in the wavelength range from red to near-infrared light reflect information from a deeper region from the skin surface.
- the distance L2 between the light emitting element 52 and the light receiving element 53 is set to 5 mm or more and 20 mm or less. is preferred.
- the absorbance of hemoglobin decreases. Therefore, it is preferable to use light in the wavelength range of 950 nm or less to obtain the pulse wave signal.
- FIG. 3 is a block diagram and a schematic diagram of a pulse pressure measuring device according to another modification of the first embodiment.
- the pulse pressure measuring device according to the second modification includes a light-emitting element 51 (FIG. 1) that outputs light in a wavelength range from blue to yellow-green, and a light-emitting element 52 that outputs light in a wavelength range from red to near-infrared light. It has both.
- the light receiving element 53 detects light in the wavelength range of both the light output from the light emitting element 51 and the light output from the light emitting element 52.
- a preferable range of the distance L1 between the light emitting element 51 and the light receiving element 53 is 1 mm or more and 3 mm or less, and a preferable range of the distance L2 between the light emitting element 52 and the light receiving element 53 is 5 mm or more and 20 mm or less.
- one light-receiving element 53 is arranged for two light-emitting elements 51 and 52, but one light-receiving element is arranged for one light-emitting element 51, and the other light-emitting element Other light receiving elements may be arranged with respect to element 52.
- the control unit 36 of the processing device 30 performs controls such as starting and ending the measurement, displaying the measurement results on the display unit 37, and storing the measurement results.
- the light emission control unit 31 controls pulsed light emission of the light emitting element 51 or the light emitting element 52.
- the light emitting element 51 or the light emitting element 52 is caused to emit pulsed light at a predetermined frequency of 100 Hz or more and 1000 Hz or less.
- the light emitting element 51 and the light emitting element 52 are caused to emit light alternately.
- the pulse wave measurement unit 32 generates a pulse wave waveform (hereinafter sometimes simply referred to as a "pulse wave") from the measurement result (pulse wave signal) input from the light receiving element 53.
- the pulse wave measurement unit 32 generates a pulse wave by reading the measured value of light intensity from the light receiving element 53 at a predetermined sampling rate in synchronization with the pulsed light emission of the light emitting element 51 or 52.
- the pulse wave measurement unit 32 reads the measured value of light intensity from the light receiving element 53 at a predetermined sampling rate in synchronization with the pulsed light emission of the light emitting element 51 or the light emitting element 52. Accordingly, a pulse wave due to the light output from the light emitting element 51 and a pulse wave due to the light output from the light emitting element 52 are generated separately.
- the peripheral blood pressure index calculation unit 33 calculates a peripheral blood pressure index related to the steepness of the rise of the pulse wave from the pulse wave generated by the pulse wave measurement unit 32.
- the pulse wave feature calculating unit 34 calculates an ae time index from the pulse wave generated by the pulse wave measuring unit 32.
- the peripheral blood pressure index and the ae time index will be explained in detail later.
- the pulse pressure calculation unit 35 calculates the pulse pressure based on the peripheral blood pressure index and the ae time index to obtain a measured value of the pulse pressure.
- FIG. 4 is a perspective view and a block diagram of a pulse pressure measuring device according to a modification of the first embodiment shown in FIG. 3.
- the pulse pressure measuring device according to this modification includes a ring device 61 and a portable mobile terminal 62.
- the ring device 61 will be explained below.
- Two light emitting elements 51 and 52 and one light receiving element 53 are attached to the inner surface of the annular mounting member 60.
- the attachment member 60 is used by being attached to a user's finger.
- the mounting member 60 is prepared in a plurality of sizes depending on the thickness of the user's fingers.
- the light emitting elements 51 and 52 output light toward the finger.
- the light receiving element 53 is attached at a position where the light reflected inside the finger is incident.
- the mounting member 60 further incorporates a light emission control section 31, a pulse wave measurement section 32, and a communication section 55.
- the light emission control section 31, the pulse wave measurement section 32, and the communication section 55 may be configured as one integrated circuit.
- the functions of the processing device 30 are realized by a ring device 61 and a portable mobile terminal 62.
- the mobile terminal 62 for example, a smartphone, a tablet terminal, a notebook computer, etc. are used.
- the mobile terminal 62 includes a communication section 64 , a peripheral blood pressure index calculation section 33 , a pulse wave feature amount calculation section 34 , a pulse pressure calculation section 35 , a control section 36 , and a display section 37 .
- the functions of the peripheral blood pressure index calculation section 33, the pulse wave feature amount calculation section 34, and the pulse pressure calculation section 35 may be realized by a server. When this configuration is adopted, data communication is performed between the mobile terminal 62 and the server via a communication line.
- Data communication is performed between the communication unit 55 of the ring device 61 and the communication unit 64 of the mobile terminal 62.
- short-range wireless communication systems of various standards are used, for example.
- the excellent effects of using the ring device 61 to acquire pulse waves will be explained. Since fingers have relatively thin epidermis, they are suitable for acquiring pulse waves using the photoplethysmogram sensor 50. Furthermore, since the capillary path is less complicated than that of the face, the value of the pulse wave feature value is likely to be stable. Therefore, the reliability of the pulse pressure determined from the pulse wave increases. Furthermore, when the pulse pressure measuring device is used continuously or intermittently, an excellent effect can be obtained in that even if the ring device 61 is worn on the finger for a long time, there is little discomfort or discomfort.
- peripheral blood pressure index which is one basic information for determining pulse pressure using the pulse pressure measuring device according to the first embodiment, will be described.
- peripheral blood pressure is defined as blood pressure in peripheral arterioles and capillaries.
- Peripheral blood pressure is sometimes used to mean blood pressure at the wrist or ankle measured with a cuff-type blood pressure monitor, but blood pressure at the wrist or ankle is a value measured in a large artery (such as the radial artery).
- Blood pressure in blood vessels decreases as blood progresses from large arteries to arterioles and capillaries. The degree to which blood pressure decreases varies depending on the measurement site, the individual's vascular condition (presence of arteriosclerosis, etc.), mental condition (autonomic nerve condition, etc.), environment (temperature, presence of noise, etc.), clothing, etc.
- peripheral blood pressure index an index that is effective for determining peripheral blood pressure is adopted as a peripheral blood pressure index.
- the peripheral blood pressure index is considered to have the following characteristics. First, when blood vessels are healthy and under conditions where vascular resistance does not change, peripheral blood pressure indicators have a positive correlation with blood pressure in the upper arm or wrist. Second, when the vicinity of the measurement site is cooled to constrict blood vessels, the peripheral blood pressure index decreases. When blood vessels constrict, peripheral vascular resistance increases and blood pressure in the upper arm and wrist may rise.
- FIG. 5 is a graph showing an example of a pulse wave, velocity pulse wave, and acceleration pulse wave.
- the peripheral blood pressure index calculation unit 33 (FIGS. 1, 2, and 3) performs first-order differentiation and second-order differentiation of the pulse wave.
- the waveforms obtained by first-order differentiation and second-order differentiation of a pulse wave are referred to as a velocity pulse wave and an acceleration pulse wave, respectively.
- the velocity pulse wave is determined by numerically differentiating the intensity of the pulse wave, which is distributed discretely at time intervals corresponding to the sampling rate, by the time interval corresponding to the sampling rate.
- the acceleration pulse wave is determined by numerically differentiating the magnitude of the velocity pulse wave.
- the horizontal axis of FIG. 5 represents time in units [s]
- the left vertical axis represents the magnitude of the velocity pulse wave and acceleration pulse wave normalized so that the maximum value is 1
- the right vertical axis represents the pulse wave. represents the size of in arbitrary units.
- a solid line, a long broken line, and a short broken line in the graph shown in FIG. 2 indicate a pulse wave, a velocity pulse wave, and an acceleration pulse wave, respectively.
- five peaks appear in an accelerated pulse wave within one beat.
- the 1st, 2nd, 3rd, 4th, and 5th peaks within one beat are called a wave, b wave, c wave, d wave, and e wave, respectively.
- the full width at half maximum of the first upward peak of the velocity pulse wave is written as "VE0.5".
- the difference between the peak value of the a wave and the peak value of the b wave is marked as “ab”
- the difference between the peak value of the a wave and the peak value of the d wave is marked as "ad”.
- a concave portion called the notch IC appears slightly behind the maximum peak of the pulse wave.
- FIG. 6 is a graph showing an example of a pulse wave and an accelerated pulse wave.
- the horizontal axis represents time, the left vertical axis represents the magnitude of the pulse wave in arbitrary units, and the right vertical axis represents the magnitude of the accelerated pulse wave in arbitrary units.
- 5 scales on the horizontal axis corresponds to 0.2 s.
- the peak value of the a wave of the accelerated pulse wave is marked as "a”, and the amplitude of the pulse wave is marked as "S”.
- the amplitude S of the pulse wave corresponds to the difference between the minimum value and the maximum value after the waveform is corrected so that the minimum values of two consecutive pulse waves have the same magnitude.
- pulse wave feature quantities that reflect the above two features of the peripheral blood pressure index.
- VE0.5 full width at half maximum
- a/S ⁇ Ratio of amplitude S of pulse wave to peak value a of wave a of accelerated pulse wave
- a/S ⁇ Ratio of amplitude S of pulse wave to peak value a of wave a of accelerated pulse wave
- a/S ⁇ Ratio of amplitude S of pulse wave to peak value a of wave a of accelerated pulse wave
- a/S ⁇ Ratio of amplitude S of pulse wave to peak value a of wave a of accelerated pulse wave
- a/S ⁇ Ratio of amplitude S of pulse wave to peak value a of wave a of accelerated pulse wave
- a/S ⁇ Ratio of amplitude S of pulse wave to peak value a of wave a of accelerated pulse wave
- a/S ⁇ Ratio of amplitude S of pulse wave to peak value
- Figures 7A and 7B show the vicinity of the elbow on the side where the finger, which is the measurement site, is adjusted when the height from the heart to the measurement site (finger) is changed, and when the measurement site is adjusted to the chest height. It is a graph showing the relationship between the value of peripheral blood pressure index "1/VE0.5" found from the pulse wave measured when cooling the body and the systolic blood pressure measured at the wrist. 7A and 7B show the case where the pulse pressure measuring device shown in FIG. 1 (green light) is used to measure the pulse wave, and the pulse pressure measuring device shown in FIG. 2 (near infrared light) is used to measure the pulse wave, respectively. The measurement results are shown below.
- Pulse waves measured using green light mainly reflect fluctuations in blood flow in capillaries 73 (FIG. 1)
- pulse waves measured using near-infrared light mainly reflect fluctuations in blood flow in capillaries 73 and arterioles 72.
- the fluctuations in blood flow shown in ( Figure 2) are reflected.
- the horizontal axis of the graphs in FIGS. 7A and 7B represents the systolic blood pressure at the wrist in units [mmHg], and the vertical axis represents the peripheral blood pressure index "1/(VE0.5)" in units [s -1 ]. represent.
- the results of measurements performed on three subjects A, B, and C are shown using triangle symbols, square symbols, and circle symbols, respectively.
- the three hollow symbols shown for each subject indicate the values of the pulse wave features obtained from the pulse waves obtained by setting the height of the measurement site (finger) to the height of the navel, chest, and forehead. It shows.
- the value of the peripheral blood pressure index "1/VE0.5" decreases in the order of height of the measurement site: navel, chest, and forehead.
- the symbol filled in black for each subject is the peripheral blood pressure index "1/VE0.5" obtained from the pulse wave obtained with the measurement site set at chest level and the area near the elbow cooled. ” value is shown.
- the peripheral blood pressure index "1/VE0.5” has a generally positive correlation with the systolic blood pressure at the wrist. I understand. Furthermore, although there are some exceptions, it can be seen that when the vicinity of the measurement site is cooled to constrict blood vessels, the peripheral blood pressure index "1/VE0.5” decreases. The appearance of this change matches the expected characteristics of the peripheral blood pressure index. Therefore, the peripheral blood pressure index "1/VE0.5" is considered to be an effective index for estimating peripheral blood pressure.
- the peripheral blood pressure index "1/VE0.5" the reciprocal of the parameter representing the width of the maximum peak of the velocity pulse wave may be used.
- a negative exponent of a parameter representing the width of the maximum peak of the velocity pulse wave may be used.
- a parameter representing the width of the maximum peak of the velocity pulse wave may be used as a variable, and a function such that the value of the function decreases as the width of the peak increases may be used as the peripheral blood pressure index.
- FIGS. 8A and 8B show the vicinity of the elbow on the side where the finger, which is the measurement site, is adjusted when the height from the heart to the measurement site (finger) is changed, and when the measurement site is adjusted to the chest height. It is a graph showing the relationship between the value of the peripheral blood pressure index "a/S" determined from the pulse wave measured when the patient is cooled, and the systolic blood pressure measured at the wrist.
- FIGS. 8A and 8B show the case where the pulse pressure measuring device shown in FIG. 1 (green light) is used to measure the pulse wave, and the pulse pressure measuring device shown in FIG. 2 (near infrared light) is used to measure the pulse wave, respectively. The measurement results are shown below.
- the horizontal axis of the graphs in FIGS. 8A and 8B represents the systolic blood pressure at the wrist in units [mmHg], and the vertical axis represents the peripheral blood pressure index "a/S" in arbitrary units.
- the meaning of each symbol in FIGS. 8A and 8B is the same as the meaning of each symbol in the graphs shown in FIGS. 7A and 7B.
- peripheral blood pressure index "a/S” is considered to be an effective index for estimating peripheral blood pressure. Note that from the results shown in FIGS. 8A and 8B, it can be seen that it is preferable to use green light rather than near-infrared light for measuring the peripheral blood pressure index "a/S".
- the peripheral blood pressure index "a/S” the product of the peak value a of the a wave of the accelerated pulse wave to a power with a positive index and the amplitude S of the pulse wave to a power with a negative index is calculated as the peripheral blood pressure. It can also be used as an indicator.
- the peripheral blood pressure index may be calculated based on information regarding the peak value of the a-wave of the accelerated pulse wave and the amplitude of the pulse wave signal.
- a function may be used as a peripheral blood pressure index in which the peak value a and the amplitude S are used as variables, and when the peak value a increases, the value of the function also increases, and when the amplitude S increases, the value of the function decreases. .
- Figures 9A and 9B show the area near the elbow on the side where the finger, which is the measurement site, is adjusted when the height from the heart to the measurement site (finger) is changed, and when the measurement site is adjusted to the chest height.
- 2 is a graph showing the relationship between the value of the peripheral blood pressure index "(ab)/(ad)" determined from the pulse wave measured when the patient is cooled, and the systolic blood pressure measured at the wrist.
- 9A and 9B show the case where the pulse pressure measuring device shown in FIG. 1 (green light) is used to measure the pulse wave, and the pulse pressure measuring device shown in FIG. 2 (near infrared light) is used to measure the pulse wave, respectively. The measurement results are shown below.
- the horizontal axis of the graphs in FIGS. 9A and 9B represents the systolic blood pressure at the wrist in units [mmHg], and the vertical axis represents the peripheral blood pressure index "(ab)/(ad)".
- the meaning of each symbol in FIGS. 9A and 9B is the same as the meaning of each symbol in the graphs shown in FIGS. 7A and 7B.
- peripheral blood pressure index "(ab)/(ad)" is considered to be an effective index for estimating peripheral blood pressure.
- peripheral blood pressure index (a-b)/(a-d)
- the peripheral blood pressure index may be calculated based on information regarding the difference between the peripheral blood pressure index and the peripheral blood pressure index.
- the difference (a-b) between the peak value of the a-wave and the peak value of the b-wave and the difference (a-d) between the peak value of the a-wave and the peak value of the d-wave are variables
- the difference (a A function in which the value of the function increases as the value of -b) increases, and decreases as the value of the difference (ad) increases may be used as the peripheral blood pressure index.
- the hand with the photoplethysmogram sensor was held at chest height, and the photoplethysmogram and blood pressure were each measured. If both were measured at the same time, blood flow in the finger would be inhibited by the cuff, so blood pressure was measured with a cuff-type sphygmomanometer after the photoplethysmogram measurement was completed.
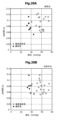
- FIGS. 10A and 10B are scatter diagrams of multiple subjects in which the horizontal axis is the wrist systolic blood pressure (hereinafter sometimes simply referred to as blood pressure) and the vertical axis is the peripheral blood pressure index "1/VE0.5".
- FIGS. 11A and 11B are scatter diagrams of a plurality of subjects, with the horizontal axis representing wrist systolic blood pressure and the vertical axis representing peripheral blood pressure index "a/S.”
- 12A and 12B are scatter diagrams of a plurality of subjects, with the horizontal axis representing wrist systolic blood pressure and the vertical axis representing peripheral blood pressure index "(ab)/(ad)".
- FIGS. 10A, 11A, and 12A show the results of measuring pulse waves using green light
- FIGS. 10B, 11B, and 12B show the results of measuring pulse waves using near-infrared light. show.
- the black circle symbol and the hollow circle symbol indicate the measurement results of a healthy person and the measurement result of a diabetic patient, respectively.
- FIGS. 10A and 10B It can be seen from FIGS. 10A and 10B that the higher the blood pressure, the smaller the peripheral blood pressure index "1/VE0.5” tends to be. Furthermore, when pulse waves are measured using green light, the peripheral blood pressure index "1/VE0.5” of diabetic patients is concentrated in a relatively low range, and the peripheral blood pressure index "1/VE0.5” of healthy subjects is concentrated in a relatively low range. .5" is clearly separated from the distribution range. Such measurement results are presumed to be due to the following mechanism.
- vascular disease When blood sugar levels remain high, blood vessels become fragile and crumbly, a condition known as vascular disease, which progresses to arteriosclerosis in large blood vessels. Small blood vessels are also damaged, resulting in decreased blood vessel function (vascular endothelial function) and poor blood flow.
- peripheral blood pressure decreases as it progresses from large arteries to arterioles and capillaries. It is assumed that when vascular endothelial function decreases, the degree of decrease in peripheral blood pressure increases. It is said that approximately 40% to 60% of diabetic patients have hypertension. In the evaluation results shown in FIG. 10A, the systolic blood pressure of diabetic patients is higher than that of healthy subjects, but this tendency is not significant. On the other hand, it is clear that the peripheral blood pressure index "1/VE0.5" of diabetic patients tends to be lower than the peripheral blood pressure index "1/VE0.5" of healthy people. This can be explained by the fact that peripheral vascular disease occurs in diabetic patients and blood flow to peripheral blood vessels is inhibited, resulting in a decrease in the peripheral blood pressure index "1/VE0.5".
- the peripheral blood pressure index "a/S” tends to decrease as the blood pressure increases, similar to the peripheral blood pressure index "1/VE0.5". Note that in diabetic patients, the dispersion of the peripheral blood pressure index "a/S” is large, and the correlation between the peripheral blood pressure index "a/S” and blood pressure is not clear. This is presumed to be because the peak value a of the a wave of the accelerated pulse wave and the amplitude S of the pulse wave (FIG. 6) are easily influenced by various factors.
- the peripheral blood pressure index "(a-b)/(a-d)” tends to decrease as the blood pressure increases, similar to the peripheral blood pressure index "1/VE0.5". show. Furthermore, the magnitude of the peripheral blood pressure index "(a-b)/(a-d)” calculated from the pulse wave obtained using green light is clearly separated between healthy subjects and diabetic patients. . The three measurement results located on the horizontal axis where the peripheral blood pressure index "(ab)/(ad)" is zero indicate subjects for whom the b wave of the accelerated pulse wave could not be detected.
- FIGS. 13A to 17 feature quantities of pulse waves that are thought to have a causal relationship with blood pressure will be described.
- the drawings from FIG. 13A to FIG. 17 are scatter diagrams of a plurality of subjects, with the horizontal axis representing wrist systolic blood pressure and the vertical axis representing various characteristic amounts of pulse waves.
- the vertical axis in FIGS. 13A and 13B represents the elapsed time from the peak of the a wave of the accelerated pulse wave to the peak of the b wave (hereinafter referred to as "ab time”) in units [s].
- the vertical axis in FIGS. 14A and 14B represents the elapsed time from the peak of the b wave to the peak of the d wave of the accelerated pulse wave (hereinafter referred to as "bd time”) in units [s].
- the vertical axis in FIGS. 15A and 15B represents the elapsed time from the peak of the d wave to the peak of the e wave of the accelerated pulse wave (hereinafter referred to as "de time”) in units [s].
- 16A and 16B represents the elapsed time from the peak of the a wave of the accelerated pulse wave to the peak of the e wave (hereinafter referred to as "ae time”) in units of [s].
- the vertical axis in FIG. 17 represents the pulse interval in units [s].
- FIGS. 13A, 14A, 15A, and 16A show the characteristic amounts of pulse waves measured using green light
- FIGS. 13B, 14B, 15B, and 16B show the characteristics of pulse waves measured using near-infrared light.
- the characteristic quantities of the pulse wave measured using the method are shown.
- the pulse intervals shown in FIG. 17 are the same regardless of whether green light or near-infrared light is used.
- the feature amount "ab time” and systolic blood pressure have a weak negative correlation.
- the feature amount "bd time” and the systolic blood pressure have a positive correlation.
- the feature amount "de time” and the systolic blood pressure have a negative correlation.
- the feature quantity "ae time” and the pulse interval had no correlation with systolic blood pressure.
- the time when the peak of the d wave of the accelerated pulse wave appears is close to the time when the pulse wave takes its maximum value.
- the vicinity of the b-wave of the accelerated pulse wave is regarded as an ejection wave, and the vicinity of the d-wave is regarded as a reflected wave, and thereafter (near 0.4 seconds shown in FIG. 5), a notch IC of the pulse wave appears. Since there is no clear correlation between blood pressure and "ae time", the higher the blood pressure, the shorter the "de time". (in the direction approaching the peak position of the e-wave).
- An increase in blood flow means an increase in ejection waves and reflected waves. Therefore, due to the increase in blood flow, the convex portion of the pulse wave (range from the B wave to the D wave) spreads backward. As a result, it is thought that the position of the peak of the d-wave also moves backward. That is, it is considered that the blood flow rate increased due to the increase in blood pressure, and the "de time" became shorter due to the increase in the blood flow rate.
- the measurement results of some diabetic patients are located on the horizontal axis where "ab time” or "bd time” is 0 seconds. This indicates that the b wave of the accelerated pulse wave could not be detected. It can be seen that there were more subjects for whom b-waves could not be detected when measurements were taken using green light than when measurements were taken using near-infrared light. In subjects with poor peripheral blood circulation, such as diabetic patients, the b-wave of the accelerated pulse wave is often small, making it difficult to detect the b-wave.
- peripheral blood pressure index "1 /VE0.5'' Figure 10A
- peripheral blood pressure index ⁇ (a-b)/(a-d)'' when using green light and feature amount ⁇ (a-b)/(ad)'' when using green light or near-infrared light. It can be seen that "de time" can be mentioned.
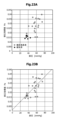
- FIG. 18A to FIG. 22 are scatter diagrams of a plurality of subjects, with the horizontal axis representing pulse pressure and the vertical axis representing various characteristic amounts of pulse waves.
- the vertical axis in FIGS. 18A and 18B represents the peripheral blood pressure index "1/VE0.5" in units [s ⁇ 1 ].
- the vertical axis in FIGS. 19A and 19B represents the peripheral blood pressure index "(ab)/(ad)”.
- the vertical axis in FIGS. 20A and 20B represents the feature amount "de time” in units [s].
- the vertical axis in FIGS. 21A and 21B represents the feature amount "ae time” in units [s].
- the vertical axis in FIG. 22 represents the pulse interval in units [s].
- FIG. 18A, FIG. 19A, FIG. 20A, and FIG. 21A show the characteristic amounts of pulse waves measured using green light
- FIG. 18B, FIG. 19B, FIG. 20B, and FIG. The characteristic quantities of the pulse wave measured using the method are shown.
- the pulse intervals shown in FIG. 22 are the same regardless of whether green light or near-infrared light is used.
- peripheral blood pressure index "1/VE0.5” Figures 18A and 18B
- peripheral blood pressure index "(a-b)/(a-d)” 19A, FIG. 19B
- the feature amount "ae time” FIGS. 21A, 21B
- a stronger correlation was observed when green light was used than when near-infrared light was used.
- No significant correlation with pulse pressure is confirmed between the feature amount "de time” (FIGS. 20A and 20B) and the pulse interval (FIG. 22).
- peripheral blood pressure index "1/VE0.5” and the peripheral blood pressure index "(ab)/(ad)” have a negative correlation with pulse pressure. This is similar to the relationship between the peripheral blood pressure index "1/VE0.5” and the peripheral blood pressure index "(ab)/(ad)” and systolic blood pressure. It can be expected that a subject with a small peripheral blood pressure index "1/VE0.5” and a small peripheral blood pressure index "(ab)/(ad)” will have a large vascular resistance. It is generally known that when vascular resistance is high, pulse pressure is high. In other words, it is based on such general knowledge that the peripheral blood pressure index "1/VE0.5” and the peripheral blood pressure index "(a-b)/(a-d)” have a negative correlation with pulse pressure. does not contradict.
- the feature quantity "ae time” has a negative correlation with pulse pressure. There is no significant difference in the feature quantity "ae time” between when measured using green light and when measured using near-infrared light.
- the notch IC (FIG. 5) that appears in the pulse wave is said to be at the end of the systole, and the position of the peak of the e wave of the accelerated pulse wave corresponds to the position of the notch IC. Since there is no difference in "ae time” when using green light and when using near-infrared light, it is assumed that "ae time” is not easily affected by blood vessel conditions, etc. .
- a long “ae time” means that the left ventricle contracts for a long time. Therefore, "ae time” is considered to have a positive correlation with stroke cardiac output.
- the fact that the pulse pressure has a positive correlation with the "ae time” can be explained by the fact that as the stroke volume increases, the pulse pressure increases.
- pulse pressure is calculated based on a peripheral blood pressure index "1/VE0.5" that has a correlation with pulse pressure and a feature amount "ae time”.
- the pulse pressure is calculated using a function whose variables are the value of the power of the peripheral blood pressure index "1/VE0.5" and the value of the power of the feature quantity "ae time”.
- ⁇ and ⁇ are positive fitting parameters.
- the actual pulse pressure value can be calculated by multiplying the pulse pressure index value Pa by a coefficient.
- the fitting parameters ⁇ , ⁇ , and coefficients can be determined by actually conducting evaluation experiments.
- Pulse waves of a plurality of subjects were measured, and a pulse pressure index value Pa was calculated from the pulse waves. Furthermore, pulse pressure was calculated from the systolic and diastolic blood pressures measured at the wrist. Subjects included multiple healthy subjects and multiple diabetic patients. The measurement of the pulse wave was performed with the ring device 61 (FIG. 4) attached to the subject's finger, and the height of the measurement site approximately aligned with the height of the heart.
- the horizontal axis represents pulse pressure in the unit [mmHg], and the vertical axis represents pulse pressure index value Pa.
- the peripheral blood pressure index "1/VE0.5" was determined from the pulse wave measured using green light, and the feature amount "ae time” was determined from the pulse wave measured using near-infrared light.
- the filled circle symbols and hollow circle symbols in FIG. 23A indicate the measurement results of healthy subjects and diabetic patients, respectively. Overall, it can be seen that the pulse pressure index value Pa and the pulse pressure have a positive correlation.
- FIG. 23B is a scatter diagram showing the measurement results without distinguishing between healthy subjects and diabetic patients.
- the regression line is shown as a broken line.
- the coefficient of determination R 2 was approximately 0.47.
- the correlation coefficient is about 0.69, and it can be said that there is a sufficient correlation between the pulse pressure index value Pa and the pulse pressure.
- the pulse pressure measurement method according to the first embodiment allows the pulse pressure to be determined using the photoplethysmographic sensor.
- the peripheral blood pressure index "1/VE0.5" and the feature quantity "ae time” are obtained, and the pulse pressure can be calculated using equation (1). Note that the accuracy of the fitting parameters ⁇ and ⁇ may be improved by collecting more subjects and performing an evaluation experiment.
- the peripheral blood pressure index "1/VE0.5” is determined using green light, and the feature amount “ae time” is determined using near-infrared light.
- the peripheral blood pressure index "1/VE0.5” may be determined using near-infrared light, or the feature amount "ae time” may be determined using green light.
- green light instead of green light, light having a wavelength range from blue to yellow-green may be used.
- peripheral blood pressure index "1/VE0.5” another peripheral blood pressure index related to the steepness of the rise of the pulse wave, such as the peripheral blood pressure index "a/S” or “ (ab)/(ad)” may also be used.
- an index having a positive correlation with "ae time” herein referred to as "ae time index”
- a function may be used in which the value of the function decreases as the peripheral blood pressure index increases, and the value of the function increases as the ae time index increases.
- FIGS. 23A and 23B were collected by wearing the ring device 61 (FIG. 4) on the subject's fingertip, it may also be worn on the subject's fingertip.
- a ring-shaped ring device 61 (FIG. 5) is worn on the finger, but instead of the ring device 61, a device shaped to be worn on a part other than the finger may be used.
- a wearable device may be a wristband or wristwatch type that is worn on the wrist, an earphone type that is worn in the ear, a patch type that is attached to the skin, or a wearable device that is worn around the neck.
- a neckband type one may also be used.
- the pulse pressure measuring device does not necessarily have to be wearable, and may be a device that measures a pulse wave by pressing a finger against the photoplethysmographic sensor 50 as necessary.
- the pulse pressure measuring device may be a portable device such as a smartphone, or a fixed device.
- light reflected from living tissue such as a finger is detected, but light transmitted through living tissue may also be detected.
- a light emitting element and a light receiving element are placed facing each other with the finger in between. Note that depending on the positional relationship between the light emitting element and the light receiving element, both the light reflected by the living tissue and the light transmitted through the living tissue may be detected by the light receiving element. That is, the light receiving element may detect the light that is output from the light emitting element and passes through the biological tissue.
- pulse pressure is calculated based on a peripheral blood pressure index "1/VE0.5" that has a correlation with pulse pressure and a feature amount "ae time”.
- the pulse pressure is calculated based on the feature quantity "de time” in addition to the peripheral blood pressure index "1/VE0.5" and the feature quantity "ae time”.
- pulse pressure can be calculated using a function whose variables are the power of the peripheral blood pressure index "1/VE0.5", the power of the feature quantity "ae time”, and the power of the feature quantity "de time”. calculate.
- the pulse pressure index value Pad is calculated using the following formula.
- Pad (1/VE0.5) - ⁇ ⁇ (ae time) ⁇ ⁇ (de time) - ⁇ ... (2)
- ⁇ , ⁇ , and ⁇ are positive fitting parameters.
- the actual pulse pressure value can be calculated by multiplying the pulse pressure index value Pad by a coefficient.
- the fitting parameters ⁇ , ⁇ , ⁇ , and coefficients can be determined by actually conducting evaluation experiments.
- the horizontal axis represents pulse pressure in units [mmHg], and the vertical axis represents pulse pressure index value Pad.
- the peripheral blood pressure index "1/VE0.5" is obtained from the pulse wave measured using green light, and the feature quantities "ae time” and "de time” are obtained from the pulse wave measured using near-infrared light. Ta.
- the filled circle symbols and hollow circle symbols in FIG. 24A indicate the measurement results of healthy subjects and diabetic patients, respectively. Overall, it can be seen that the pulse pressure index value Pad and pulse pressure have a positive correlation.
- FIG. 24B is a scatter diagram showing the measurement results without distinguishing between healthy subjects and diabetic patients.
- the regression line is shown as a broken line.
- the coefficient of determination R 2 was approximately 0.52.
- the correlation coefficient is about 0.72, and it can be said that there is a strong correlation between the pulse pressure index value Pad and the pulse pressure. In this manner, the pulse pressure measurement method according to the second embodiment allows the pulse pressure to be determined using the photoplethysmographic sensor.
- the peripheral blood pressure index "1/VE0.5", the feature quantity "ae time”, and the feature quantity "de time” are obtained, and the pulse pressure can be calculated using equation (2).
- the accuracy of the fitting parameters ⁇ , ⁇ , and ⁇ may be improved by collecting more subjects and performing an evaluation experiment.
- the peripheral blood pressure index "1/VE0.5” is determined using green light, and the feature quantities “ae time” and “de time” are determined using near-infrared light.
- the peripheral blood pressure index "1/VE0.5” may be obtained using near-infrared light, or the feature quantity "ae time” or “de time” may be obtained using green light. .
- green light instead of green light, light having a wavelength range from blue to yellow-green may be used.
- peripheral blood pressure index "1/VE0.5” another peripheral blood pressure index related to the steepness of the rise of the pulse wave, such as the peripheral blood pressure index "a/S” or " (ab)/(ad)" may also be used.
- an ae time index having a positive correlation with "ae time” may be used.
- an index having a positive correlation with "de time” herein referred to as "de time index”
- the value of the function decreases as the peripheral blood pressure index increases, the value of the function increases as the ae time index increases, and the value of the function decreases as the de time index increases.
- a function may also be used.
- FIG. 25 is a scatter diagram of multiple measurement results measured over a long period of time for one subject. Note that this subject is a healthy person and is different from the subject who collected the data shown in FIGS. 24A and 24B.
- the horizontal axis of FIG. 25 represents pulse pressure in units [mmHg], and the vertical axis represents pulse pressure index value Pad.
- the fitting parameters ⁇ , ⁇ , and ⁇ in equation (2) are the same as in FIGS. 24A and 24B.
- One set consisted of measuring the pulse wave with the height of the measurement site approximately matching the navel height, chest height, and forehead height, and 24 sets of measurements were performed over a 20-day period. went. The measurement times were morning, noon, and evening. During 20 days, 9 sets of measurements were performed in the morning, 12 sets of measurements were performed in the afternoon, and 3 sets of measurements were performed in the evening.
- the measurement procedure is as follows. First, the pulse wave is measured using a photoplethysmographic sensor at the level of the navel, and then the blood pressure at the wrist is measured at the level of the navel. Next, the pulse wave is measured using a photoplethysmographic sensor at chest level, and then the blood pressure at the wrist is measured at chest level. Next, the pulse wave is measured using a photoplethysmographic sensor at the level of the forehead, and finally the blood pressure at the wrist is measured at the level of the forehead. The measurement of pulse waves by the photoplethysmographic sensor and the measurement of blood pressure at the wrist are not performed at the same time.
- the circle symbol, square symbol, and triangle symbol in the scatter diagram shown in Figure 25 indicate the measurement results obtained by adjusting the height of the measurement site to the forehead height, chest height, and navel height, respectively. .
- the broken line shown in FIG. 25 is the same as the regression line shown in FIG. 24B. As can be seen from FIG. 25, the pulse pressure tends to be relatively large at the navel level and relatively small at the forehead level.
- the pulse pressure index value Pad varies among the navel height, chest height, and forehead height, but is distributed in almost the same range regardless of the height of the measurement site. It can be seen that this distribution almost overlaps with the distribution of the pulse pressure index value Pad of a healthy person shown in FIG. 24A. Therefore, it can be inferred that the pulse pressure index value Pad calculated using equation (2) will not vary greatly even if the height of the measurement site deviates from the height of the heart.
- What is useful to the user is the value of the pulse pressure at heart level. Considering user convenience, it is desirable to be able to estimate the pulse pressure value at the heart level even if the height of the measurement site, such as a finger, deviates from the heart level.
- the calculation formula for the pulse pressure index value Pad of formula (2) used in the second embodiment is also useful from the viewpoint of user convenience.
- the blood pressure measuring device has a function of measuring the difference in height between the measurement site and the heart.
- FIG. 26 is a perspective view and a block diagram of a pulse pressure measuring device according to a third embodiment.
- the pulse pressure measuring device according to the third embodiment includes a ring device 61 and a mobile terminal 62, similar to the pulse pressure measuring device according to the modification of the first embodiment shown in FIG.
- the mobile terminal 62 of the pulse pressure measuring device according to the third embodiment has, in addition to the configuration of the mobile terminal 62 of the pulse pressure measuring device according to the modification of the first embodiment (FIG. 4), a camera 63, an acceleration sensor 65, and a It includes a calculation unit 38.
- the height calculation unit 38 calculates the difference in height between the ring device 61 and the user's heart.
- FIG. 27 is a schematic diagram for explaining the procedure for measuring the difference in height between the ring device 61 and the heart.
- a user who wants to measure pulse pressure wears the ring device 61 on his finger, grips the mobile terminal 62 with the hand on which he wears the ring device 61, and images his own face with the camera 63.
- the height calculation section 38 (FIG. 26) of the mobile terminal 62 displays the captured image on the display section 37 in real time. Furthermore, the height calculation unit 38 displays an oval or rectangular figure on the display unit 37, superimposed on the image of the user's face.
- the user While viewing the display unit 37, the user adjusts the relative position of the mobile terminal 62 and his or her face so that the image of his or her face fits within an oval or rectangular shape. Further, the user maintains a posture such that the trunk of the user's body is along the vertical direction.
- the height calculation unit 38 stores the user's physical information such as height and weight in advance. Furthermore, statistical relationship information between physical information and face size is stored in the height calculation section 38. The height calculation unit 38 calculates the size of the user's face from the stored physical information using statistical relationship information between the physical information and the facial size. A distance L1 from the mobile terminal 62 to the user's face (for example, eyes) is calculated from the determined face size and the size of the user's face image.
- the height calculation unit 38 calculates the inclination of the mobile terminal 62 with respect to the vertical direction (direction of gravity) from the measurement results of the acceleration sensor 65.
- the height H1 from the mobile terminal 62 to the user's eyes is calculated based on the inclination of the mobile terminal 62 and the distance L1 from the mobile terminal 62 to the user's eyes.
- the height calculation unit 38 statistically calculates the height H2 from the heart to the eyes based on the user's physical information. However, an error occurs in the height H2 in a posture in which the trunk is greatly bent, such as when the user bends forward. Here, it is assumed that the trunk is not tilted. For example, as the height H2 from the heart to the eyes, the difference between the medial canthus height and the nipple height included in the "AIST human body size database 1991-1992" can be used.
- the height calculation unit 38 uses the height H1 from the mobile terminal 62 to the user's eyes and the height H2 from the heart to the eyes to calculate the difference in height between the mobile terminal 62 and the heart. calculate. It can be assumed that the height of the ring device 61 (measurement site) is approximately equal to the height of the mobile terminal 62.
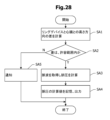
- FIG. 28 is a flowchart showing the procedure of the pulse pressure measurement method executed by the pulse pressure measurement device according to the third embodiment.
- the height calculation unit 38 calculates the difference in height between the ring device 61 and the heart (step SA1). This calculation can be performed by the method described with reference to FIG.
- the height calculation unit 38 determines whether the calculated value of the difference between the ring device 61 and the heart is within an allowable range (step SA2). If the difference is within the allowable range, the pulse pressure calculation unit 35 (FIG. 26) calculates the pulse pressure based on the measured pulse wave (step SA3).
- the pulse pressure measurement method according to the first embodiment or the second embodiment can be used to calculate the pulse pressure.
- the control unit 36 stores or outputs the calculated value of the pulse pressure (step SA4).
- the calculated value of pulse pressure is stored, for example, in association with the date and time of measurement.
- the calculated value of the pulse pressure is outputted, for example, by displaying it on the display unit 37 (FIG. 26), transmitting it to the server, etc.
- the functions of the peripheral blood pressure index calculation section 33, the pulse wave feature amount calculation section 34, and the pulse pressure calculation section 35 (FIG. 4) may be realized by a server.
- the server calculates the pulse pressure, stores the calculated value of the pulse pressure, and transmits the calculated value of the pulse pressure to the mobile terminal 62 (FIG. 4).
- step SA2 If it is determined in step SA2 that the difference is outside the allowable range, the height calculation unit 38 notifies the user that the difference in height between the ring device 61 and the heart is outside the allowable range ( Step SA5).
- the user who receives this notification can adjust the height of the ring device 61 to match the height of the heart and perform re-measurement.
- pulse pressure can be measured by adjusting the height of the measurement site to the height of the heart. Therefore, the accuracy of pulse pressure measurement can be improved. Note that even if it is determined in step SA2 that the difference is outside the allowable range, the pulse pressure is measured and the measured value of the pulse pressure is output with a note indicating that the reliability of the measured value is not high. It's okay.
- FIG. 29 is a flowchart showing the procedure of a pulse pressure measuring method executed by a pulse pressure measuring device according to a modification of the third embodiment.
- the height calculation unit 38 calculates the difference in height between the ring device 61 and the heart (step SA1), as in the third embodiment (FIG. 28).
- pulse pressure is not measured if the difference is outside the allowable range, but in this modification, the pulse pressure is measured based on the measured pulse wave regardless of whether the difference is within the allowable range.
- the pulse pressure calculation unit 35 calculates the pulse pressure (step SA3).
- the pulse pressure calculation unit 35 corrects the calculated value of the pulse pressure based on the difference in height between the ring device 61 and the heart (step SA5).
- the relationship between the height difference between the ring device 61 and the heart and the pulse pressure may be determined in advance by conducting an evaluation experiment.
- the corrected value of pulse pressure is stored or output (step SA6).
- blood pressure and pulse pressure change depending on the amount of exercise. Furthermore, when the measurement site is moving, inertial force acts on the blood in the blood vessels, so the waveform of the pulse wave fluctuates. Medically useful are blood pressure and pulse pressure measured in a resting state. Furthermore, during exercise, the contact state between the photoplethysmogram sensor and the skin tends to change. If the contact state changes, noise will be superimposed on the measured pulse wave. In the fourth embodiment, it is determined whether the user is in a resting state, and the medically useful pulse pressure in the resting state is measured.
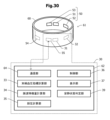
- FIG. 30 is a perspective view and a block diagram of a pulse pressure measuring device according to a fourth embodiment.
- the pulse pressure measuring device according to the fourth embodiment includes a ring device 61 and a mobile terminal 62, similarly to the pulse pressure measuring device according to the modified example of the first embodiment (FIG. 4).
- the ring device 61 of the pulse pressure measuring device according to the fourth embodiment is equipped with an acceleration sensor 54 in addition to the configuration of the ring device 61 of the pulse pressure measuring device according to the modified example of the first embodiment (FIG. 4).
- the mobile terminal 62 includes a resting state determining section 39 in addition to the configuration of the mobile terminal 62 of the pulse pressure measuring device according to the modification of the first embodiment.
- the resting state determining unit 39 uses the measurement results of the acceleration sensor 54 to determine whether the user is in a resting state. For example, when the measured value of acceleration by the acceleration sensor 54 remains below the determination threshold for a predetermined period of time, for example, 5 minutes, the resting state determination unit 39 determines that the user is in a resting state.
- FIG. 31 is a flowchart showing the procedure of the pulse pressure measuring method executed by the pulse pressure measuring device according to the fourth embodiment.
- the resting state determination unit 39 determines whether the user wearing the ring device 61 is in a resting state (step SB1). When it is determined that the user is not in a resting state, determination of the resting state is repeatedly performed at a constant cycle until the user is in a resting state (step SB2). If it is determined that the user is in a resting state, the pulse pressure calculation unit 35 calculates the pulse pressure based on the pulse wave acquired at that time (step SB3). Thereafter, the calculated value of pulse pressure is stored or output (step SB4).
- the excellent effects of the fourth embodiment will be explained.
- the pulse pressure is calculated based on the pulse wave when the user is in a resting state, the accuracy of the calculated value of the pulse pressure can be improved.
- the fourth embodiment it is determined whether or not the ring device 61 is in a resting state based on the measured value of acceleration by the acceleration sensor 54 mounted on the ring device 61.
- a gyro sensor may be installed in place of the acceleration sensor 54, and whether or not the vehicle is in a resting state may be determined based on the angular acceleration measured by the gyro sensor.
- the acceleration sensor 54 and the gyro sensor may be used together to determine whether or not the person is in a resting state.
- FIG. 32 is a perspective view and a block diagram of a pulse pressure measuring device according to a fifth embodiment.
- the pulse pressure measuring device according to the fifth embodiment includes a ring device 61 and a mobile terminal 62, similarly to the pulse pressure measuring device according to the modified example of the first embodiment (FIG. 4).
- the ring device 61 of the pulse pressure measuring device according to the fifth embodiment is equipped with an acceleration sensor 54, similar to the ring device 61 (FIG. 30) of the pulse pressure measuring device according to the fourth embodiment.
- the mobile terminal 62 includes a sleep state determining section 40 in addition to the configuration of the mobile terminal 62 of the pulse pressure measuring device according to the modification of the first embodiment.
- the sleep state determining unit 40 uses the measurement results of the acceleration sensor 54 to determine whether the user is in a resting state. A method for determining whether a user is in a sleeping state or in an awake state will be described below.
- the sleep state determining unit 40 determines that body movement is occurring, for example, when the measured value of acceleration by the acceleration sensor 54 exceeds a predetermined threshold. When the number of occurrences of body movements within a predetermined time is less than or equal to a predetermined threshold, it is determined that the subject is in a sleeping state.
- the predetermined time may be selected, for example, from a range of 15 minutes or more and 90 minutes or less. Even during sleep, acceleration may suddenly increase due to things like turning over in bed, but this happens less frequently than when awake, so it is not possible to accurately determine whether or not a person is in a sleeping state based on the number of body movements that occur within a given period of time. can.
- the fingers move more frequently when awake than the hips, chest, wrists, etc. Utilizing this characteristic, by wearing the ring device 61 on your finger, it is possible to determine whether or not you are in a sleep state with higher accuracy than when you wear a photoplethysmographic sensor on other parts such as your wrist. can.
- FIG. 33 is a flowchart showing the procedure of the pulse pressure measuring method executed by the pulse pressure measuring device according to the fifth embodiment.
- the sleep state determination unit 40 determines whether the user wearing the ring device 61 is in a sleep state or an awake state (step SC1). If it is determined that the patient is not in a sleeping state, the determination as to whether the patient is in a sleeping state or in an awake state is repeated at regular intervals (step SC2).
- the pulse wave measurement unit 32 measures the pulse wave
- the pulse pressure calculation unit 35 calculates the pulse pressure (step SC3). Note that after it is determined that the person is in a sleeping state, it is further determined whether or not the person is in a resting state, similarly to step SB1 shown in FIG. may be calculated. Once the calculated value of pulse pressure is determined, the control unit 36 stores or outputs the calculated value of pulse pressure (step SC4).
- pulse pressure during a sleeping state can be automatically determined. If it is determined that the patient is not in a sleeping state, the pulse wave is not measured, so battery consumption can be reduced.
- whether or not the person is in a sleeping state is determined based on the frequency of occurrence of body movements, but it may be determined whether or not the person is in a sleeping state using other methods. It is known that the temperature of your hands and fingers increases during sleep. A temperature sensor is mounted on the ring device 61 (Fig. 32), and the circadian rhythm is estimated from the measured value of the temperature sensor, and the temperature measured value is combined with the frequency of body movements to determine whether or not the patient is in a sleep state. Good too.
- the pulse rate tends to decrease compared to when awake. Furthermore, respiratory fluctuations are more likely to occur in the pulse rate. Utilizing this characteristic, it may be determined whether or not the person is in a sleeping state by adding the tendency of fluctuations in pulse rate to the frequency of body movements.
- the fifth embodiment it is determined whether or not the person is in a sleeping state based on the frequency of occurrence of body movements.
- pulse wave measurement is started when the frequency of body movements becomes less than a certain frequency, and whether the sleep state is determined based on the frequency of body movements and the measured pulse wave. It may be determined whether or not.
- the pulse wave is not measured when the awake state is determined, but if the battery capacity is sufficiently large, the pulse wave is measured both in the sleeping state and in the awake state. and pulse pressure may be calculated. In this case, it is preferable to store the calculated value of the pulse pressure in association with identification information that distinguishes between the awake state and the sleeping state. This makes it possible to know the difference in tendency between the leg pressure in the awake state and the pulse pressure in the sleeping state.
- Processing device 31 Light emission control section 32 Pulse wave measurement section 33 Peripheral blood pressure index calculation section 34 Pulse wave feature amount calculation section 35 Pulse pressure calculation section 36 Control section 37 Display section 38 Height calculation section 39 Resting state determination section 40 Sleep state determination Part 50 Photoplethysmographic sensor 51, 52 Light emitting element 53 Light receiving element 54 Acceleration sensor 55 Communication part 56 Gyro sensor 60 Mounting member 61 Ring device 62 Mobile terminal 63 Camera 64 Communication part 65 Acceleration sensor 70 User's body surface 71 Epidermal area 72 Fine Artery 73 Capillary
Abstract
This peripheral blood pressure index calculation unit calculates a peripheral blood pressure index relating to a degree of steepness of a rise in a pulse wave signal measured by a pulse wave sensor attached to a user. A pulse wave feature amount calculation unit calculates an ae-time index including information related to an elapsed time from a peak of an a-wave to a peak of an e-wave of an acceleration pulse wave obtained by second-order differentiation of a waveform of the pulse wave signal. A pulse pressure calculation unit calculates a pulse pressure on the basis of the peripheral blood pressure index and the ae-time index.
Description
本発明は、脈圧測定装置及び脈圧測定方法に関する。
The present invention relates to a pulse pressure measuring device and a pulse pressure measuring method.
生体の部位から脈波情報を光学的に取得し、取得された脈波情報から脈拍数と脈波の時間情報を算出し、脈拍数と脈波の時間情報とに基づいて血圧情報を推定して出力する脈波測定装置が公知である(特許文献1参照)。推定される血圧情報として、血圧、血圧状態、動脈硬化、血管年齢、脳卒中体質か否か等の情報が挙げられている。
Pulse wave information is optically acquired from parts of the living body, pulse rate and pulse wave time information are calculated from the acquired pulse wave information, and blood pressure information is estimated based on the pulse rate and pulse wave time information. A pulse wave measuring device that outputs pulse waves is known (see Patent Document 1). Estimated blood pressure information includes information such as blood pressure, blood pressure status, arteriosclerosis, vascular age, and whether or not the patient is predisposed to stroke.
健康状態を判断する1つの指標として、収縮期血圧と拡張期血圧との差である脈圧が挙げられる。従来の脈波測定装置では、脈圧を測定することができない。本発明の目的は、脈圧を測定することができる脈圧測定装置及び脈圧測定方法を提供することである。
Pulse pressure, which is the difference between systolic blood pressure and diastolic blood pressure, is one indicator for determining health status. Conventional pulse wave measurement devices cannot measure pulse pressure. An object of the present invention is to provide a pulse pressure measuring device and a pulse pressure measuring method that can measure pulse pressure.
本発明の一観点によると、
ユーザに装着された脈波センサで測定された脈波信号の立ち上がりの急峻度に関係する末梢血圧指標を計算する末梢血圧指標計算部と、
前記脈波信号の波形を2階微分して得られる加速度脈波のa波のピークからe波のピークまでの経過時間に関する情報を含むae時間指標を計算する脈波特徴量計算部と、
前記末梢血圧指標と前記ae時間指標とに基づいて、脈圧を計算する脈圧計算部と
を備えた脈圧測定装置が提供される。 According to one aspect of the invention:
a peripheral blood pressure index calculation unit that calculates a peripheral blood pressure index related to the steepness of the rise of a pulse wave signal measured by a pulse wave sensor worn by the user;
a pulse wave feature calculation unit that calculates an ae time index that includes information regarding the elapsed time from the peak of the a wave to the peak of the e wave of the accelerated pulse wave obtained by second-order differentiation of the waveform of the pulse wave signal;
A pulse pressure measuring device is provided that includes a pulse pressure calculation section that calculates pulse pressure based on the peripheral blood pressure index and the ae time index.
本発明の他の観点によると、
ユーザに装着した脈波センサで脈波信号を取得し、
脈圧測定装置が、前記脈波信号の立ち上がりの急峻度に関係する末梢血圧指標を計算し、
前記脈圧測定装置が、前記脈波信号の波形を2階微分して得られる加速度脈波のa波のピークからe波のピークまでの経過時間に関する情報を含むae時間指標を計算し、
前記脈圧測定装置が、前記末梢血圧指標と前記ae時間指標とに基づいて、脈圧を求める脈圧測定方法が提供される。 According to another aspect of the invention:
A pulse wave sensor attached to the user acquires a pulse wave signal,
a pulse pressure measuring device calculates a peripheral blood pressure index related to the steepness of the rise of the pulse wave signal;
The pulse pressure measurement device calculates an ae time index that includes information regarding the elapsed time from the peak of the a wave to the peak of the e wave of the accelerated pulse wave obtained by second-order differentiation of the waveform of the pulse wave signal,
A pulse pressure measuring method is provided in which the pulse pressure measuring device calculates the pulse pressure based on the peripheral blood pressure index and the ae time index.
血圧と相関関係を有する末梢血圧指標は、脈圧とも相関関係を有する。また、加速度脈波のa波のピークからe波のピークまでの経過時間も、脈圧と相関関係を有する。末梢血圧指標とae時間指標とを用いることにより、精度よく脈圧を計算することができる。
Peripheral blood pressure indicators that have a correlation with blood pressure also have a correlation with pulse pressure. Furthermore, the elapsed time from the peak of the a-wave to the peak of the e-wave of the accelerated pulse wave also has a correlation with the pulse pressure. By using the peripheral blood pressure index and the ae time index, pulse pressure can be calculated with high accuracy.
[第1実施例]
図1、図2、図3、及び図4を参照して、第1実施例による脈圧測定装置について説明する。第1実施例による脈圧測定装置は、被験者から取得した脈波の波形に基づいて脈圧を計算する。 [First example]
A pulse pressure measuring device according to a first embodiment will be described with reference to FIGS. 1, 2, 3, and 4. The pulse pressure measuring device according to the first embodiment calculates pulse pressure based on the waveform of a pulse wave obtained from a subject.
脈波は、種々の生体情報の測定に用いられる。例えば、脈拍数の測定、酸素飽和度の測定に用いられる。その他に、脈拍間隔の変動による自律神経機能の測定、脈波のベースライン変動や脈拍間隔変動による呼吸数の測定等にも使用される。さらに、脈波の波形形状から血圧を推定する技術も開発されている。脈波は、圧電センサ等を用いて測定される圧脈波(圧電脈波)、光電脈波センサを用いて測定される容積脈波(光電脈波)に分類される。
Pulse waves are used to measure various biological information. For example, it is used to measure pulse rate and oxygen saturation. In addition, it is also used to measure autonomic nervous function based on pulse interval variations, and to measure respiration rate based on baseline variations in pulse waves and pulse interval variations. Furthermore, a technique for estimating blood pressure from the waveform shape of a pulse wave has also been developed. Pulse waves are classified into pressure pulse waves (piezoelectric pulse waves) measured using a piezoelectric sensor or the like, and volume pulse waves (photoplethysm waves) measured using a photoplethysmographic sensor.
脈圧は、収縮期血圧と拡張期血圧との差であり、その正常値は、40mmHg以上50mmHg以下といわれている。脈圧が正常の範囲を超える例として、1回拍出量が増加した場合が挙げられる。1回拍出量が増加する要因として、運動時、甲状腺機能亢進症、貧血等が考えられる。
Pulse pressure is the difference between systolic blood pressure and diastolic blood pressure, and its normal value is said to be 40 mmHg or more and 50 mmHg or less. An example of pulse pressure exceeding the normal range is when stroke volume increases. Possible causes of increased stroke volume include exercise, hyperthyroidism, and anemia.
その他に、大きな血管の弾性力が低下した場合にも脈圧が正常の範囲を超える。血管が硬くなると収縮期血圧が上昇する。収縮期血圧が上昇すると末梢血管を拡張させるような反応が起こり、拡張期血圧はむしろ低下する。その結果、脈圧が大きくなる。例えば、大動脈が広範囲に動脈硬化を起こしていると、脈圧が大きくなる。脈圧が65mmHg以上になると、心筋梗塞や脳血管疾患の危険性が高まるという報告もある。脈圧を測定することは、これらの疾患の有病者及び予備群を発見する一助となる。
In addition, pulse pressure exceeds the normal range when the elasticity of large blood vessels decreases. When blood vessels become stiff, systolic blood pressure increases. When systolic blood pressure increases, a reaction occurs that dilates peripheral blood vessels, and diastolic blood pressure actually decreases. As a result, pulse pressure increases. For example, if the aorta has extensive arteriosclerosis, the pulse pressure increases. There are also reports that when the pulse pressure exceeds 65 mmHg, the risk of myocardial infarction and cerebrovascular disease increases. Measuring pulse pressure helps discover those who are prone to these diseases.
第1実施例による脈圧測定装置は、圧電脈波及び光電脈波のいずれにも適用可能である。光電脈波からは圧電脈波からよりも多くの情報を得ることができる。以下、光電脈波を例にとって説明する。
The pulse pressure measuring device according to the first embodiment is applicable to both piezoelectric pulse waves and photoplethysmograms. More information can be obtained from photoplethysmography than from piezoelectric plethysmography. Hereinafter, a photoplethysmogram will be explained as an example.
図1は、第1実施例による脈圧測定装置のブロック図及び模式図である。第1実施例による脈圧測定装置は、処理装置30及び光電脈波センサ50を含む。光電脈波センサ50は、発光素子51及び受光素子53を含む。処理装置30は、発光制御部31、脈波測定部32、末梢血圧指標計算部33、脈波特徴量計算部34、脈圧計算部35、制御部36、及び表示部37を含む。
FIG. 1 is a block diagram and a schematic diagram of a pulse pressure measuring device according to a first embodiment. The pulse pressure measuring device according to the first embodiment includes a processing device 30 and a photoplethysmographic sensor 50. Photoplethysmographic sensor 50 includes a light emitting element 51 and a light receiving element 53. The processing device 30 includes a light emission control section 31 , a pulse wave measurement section 32 , a peripheral blood pressure index calculation section 33 , a pulse wave feature amount calculation section 34 , a pulse pressure calculation section 35 , a control section 36 , and a display section 37 .
発光素子51及び受光素子53は、ユーザの体表面70に接触して使用される。発光素子51は、体表面70に向かって測定用の光を照射する。照射された光は、体表面70内の表皮領域71、細動脈72、及び毛細血管73により吸収、反射または散乱(以下、単に「反射」という場合がある。)される。反射された光の一部は、受光素子53に入射する。
The light emitting element 51 and the light receiving element 53 are used in contact with the user's body surface 70. The light emitting element 51 irradiates measurement light toward the body surface 70 . The irradiated light is absorbed, reflected, or scattered (hereinafter sometimes simply referred to as "reflection") by the epidermal region 71, arterioles 72, and capillaries 73 within the body surface 70. A part of the reflected light enters the light receiving element 53.
細動脈72は、例えば直径が20μm以上200μm以下の細い血管であり、動脈と毛細血管73との間に存在する。細動脈72から複数の毛細血管73が分岐している。毛細血管73は、例えば直径が10μm程度の細い血管であり、動脈と静脈とをつなぐ。細動脈72が分布する領域より浅い領域に、複数の毛細血管73が分布している。
The arteriole 72 is a thin blood vessel with a diameter of, for example, 20 μm or more and 200 μm or less, and exists between the artery and the capillary blood vessel 73. A plurality of capillaries 73 branch from the arteriole 72. The capillary blood vessel 73 is a thin blood vessel with a diameter of about 10 μm, for example, and connects an artery and a vein. A plurality of capillaries 73 are distributed in an area shallower than the area where arterioles 72 are distributed.
発光素子51は、処理装置30によって制御されることにより、測定用の光を出力する。受光素子53で測定された光の強度を示す信号が、処理装置30に入力される。受光素子53で検出された光の強度を示す信号を「脈波信号」ということとする。動脈の血液内にはヘモグロビンが含まれており、ヘモグロビンは、測定用の光を吸収する性質を有する。心臓の拍動に伴って血流量が変化し、血流量の変化に応じて光の吸収量も変化する。このため、心臓の拍動に伴って脈波信号の強度が変化する。
The light emitting element 51 outputs light for measurement under the control of the processing device 30. A signal indicating the intensity of light measured by the light receiving element 53 is input to the processing device 30 . A signal indicating the intensity of light detected by the light receiving element 53 will be referred to as a "pulse wave signal". Arterial blood contains hemoglobin, and hemoglobin has the property of absorbing light for measurement. The amount of blood flow changes as the heart beats, and the amount of light absorbed changes in accordance with the change in blood flow. Therefore, the intensity of the pulse wave signal changes as the heart beats.
発光素子51として、例えば青色から黄緑色までの波長域(450nm以上550nm以下の波長域)、好適には500nm以上550nm以下の波長域の光を出力するものが用いられる。発光素子51には、例えば発光ダイオード(LED)、垂直共振器型面発光レーザ(VCSEL)等が用いられる。受光素子53には、例えばフォトダイオード(PD)、フォトトランジスタ等が用いられる。
As the light emitting element 51, one that outputs light in a wavelength range from blue to yellowish green (wavelength range of 450 nm or more and 550 nm or less), preferably 500 nm or more and 550 nm or less is used. As the light emitting element 51, for example, a light emitting diode (LED), a vertical cavity surface emitting laser (VCSEL), or the like is used. For example, a photodiode (PD), a phototransistor, or the like is used as the light receiving element 53.
青色から黄緑色までの波長域の光は、生体組織による吸収が大きい。このため、青色から黄緑色までの波長域の光を用いて取得される脈波には、皮膚表面から浅い領域、特に細動脈72が分布する領域より浅く、主として毛細血管73が分布する領域の情報が反映される。図1に示した矢印は、光が伝搬する経路を示しているわけではなく、発光素子51から出力された光が、表皮領域71、及び主として毛細血管73が分布する領域を通って受光素子53に入射することを示している。細動脈72が分布する領域より浅く、主として毛細血管73が分布する領域の情報が、取得される脈波に大きく反映されるようにするために、発光素子51と受光素子53との間隔L1を短くすることが好ましい。例えば、間隔L1を1mm以上3mm以下にすることが好ましい。
Light in the wavelength range from blue to yellow-green is highly absorbed by living tissues. For this reason, pulse waves obtained using light in the wavelength range from blue to yellow-green include areas shallow from the skin surface, particularly shallower than areas where arterioles 72 are distributed, and mainly areas where capillaries 73 are distributed. The information will be reflected. The arrows shown in FIG. 1 do not necessarily indicate the path through which light propagates, but rather the light output from the light emitting element 51 passes through the epidermis region 71 and the region where capillaries 73 are mainly distributed, and passes through the light receiving element 53. It is shown that it is incident on . In order to ensure that the information of the region shallower than the region where the arterioles 72 are distributed and mainly where the capillaries 73 are distributed is largely reflected in the acquired pulse wave, the distance L1 between the light emitting element 51 and the light receiving element 53 is set. It is preferable to keep it short. For example, it is preferable that the interval L1 be 1 mm or more and 3 mm or less.
波長450nmより短波長側の光は、生体組織にダメージを与えてしまう。生体組織にダメージを与えないようにするために、脈波の測定に用いる光の波長は450nm以上にすることが好ましい。
Light with wavelengths shorter than 450 nm can damage living tissues. In order to avoid damaging living tissue, the wavelength of the light used to measure pulse waves is preferably 450 nm or more.
図2は、第1実施例の変形例による脈圧測定装置のブロック図及び模式図である。図2に示した変形例では、第1実施例による脈圧測定装置(図1)の発光素子51に代えて、発光波長が異なる発光素子52が用いられる。図2に示した変形例で用いられる発光素子52は、赤色から近赤外光の波長域、例えば750nm以上950nm以下の波長域の光を出力する。赤色から近赤外光までの波長域の光は、青色から黄緑色までの波長域の光に比べて、生体組織による吸収が小さい。このため、赤色から近赤外光までの波長域の光を用いて取得される脈波には、皮膚表面からより深い領域の情報が反映される。
FIG. 2 is a block diagram and a schematic diagram of a pulse pressure measuring device according to a modification of the first embodiment. In the modification shown in FIG. 2, a light emitting element 52 having a different emission wavelength is used in place of the light emitting element 51 of the pulse pressure measuring device according to the first embodiment (FIG. 1). The light emitting element 52 used in the modification shown in FIG. 2 outputs light in a wavelength range from red to near-infrared light, for example, in a wavelength range of 750 nm or more and 950 nm or less. Light in the wavelength range from red to near-infrared light is absorbed less by living tissues than light in the wavelength range from blue to yellow-green. Therefore, pulse waves obtained using light in the wavelength range from red to near-infrared light reflect information from a deeper region from the skin surface.
例えば、毛細血管73及び細動脈72が分布する領域の情報が反映される。図2に示した矢印は、光が伝搬する経路を示しているわけではなく、発光素子52から出力された光が、毛細血管73のみならず、細動脈72が分布する領域を通って受光素子53に入射することを示している。細動脈72及び毛細血管73が分布する領域の情報が、取得される脈波に大きく反映されるようにするために、発光素子52と受光素子53との間隔L2を5mm以上20mm以下にすることが好ましい。
For example, information on the area where capillaries 73 and arterioles 72 are distributed is reflected. The arrows shown in FIG. 2 do not necessarily indicate the paths through which light propagates; instead, the light output from the light emitting element 52 passes not only through the capillaries 73 but also through the area where the arterioles 72 are distributed, and then passes through the light receiving element. 53. In order to ensure that the information on the area where the arterioles 72 and capillaries 73 are distributed is largely reflected in the acquired pulse wave, the distance L2 between the light emitting element 52 and the light receiving element 53 is set to 5 mm or more and 20 mm or less. is preferred.
波長950nmより長波長域では、ヘモグロビンの吸光度が低下する。したがって、脈波信号の取得には、950nm以下の波長域の光を用いることが好ましい。
In wavelengths longer than 950 nm, the absorbance of hemoglobin decreases. Therefore, it is preferable to use light in the wavelength range of 950 nm or less to obtain the pulse wave signal.
図3は、第1実施例の他の変形例による脈圧測定装置のブロック図及び模式図である。第2変形例による脈圧測定装置は、青色から黄緑色までの波長域の光を出力する発光素子51(図1)と、赤色から近赤外光の波長域の光を出力する発光素子52との両方を備えている。受光素子53は、発光素子51から出力された光、及び発光素子52から出力された光の両方の波長域の光を検出する。発光素子51と受光素子53との間隔L1の好ましい範囲は、1mm以上3mm以下であり、発光素子52と受光素子53との間隔L2の好ましい範囲は、5mm以上20mm以下である。
FIG. 3 is a block diagram and a schematic diagram of a pulse pressure measuring device according to another modification of the first embodiment. The pulse pressure measuring device according to the second modification includes a light-emitting element 51 (FIG. 1) that outputs light in a wavelength range from blue to yellow-green, and a light-emitting element 52 that outputs light in a wavelength range from red to near-infrared light. It has both. The light receiving element 53 detects light in the wavelength range of both the light output from the light emitting element 51 and the light output from the light emitting element 52. A preferable range of the distance L1 between the light emitting element 51 and the light receiving element 53 is 1 mm or more and 3 mm or less, and a preferable range of the distance L2 between the light emitting element 52 and the light receiving element 53 is 5 mm or more and 20 mm or less.
図3に示した変形例では、2つの発光素子51、52に対して1つの受光素子53を配置しているが、一方の発光素子51に対して1つの受光素子を配置し、他方の発光素子52に対して他の受光素子を配置してもよい。
In the modification shown in FIG. 3, one light-receiving element 53 is arranged for two light-emitting elements 51 and 52, but one light-receiving element is arranged for one light-emitting element 51, and the other light-emitting element Other light receiving elements may be arranged with respect to element 52.
次に、処理装置30(図1、図2、図3)の機能について説明する。
処理装置30の制御部36は、測定の開始及び終了の制御、測定結果を表示部37に表示する制御、測定結果を記憶する制御等を行う。発光制御部31は、発光素子51または発光素子52のパルス発光の制御を行う。例えば、100Hz以上1000Hz以下の所定の周波数で、発光素子51または発光素子52をパルス発光させる。図3に示した第2変形例では、発光素子51と発光素子52とを交互に発光させる。 Next, the functions of the processing device 30 (FIGS. 1, 2, and 3) will be explained.
Thecontrol unit 36 of the processing device 30 performs controls such as starting and ending the measurement, displaying the measurement results on the display unit 37, and storing the measurement results. The light emission control unit 31 controls pulsed light emission of the light emitting element 51 or the light emitting element 52. For example, the light emitting element 51 or the light emitting element 52 is caused to emit pulsed light at a predetermined frequency of 100 Hz or more and 1000 Hz or less. In the second modification shown in FIG. 3, the light emitting element 51 and the light emitting element 52 are caused to emit light alternately.
処理装置30の制御部36は、測定の開始及び終了の制御、測定結果を表示部37に表示する制御、測定結果を記憶する制御等を行う。発光制御部31は、発光素子51または発光素子52のパルス発光の制御を行う。例えば、100Hz以上1000Hz以下の所定の周波数で、発光素子51または発光素子52をパルス発光させる。図3に示した第2変形例では、発光素子51と発光素子52とを交互に発光させる。 Next, the functions of the processing device 30 (FIGS. 1, 2, and 3) will be explained.
The
脈波測定部32は、受光素子53から入力された測定結果(脈波信号)から脈波の波形(以下、単に「脈波」という場合がある。)を生成する。例えば、脈波測定部32は、発光素子51または発光素子52のパルス発光に同期させて、所定のサンプリングレートで受光素子53から光強度の測定値を読み取ることにより、脈波を生成する。図3に示した第2変形例では、脈波測定部32は、発光素子51または発光素子52のパルス発光に同期させて、所定のサンプリングレートで受光素子53から光強度の測定値を読み取ることにより、発光素子51から出力された光による脈波、及び発光素子52から出力された光による脈波を別々に生成する。
The pulse wave measurement unit 32 generates a pulse wave waveform (hereinafter sometimes simply referred to as a "pulse wave") from the measurement result (pulse wave signal) input from the light receiving element 53. For example, the pulse wave measurement unit 32 generates a pulse wave by reading the measured value of light intensity from the light receiving element 53 at a predetermined sampling rate in synchronization with the pulsed light emission of the light emitting element 51 or 52. In the second modification shown in FIG. 3, the pulse wave measurement unit 32 reads the measured value of light intensity from the light receiving element 53 at a predetermined sampling rate in synchronization with the pulsed light emission of the light emitting element 51 or the light emitting element 52. Accordingly, a pulse wave due to the light output from the light emitting element 51 and a pulse wave due to the light output from the light emitting element 52 are generated separately.
末梢血圧指標計算部33は、脈波測定部32で生成された脈波から、脈波の立ち上がりの急峻度に関係する末梢血圧指標を計算する。脈波特徴量計算部34は、脈波測定部32で生成された脈波からae時間指標を計算する。末梢血圧指標及びae時間指標については、後に詳しく説明する。脈圧計算部35は、末梢血圧指標及びae時間指標に基づいて、脈圧を計算することにより、脈圧の測定値を求める。
The peripheral blood pressure index calculation unit 33 calculates a peripheral blood pressure index related to the steepness of the rise of the pulse wave from the pulse wave generated by the pulse wave measurement unit 32. The pulse wave feature calculating unit 34 calculates an ae time index from the pulse wave generated by the pulse wave measuring unit 32. The peripheral blood pressure index and the ae time index will be explained in detail later. The pulse pressure calculation unit 35 calculates the pulse pressure based on the peripheral blood pressure index and the ae time index to obtain a measured value of the pulse pressure.
図4は、図3に示した第1実施例の変形例による脈圧測定装置の斜視図及びブロック図である。本変形例による脈圧測定装置は、リングデバイス61及び携帯型の携帯端末62を含む。
FIG. 4 is a perspective view and a block diagram of a pulse pressure measuring device according to a modification of the first embodiment shown in FIG. 3. The pulse pressure measuring device according to this modification includes a ring device 61 and a portable mobile terminal 62.
以下、リングデバイス61について説明する。
2つの発光素子51、52、及び1つの受光素子53が、環状の装着部材60の内側の面に取り付けられている。装着部材60は、ユーザの指に装着されて使用される。装着部材60として、ユーザの指の太さに応じて複数のサイズのものが準備されている。装着部材60を指に装着したとき、発光素子51、52は、指に向かって光を出力する。受光素子53は、指の内部で反射した光が入射する位置に取り付けられている。 Thering device 61 will be explained below.
Two light emitting elements 51 and 52 and one light receiving element 53 are attached to the inner surface of the annular mounting member 60. The attachment member 60 is used by being attached to a user's finger. The mounting member 60 is prepared in a plurality of sizes depending on the thickness of the user's fingers. When the attachment member 60 is attached to a finger, the light emitting elements 51 and 52 output light toward the finger. The light receiving element 53 is attached at a position where the light reflected inside the finger is incident.
2つの発光素子51、52、及び1つの受光素子53が、環状の装着部材60の内側の面に取り付けられている。装着部材60は、ユーザの指に装着されて使用される。装着部材60として、ユーザの指の太さに応じて複数のサイズのものが準備されている。装着部材60を指に装着したとき、発光素子51、52は、指に向かって光を出力する。受光素子53は、指の内部で反射した光が入射する位置に取り付けられている。 The
Two light emitting
装着部材60には、さらに、発光制御部31、脈波測定部32、及び通信部55が組み込まれている。発光制御部31、脈波測定部32、及び通信部55は、1つの集積化回路で構成してもよい。
The mounting member 60 further incorporates a light emission control section 31, a pulse wave measurement section 32, and a communication section 55. The light emission control section 31, the pulse wave measurement section 32, and the communication section 55 may be configured as one integrated circuit.
処理装置30(図3)の機能は、リングデバイス61及び携帯型の携帯端末62で実現される。携帯端末62として、例えばスマートフォン、タブレット端末、ノート型パソコン等が用いられる。携帯端末62は、通信部64、末梢血圧指標計算部33、脈波特徴量計算部34、脈圧計算部35、制御部36、及び表示部37を備えている。なお、末梢血圧指標計算部33、脈波特徴量計算部34、脈圧計算部35の機能をサーバで実現するようにしてもよい。この構成を採用する場合には、携帯端末62とサーバとの間で、通信回線を介してデータ通信を行う。
The functions of the processing device 30 (FIG. 3) are realized by a ring device 61 and a portable mobile terminal 62. As the mobile terminal 62, for example, a smartphone, a tablet terminal, a notebook computer, etc. are used. The mobile terminal 62 includes a communication section 64 , a peripheral blood pressure index calculation section 33 , a pulse wave feature amount calculation section 34 , a pulse pressure calculation section 35 , a control section 36 , and a display section 37 . Note that the functions of the peripheral blood pressure index calculation section 33, the pulse wave feature amount calculation section 34, and the pulse pressure calculation section 35 may be realized by a server. When this configuration is adopted, data communication is performed between the mobile terminal 62 and the server via a communication line.
リングデバイス61の通信部55と携帯端末62の通信部64との間で、データ通信を行う。リングデバイス61と携帯端末62との間の通信には、例えば種々の規格の近距離無線通信方式が用いられる。
Data communication is performed between the communication unit 55 of the ring device 61 and the communication unit 64 of the mobile terminal 62. For communication between the ring device 61 and the mobile terminal 62, short-range wireless communication systems of various standards are used, for example.
脈波の取得にリングデバイス61を用いることの優れた効果について説明する。
指は、比較的表皮が薄いため、光電脈波センサ50を用いた脈波の取得に適している。また、毛細血管の経路が顔等に比べて複雑でないため、脈波特徴量の値が安定しやすい。このため、脈波から求まる脈圧の信頼度が高まる。さらに、脈圧測定装置を連続的または間欠的に使用する場合、リングデバイス61を指に長時間装着していても、違和感や不快感が小さいという優れた効果も得られる。 The excellent effects of using thering device 61 to acquire pulse waves will be explained.
Since fingers have relatively thin epidermis, they are suitable for acquiring pulse waves using thephotoplethysmogram sensor 50. Furthermore, since the capillary path is less complicated than that of the face, the value of the pulse wave feature value is likely to be stable. Therefore, the reliability of the pulse pressure determined from the pulse wave increases. Furthermore, when the pulse pressure measuring device is used continuously or intermittently, an excellent effect can be obtained in that even if the ring device 61 is worn on the finger for a long time, there is little discomfort or discomfort.
指は、比較的表皮が薄いため、光電脈波センサ50を用いた脈波の取得に適している。また、毛細血管の経路が顔等に比べて複雑でないため、脈波特徴量の値が安定しやすい。このため、脈波から求まる脈圧の信頼度が高まる。さらに、脈圧測定装置を連続的または間欠的に使用する場合、リングデバイス61を指に長時間装着していても、違和感や不快感が小さいという優れた効果も得られる。 The excellent effects of using the
Since fingers have relatively thin epidermis, they are suitable for acquiring pulse waves using the
[末梢血圧指標]
次に、図5から図9Bまでの図面を参照して、第1実施例による脈圧測定装置で脈圧を求めるための1つの基礎情報となる末梢血圧指標について説明する。 [Peripheral blood pressure index]
Next, with reference to the drawings from FIG. 5 to FIG. 9B, a peripheral blood pressure index, which is one basic information for determining pulse pressure using the pulse pressure measuring device according to the first embodiment, will be described.
本明細書において、「末梢血圧」を、末梢の細動脈及び毛細血管内の血圧と定義する。末梢血圧がカフ式血圧計で測定される手首の血圧、足首の血圧という意味で使用される場合もあるが、手首または足首の血圧は、太い動脈(橈骨動脈等)での測定値であり、本明細書において定義される末梢血圧とは異なる。太い動脈から細動脈、毛細血管に進むにしたがって、血管内の血圧は低下する。血圧が低下する程度は、測定部位、個々人の血管状態(動脈硬化の有無等)、精神状態(自律神経の状態等)、環境(気温、騒音の有無等)、着衣等によって異なる。
In this specification, "peripheral blood pressure" is defined as blood pressure in peripheral arterioles and capillaries. Peripheral blood pressure is sometimes used to mean blood pressure at the wrist or ankle measured with a cuff-type blood pressure monitor, but blood pressure at the wrist or ankle is a value measured in a large artery (such as the radial artery). Different from peripheral blood pressure as defined herein. Blood pressure in blood vessels decreases as blood progresses from large arteries to arterioles and capillaries. The degree to which blood pressure decreases varies depending on the measurement site, the individual's vascular condition (presence of arteriosclerosis, etc.), mental condition (autonomic nerve condition, etc.), environment (temperature, presence of noise, etc.), clothing, etc.
脈波の波形の特徴量のうち、末梢血圧を求めるために有効な指標を末梢血圧指標として採用する。末梢血圧指標は、以下の特徴を有すると考えられる。
第1に、血管が健康な場合に、血管抵抗が変化しない条件の下で、末梢血圧指標は、上腕や手首の血圧と正の相関関係を有する。第2に、測定部位の近傍を冷却して血管を収縮させると、末梢血圧指標は低下する。血管が収縮すると、末梢の血管抵抗が増加するため、上腕や手首の血圧は上昇する場合がある。 Among the characteristic quantities of the pulse wave waveform, an index that is effective for determining peripheral blood pressure is adopted as a peripheral blood pressure index. The peripheral blood pressure index is considered to have the following characteristics.
First, when blood vessels are healthy and under conditions where vascular resistance does not change, peripheral blood pressure indicators have a positive correlation with blood pressure in the upper arm or wrist. Second, when the vicinity of the measurement site is cooled to constrict blood vessels, the peripheral blood pressure index decreases. When blood vessels constrict, peripheral vascular resistance increases and blood pressure in the upper arm and wrist may rise.
次に、図5及び図6を参照して、脈波の波形の種々の特徴量について説明する。
Next, various characteristic amounts of the pulse wave waveform will be explained with reference to FIGS. 5 and 6.
図5は、脈波、速度脈波、加速度脈波の一例を示すグラフである。末梢血圧指標計算部33(図1、図2、図3)は、脈波を1階微分及び2階微分する。脈波を1階微分及び2階微分して得られる波形を、それぞれ速度脈波及び加速度脈波ということとする。例えば、サンプリングレートに対応する時間間隔で離散的に分布する脈波の強度を、サンプリングレートに相当する時間間隔で数値的に微分することにより、速度脈波を求める。さらに、速度脈波の大きさを数値的に微分することにより、加速度脈波を求める。
FIG. 5 is a graph showing an example of a pulse wave, velocity pulse wave, and acceleration pulse wave. The peripheral blood pressure index calculation unit 33 (FIGS. 1, 2, and 3) performs first-order differentiation and second-order differentiation of the pulse wave. The waveforms obtained by first-order differentiation and second-order differentiation of a pulse wave are referred to as a velocity pulse wave and an acceleration pulse wave, respectively. For example, the velocity pulse wave is determined by numerically differentiating the intensity of the pulse wave, which is distributed discretely at time intervals corresponding to the sampling rate, by the time interval corresponding to the sampling rate. Furthermore, the acceleration pulse wave is determined by numerically differentiating the magnitude of the velocity pulse wave.
図5の横軸は時間を単位[s]で表し、左縦軸は最大値が1になるように正規化された速度脈波及び加速度脈波の大きさを表し、右縦軸は脈波の大きさを任意単位で表す。図2に示すグラフの実線、長い破線、及び短い破線は、それぞれ脈波、速度脈波、及び加速度脈波を示す。一般的に、1拍内の加速度脈波に、5個のピークが現れる。1拍内の1番目、2番目、3番目、4番目、及び5番目のピークを、それぞれa波、b波、c波、d波、e波という。
The horizontal axis of FIG. 5 represents time in units [s], the left vertical axis represents the magnitude of the velocity pulse wave and acceleration pulse wave normalized so that the maximum value is 1, and the right vertical axis represents the pulse wave. represents the size of in arbitrary units. A solid line, a long broken line, and a short broken line in the graph shown in FIG. 2 indicate a pulse wave, a velocity pulse wave, and an acceleration pulse wave, respectively. Generally, five peaks appear in an accelerated pulse wave within one beat. The 1st, 2nd, 3rd, 4th, and 5th peaks within one beat are called a wave, b wave, c wave, d wave, and e wave, respectively.
速度脈波の最初の上向きのピークの半値全幅を「VE0.5」と標記する。a波のピーク値とb波のピーク値との差を「a-b」と標記し、a波のピーク値とd波のピーク値との差を「a-d」と標記する。脈波の最大のピークのやや後ろ側に、切痕ICと呼ばれる凹部が現れる。
The full width at half maximum of the first upward peak of the velocity pulse wave is written as "VE0.5". The difference between the peak value of the a wave and the peak value of the b wave is marked as "ab", and the difference between the peak value of the a wave and the peak value of the d wave is marked as "ad". A concave portion called the notch IC appears slightly behind the maximum peak of the pulse wave.
図6は、脈波及び加速度脈波の一例を示すグラフである。横軸は時間を表し、左縦軸は脈波の大きさを任意単位で表し、右縦軸は加速度脈波の大きさを、任意単位で表す。横軸の5目盛りが0.2sに相当する。加速度脈波のa波のピーク値を「a」と標記し、脈波の振幅を「S」と標記する。脈波の振幅Sは、連続する2拍の脈波の最小値が同じ大きさになるように波形の補正を行った後の最小値と最大値との差に相当する。
FIG. 6 is a graph showing an example of a pulse wave and an accelerated pulse wave. The horizontal axis represents time, the left vertical axis represents the magnitude of the pulse wave in arbitrary units, and the right vertical axis represents the magnitude of the accelerated pulse wave in arbitrary units. 5 scales on the horizontal axis corresponds to 0.2 s. The peak value of the a wave of the accelerated pulse wave is marked as "a", and the amplitude of the pulse wave is marked as "S". The amplitude S of the pulse wave corresponds to the difference between the minimum value and the maximum value after the waveform is corrected so that the minimum values of two consecutive pulse waves have the same magnitude.
末梢血圧指標の上記2つの特徴が反映される脈波特徴量として、以下の3つの特徴量が挙げられる。
・半値全幅を「VE0.5」の逆数(以下、「1/(VE0.5)」と標記する。)
・加速度脈波のa波のピーク値aに対する脈波の振幅Sの比(以下、「a/S」と標記する。)
・加速度脈波のa波のピーク値とb波のピーク値との差「a-b」と、a波のピーク値とd波のピーク値との差「a-d」との比(以下、「(a-b)/(a-d)」と標記する。)
本明細書において、脈波の波形のこれらの特徴量を、「末梢血圧指標」ということとする。これらの末梢血圧指標は、脈波の立ち上がりの急峻度に関係している。 The following three feature quantities are listed as pulse wave feature quantities that reflect the above two features of the peripheral blood pressure index.
・The full width at half maximum is the reciprocal of "VE0.5" (hereinafter referred to as "1/(VE0.5)")
・Ratio of amplitude S of pulse wave to peak value a of wave a of accelerated pulse wave (hereinafter referred to as "a/S")
・The ratio of the difference "a-b" between the peak value of the a-wave and the peak value of the b-wave of the accelerated pulse wave to the difference "a-d" between the peak value of the a-wave and the peak value of the d-wave (hereinafter referred to as , written as "(a-b)/(a-d)".)
In this specification, these characteristic amounts of the pulse wave waveform are referred to as "peripheral blood pressure index." These peripheral blood pressure indicators are related to the steepness of the rise of the pulse wave.
図7A及び図7Bは、心臓から被測定部位(指)までの高さを変化させたとき、及び被測定部位を胸の高さに合わせて被測定部位である指のある側の肘の近傍を冷却したときに測定された脈波から求まる末梢血圧指標「1/VE0.5」の値と、手首で測定される収縮期の血圧との関係を示すグラフである。図7A及び図7Bは、それぞれ脈波の測定に、図1に示した脈圧測定装置(緑色光)を用いた場合、及び図2に示した脈圧測定装置(近赤外光)を用いた場合の測定結果を示す。緑色光を用いて測定した脈波には、主として毛細血管73(図1)の血流の変動が反映され、近赤外光を用いて測定した脈波には、毛細血管73及び細動脈72(図2)の血流の変動が反映される。
Figures 7A and 7B show the vicinity of the elbow on the side where the finger, which is the measurement site, is adjusted when the height from the heart to the measurement site (finger) is changed, and when the measurement site is adjusted to the chest height. It is a graph showing the relationship between the value of peripheral blood pressure index "1/VE0.5" found from the pulse wave measured when cooling the body and the systolic blood pressure measured at the wrist. 7A and 7B show the case where the pulse pressure measuring device shown in FIG. 1 (green light) is used to measure the pulse wave, and the pulse pressure measuring device shown in FIG. 2 (near infrared light) is used to measure the pulse wave, respectively. The measurement results are shown below. Pulse waves measured using green light mainly reflect fluctuations in blood flow in capillaries 73 (FIG. 1), and pulse waves measured using near-infrared light mainly reflect fluctuations in blood flow in capillaries 73 and arterioles 72. The fluctuations in blood flow shown in (Figure 2) are reflected.
図7A及び図7Bのグラフの横軸は、手首における収縮期の血圧を単位[mmHg]で表し、縦軸は、末梢血圧指標「1/(VE0.5)」を単位[s-1]で表す。各グラフにおいて、3人の被験者A、B、Cについて測定を行った結果を、それぞれ三角記号、四角記号、及び丸記号で示している。被験者ごとに示す中空の3つの記号は、それぞれ被測定部位(指)の高さを、へそ、胸、及び額の高さに設定して取得した脈波から求めた脈波特徴量の値を示している。被測定部位の高さがへそ、胸、額の順に、末梢血圧指標「1/VE0.5」の値が小さくなっている。被験者ごとに示す黒色で塗りつぶした記号は、被測定部位の高さを胸の高さに設定し、肘の近傍を冷却した状態で取得した脈波から求めた末梢血圧指標「1/VE0.5」の値を示している。
The horizontal axis of the graphs in FIGS. 7A and 7B represents the systolic blood pressure at the wrist in units [mmHg], and the vertical axis represents the peripheral blood pressure index "1/(VE0.5)" in units [s -1 ]. represent. In each graph, the results of measurements performed on three subjects A, B, and C are shown using triangle symbols, square symbols, and circle symbols, respectively. The three hollow symbols shown for each subject indicate the values of the pulse wave features obtained from the pulse waves obtained by setting the height of the measurement site (finger) to the height of the navel, chest, and forehead. It shows. The value of the peripheral blood pressure index "1/VE0.5" decreases in the order of height of the measurement site: navel, chest, and forehead. The symbol filled in black for each subject is the peripheral blood pressure index "1/VE0.5" obtained from the pulse wave obtained with the measurement site set at chest level and the area near the elbow cooled. ” value is shown.
被験者によって程度の違いはあるが、被測定部位の高さを変化させたとき、末梢血圧指標「1/VE0.5」は、手首における収縮期血圧とおおむね正の相関関係を有していることがわかる。さらに、一部の例外はあるが、測定部位の近傍を冷却して血管を収縮させると、末梢血圧指標「1/VE0.5」が低下していることがわかる。この変化の様子は、想定していた末梢血圧指標の特徴に合致する。したがって、末梢血圧指標「1/VE0.5」は、末梢血圧を推定するために有効な指標であると考えられる。
Although the degree differs depending on the subject, when the height of the measurement site is changed, the peripheral blood pressure index "1/VE0.5" has a generally positive correlation with the systolic blood pressure at the wrist. I understand. Furthermore, although there are some exceptions, it can be seen that when the vicinity of the measurement site is cooled to constrict blood vessels, the peripheral blood pressure index "1/VE0.5" decreases. The appearance of this change matches the expected characteristics of the peripheral blood pressure index. Therefore, the peripheral blood pressure index "1/VE0.5" is considered to be an effective index for estimating peripheral blood pressure.
なお、図7A及び図7Bに示した結果から、末梢血圧指標「1/VE0.5」の測定には、近赤外光よりも緑色光を用いる方が好ましいことがわかる。また、末梢血圧指標「1/VE0.5」に代わる指標として、速度脈波の最大のピークの幅を表すパラメータの逆数を用いてもよい。その他に、速度脈波の最大のピークの幅を表すパラメータの、指数が負のべき乗を用いてもよい。より一般的には、速度脈波の最大のピークの幅を表すパラメータを変数とし、ピークの幅が大きくなると関数の値が小さくなるような関数を、末梢血圧指標として用いてもよい。
Note that from the results shown in FIGS. 7A and 7B, it can be seen that it is preferable to use green light rather than near-infrared light for measuring the peripheral blood pressure index "1/VE0.5". Further, as an index instead of the peripheral blood pressure index "1/VE0.5", the reciprocal of the parameter representing the width of the maximum peak of the velocity pulse wave may be used. Alternatively, a negative exponent of a parameter representing the width of the maximum peak of the velocity pulse wave may be used. More generally, a parameter representing the width of the maximum peak of the velocity pulse wave may be used as a variable, and a function such that the value of the function decreases as the width of the peak increases may be used as the peripheral blood pressure index.
図8A及び図8Bは、心臓から被測定部位(指)までの高さを変化させたとき、及び被測定部位を胸の高さに合わせて被測定部位である指のある側の肘の近傍を冷却したときに測定された脈波から求まる末梢血圧指標「a/S」の値と、手首で測定される収縮期の血圧との関係を示すグラフである。図8A及び図8Bは、それぞれ脈波の測定に、図1に示した脈圧測定装置(緑色光)を用いた場合、及び図2に示した脈圧測定装置(近赤外光)を用いた場合の測定結果を示す。
Figures 8A and 8B show the vicinity of the elbow on the side where the finger, which is the measurement site, is adjusted when the height from the heart to the measurement site (finger) is changed, and when the measurement site is adjusted to the chest height. It is a graph showing the relationship between the value of the peripheral blood pressure index "a/S" determined from the pulse wave measured when the patient is cooled, and the systolic blood pressure measured at the wrist. FIGS. 8A and 8B show the case where the pulse pressure measuring device shown in FIG. 1 (green light) is used to measure the pulse wave, and the pulse pressure measuring device shown in FIG. 2 (near infrared light) is used to measure the pulse wave, respectively. The measurement results are shown below.
図8A及び図8Bのグラフの横軸は、手首における収縮期の血圧を単位[mmHg]で表し、縦軸は、末梢血圧指標「a/S」を任意単位で表す。図8A及び図8Bの各記号の意味は、図7A及び図7Bに示したグラフの各記号の意味と同一である。
The horizontal axis of the graphs in FIGS. 8A and 8B represents the systolic blood pressure at the wrist in units [mmHg], and the vertical axis represents the peripheral blood pressure index "a/S" in arbitrary units. The meaning of each symbol in FIGS. 8A and 8B is the same as the meaning of each symbol in the graphs shown in FIGS. 7A and 7B.
図8A及び図8Bに示した測定結果は、図7A及び図7Bに示した測定結果とほぼ同様の傾向を示す。したがって、末梢血圧指標「a/S」は、末梢血圧を推定するために有効な指標であると考えられる。なお、図8A及び図8Bに示した結果から、末梢血圧指標「a/S」の測定には、近赤外光よりも緑色光を用いる方が好ましいことがわかる。
The measurement results shown in FIGS. 8A and 8B show almost the same tendency as the measurement results shown in FIGS. 7A and 7B. Therefore, the peripheral blood pressure index "a/S" is considered to be an effective index for estimating peripheral blood pressure. Note that from the results shown in FIGS. 8A and 8B, it can be seen that it is preferable to use green light rather than near-infrared light for measuring the peripheral blood pressure index "a/S".
末梢血圧指標「a/S」に代えて、加速度脈波のa波のピーク値aの、指数が正のべき乗と、脈波の振幅Sの、指数が負のべき乗との積を、末梢血圧指標としてもよい。または、加速度脈波のa波のピーク値と脈波信号の振幅とに関する情報に基づいて、末梢血圧指標を計算するようにしてもよい。例えば、ピーク値aと振幅Sとを変数とし、ピーク値aが増加すると関数の値も増加し、振幅Sが増加すると関数の値が減少するような関数を、末梢血圧指標として用いてもよい。
Instead of the peripheral blood pressure index "a/S", the product of the peak value a of the a wave of the accelerated pulse wave to a power with a positive index and the amplitude S of the pulse wave to a power with a negative index is calculated as the peripheral blood pressure. It can also be used as an indicator. Alternatively, the peripheral blood pressure index may be calculated based on information regarding the peak value of the a-wave of the accelerated pulse wave and the amplitude of the pulse wave signal. For example, a function may be used as a peripheral blood pressure index in which the peak value a and the amplitude S are used as variables, and when the peak value a increases, the value of the function also increases, and when the amplitude S increases, the value of the function decreases. .
図9A及び図9Bは、心臓から被測定部位(指)までの高さを変化させたとき、及び被測定部位を胸の高さに合わせて被測定部位である指のある側の肘の近傍を冷却したときに測定された脈波から求まる末梢血圧指標「(a-b)/(a-d)」の値と、手首で測定される収縮期の血圧との関係を示すグラフである。図9A及び図9Bは、それぞれ脈波の測定に、図1に示した脈圧測定装置(緑色光)を用いた場合、及び図2に示した脈圧測定装置(近赤外光)を用いた場合の測定結果を示す。
Figures 9A and 9B show the area near the elbow on the side where the finger, which is the measurement site, is adjusted when the height from the heart to the measurement site (finger) is changed, and when the measurement site is adjusted to the chest height. 2 is a graph showing the relationship between the value of the peripheral blood pressure index "(ab)/(ad)" determined from the pulse wave measured when the patient is cooled, and the systolic blood pressure measured at the wrist. 9A and 9B show the case where the pulse pressure measuring device shown in FIG. 1 (green light) is used to measure the pulse wave, and the pulse pressure measuring device shown in FIG. 2 (near infrared light) is used to measure the pulse wave, respectively. The measurement results are shown below.
図9A及び図9Bのグラフの横軸は、手首における収縮期の血圧を単位[mmHg]で表し、縦軸は、末梢血圧指標「(a-b)/(a-d)」を表す。図9A及び図9Bの各記号の意味は、図7A及び図7Bに示したグラフの各記号の意味と同一である。
The horizontal axis of the graphs in FIGS. 9A and 9B represents the systolic blood pressure at the wrist in units [mmHg], and the vertical axis represents the peripheral blood pressure index "(ab)/(ad)". The meaning of each symbol in FIGS. 9A and 9B is the same as the meaning of each symbol in the graphs shown in FIGS. 7A and 7B.
図9A及び図9Bに示した測定結果は、図7A及び図7Bに示した測定結果とほぼ同様の傾向を示す。したがって、末梢血圧指標「(a-b)/(a-d)」は、末梢血圧を推定するために有効な指標であると考えられる。
The measurement results shown in FIGS. 9A and 9B show almost the same tendency as the measurement results shown in FIGS. 7A and 7B. Therefore, the peripheral blood pressure index "(ab)/(ad)" is considered to be an effective index for estimating peripheral blood pressure.
末梢血圧指標「(a-b)/(a-d)」に代えて、加速度脈波のa波のピーク値とb波のピーク値との差と、a波のピーク値とd波のピーク値との差とに関する情報に基づいて、末梢血圧指標を計算するようにしてもよい。例えば、a波のピーク値とb波のピーク値との差(a-b)と、a波のピーク値とd波のピーク値との差(a-d)とを変数とし、差(a-b)の値が増加すると関数の値が増加し、差(a-d)の値が増加すると関数の値が減少するような関数を、末梢血圧指標として用いてもよい。
Instead of the peripheral blood pressure index "(a-b)/(a-d)", the difference between the peak value of the a wave and the peak value of the b wave of the accelerated pulse wave, the peak value of the a wave and the peak of the d wave The peripheral blood pressure index may be calculated based on information regarding the difference between the peripheral blood pressure index and the peripheral blood pressure index. For example, if the difference (a-b) between the peak value of the a-wave and the peak value of the b-wave and the difference (a-d) between the peak value of the a-wave and the peak value of the d-wave are variables, the difference (a A function in which the value of the function increases as the value of -b) increases, and decreases as the value of the difference (ad) increases, may be used as the peripheral blood pressure index.
[末梢血圧指標と収縮期血圧との関係]
被験者の人数を増やして手首収縮期の血圧と末梢血圧指標との関係を求める評価実験を行った。図10Aから図12Bまでの図面を参照して、この評価実験の結果について説明する。評価実験においては、大きく異なる極端なデータの収集のため、健常者及び糖尿病患者を被験者に加えた。左または右の手首にカフ式血圧計を装着し、カフ式血圧計を装着した側の手の人差し指に光電脈波センサ(図1、図2、図3)を搭載したリングデバイス61(図4)を装着した。 [Relationship between peripheral blood pressure index and systolic blood pressure]
We conducted an evaluation experiment to increase the number of subjects and determine the relationship between wrist systolic blood pressure and peripheral blood pressure index. The results of this evaluation experiment will be explained with reference to the drawings from FIG. 10A to FIG. 12B. In the evaluation experiment, healthy subjects and diabetic patients were included as subjects in order to collect extremely different data. A cuff-type blood pressure monitor is worn on the left or right wrist, and a ring device 61 (Figure 4 ) was installed.
安静座位で、光電脈波センサを装着した手を胸の高さに保持して、光電脈波及び血圧のそれぞれを測定した。両者を同時に測定すると、カフにより指の血流が阻害されるため、光電脈波の測定が終了した後に、カフ式血圧計で血圧を測定した。
In a resting sitting position, the hand with the photoplethysmogram sensor was held at chest height, and the photoplethysmogram and blood pressure were each measured. If both were measured at the same time, blood flow in the finger would be inhibited by the cuff, so blood pressure was measured with a cuff-type sphygmomanometer after the photoplethysmogram measurement was completed.
図10A及び図10Bは、横軸を手首の収縮期血圧(以下、単に血圧という場合がある。)とし、縦軸を末梢血圧指標「1/VE0.5」とする複数の被験者の散布図である。図11A及び図11Bは、横軸を手首の収縮期血圧とし、縦軸を末梢血圧指標「a/S」とする複数の被験者の散布図である。図12A及び図12Bは、横軸を手首の収縮期血圧とし、縦軸を末梢血圧指標「(a-b)/(a-d)」とする複数の被験者の散布図である。図10A、図11A、及び図12Aは、緑色光を用いて脈波を測定した結果を示し、図10B、図11B、及び図12Bは、近赤外光を用いて脈波を測定した結果を示す。各グラフにおいて、黒丸記号及び中空丸記号は、それぞれ健常者の測定結果、及び糖尿病患者の測定結果を示す。
FIGS. 10A and 10B are scatter diagrams of multiple subjects in which the horizontal axis is the wrist systolic blood pressure (hereinafter sometimes simply referred to as blood pressure) and the vertical axis is the peripheral blood pressure index "1/VE0.5". be. FIGS. 11A and 11B are scatter diagrams of a plurality of subjects, with the horizontal axis representing wrist systolic blood pressure and the vertical axis representing peripheral blood pressure index "a/S." 12A and 12B are scatter diagrams of a plurality of subjects, with the horizontal axis representing wrist systolic blood pressure and the vertical axis representing peripheral blood pressure index "(ab)/(ad)". 10A, 11A, and 12A show the results of measuring pulse waves using green light, and FIGS. 10B, 11B, and 12B show the results of measuring pulse waves using near-infrared light. show. In each graph, the black circle symbol and the hollow circle symbol indicate the measurement results of a healthy person and the measurement result of a diabetic patient, respectively.
図10A及び図10Bから、血圧が高いほど、末梢血圧指標「1/VE0.5」が小さくなる傾向を示すことがわかる。また、緑色光を用いて脈波を測定した場合は、糖尿病患者の末梢血圧指標「1/VE0.5」が相対的に低い範囲に集中しており、健常者の末梢血圧指標「1/VE0.5」が分布する範囲と明確に分離されていることがわかる。このような測定結果は、以下のような機序であると推定される。
It can be seen from FIGS. 10A and 10B that the higher the blood pressure, the smaller the peripheral blood pressure index "1/VE0.5" tends to be. Furthermore, when pulse waves are measured using green light, the peripheral blood pressure index "1/VE0.5" of diabetic patients is concentrated in a relatively low range, and the peripheral blood pressure index "1/VE0.5" of healthy subjects is concentrated in a relatively low range. .5" is clearly separated from the distribution range. Such measurement results are presumed to be due to the following mechanism.
血糖値が高い状態が続くと、血管が脆く、ボロボロになってしまういわゆる血管病になり、太い血管で動脈硬化が進行する。細い血管もダメージを受けて、血管の機能(血管内皮機能)が低下し、血流が悪くなる。
When blood sugar levels remain high, blood vessels become fragile and crumbly, a condition known as vascular disease, which progresses to arteriosclerosis in large blood vessels. Small blood vessels are also damaged, resulting in decreased blood vessel function (vascular endothelial function) and poor blood flow.
太い動脈から細動脈、毛細血管へ進むにしたがって、局所的な血圧(末梢血圧)は低下していく。血管内皮機能が低下すると、末梢血圧の低下の度合いが大きくなると推測される。糖尿病患者の約40%以上60%以下が高血圧を併発するといわれている。図10Aに示した評価結果では、糖尿病患者の収縮期血圧が健常者の収縮期血圧より高いが、その傾向は顕著ではない。これに対して、糖尿病患者の末梢血圧指標「1/VE0.5」が健常者の末梢血圧指標「1/VE0.5」より低い傾向は明瞭である。これは、糖尿病患者で末梢血管障害が起こり、末梢血管への血流が阻害されるために、末梢血圧指標「1/VE0.5」が低下すると説明できる。
Local blood pressure (peripheral blood pressure) decreases as it progresses from large arteries to arterioles and capillaries. It is assumed that when vascular endothelial function decreases, the degree of decrease in peripheral blood pressure increases. It is said that approximately 40% to 60% of diabetic patients have hypertension. In the evaluation results shown in FIG. 10A, the systolic blood pressure of diabetic patients is higher than that of healthy subjects, but this tendency is not significant. On the other hand, it is clear that the peripheral blood pressure index "1/VE0.5" of diabetic patients tends to be lower than the peripheral blood pressure index "1/VE0.5" of healthy people. This can be explained by the fact that peripheral vascular disease occurs in diabetic patients and blood flow to peripheral blood vessels is inhibited, resulting in a decrease in the peripheral blood pressure index "1/VE0.5".
図11A及び図11Bに示すように、末梢血圧指標「a/S」は、健常者においては、末梢血圧指標「1/VE0.5」と同様に、血圧が高くなるほど小さくなる傾向を示す。なお、糖尿病患者においては、末梢血圧指標「a/S」のばらつきが大きく、末梢血圧指標「a/S」と血圧との相関は明確ではない。これは、加速度脈波のa波のピーク値a、及び脈波の振幅S(図6)が、様々な因子の影響を受けやすいためと推測される。
As shown in FIGS. 11A and 11B, in healthy subjects, the peripheral blood pressure index "a/S" tends to decrease as the blood pressure increases, similar to the peripheral blood pressure index "1/VE0.5". Note that in diabetic patients, the dispersion of the peripheral blood pressure index "a/S" is large, and the correlation between the peripheral blood pressure index "a/S" and blood pressure is not clear. This is presumed to be because the peak value a of the a wave of the accelerated pulse wave and the amplitude S of the pulse wave (FIG. 6) are easily influenced by various factors.
図12A及び図12Bに示すように、末梢血圧指標「(a-b)/(a-d)」は、末梢血圧指標「1/VE0.5」と同様に、血圧が高くなるほど小さくなる傾向を示す。また、緑色光を用いて取得された脈波から計算された末梢血圧指標「(a-b)/(a-d)」の大きさは、健常者と糖尿病患者とで明確に分離している。末梢血圧指標「(a-b)/(a-d)」がゼロの横軸上に位置する3つの測定結果は、加速度脈波のb波が検出できなかった被験者を示している。
As shown in FIGS. 12A and 12B, the peripheral blood pressure index "(a-b)/(a-d)" tends to decrease as the blood pressure increases, similar to the peripheral blood pressure index "1/VE0.5". show. Furthermore, the magnitude of the peripheral blood pressure index "(a-b)/(a-d)" calculated from the pulse wave obtained using green light is clearly separated between healthy subjects and diabetic patients. . The three measurement results located on the horizontal axis where the peripheral blood pressure index "(ab)/(ad)" is zero indicate subjects for whom the b wave of the accelerated pulse wave could not be detected.
[血圧と因果関係があると思われる脈波の特徴量]
次に、図13Aから図17を参照して、血圧と因果関係があると思われる脈波の特徴量について説明する。図13Aから図17までの図面は、横軸を手首の収縮期血圧とし、縦軸を脈波の種々の特徴量とする複数の被験者の散布図である。 [Features of pulse waves that are thought to have a causal relationship with blood pressure]
Next, with reference to FIGS. 13A to 17, feature quantities of pulse waves that are thought to have a causal relationship with blood pressure will be described. The drawings from FIG. 13A to FIG. 17 are scatter diagrams of a plurality of subjects, with the horizontal axis representing wrist systolic blood pressure and the vertical axis representing various characteristic amounts of pulse waves.
図13A及び図13Bの縦軸は、加速度脈波のa波のピークからb波のピークまでの経過時間(以下、「ab時間」という。)を単位[s]で表す。図14A及び図14Bの縦軸は、加速度脈波のb波のピークからd波のピークまでの経過時間(以下、「bd時間」という。)を単位[s]で表す。図15A及び図15Bの縦軸は、加速度脈波のd波のピークからe波のピークまでの経過時間(以下、「de時間」という。)を単位[s]で表す。図16A及び図16Bの縦軸は、加速度脈波のa波のピークからe波のピークまでの経過時間(以下、「ae時間」という。)を単位[s]で表す。図17の縦軸は、脈拍間隔を単位[s]で表す。
The vertical axis in FIGS. 13A and 13B represents the elapsed time from the peak of the a wave of the accelerated pulse wave to the peak of the b wave (hereinafter referred to as "ab time") in units [s]. The vertical axis in FIGS. 14A and 14B represents the elapsed time from the peak of the b wave to the peak of the d wave of the accelerated pulse wave (hereinafter referred to as "bd time") in units [s]. The vertical axis in FIGS. 15A and 15B represents the elapsed time from the peak of the d wave to the peak of the e wave of the accelerated pulse wave (hereinafter referred to as "de time") in units [s]. The vertical axis of FIGS. 16A and 16B represents the elapsed time from the peak of the a wave of the accelerated pulse wave to the peak of the e wave (hereinafter referred to as "ae time") in units of [s]. The vertical axis in FIG. 17 represents the pulse interval in units [s].
図13A、図14A、図15A、及び図16Aは、緑色光を用いて測定した脈波の特徴量を示しており、図13B、図14B、図15B、及び図16Bは、近赤外光を用いて測定した脈波の特徴量を示している。図17に示した脈拍間隔は、緑色光及び近赤外光のいずれを用いても違いはない。
13A, 14A, 15A, and 16A show the characteristic amounts of pulse waves measured using green light, and FIGS. 13B, 14B, 15B, and 16B show the characteristics of pulse waves measured using near-infrared light. The characteristic quantities of the pulse wave measured using the method are shown. The pulse intervals shown in FIG. 17 are the same regardless of whether green light or near-infrared light is used.
図13A及び図13Bに示すように、特徴量「ab時間」と収縮期血圧とは、弱い負の相関関係を有することがわかる。図14A及び図14Bに示すように、特徴量「bd時間」と収縮期血圧とは、正の相関関係を有することがわかる。図15A及び図15Bに示すように、特徴量「de時間」と収縮期血圧とは、負の相関関係を有することがわかる。図16A、図16B、及び図17に示すように、特徴量「ae時間」及び脈拍間隔は、収縮期血圧との相関関係がみられなかった。
As shown in FIGS. 13A and 13B, it can be seen that the feature amount "ab time" and systolic blood pressure have a weak negative correlation. As shown in FIGS. 14A and 14B, it can be seen that the feature amount "bd time" and the systolic blood pressure have a positive correlation. As shown in FIGS. 15A and 15B, it can be seen that the feature amount "de time" and the systolic blood pressure have a negative correlation. As shown in FIGS. 16A, 16B, and 17, the feature quantity "ae time" and the pulse interval had no correlation with systolic blood pressure.
また、特徴量「de時間」は、健常者と糖尿病患者との間で違いがみられた。具体的には、収縮期血圧がほぼ同一であれば、糖尿病患者の特徴量「de時間」が、健常者の特徴量「de時間」より大きい傾向がみられた。その他の特徴量では、健常者と糖尿病患者との間で明確な傾向は確認できなかった。
Additionally, there was a difference in the feature value "de time" between healthy subjects and diabetic patients. Specifically, when the systolic blood pressures were almost the same, the feature quantity "de time" of diabetic patients tended to be larger than the feature quantity "de time" of healthy subjects. Regarding other feature values, no clear trends were observed between healthy subjects and diabetic patients.
特徴量「de時間」と収縮期血圧との間で、負の相関関係がみられた機序は、以下のように推定される。
The mechanism by which a negative correlation was observed between the feature quantity "de time" and systolic blood pressure is estimated as follows.
図5に示すように、加速度脈波のd波のピークが現れる時刻は、脈波が極大値をとる時刻と近いことがわかる。加速度脈波のb波の近傍が駆出波、d波の近傍が反射波とみなされ、その後(図5に示した0.4秒の近傍)に脈波の切痕ICが現れる。血圧と「ae時間」との間に明確な相関関係がみられないことから、血圧が高くなると「de時間」が短くなる傾向を示すことは、血圧が高くなるとd波のピークの位置が後ろ(e波のピークの位置に近づく方向)に移動することを意味する。
As shown in FIG. 5, it can be seen that the time when the peak of the d wave of the accelerated pulse wave appears is close to the time when the pulse wave takes its maximum value. The vicinity of the b-wave of the accelerated pulse wave is regarded as an ejection wave, and the vicinity of the d-wave is regarded as a reflected wave, and thereafter (near 0.4 seconds shown in FIG. 5), a notch IC of the pulse wave appears. Since there is no clear correlation between blood pressure and "ae time", the higher the blood pressure, the shorter the "de time". (in the direction approaching the peak position of the e-wave).
血流量が増加することは、駆出波及び反射波が増大することを意味する。したがって、血流量の増加により、脈波の凸部(b波からd波までの範囲)が後ろに広がる。その結果、d波のピークの位置も後ろに移動すると考えられる。すなわち、血圧が高くなったために血流量が増加し、血流量の増加によって「de時間」が短くなったと考えられる。
An increase in blood flow means an increase in ejection waves and reflected waves. Therefore, due to the increase in blood flow, the convex portion of the pulse wave (range from the B wave to the D wave) spreads backward. As a result, it is thought that the position of the peak of the d-wave also moves backward. That is, it is considered that the blood flow rate increased due to the increase in blood pressure, and the "de time" became shorter due to the increase in the blood flow rate.
図15A及び図15Bから、血圧が高くなると「de時間」が短くなる、すなわちd波のピークの位置がe波のピークの位置に近づく傾向を示すことがわかる。さらに、糖尿病患者では、健常者と比べてd波のピークの位置がe波のピークの位置から遠い傾向がみられる。上述の推測のように、血流量が増加すると「de時間」が短くなると考えられるため、糖尿病患者の「de時間」が健常者の「de時間」より長くなる傾向を示すことは、糖尿病患者では末梢の血圧が低下し、血液が流れにくくなるという推測と矛盾しない。
It can be seen from FIGS. 15A and 15B that as the blood pressure increases, the "de time" becomes shorter, that is, the position of the peak of the d wave tends to approach the position of the peak of the e wave. Furthermore, in diabetic patients, the peak position of the d wave tends to be farther from the peak position of the e wave than in healthy subjects. As speculated above, it is thought that the "de time" becomes shorter when the blood flow increases, so the fact that the "de time" of diabetic patients tends to be longer than that of healthy people means that the "de time" of diabetic patients tends to be longer than that of healthy people. This is consistent with speculation that peripheral blood pressure decreases, making it difficult for blood to flow.
図13Aから図14Bまでの散布部で、「ab時間」または「bd時間」が0秒の横軸上に、一部の糖尿病患者の測定結果が位置する。これは、加速度脈波のb波が検出できなかったことを示す。b波が検出できなかった被験者は、緑色光で測定した場合に、近赤外光で測定した場合より多いことがわかる。糖尿病患者のような末梢の血行が悪い被験者では、加速度脈波のb波が小さくなり、b波の検出が難しくなる場合が多くみられる。
In the scattering parts from FIG. 13A to FIG. 14B, the measurement results of some diabetic patients are located on the horizontal axis where "ab time" or "bd time" is 0 seconds. This indicates that the b wave of the accelerated pulse wave could not be detected. It can be seen that there were more subjects for whom b-waves could not be detected when measurements were taken using green light than when measurements were taken using near-infrared light. In subjects with poor peripheral blood circulation, such as diabetic patients, the b-wave of the accelerated pulse wave is often small, making it difficult to detect the b-wave.
図10Aから図17までの図面に示した評価結果から、糖尿病患者と健常者との間で顕著な差がみられた脈波の特徴量として、緑色光を用いたときの末梢血圧指標「1/VE0.5」(図10A)、緑色光を用いたときの末梢血圧指標「(a-b)/(a-d)」、及び緑色光または近赤外光を用いたときの特徴量「de時間」が挙げられることがわかる。
From the evaluation results shown in the drawings from FIG. 10A to FIG. 17, the peripheral blood pressure index "1 /VE0.5'' (Figure 10A), peripheral blood pressure index ``(a-b)/(a-d)'' when using green light, and feature amount ``(a-b)/(ad)'' when using green light or near-infrared light. It can be seen that "de time" can be mentioned.
[脈圧と因果関係があると考えられる特徴量]
次に、図18Aから図22までの図面を参照して、脈圧と因果関係があると考えられる脈波の特徴量について説明する。 [Features considered to have a causal relationship with pulse pressure]
Next, with reference to the drawings from FIG. 18A to FIG. 22, characteristic amounts of pulse waves that are considered to have a causal relationship with pulse pressure will be described.
図18Aから図22までの図面は、横軸を脈圧とし、縦軸を脈波の種々の特徴量とする複数の被験者の散布図である。
The drawings from FIG. 18A to FIG. 22 are scatter diagrams of a plurality of subjects, with the horizontal axis representing pulse pressure and the vertical axis representing various characteristic amounts of pulse waves.
図18A及び図18Bの縦軸は、末梢血圧指標「1/VE0.5」を単位[s-1]で表す。図19A及び図19Bの縦軸は、末梢血圧指標「(a-b)/(a-d)」を表す。図20A及び図20Bの縦軸は、特徴量「de時間」を単位[s]で表す。図21A及び図21Bの縦軸は、特徴量「ae時間」を単位[s]で表す。図22の縦軸は、脈拍間隔を単位[s]で表す。
The vertical axis in FIGS. 18A and 18B represents the peripheral blood pressure index "1/VE0.5" in units [s −1 ]. The vertical axis in FIGS. 19A and 19B represents the peripheral blood pressure index "(ab)/(ad)". The vertical axis in FIGS. 20A and 20B represents the feature amount "de time" in units [s]. The vertical axis in FIGS. 21A and 21B represents the feature amount "ae time" in units [s]. The vertical axis in FIG. 22 represents the pulse interval in units [s].
図18A、図19A、図20A、及び図21Aは、緑色光を用いて測定した脈波の特徴量を示しており、図18B、図19B、図20B、及び図21Bは、近赤外光を用いて測定した脈波の特徴量を示している。図22に示した脈拍間隔は、緑色光及び近赤外光のいずれを用いても違いはない。
18A, FIG. 19A, FIG. 20A, and FIG. 21A show the characteristic amounts of pulse waves measured using green light, and FIG. 18B, FIG. 19B, FIG. 20B, and FIG. The characteristic quantities of the pulse wave measured using the method are shown. The pulse intervals shown in FIG. 22 are the same regardless of whether green light or near-infrared light is used.
脈圧とある程度の相関関係がみられた特徴量として、末梢血圧指標「1/VE0.5」(図18A、図18B)、末梢血圧指標「(a-b)/(a-d)」(図19A、図19B)、及び特徴量「ae時間」(図21A、図21B)が挙げられる。末梢血圧指標「1/VE0.5」においては、近赤外光を用いた場合より緑色光を用いた場合の方が、強い相関関係がみられた。特徴量「de時間」(図20A、図20B)及び脈拍間隔(図22)は、脈圧と有意な相関関係は確認されない。
Features that had a certain degree of correlation with pulse pressure include peripheral blood pressure index "1/VE0.5" (Figures 18A and 18B), peripheral blood pressure index "(a-b)/(a-d)" ( 19A, FIG. 19B), and the feature amount "ae time" (FIGS. 21A, 21B). Regarding the peripheral blood pressure index "1/VE0.5", a stronger correlation was observed when green light was used than when near-infrared light was used. No significant correlation with pulse pressure is confirmed between the feature amount "de time" (FIGS. 20A and 20B) and the pulse interval (FIG. 22).
末梢血圧指標「1/VE0.5」及び末梢血圧指標「(a-b)/(a-d)」は、脈圧と負の相関関係を有することが確認される。これは、末梢血圧指標「1/VE0.5」及び末梢血圧指標「(a-b)/(a-d)」と、収縮期血圧との関係と同様である。末梢血圧指標「1/VE0.5」及び末梢血圧指標「(a-b)/(a-d)」が小さい被験者においては、血管抵抗が大きいと予想できる。血管抵抗が大きいと、脈圧が大きくなることが一般に知られている。すなわち、末梢血圧指標「1/VE0.5」及び末梢血圧指標「(a-b)/(a-d)」が、脈圧と負の相関関係を有することは、このような一般的な知見と矛盾しない。
It is confirmed that the peripheral blood pressure index "1/VE0.5" and the peripheral blood pressure index "(ab)/(ad)" have a negative correlation with pulse pressure. This is similar to the relationship between the peripheral blood pressure index "1/VE0.5" and the peripheral blood pressure index "(ab)/(ad)" and systolic blood pressure. It can be expected that a subject with a small peripheral blood pressure index "1/VE0.5" and a small peripheral blood pressure index "(ab)/(ad)" will have a large vascular resistance. It is generally known that when vascular resistance is high, pulse pressure is high. In other words, it is based on such general knowledge that the peripheral blood pressure index "1/VE0.5" and the peripheral blood pressure index "(a-b)/(a-d)" have a negative correlation with pulse pressure. does not contradict.
特徴量「ae時間」は、脈圧と負の相関関係を有することが確認される。特徴量「ae時間」は、緑色光で測定した場合と、近赤外光で測定した場合とで、大きな差異がみられない。脈波に現れる切痕IC(図5)は、収縮期の終わりといわれており、加速度脈波のe波のピークの位置は、切痕ICの位置に対応している。緑色光を用いた場合と、近赤外光を用いた場合とで、「ae時間」に差異がみられないことから、「ae時間」は、血管状態等の影響を受けにくいと推測される。
It is confirmed that the feature quantity "ae time" has a negative correlation with pulse pressure. There is no significant difference in the feature quantity "ae time" between when measured using green light and when measured using near-infrared light. The notch IC (FIG. 5) that appears in the pulse wave is said to be at the end of the systole, and the position of the peak of the e wave of the accelerated pulse wave corresponds to the position of the notch IC. Since there is no difference in "ae time" when using green light and when using near-infrared light, it is assumed that "ae time" is not easily affected by blood vessel conditions, etc. .
「ae時間」が長いということは、左心室が収縮している時間が長いことを意味する。したがって、「ae時間」は、1回心拍出量と正の相関関係を有すると考えられる。脈圧が「ae時間」と正の相関関係を有するということは、1回心拍出量が多くなると脈圧が大きくなるということで説明できる。
A long "ae time" means that the left ventricle contracts for a long time. Therefore, "ae time" is considered to have a positive correlation with stroke cardiac output. The fact that the pulse pressure has a positive correlation with the "ae time" can be explained by the fact that as the stroke volume increases, the pulse pressure increases.
[脈圧測定方法]
次に、第1実施例による脈波測定方法について説明する。第1実施例では、脈圧と相関関係を有する末梢血圧指標「1/VE0.5」と、特徴量「ae時間」とに基づいて脈圧を計算する。例えば、末梢血圧指標「1/VE0.5」のべき乗の値、及び特徴量「ae時間」のべき乗の値を変数とする関数を用いて脈圧を計算する。 [Pulse pressure measurement method]
Next, a pulse wave measuring method according to the first embodiment will be explained. In the first embodiment, pulse pressure is calculated based on a peripheral blood pressure index "1/VE0.5" that has a correlation with pulse pressure and a feature amount "ae time". For example, the pulse pressure is calculated using a function whose variables are the value of the power of the peripheral blood pressure index "1/VE0.5" and the value of the power of the feature quantity "ae time".
次に、この関数について説明する。第1実施例では、以下の式で脈圧指標値Paを計算する。
Pa=(1/VE0.5)-α×(ae時間)β・・・(1)
ここで、α及びβは正のフィッティングパラメータである。実際の脈圧の値は、脈圧指標値Paに係数を乗じることにより計算することができる。フィッティングパラメータα、β、及び係数は、実際に評価実験を行うことにより決定することができる。 Next, this function will be explained. In the first embodiment, the pulse pressure index value Pa is calculated using the following formula.
Pa=(1/VE0.5) -α ×(ae time) β ...(1)
Here, α and β are positive fitting parameters. The actual pulse pressure value can be calculated by multiplying the pulse pressure index value Pa by a coefficient. The fitting parameters α, β, and coefficients can be determined by actually conducting evaluation experiments.
次に、図23A及び図23Bを参照して、実際に行った評価実験の結果について説明する。複数の被験者の脈波を測定し、脈波から脈圧指標値Paを計算した。さらに、手首で測定した収縮期血圧及び拡張期血圧から、脈圧を計算した。被験者には、複数の健常者と複数の糖尿病患者が含まれる。脈波の測定は、リングデバイス61(図4)を被験者の指元に装着し、測定部位の高さを心臓の高さとほぼ一致させた状態で行った。
Next, the results of the evaluation experiment actually conducted will be explained with reference to FIGS. 23A and 23B. Pulse waves of a plurality of subjects were measured, and a pulse pressure index value Pa was calculated from the pulse waves. Furthermore, pulse pressure was calculated from the systolic and diastolic blood pressures measured at the wrist. Subjects included multiple healthy subjects and multiple diabetic patients. The measurement of the pulse wave was performed with the ring device 61 (FIG. 4) attached to the subject's finger, and the height of the measurement site approximately aligned with the height of the heart.
図23Aは、式(1)のフィッティングパラメータα及びβを、それぞれα=1、β=1.5とした場合の測定結果の散布図である。横軸は脈圧を単位[mmHg]で表し、縦軸は脈圧指標値Paを表す。末梢血圧指標「1/VE0.5」は、緑色光を用いて測定した脈波から求め、特徴量「ae時間」は、近赤外光を用いて測定した脈波から求めた。図23A中の黒丸記号及び中空丸記号は、それぞれ健常者及び糖尿病患者の測定結果を示す。全体として、脈圧指標値Paと脈圧とは、正の相関関係を有することがわかる。
FIG. 23A is a scatter diagram of the measurement results when the fitting parameters α and β of equation (1) are set to α=1 and β=1.5, respectively. The horizontal axis represents pulse pressure in the unit [mmHg], and the vertical axis represents pulse pressure index value Pa. The peripheral blood pressure index "1/VE0.5" was determined from the pulse wave measured using green light, and the feature amount "ae time" was determined from the pulse wave measured using near-infrared light. The filled circle symbols and hollow circle symbols in FIG. 23A indicate the measurement results of healthy subjects and diabetic patients, respectively. Overall, it can be seen that the pulse pressure index value Pa and the pulse pressure have a positive correlation.
図23Bは、健常者及び糖尿病患者を区別することなく測定結果を示した散布図である。図23Bにおいて、回帰直線を破線で示す。図23Bに示した例では、決定係数R2が約0.47であった。相関係数は約0.69であり、脈圧指標値Paと脈圧との間に十分な相関関係があるといえる。このように、第1実施例による脈圧測定方法により、光電脈波センサを用いて脈圧を求めることができる。
FIG. 23B is a scatter diagram showing the measurement results without distinguishing between healthy subjects and diabetic patients. In FIG. 23B, the regression line is shown as a broken line. In the example shown in FIG. 23B, the coefficient of determination R 2 was approximately 0.47. The correlation coefficient is about 0.69, and it can be said that there is a sufficient correlation between the pulse pressure index value Pa and the pulse pressure. In this manner, the pulse pressure measurement method according to the first embodiment allows the pulse pressure to be determined using the photoplethysmographic sensor.
測定された脈波から、末梢血圧指標「1/VE0.5」と特徴量「ae時間」を求め、式(1)を用いて脈圧を計算することができる。なお、より多くの被験者を集めて評価実験を行い、フィッティングパラメータα、βの精度を高めてもよい。
From the measured pulse wave, the peripheral blood pressure index "1/VE0.5" and the feature quantity "ae time" are obtained, and the pulse pressure can be calculated using equation (1). Note that the accuracy of the fitting parameters α and β may be improved by collecting more subjects and performing an evaluation experiment.
図23A及び図23Bでは、緑色光を用いて末梢血圧指標「1/VE0.5」を求め、近赤外光を用いて特徴量「ae時間」を求めている。他の例として、近赤外光を用いて末梢血圧指標「1/VE0.5」を求めてもよいし、緑色光を用いて特徴量「ae時間」を求めてもよい。また、緑色光に代えて、青色から黄緑色までの波長の範囲の光を用いてもよい。
In FIGS. 23A and 23B, the peripheral blood pressure index "1/VE0.5" is determined using green light, and the feature amount "ae time" is determined using near-infrared light. As another example, the peripheral blood pressure index "1/VE0.5" may be determined using near-infrared light, or the feature amount "ae time" may be determined using green light. Further, instead of green light, light having a wavelength range from blue to yellow-green may be used.
末梢血圧指標「1/VE0.5」に代えて、脈波の立ち上がりの急峻度に関係する他の末梢血圧指標、例えば末梢血圧と正の相関関係を有する末梢血圧指標「a/S」または「(a-b)/(a-d)」を用いてもよい。また、特徴量「ae時間」自体の値に代えて、「ae時間」と正の相関関係を有する指標(本明細書において「ae時間指標」という。)を用いてもよい。また、式(1)に代えて、末梢血圧指標が大きくなると関数の値が小さくなり、ae時間指標が大きくなると関数の値が大きくなるような関数を用いてもよい。
Instead of the peripheral blood pressure index "1/VE0.5", another peripheral blood pressure index related to the steepness of the rise of the pulse wave, such as the peripheral blood pressure index "a/S" or " (ab)/(ad)" may also be used. Further, instead of the value of the feature quantity "ae time" itself, an index having a positive correlation with "ae time" (herein referred to as "ae time index") may be used. Furthermore, instead of formula (1), a function may be used in which the value of the function decreases as the peripheral blood pressure index increases, and the value of the function increases as the ae time index increases.
図23A及び図23Bに示した散布図のデータは、リングデバイス61(図4)を被験者の指元に装着して収集したが、被験者の指先に装着してもよい。
Although the data of the scatter diagrams shown in FIGS. 23A and 23B were collected by wearing the ring device 61 (FIG. 4) on the subject's fingertip, it may also be worn on the subject's fingertip.
[第1実施例の変形例]
次に、第1実施例の変形例について説明する。
第1実施例では、指輪型のリングデバイス61(図5)が指に装着されるが、リングデバイス61に代えて、指以外の他の部位に装着する形状のデバイスを用いてもよい。例えば、手首、首、顔、耳等に装着する形状のウェアラブルデバイスとしてもよい。例えば、ウェアラブルデバイスは、手首に装着するリストバンド型または腕時計型のものでもよいし、耳に装着するイヤホン型のものでもよいし、皮膚に貼付するパッチ型のものでもよいし、首に装着するネックバンド型のものでもよい。 [Modification of the first embodiment]
Next, a modification of the first embodiment will be described.
In the first embodiment, a ring-shaped ring device 61 (FIG. 5) is worn on the finger, but instead of thering device 61, a device shaped to be worn on a part other than the finger may be used. For example, it may be a wearable device that is worn on the wrist, neck, face, ear, or the like. For example, a wearable device may be a wristband or wristwatch type that is worn on the wrist, an earphone type that is worn in the ear, a patch type that is attached to the skin, or a wearable device that is worn around the neck. A neckband type one may also be used.
次に、第1実施例の変形例について説明する。
第1実施例では、指輪型のリングデバイス61(図5)が指に装着されるが、リングデバイス61に代えて、指以外の他の部位に装着する形状のデバイスを用いてもよい。例えば、手首、首、顔、耳等に装着する形状のウェアラブルデバイスとしてもよい。例えば、ウェアラブルデバイスは、手首に装着するリストバンド型または腕時計型のものでもよいし、耳に装着するイヤホン型のものでもよいし、皮膚に貼付するパッチ型のものでもよいし、首に装着するネックバンド型のものでもよい。 [Modification of the first embodiment]
Next, a modification of the first embodiment will be described.
In the first embodiment, a ring-shaped ring device 61 (FIG. 5) is worn on the finger, but instead of the
また、脈圧測定装置は、必ずしもウェアラブルである必要はなく、必要に応じて光電脈波センサ50に指を押し当てて脈波を測定するデバイスであってもよい。例えば、脈圧測定装置は、スマートフォンのような可搬型のデバイスであってもよいし、固定設置型のデバイスであってもよい。
Further, the pulse pressure measuring device does not necessarily have to be wearable, and may be a device that measures a pulse wave by pressing a finger against the photoplethysmographic sensor 50 as necessary. For example, the pulse pressure measuring device may be a portable device such as a smartphone, or a fixed device.
第1実施例では、指等の生体組織で反射された光を検出しているが、生体組織を透過した光を検出するようにしてもよい。指を透過した光を検出する場合は、発光素子と受光素子とが指を挟んで相互に対向して配置される。なお、発光素子と受光素子との位置関係によっては、生体組織で反射した光と、生体組織を透過した光との両方が、受光素子で検出される場合もある。すなわち、発光素子から出力されて、生体組織を経由した光を、受光素子が検出すればよい。
In the first embodiment, light reflected from living tissue such as a finger is detected, but light transmitted through living tissue may also be detected. When detecting light transmitted through a finger, a light emitting element and a light receiving element are placed facing each other with the finger in between. Note that depending on the positional relationship between the light emitting element and the light receiving element, both the light reflected by the living tissue and the light transmitted through the living tissue may be detected by the light receiving element. That is, the light receiving element may detect the light that is output from the light emitting element and passes through the biological tissue.
[第2実施例]
次に、図24A、図24B、及び図25を参照して、第2実施例による脈圧測定装置及び脈波測定方法について説明する。以下、第1実施例及びその変形例による脈圧測定装置及び脈波測定方法と共通の構成については説明を省略する。 [Second example]
Next, a pulse pressure measuring device and pulse wave measuring method according to a second embodiment will be described with reference to FIGS. 24A, 24B, and 25. Hereinafter, a description of the components common to the pulse pressure measuring device and the pulse wave measuring method according to the first embodiment and its modification will be omitted.
第1実施例では、式(1)に示したように、脈圧と相関関係を有する末梢血圧指標「1/VE0.5」と、特徴量「ae時間」とに基づいて脈圧を計算する。これに対して第2実施例では、末梢血圧指標「1/VE0.5」及び特徴量「ae時間」に加えて、特徴量「de時間」に基づいて脈圧を計算する。例えば、末梢血圧指標「1/VE0.5」のべき乗の値、特徴量「ae時間」のべき乗の値、及び特徴量「de時間」のべき乗の値を変数とする関数を用いて脈圧を計算する。
In the first embodiment, as shown in equation (1), pulse pressure is calculated based on a peripheral blood pressure index "1/VE0.5" that has a correlation with pulse pressure and a feature amount "ae time". . On the other hand, in the second embodiment, the pulse pressure is calculated based on the feature quantity "de time" in addition to the peripheral blood pressure index "1/VE0.5" and the feature quantity "ae time". For example, pulse pressure can be calculated using a function whose variables are the power of the peripheral blood pressure index "1/VE0.5", the power of the feature quantity "ae time", and the power of the feature quantity "de time". calculate.
次に、この関数について説明する。第2実施例では、以下の式で脈圧指標値Padを計算する。
Pad=(1/VE0.5)-α×(ae時間)β×(de時間)-γ・・・(2)
ここで、α、β、及びγは正のフィッティングパラメータである。実際の脈圧の値は、脈圧指標値Padに係数を乗じることにより計算することができる。フィッティングパラメータα、β、γ、及び係数は、実際に評価実験を行うことにより決定することができる。 Next, this function will be explained. In the second embodiment, the pulse pressure index value Pad is calculated using the following formula.
Pad = (1/VE0.5) -α × (ae time) β × (de time) -γ ... (2)
Here, α, β, and γ are positive fitting parameters. The actual pulse pressure value can be calculated by multiplying the pulse pressure index value Pad by a coefficient. The fitting parameters α, β, γ, and coefficients can be determined by actually conducting evaluation experiments.
図24Aは、式(2)のフィッティングパラメータα、β、及びγを、それぞれα=0.8、β=1.5、γ=0.5とした場合の測定結果の散布図である。横軸は脈圧を単位[mmHg]で表し、縦軸は脈圧指標値Padを表す。末梢血圧指標「1/VE0.5」は、緑色光を用いて測定した脈波から求め、特徴量「ae時間」及び「de時間」は、近赤外光を用いて測定した脈波から求めた。図24A中の黒丸記号及び中空丸記号は、それぞれ健常者及び糖尿病患者の測定結果を示す。全体として、脈圧指標値Padと脈圧とは、正の相関関係を有することがわかる。
FIG. 24A is a scatter diagram of the measurement results when the fitting parameters α, β, and γ of equation (2) are set to α=0.8, β=1.5, and γ=0.5, respectively. The horizontal axis represents pulse pressure in units [mmHg], and the vertical axis represents pulse pressure index value Pad. The peripheral blood pressure index "1/VE0.5" is obtained from the pulse wave measured using green light, and the feature quantities "ae time" and "de time" are obtained from the pulse wave measured using near-infrared light. Ta. The filled circle symbols and hollow circle symbols in FIG. 24A indicate the measurement results of healthy subjects and diabetic patients, respectively. Overall, it can be seen that the pulse pressure index value Pad and pulse pressure have a positive correlation.
図24Bは、健常者及び糖尿病患者を区別することなく測定結果を示した散布図である。図24Bにおいて、回帰直線を破線で示す。図24Bに示した例では、決定係数R2が約0.52であった。相関係数は約0.72であり、脈圧指標値Padと脈圧との間に強い相関関係があるといえる。このように、第2実施例による脈圧測定方法により、光電脈波センサを用いて脈圧を求めることができる。
FIG. 24B is a scatter diagram showing the measurement results without distinguishing between healthy subjects and diabetic patients. In FIG. 24B, the regression line is shown as a broken line. In the example shown in FIG. 24B, the coefficient of determination R 2 was approximately 0.52. The correlation coefficient is about 0.72, and it can be said that there is a strong correlation between the pulse pressure index value Pad and the pulse pressure. In this manner, the pulse pressure measurement method according to the second embodiment allows the pulse pressure to be determined using the photoplethysmographic sensor.
測定された脈波から、末梢血圧指標「1/VE0.5」、特徴量「ae時間」、及び特徴量「de時間」を求め、式(2)を用いて脈圧を計算することができる。なお、より多くの被験者を集めて評価実験を行い、フィッティングパラメータα、β、γの精度を高めてもよい。
From the measured pulse wave, the peripheral blood pressure index "1/VE0.5", the feature quantity "ae time", and the feature quantity "de time" are obtained, and the pulse pressure can be calculated using equation (2). . Note that the accuracy of the fitting parameters α, β, and γ may be improved by collecting more subjects and performing an evaluation experiment.
図24A及び図24Bでは、緑色光を用いて末梢血圧指標「1/VE0.5」を求め、近赤外光を用いて特徴量「ae時間」及び「de時間」を求めている。他の例として、近赤外光を用いて末梢血圧指標「1/VE0.5」を求めてもよいし、緑色光を用いて特徴量「ae時間」または「de時間」を求めてもよい。また、緑色光に代えて、青色から黄緑色までの波長の範囲の光を用いてもよい。
In FIGS. 24A and 24B, the peripheral blood pressure index "1/VE0.5" is determined using green light, and the feature quantities "ae time" and "de time" are determined using near-infrared light. As another example, the peripheral blood pressure index "1/VE0.5" may be obtained using near-infrared light, or the feature quantity "ae time" or "de time" may be obtained using green light. . Further, instead of green light, light having a wavelength range from blue to yellow-green may be used.
末梢血圧指標「1/VE0.5」に代えて、脈波の立ち上がりの急峻度に関係する他の末梢血圧指標、例えば末梢血圧と正の相関関係を有する末梢血圧指標「a/S」または「(a-b)/(a-d)」を用いてもよい。また、特徴量「ae時間」自体の値に代えて、「ae時間」と正の相関関係を有するae時間指標を用いてもよい。「de時間」自体の値に代えて、「de時間」と正の相関関係を有する指標(本明細書において「de時間指標」という。)を用いてもよい。また、式(2)に代えて、末梢血圧指標が大きくなると関数の値が小さくなり、ae時間指標が大きくなると関数の値が大きくなり、de時間指標が大きくなると関数の値が小さくなるような関数を用いてもよい。
Instead of the peripheral blood pressure index "1/VE0.5", another peripheral blood pressure index related to the steepness of the rise of the pulse wave, such as the peripheral blood pressure index "a/S" or " (ab)/(ad)" may also be used. Further, instead of the value of the feature quantity "ae time" itself, an ae time index having a positive correlation with "ae time" may be used. Instead of the value of "de time" itself, an index having a positive correlation with "de time" (herein referred to as "de time index") may be used. Alternatively, instead of formula (2), the value of the function decreases as the peripheral blood pressure index increases, the value of the function increases as the ae time index increases, and the value of the function decreases as the de time index increases. A function may also be used.
次に、図25を参照して、式(2)を用いて脈圧を求めることの他の優れた効果について説明する。
Next, with reference to FIG. 25, other excellent effects of determining pulse pressure using equation (2) will be explained.
図25は、1人の被験者について長期間に亘って測定した複数の測定結果の散布図である。なお、この被験者は健常者であり、図24A及び図24Bに示したデータを収集したときの被験者とは異なる。図25の横軸は脈圧を単位[mmHg]で表し、縦軸は脈圧指標値Padを表す。式(2)のフィッティングパラメータα、β、及びγは、図24A及び図24Bの場合と同一である。測定部位の高さを、へその高さ、胸の高さ、及び額の高さのそれぞれとほぼ一致させて脈波を測定する手順を1セットとし、20日間の間に24セットの測定を行った。測定時刻は、朝、昼、及び夕方とした。20日の間に、朝に9セットの測定を行い、昼に12セットの測定を行い、夕方に3セットの測定を行った。
FIG. 25 is a scatter diagram of multiple measurement results measured over a long period of time for one subject. Note that this subject is a healthy person and is different from the subject who collected the data shown in FIGS. 24A and 24B. The horizontal axis of FIG. 25 represents pulse pressure in units [mmHg], and the vertical axis represents pulse pressure index value Pad. The fitting parameters α, β, and γ in equation (2) are the same as in FIGS. 24A and 24B. One set consisted of measuring the pulse wave with the height of the measurement site approximately matching the navel height, chest height, and forehead height, and 24 sets of measurements were performed over a 20-day period. went. The measurement times were morning, noon, and evening. During 20 days, 9 sets of measurements were performed in the morning, 12 sets of measurements were performed in the afternoon, and 3 sets of measurements were performed in the evening.
測定の手順は、以下の通りである。
まず、へその高さで光電脈波センサにより脈波を測定し、次にへその高さで手首の血圧を測定する。その次に胸の高さで光電脈波センサにより脈波を測定し、次に胸の高さで手首の血圧を測定する。その次に額の高さで光電脈波センサにより脈波を測定し、最後に額の高さで手首の血圧を測定する。光電脈波センサによる脈波の測定と、手首の血圧の測定とは、同時には行わない。 The measurement procedure is as follows.
First, the pulse wave is measured using a photoplethysmographic sensor at the level of the navel, and then the blood pressure at the wrist is measured at the level of the navel. Next, the pulse wave is measured using a photoplethysmographic sensor at chest level, and then the blood pressure at the wrist is measured at chest level. Next, the pulse wave is measured using a photoplethysmographic sensor at the level of the forehead, and finally the blood pressure at the wrist is measured at the level of the forehead. The measurement of pulse waves by the photoplethysmographic sensor and the measurement of blood pressure at the wrist are not performed at the same time.
図25に示した散布図の丸記号、四角記号、及び三角記号は、それぞれ測定部位の高さを額の高さ、胸の高さ、及びへその高さに合わせて取得した測定結果を示す。図25に示した破線は、図24Bに示した回帰直線と同一のものである。図25からわかるように、脈圧はへその高さで相対的に大きくなり、額の高さで相対的に小さくなる傾向がみられる。
The circle symbol, square symbol, and triangle symbol in the scatter diagram shown in Figure 25 indicate the measurement results obtained by adjusting the height of the measurement site to the forehead height, chest height, and navel height, respectively. . The broken line shown in FIG. 25 is the same as the regression line shown in FIG. 24B. As can be seen from FIG. 25, the pulse pressure tends to be relatively large at the navel level and relatively small at the forehead level.
脈圧指標値Padは、へその高さ、胸の高さ、及び額の高さの間でばらついているが、測定部位の高さによらずほぼ同じ範囲に分布している。この分布は、図24Aに示した健常者の脈圧指標値Padの分布にほぼ重なることがわかる。したがって、式(2)を用いて計算される脈圧指標値Padは、測定部位の高さが心臓の高さからずれても、大きく変動することはないと推測できる。
The pulse pressure index value Pad varies among the navel height, chest height, and forehead height, but is distributed in almost the same range regardless of the height of the measurement site. It can be seen that this distribution almost overlaps with the distribution of the pulse pressure index value Pad of a healthy person shown in FIG. 24A. Therefore, it can be inferred that the pulse pressure index value Pad calculated using equation (2) will not vary greatly even if the height of the measurement site deviates from the height of the heart.
ユーザにとって有用なのは心臓の高さにおける脈圧の値である。ユーザの利便性を考慮すると、測定部位、例えば指の高さが心臓の高さからずれても、心臓の高さにおける脈圧の値を推定できることが望まれる。第2実施例で用いられる式(2)の脈圧指標値Padの計算式は、ユーザの利便性の観点からも有用である。
What is useful to the user is the value of the pulse pressure at heart level. Considering user convenience, it is desirable to be able to estimate the pulse pressure value at the heart level even if the height of the measurement site, such as a finger, deviates from the heart level. The calculation formula for the pulse pressure index value Pad of formula (2) used in the second embodiment is also useful from the viewpoint of user convenience.
[第3実施例]
次に、図26、図27、及び図28を参照して第3実施例による脈圧測定装置及び脈圧測定方法について説明する。以下、第1実施例または第2実施例による脈圧測定装置及び脈圧測定方法と共通の構成については説明を省略する。 [Third example]
Next, a pulse pressure measuring device and a pulse pressure measuring method according to a third embodiment will be described with reference to FIGS. 26, 27, and 28. Hereinafter, a description of the components common to the pulse pressure measuring device and the pulse pressure measuring method according to the first embodiment or the second embodiment will be omitted.
測定部位が心臓の高さより10cm高くなると、血圧は7mmHg以上8mmHg以下程度低くなる。すなわち、測定部位と心臓との高さの差が±10cmの範囲で変化すると、血圧の測定値に±8mmHg程度のばらつきが生じる。同様に、脈圧の測定値も、心臓から測定部位までの高さの影響を受ける。脈圧の測定値を医学的に有用なものとして利用するためには、測定部位の高さを、被験者の心臓の高さとほぼ同一にした状態で脈圧を測定することが好ましい。第3実施例による脈圧測定装置は、測定部位と心臓との高さの差を測定する機能を有する。
If the measurement site is 10 cm higher than the level of the heart, the blood pressure will decrease by about 7 mmHg or more and 8 mmHg or less. That is, if the difference in height between the measurement site and the heart changes within a range of ±10 cm, the blood pressure measurement value will vary by about ±8 mmHg. Similarly, pulse pressure measurements are also affected by the height of the measurement site from the heart. In order to utilize the measured value of pulse pressure as a medically useful value, it is preferable to measure pulse pressure with the height of the measurement site being approximately the same as the height of the subject's heart. The pulse pressure measuring device according to the third embodiment has a function of measuring the difference in height between the measurement site and the heart.
図26は、第3実施例による脈圧測定装置の斜視図及びブロック図である。第3実施例による脈圧測定装置は、図4に示した第1実施例の変形例による脈圧測定装置と同様に、リングデバイス61及び携帯端末62を含む。第3実施例による脈圧測定装置の携帯端末62は、第1実施例の変形例(図4)による脈圧測定装置の携帯端末62の構成に加えて、カメラ63、加速度センサ65、及び高さ計算部38を含む。高さ計算部38は、リングデバイス61とユーザの心臓との高さの差を計算する。
FIG. 26 is a perspective view and a block diagram of a pulse pressure measuring device according to a third embodiment. The pulse pressure measuring device according to the third embodiment includes a ring device 61 and a mobile terminal 62, similar to the pulse pressure measuring device according to the modification of the first embodiment shown in FIG. The mobile terminal 62 of the pulse pressure measuring device according to the third embodiment has, in addition to the configuration of the mobile terminal 62 of the pulse pressure measuring device according to the modification of the first embodiment (FIG. 4), a camera 63, an acceleration sensor 65, and a It includes a calculation unit 38. The height calculation unit 38 calculates the difference in height between the ring device 61 and the user's heart.
次に、図27を参照して高さ計算部38が行う手順について説明する。図27は、リングデバイス61と心臓との高さの差を測定する手順を説明するための模式図である。脈圧を測定したいユーザは、リングデバイス61を指に装着し、リングデバイス61を装着した方の手で携帯端末62を把持し、カメラ63で自分の顔を撮像する。携帯端末62の高さ計算部38(図26)は、撮像した画像を表示部37にリアルタイムに表示する。さらに、高さ計算部38は、表示部37に楕円形や長方形の図形を、ユーザの顔の映像に重ね合わせて表示する。ユーザは、表示部37を見ながら、自分の顔の画像が、楕円形または長方形の図形に収まるように、携帯端末62と自分の顔との相対位置を調整する。さらに、ユーザは、体幹部が鉛直方向に沿うように姿勢を維持する。
Next, the procedure performed by the height calculation unit 38 will be described with reference to FIG. 27. FIG. 27 is a schematic diagram for explaining the procedure for measuring the difference in height between the ring device 61 and the heart. A user who wants to measure pulse pressure wears the ring device 61 on his finger, grips the mobile terminal 62 with the hand on which he wears the ring device 61, and images his own face with the camera 63. The height calculation section 38 (FIG. 26) of the mobile terminal 62 displays the captured image on the display section 37 in real time. Furthermore, the height calculation unit 38 displays an oval or rectangular figure on the display unit 37, superimposed on the image of the user's face. While viewing the display unit 37, the user adjusts the relative position of the mobile terminal 62 and his or her face so that the image of his or her face fits within an oval or rectangular shape. Further, the user maintains a posture such that the trunk of the user's body is along the vertical direction.
高さ計算部38に、予めユーザの身長及び体重等の身体情報が記憶されている。さらに、身体情報と顔の大きさとの統計的な関係情報が、高さ計算部38に記憶されている。高さ計算部38は、記憶されている身体情報から、身体情報と顔の大きさとの統計的な関係情報を用いて、ユーザの顔の大きさを求める。求められた顔の大きさと、ユーザの顔の画像の大きさとから、携帯端末62からユーザの顔(例えば目)までの距離L1を計算する。
The height calculation unit 38 stores the user's physical information such as height and weight in advance. Furthermore, statistical relationship information between physical information and face size is stored in the height calculation section 38. The height calculation unit 38 calculates the size of the user's face from the stored physical information using statistical relationship information between the physical information and the facial size. A distance L1 from the mobile terminal 62 to the user's face (for example, eyes) is calculated from the determined face size and the size of the user's face image.
さらに、高さ計算部38は、加速度センサ65の測定結果から、鉛直方向(重力方向)に対する携帯端末62の傾きを計算する。携帯端末62の傾きと、携帯端末62からユーザの目までの距離L1に基づいて、携帯端末62からユーザの目までの高さH1を計算する。
Furthermore, the height calculation unit 38 calculates the inclination of the mobile terminal 62 with respect to the vertical direction (direction of gravity) from the measurement results of the acceleration sensor 65. The height H1 from the mobile terminal 62 to the user's eyes is calculated based on the inclination of the mobile terminal 62 and the distance L1 from the mobile terminal 62 to the user's eyes.
高さ計算部38は、ユーザの身体情報に基づいて、心臓から目までの高さH2を統計的に求める。ただし、前かがみなど体幹部を大きく曲げた姿勢では高さH2に誤差が生じる。ここでは、体幹部が傾いていないことを前提とする。例えば心臓から目までの高さH2として、「AIST 人体寸法データベース1991-1992」に含まれる内眼角高と乳頭高との差を用いることができる。
The height calculation unit 38 statistically calculates the height H2 from the heart to the eyes based on the user's physical information. However, an error occurs in the height H2 in a posture in which the trunk is greatly bent, such as when the user bends forward. Here, it is assumed that the trunk is not tilted. For example, as the height H2 from the heart to the eyes, the difference between the medial canthus height and the nipple height included in the "AIST human body size database 1991-1992" can be used.
高さ計算部38(図26)は、携帯端末62からユーザの目までの高さH1と、心臓から目までの高さH2とを用いて、携帯端末62と心臓との高さの差を計算する。リングデバイス61(測定部位)の高さは、携帯端末62の高さとほぼ等しいと仮定することができる。
The height calculation unit 38 (FIG. 26) uses the height H1 from the mobile terminal 62 to the user's eyes and the height H2 from the heart to the eyes to calculate the difference in height between the mobile terminal 62 and the heart. calculate. It can be assumed that the height of the ring device 61 (measurement site) is approximately equal to the height of the mobile terminal 62.
図28は、第3実施例による脈圧測定装置が実行する脈圧測定方法の手順を示すフローチャートである。
FIG. 28 is a flowchart showing the procedure of the pulse pressure measurement method executed by the pulse pressure measurement device according to the third embodiment.
高さ計算部38(図26)は、リングデバイス61と心臓との高さの差を計算する(ステップSA1)。この計算は、図27を参照して説明した方法により行うことができる。高さ計算部38は、リングデバイス61と心臓との差の計算値が許容範囲内か否かを判定する(ステップSA2)。差が許容範囲内であれば、測定された脈波に基づいて脈圧計算部35(図26)が脈圧を計算する(ステップSA3)。脈圧の計算には、第1実施例または第2実施例による脈圧測定方法を用いることができる。
The height calculation unit 38 (FIG. 26) calculates the difference in height between the ring device 61 and the heart (step SA1). This calculation can be performed by the method described with reference to FIG. The height calculation unit 38 determines whether the calculated value of the difference between the ring device 61 and the heart is within an allowable range (step SA2). If the difference is within the allowable range, the pulse pressure calculation unit 35 (FIG. 26) calculates the pulse pressure based on the measured pulse wave (step SA3). The pulse pressure measurement method according to the first embodiment or the second embodiment can be used to calculate the pulse pressure.
計算により脈圧の値(計算値)が求まると、制御部36は、脈圧の計算値を記憶するか、または出力する(ステップSA4)。脈圧の計算値は、例えば、測定日時と関連付けて記憶される。脈圧の計算値の出力は、例えば表示部37(図26)への表示、サーバへの送信等により実行される。なお、末梢血圧指標計算部33、脈波特徴量計算部34、脈圧計算部35(図4)の機能をサーバで実現するようにしてもよい。この構成を採用する場合には、サーバが脈圧を計算し、脈圧の計算値を記憶するとともに、携帯端末62(図4)に脈圧の計算値を送信する。
When the value of the pulse pressure (calculated value) is determined by calculation, the control unit 36 stores or outputs the calculated value of the pulse pressure (step SA4). The calculated value of pulse pressure is stored, for example, in association with the date and time of measurement. The calculated value of the pulse pressure is outputted, for example, by displaying it on the display unit 37 (FIG. 26), transmitting it to the server, etc. Note that the functions of the peripheral blood pressure index calculation section 33, the pulse wave feature amount calculation section 34, and the pulse pressure calculation section 35 (FIG. 4) may be realized by a server. When this configuration is adopted, the server calculates the pulse pressure, stores the calculated value of the pulse pressure, and transmits the calculated value of the pulse pressure to the mobile terminal 62 (FIG. 4).
ステップSA2で差が許容範囲から外れていると判定された場合は、高さ計算部38は、リングデバイス61と心臓との高さの差が許容範囲から外れていることをユーザに通知する(ステップSA5)。この通知を受けたユーザは、リングデバイス61の高さを心臓の高さに合わせるように、リングデバイス61の高さを調整して再測定を行うことができる。
If it is determined in step SA2 that the difference is outside the allowable range, the height calculation unit 38 notifies the user that the difference in height between the ring device 61 and the heart is outside the allowable range ( Step SA5). The user who receives this notification can adjust the height of the ring device 61 to match the height of the heart and perform re-measurement.
次に、第3実施例の優れた効果について説明する。
第3実施例では、測定部位の高さを心臓の高さに合わせて脈圧を測定することができる。このため、脈圧の測定精度を高めることができる。なお、ステップSA2で差が許容範囲から外れていると判定された場合にも脈圧を測定し、測定値の信頼性が高くないという注釈を付して脈圧の測定値を出力するようにしてもよい。 Next, the excellent effects of the third embodiment will be explained.
In the third embodiment, pulse pressure can be measured by adjusting the height of the measurement site to the height of the heart. Therefore, the accuracy of pulse pressure measurement can be improved. Note that even if it is determined in step SA2 that the difference is outside the allowable range, the pulse pressure is measured and the measured value of the pulse pressure is output with a note indicating that the reliability of the measured value is not high. It's okay.
次に、図29を参照して第3実施例の変形例について説明する。図29は、第3実施例の変形例による脈圧測定装置が実行する脈圧測定方法の手順を示すフローチャートである。まず、高さ計算部38は、第3実施例(図28)と同様に、リングデバイス61と心臓との高さの差を計算する(ステップSA1)。第1実施例では、差が許容範囲から外れている場合に、脈圧の測定を行わないが、本変形例では、差が許容範囲内か否かにかかわらず、測定された脈波に基づいて脈圧計算部35が脈圧を計算する(ステップSA3)。
Next, a modification of the third embodiment will be described with reference to FIG. 29. FIG. 29 is a flowchart showing the procedure of a pulse pressure measuring method executed by a pulse pressure measuring device according to a modification of the third embodiment. First, the height calculation unit 38 calculates the difference in height between the ring device 61 and the heart (step SA1), as in the third embodiment (FIG. 28). In the first embodiment, pulse pressure is not measured if the difference is outside the allowable range, but in this modification, the pulse pressure is measured based on the measured pulse wave regardless of whether the difference is within the allowable range. Then, the pulse pressure calculation unit 35 calculates the pulse pressure (step SA3).
次に、脈圧計算部35は、脈圧の計算値を、リングデバイス61と心臓との高さの差に基づいて補正する(ステップSA5)。リングデバイス61と心臓との高さの差と、脈圧との関係は、予め評価実験を行って決定しておくとよい。脈圧の計算値の補正を行った後、脈圧の補正値を記憶するか、または出力する(ステップSA6)。
Next, the pulse pressure calculation unit 35 corrects the calculated value of the pulse pressure based on the difference in height between the ring device 61 and the heart (step SA5). The relationship between the height difference between the ring device 61 and the heart and the pulse pressure may be determined in advance by conducting an evaluation experiment. After correcting the calculated value of pulse pressure, the corrected value of pulse pressure is stored or output (step SA6).
図29に示した変形例においては、測定部位の高さと心臓の高さと差が大きい場合でも、脈圧の計算値を補正することにより、精度の高い脈圧の値を求めることができる。
In the modification shown in FIG. 29, even if the difference between the height of the measurement site and the height of the heart is large, a highly accurate value of pulse pressure can be obtained by correcting the calculated value of pulse pressure.
[第4実施例]
次に、図30及び図31を参照して第4実施例による脈圧測定装置及び脈圧測定方法について説明する。以下、第1実施例または第2実施例による脈圧測定装置及び脈圧測定方法と共通の構成については説明を省略する。 [Fourth example]
Next, a pulse pressure measuring device and a pulse pressure measuring method according to a fourth embodiment will be described with reference to FIGS. 30 and 31. Hereinafter, a description of the components common to the pulse pressure measuring device and the pulse pressure measuring method according to the first embodiment or the second embodiment will be omitted.
運動時には、運動量に応じて血圧や脈圧が変化する。また、測定部位が動いているときは、血管中の血液に慣性力が作用するため、脈波の波形が変動する。医学的に有用なのは、安静状態で測定された血圧及び脈圧である。また、運動中は、光電脈波センサと皮膚との接触状態が変化しやすい。接触状態が変化すると、測定される脈波にノイズが重畳されてしまう。第4実施例では、ユーザが安静状態であるか否かを判定し、医学的に有用な安静状態における脈圧を測定する。
During exercise, blood pressure and pulse pressure change depending on the amount of exercise. Furthermore, when the measurement site is moving, inertial force acts on the blood in the blood vessels, so the waveform of the pulse wave fluctuates. Medically useful are blood pressure and pulse pressure measured in a resting state. Furthermore, during exercise, the contact state between the photoplethysmogram sensor and the skin tends to change. If the contact state changes, noise will be superimposed on the measured pulse wave. In the fourth embodiment, it is determined whether the user is in a resting state, and the medically useful pulse pressure in the resting state is measured.
図30は、第4実施例による脈圧測定装置の斜視図及びブロック図である。第4実施例による脈圧測定装置は、第1実施例の変形例による脈圧測定装置(図4)と同様に、リングデバイス61及び携帯端末62を含む。第4実施例による脈圧測定装置のリングデバイス61には、第1実施例の変形例による脈圧測定装置(図4)のリングデバイス61の構成に加えて、加速度センサ54が搭載されている。携帯端末62は、第1実施例の変形例による脈圧測定装置の携帯端末62の構成に加えて、安静状態判定部39を含む。
FIG. 30 is a perspective view and a block diagram of a pulse pressure measuring device according to a fourth embodiment. The pulse pressure measuring device according to the fourth embodiment includes a ring device 61 and a mobile terminal 62, similarly to the pulse pressure measuring device according to the modified example of the first embodiment (FIG. 4). The ring device 61 of the pulse pressure measuring device according to the fourth embodiment is equipped with an acceleration sensor 54 in addition to the configuration of the ring device 61 of the pulse pressure measuring device according to the modified example of the first embodiment (FIG. 4). . The mobile terminal 62 includes a resting state determining section 39 in addition to the configuration of the mobile terminal 62 of the pulse pressure measuring device according to the modification of the first embodiment.
安静状態判定部39は、加速度センサ54の測定結果を利用して、ユーザが安静状態か否かを判定する。例えば、加速度センサ54による加速度の測定値が判定閾値以下となる時間が所定時間、例えば5分間継続すると、安静状態判定部39は、ユーザは安静状態であると判定する。
The resting state determining unit 39 uses the measurement results of the acceleration sensor 54 to determine whether the user is in a resting state. For example, when the measured value of acceleration by the acceleration sensor 54 remains below the determination threshold for a predetermined period of time, for example, 5 minutes, the resting state determination unit 39 determines that the user is in a resting state.
図31は、第4実施例による脈圧測定装置が実行する脈圧測定方法の手順を示すフローチャートである。安静状態判定部39が、リングデバイス61を装着しているユーザが安静状態か否かを判定する(ステップSB1)。ユーザが安静状態でないと判定された場合は、ユーザが安静状態になるまで安静状態の判定を一定周期で繰り返し実行する(ステップSB2)。ユーザが安静状態であると判定された場合、そのときに取得された脈波に基づいて脈圧計算部35が脈圧を計算する(ステップSB3)。その後、脈圧の計算値を記憶するか、または出力する(ステップSB4)。
FIG. 31 is a flowchart showing the procedure of the pulse pressure measuring method executed by the pulse pressure measuring device according to the fourth embodiment. The resting state determination unit 39 determines whether the user wearing the ring device 61 is in a resting state (step SB1). When it is determined that the user is not in a resting state, determination of the resting state is repeatedly performed at a constant cycle until the user is in a resting state (step SB2). If it is determined that the user is in a resting state, the pulse pressure calculation unit 35 calculates the pulse pressure based on the pulse wave acquired at that time (step SB3). Thereafter, the calculated value of pulse pressure is stored or output (step SB4).
次に、第4実施例の優れた効果について説明する。
第4実施例では、ユーザが安静状態のときの脈波に基づいて脈圧を計算するため、脈圧の計算値の精度を高めることができる。 Next, the excellent effects of the fourth embodiment will be explained.
In the fourth embodiment, since the pulse pressure is calculated based on the pulse wave when the user is in a resting state, the accuracy of the calculated value of the pulse pressure can be improved.
次に、第4実施例の変形例について説明する。第4実施例では、リングデバイス61に搭載された加速度センサ54による加速度の測定値に基づいて、安静状態か否かを判定している。加速度センサ54に代えてジャイロセンサを搭載し、ジャイロセンサによる角加速度の測定値に基づいて、安静状態か否かを判定してもよい。さらに、加速度センサ54とジャイロセンサとを併用して、安静状態か否かを判定してもよい。
Next, a modification of the fourth embodiment will be described. In the fourth embodiment, it is determined whether or not the ring device 61 is in a resting state based on the measured value of acceleration by the acceleration sensor 54 mounted on the ring device 61. A gyro sensor may be installed in place of the acceleration sensor 54, and whether or not the vehicle is in a resting state may be determined based on the angular acceleration measured by the gyro sensor. Furthermore, the acceleration sensor 54 and the gyro sensor may be used together to determine whether or not the person is in a resting state.
[第5実施例]
次に、図32及び図33を参照して第5実施例による脈圧測定装置及び脈圧測定方法について説明する。以下、第1実施例または第2実施例による脈圧測定装置及び脈圧測定方法と共通の構成については説明を省略する。 [Fifth example]
Next, a pulse pressure measuring device and a pulse pressure measuring method according to a fifth embodiment will be described with reference to FIGS. 32 and 33. Hereinafter, a description of the components common to the pulse pressure measuring device and the pulse pressure measuring method according to the first embodiment or the second embodiment will be omitted.
図32は、第5実施例による脈圧測定装置の斜視図及びブロック図である。第5実施例による脈圧測定装置は、第1実施例の変形例による脈圧測定装置(図4)と同様に、リングデバイス61及び携帯端末62を含む。第5実施例による脈圧測定装置のリングデバイス61には、第4実施例による脈圧測定装置のリングデバイス61(図30)と同様に、加速度センサ54が搭載されている。携帯端末62は、第1実施例の変形例による脈圧測定装置の携帯端末62の構成に加えて、睡眠状態判定部40を含む。
FIG. 32 is a perspective view and a block diagram of a pulse pressure measuring device according to a fifth embodiment. The pulse pressure measuring device according to the fifth embodiment includes a ring device 61 and a mobile terminal 62, similarly to the pulse pressure measuring device according to the modified example of the first embodiment (FIG. 4). The ring device 61 of the pulse pressure measuring device according to the fifth embodiment is equipped with an acceleration sensor 54, similar to the ring device 61 (FIG. 30) of the pulse pressure measuring device according to the fourth embodiment. The mobile terminal 62 includes a sleep state determining section 40 in addition to the configuration of the mobile terminal 62 of the pulse pressure measuring device according to the modification of the first embodiment.
睡眠状態判定部40は、加速度センサ54の測定結果を利用して、ユーザが安静状態か否かを判定する。以下、ユーザが睡眠状態であるか覚醒状態であるか否かを判定する方法について説明する。
The sleep state determining unit 40 uses the measurement results of the acceleration sensor 54 to determine whether the user is in a resting state. A method for determining whether a user is in a sleeping state or in an awake state will be described below.
睡眠状態判定部40は、例えば加速度センサ54による加速度の測定値が所定の閾値以上になった場合に、体動が発生していると判定する。所定の時間内の体動の発生数が所定の閾値以下である場合に、睡眠状態であると判定する。所定の時間は、例えば15分間以上90分間以下の範囲から選択するとよい。睡眠中でも寝返り等により急に加速度が上昇することはあるが、覚醒時に比べてその頻度は低いため、所定の時間内の体動の発生数により、睡眠状態か否かを精度よく判定することができる。指は、腰、胸、手首等に比べて覚醒時に動く頻度が高い。この特性を利用して、リングデバイス61を指に装着することにより、手首等の他の部位に光電脈波センサを装着する場合と比べて、精度よく睡眠状態か否かの判定を行うことができる。
The sleep state determining unit 40 determines that body movement is occurring, for example, when the measured value of acceleration by the acceleration sensor 54 exceeds a predetermined threshold. When the number of occurrences of body movements within a predetermined time is less than or equal to a predetermined threshold, it is determined that the subject is in a sleeping state. The predetermined time may be selected, for example, from a range of 15 minutes or more and 90 minutes or less. Even during sleep, acceleration may suddenly increase due to things like turning over in bed, but this happens less frequently than when awake, so it is not possible to accurately determine whether or not a person is in a sleeping state based on the number of body movements that occur within a given period of time. can. The fingers move more frequently when awake than the hips, chest, wrists, etc. Utilizing this characteristic, by wearing the ring device 61 on your finger, it is possible to determine whether or not you are in a sleep state with higher accuracy than when you wear a photoplethysmographic sensor on other parts such as your wrist. can.
図33は、第5実施例による脈圧測定装置が実行する脈圧測定方法の手順を示すフローチャートである。睡眠状態判定部40(図32)が、リングデバイス61を装着したユーザが睡眠状態であるか覚醒状態であるか否かを判定する(ステップSC1)。睡眠状態ではないと判定された場合は、一定周期で睡眠状態であるか覚醒状態であるかの判定を繰り返す(ステップSC2)。
FIG. 33 is a flowchart showing the procedure of the pulse pressure measuring method executed by the pulse pressure measuring device according to the fifth embodiment. The sleep state determination unit 40 (FIG. 32) determines whether the user wearing the ring device 61 is in a sleep state or an awake state (step SC1). If it is determined that the patient is not in a sleeping state, the determination as to whether the patient is in a sleeping state or in an awake state is repeated at regular intervals (step SC2).
睡眠状態であると判定されたら、脈波測定部32(図4)が脈波を測定し、脈圧計算部35(図4)が脈圧を計算する(ステップSC3)。なお、睡眠状態であると判定された後、さらに図31に示したステップSB1と同様に、安静状態か否かを判定し、安静状態と判定された場合にのみ脈波を測定し、脈圧を計算するようにしてもよい。脈圧の計算値が求まったら、制御部36が、脈圧の計算値を記憶するか、または出力する(ステップSC4)。
If it is determined that the person is in a sleeping state, the pulse wave measurement unit 32 (FIG. 4) measures the pulse wave, and the pulse pressure calculation unit 35 (FIG. 4) calculates the pulse pressure (step SC3). Note that after it is determined that the person is in a sleeping state, it is further determined whether or not the person is in a resting state, similarly to step SB1 shown in FIG. may be calculated. Once the calculated value of pulse pressure is determined, the control unit 36 stores or outputs the calculated value of pulse pressure (step SC4).
次に、第5実施例の優れた効果について説明する。
第5実施例では、睡眠状態のときの脈圧を自動で求めることができる。睡眠状態でないと判定された場合は、脈波の測定を行わないため、バッテリの消費量を削減することができる。 Next, the excellent effects of the fifth embodiment will be explained.
In the fifth embodiment, pulse pressure during a sleeping state can be automatically determined. If it is determined that the patient is not in a sleeping state, the pulse wave is not measured, so battery consumption can be reduced.
食事、飲酒、カフェイン摂取、喫煙等は、血圧や脈圧に影響することが知られている。また、運動、歩行、身体を動かす作業(例えば掃除等)、入浴、会話、精神的緊張、騒音や振動のある環境、寒い環境等も、血圧や脈圧に影響する。覚醒時にはこれらのイベントが頻繁に起こり、脈波を測定したタイミングが、これらのイベントと重なっているか否かを判定することは困難である。睡眠中は、これらのイベントの影響が低減されるため、睡眠状態で脈圧を測定することにより、安定した測定を行うことができる。
It is known that eating, drinking, caffeine intake, smoking, etc. affect blood pressure and pulse pressure. Additionally, exercise, walking, physical work (such as cleaning), bathing, conversation, mental tension, environments with noise or vibration, cold environments, etc. also affect blood pressure and pulse pressure. These events frequently occur during wakefulness, and it is difficult to determine whether the timing at which the pulse wave is measured overlaps with these events. During sleep, the influence of these events is reduced, so by measuring pulse pressure in a sleeping state, stable measurements can be made.
次に、第5実施例の変形例について説明する。
第5実施例では、体動の発生頻度に基づいて睡眠状態か否かを判定するが、その他の方法で睡眠状態か否かを判定してもよい。睡眠中は手指の温度が上昇することが知られている。リングデバイス61(図32)に温度センサを搭載し、温度センサの測定値からサーカディアンリズムを推定し、体動の発生頻度に温度の測定値を組み合わせて睡眠状態か否かを判定するようにしてもよい。 Next, a modification of the fifth embodiment will be described.
In the fifth embodiment, whether or not the person is in a sleeping state is determined based on the frequency of occurrence of body movements, but it may be determined whether or not the person is in a sleeping state using other methods. It is known that the temperature of your hands and fingers increases during sleep. A temperature sensor is mounted on the ring device 61 (Fig. 32), and the circadian rhythm is estimated from the measured value of the temperature sensor, and the temperature measured value is combined with the frequency of body movements to determine whether or not the patient is in a sleep state. Good too.
また、睡眠中は覚醒時と比べて脈拍数が低下する傾向がある。さらに、脈拍数に呼吸性変動がのりやすくなる。この特性を利用して、体動の頻度に脈拍数の変動の傾向を加えて、睡眠状態か否かを判定するようにしてもよい。
Also, during sleep, the pulse rate tends to decrease compared to when awake. Furthermore, respiratory fluctuations are more likely to occur in the pulse rate. Utilizing this characteristic, it may be determined whether or not the person is in a sleeping state by adding the tendency of fluctuations in pulse rate to the frequency of body movements.
第5実施例では、体動の発生頻度に基づいて、睡眠状態か否かの判定を行っている。第5実施例の一変形例として、体動の発生頻度が一定頻度より少なくなってきたら脈波の測定を開始し、体動の発生頻度と、測定された脈波とに基づいて睡眠状態か否かを判定するようにしてもよい。睡眠状態か否かの判定に、脈波を付加的に用いることにより、睡眠状態か否かの判定精度を高めることができる。
In the fifth embodiment, it is determined whether or not the person is in a sleeping state based on the frequency of occurrence of body movements. As a modified example of the fifth embodiment, pulse wave measurement is started when the frequency of body movements becomes less than a certain frequency, and whether the sleep state is determined based on the frequency of body movements and the measured pulse wave. It may be determined whether or not. By additionally using pulse waves to determine whether a person is in a sleeping state, it is possible to improve the accuracy of determining whether a person is in a sleeping state.
第5実施例では、覚醒状態と判定された場合には脈波の測定を行わないが、バッテリ容量が十分大きい場合には、睡眠状態の場合及び覚醒状態の場合の両方で、脈波の測定及び脈圧の計算を行ってもよい。この場合には、覚醒状態か睡眠状態かを区別する識別情報に関連付けて、脈圧の計算値を記憶するとよい。これにより、覚醒状態のときの脚圧と、睡眠状態のときの脈圧との傾向の違いを知ることができる。
In the fifth embodiment, the pulse wave is not measured when the awake state is determined, but if the battery capacity is sufficiently large, the pulse wave is measured both in the sleeping state and in the awake state. and pulse pressure may be calculated. In this case, it is preferable to store the calculated value of the pulse pressure in association with identification information that distinguishes between the awake state and the sleeping state. This makes it possible to know the difference in tendency between the leg pressure in the awake state and the pulse pressure in the sleeping state.
上述の各実施例は例示であり、異なる実施例で示した構成の部分的な置換または組み合わせが可能であることは言うまでもない。複数の実施例の同様の構成による同様の作用効果については実施例ごとには逐次言及しない。さらに、本発明は上述の実施例に制限されるものではない。例えば、種々の変更、改良、組み合わせ等が可能なことは当業者に自明であろう。
It goes without saying that each of the above-mentioned embodiments is merely an illustration, and that the configurations shown in the different embodiments can be partially replaced or combined. Similar effects due to similar configurations in a plurality of embodiments will not be mentioned for each embodiment. Furthermore, the invention is not limited to the embodiments described above. For example, it will be obvious to those skilled in the art that various changes, improvements, combinations, etc. are possible.
30 処理装置
31 発光制御部
32 脈波測定部
33 末梢血圧指標計算部
34 脈波特徴量計算部
35 脈圧計算部
36 制御部
37 表示部
38 高さ計算部
39 安静状態判定部
40 睡眠状態判定部
50 光電脈波センサ
51、52 発光素子
53 受光素子
54 加速度センサ
55 通信部
56 ジャイロセンサ
60 装着部材
61 リングデバイス
62 携帯端末
63 カメラ
64 通信部
65 加速度センサ
70 ユーザの体表面
71 表皮領域
72 細動脈
73 毛細血管
30Processing device 31 Light emission control section 32 Pulse wave measurement section 33 Peripheral blood pressure index calculation section 34 Pulse wave feature amount calculation section 35 Pulse pressure calculation section 36 Control section 37 Display section 38 Height calculation section 39 Resting state determination section 40 Sleep state determination Part 50 Photoplethysmographic sensor 51, 52 Light emitting element 53 Light receiving element 54 Acceleration sensor 55 Communication part 56 Gyro sensor 60 Mounting member 61 Ring device 62 Mobile terminal 63 Camera 64 Communication part 65 Acceleration sensor 70 User's body surface 71 Epidermal area 72 Fine Artery 73 Capillary
31 発光制御部
32 脈波測定部
33 末梢血圧指標計算部
34 脈波特徴量計算部
35 脈圧計算部
36 制御部
37 表示部
38 高さ計算部
39 安静状態判定部
40 睡眠状態判定部
50 光電脈波センサ
51、52 発光素子
53 受光素子
54 加速度センサ
55 通信部
56 ジャイロセンサ
60 装着部材
61 リングデバイス
62 携帯端末
63 カメラ
64 通信部
65 加速度センサ
70 ユーザの体表面
71 表皮領域
72 細動脈
73 毛細血管
30
Claims (21)
- ユーザに装着された脈波センサで測定された脈波信号の立ち上がりの急峻度に関係する末梢血圧指標を計算する末梢血圧指標計算部と、
前記脈波信号の波形を2階微分して得られる加速度脈波のa波のピークからe波のピークまでの経過時間に関する情報を含むae時間指標を計算する脈波特徴量計算部と、
前記末梢血圧指標と前記ae時間指標とに基づいて、脈圧を計算する脈圧計算部と
を備えた脈圧測定装置。 a peripheral blood pressure index calculation unit that calculates a peripheral blood pressure index related to the steepness of the rise of a pulse wave signal measured by a pulse wave sensor worn by the user;
a pulse wave feature calculation unit that calculates an ae time index that includes information regarding the elapsed time from the peak of the a wave to the peak of the e wave of the accelerated pulse wave obtained by second-order differentiation of the waveform of the pulse wave signal;
A pulse pressure measuring device comprising: a pulse pressure calculation section that calculates pulse pressure based on the peripheral blood pressure index and the ae time index. - 前記脈波特徴量計算部は、前記加速度脈波のd波のピークからe波のピークまでの経過時間に関する情報を含むde時間指標を計算する機能を、さらに備え、
前記脈圧計算部は、前記末梢血圧指標、前記ae時間指標、及び前記de時間指標に基づいて、脈圧を計算する請求項1に記載の脈圧測定装置。 The pulse wave feature calculation unit further includes a function of calculating a de time index including information regarding the elapsed time from the peak of the d wave to the peak of the e wave of the accelerated pulse wave,
The pulse pressure measuring device according to claim 1, wherein the pulse pressure calculation unit calculates the pulse pressure based on the peripheral blood pressure index, the ae time index, and the de time index. - 前記脈波センサは、ユーザの末梢の毛細血管の血圧の変動が前記脈波信号に反映されるように構成されている請求項1または2に記載の脈圧測定装置。 3. The pulse pressure measurement device according to claim 1, wherein the pulse wave sensor is configured such that fluctuations in blood pressure in peripheral capillaries of the user are reflected in the pulse wave signal.
- 前記脈波センサは、青色から黄緑色までの波長域に含まれる波長の光を用いた光電脈波センサである請求項3に記載の脈圧測定装置。 4. The pulse pressure measuring device according to claim 3, wherein the pulse wave sensor is a photoelectric pulse wave sensor that uses light with a wavelength included in a wavelength range from blue to yellow-green.
- 前記脈波センサは、
青色から黄緑色までの波長域に含まれる波長の光を出力する第1発光素子と、
前記第1発光素子から出力されて、生体組織を経由した光を受光する第1受光素子と
を含み、
前記第1発光素子と前記第1受光素子との間隔が1mm以上3mm以下である請求項4に記載の脈圧測定装置。 The pulse wave sensor is
a first light emitting element that outputs light with a wavelength included in a wavelength range from blue to yellow-green;
a first light-receiving element that receives the light output from the first light-emitting element and passes through biological tissue;
The pulse pressure measuring device according to claim 4, wherein a distance between the first light emitting element and the first light receiving element is 1 mm or more and 3 mm or less. - 前記脈波センサは、ユーザの末梢の細動脈の血圧の変動が前記脈波信号に反映されるように構成されている請求項1乃至5のいずれか1項に記載の脈圧測定装置。 The pulse pressure measurement device according to any one of claims 1 to 5, wherein the pulse wave sensor is configured so that fluctuations in blood pressure in peripheral arterioles of the user are reflected in the pulse wave signal.
- 前記脈波センサは、赤色から近赤外までの波長域に含まれる波長の光を用いた光電脈波センサである請求項6に記載の脈圧測定装置。 The pulse pressure measuring device according to claim 6, wherein the pulse wave sensor is a photoelectric pulse wave sensor that uses light with a wavelength included in a wavelength range from red to near infrared.
- 前記脈波センサは、
青色から黄緑色までの波長域に含まれる波長の光を出力する第2発光素子と、
前記第2発光素子から出力されて、生体組織を経由した光を受光する第2受光素子と
を含み、
前記第2発光素子と前記第2受光素子との間隔が5mm以上20mm以下である請求項7に記載の脈圧測定装置。 The pulse wave sensor is
a second light emitting element that outputs light with a wavelength included in a wavelength range from blue to yellow-green;
a second light-receiving element that receives the light output from the second light-emitting element and passes through biological tissue;
The pulse pressure measuring device according to claim 7, wherein a distance between the second light emitting element and the second light receiving element is 5 mm or more and 20 mm or less. - 前記脈波センサは、ユーザの指に装着される装着部材を備えており、ユーザの指に向かって光を放射し、指の生体組織を経由した光の強度に基づいて前記脈波信号を生成する請求項1乃至8のいずれか1項に記載の脈圧測定装置。 The pulse wave sensor includes an attachment member that is attached to a user's finger, emits light toward the user's finger, and generates the pulse wave signal based on the intensity of the light that has passed through the biological tissue of the finger. The pulse pressure measuring device according to any one of claims 1 to 8.
- 前記脈圧計算部は、前記末梢血圧指標のべき乗の値、及び前記ae時間指標のべき乗の値を変数とする関数の値を計算することにより、脈圧を求める請求項1乃至9のいずれか1項に記載の脈圧測定装置。 10. The pulse pressure calculation unit calculates the pulse pressure by calculating the value of a function whose variables are a value of the power of the peripheral blood pressure index and a value of the power of the ae time index. The pulse pressure measuring device according to item 1.
- 前記末梢血圧指標は、末梢血圧と正の相関を有しており、前記ae時間指標は、前記加速度脈波のa波のピークからe波のピークまでの経過時間と正の相関を有しており、前記関数の値は、前記末梢血圧指標が大きくなると小さくなり、前記ae時間指標が大きくなると大きくなる請求項10に記載の脈圧測定装置。 The peripheral blood pressure index has a positive correlation with peripheral blood pressure, and the ae time index has a positive correlation with the elapsed time from the peak of the a wave to the peak of the e wave of the accelerated pulse wave. The pulse pressure measuring device according to claim 10, wherein the value of the function becomes smaller as the peripheral blood pressure index becomes larger, and becomes larger as the ae time index becomes larger.
- 前記脈波センサとユーザの心臓との高さの差を求め、高さの差が許容範囲を超えているとき、ユーザに通知する高さ計算部を、さらに備えた請求項1乃至11のいずれか1項に記載の脈圧測定装置。 12. Any one of claims 1 to 11, further comprising a height calculation unit that calculates a height difference between the pulse wave sensor and the user's heart, and notifies the user when the height difference exceeds an allowable range. The pulse pressure measuring device according to item 1.
- 前記脈波センサとユーザの心臓との高さの差を求める高さ計算部を、さらに備え、
前記脈圧計算部は、計算して得られた脈圧の値を、前記高さ計算部で測定された高さ方向の差に応じて補正する請求項1乃至11のいずれか1項に記載の脈圧測定装置。 further comprising a height calculation unit that calculates a height difference between the pulse wave sensor and the user's heart,
12. The pulse pressure calculation section corrects the calculated pulse pressure value according to the difference in the height direction measured by the height calculation section. Pulse pressure measuring device. - 前記末梢血圧指標計算部は、前記脈波信号の波形を1階微分して得られる速度脈波の波形の1拍内の最初に現れるピークの幅に関する情報に基づいて、前記末梢血圧指標を計算する請求項1乃至13のいずれか1項に記載の脈圧測定装置。 The peripheral blood pressure index calculation unit calculates the peripheral blood pressure index based on information regarding the width of the first peak appearing within one beat of the velocity pulse wave waveform obtained by first-order differentiation of the waveform of the pulse wave signal. The pulse pressure measuring device according to any one of claims 1 to 13.
- 前記末梢血圧指標計算部は、前記加速度脈波のa波のピーク値と前記脈波信号の振幅とに関する情報に基づいて、前記末梢血圧指標を計算する請求項1乃至13のいずれか1項に記載の脈圧測定装置。 14. The peripheral blood pressure index calculation unit calculates the peripheral blood pressure index based on information regarding the peak value of the a wave of the accelerated pulse wave and the amplitude of the pulse wave signal. The pulse pressure measuring device described.
- 前記末梢血圧指標計算部は、前記加速度脈波のa波のピーク値とb波のピーク値との差と、a波のピーク値とd波のピーク値との差とに関する情報に基づいて、前記末梢血圧指標を計算する請求項1乃至13のいずれか1項に記載の脈圧測定装置。 The peripheral blood pressure index calculation unit, based on information regarding the difference between the peak value of the a wave and the peak value of the b wave of the accelerated pulse wave, and the difference between the peak value of the a wave and the peak value of the d wave, The pulse pressure measuring device according to any one of claims 1 to 13, which calculates the peripheral blood pressure index.
- ユーザが安静状態か否かを判定する安静状態判定部を、さらに備えており、
前記脈圧計算部は、前記安静状態判定部によってユーザが安静状態であると判定されたときに取得された脈波から脈圧を計算する請求項1乃至16のいずれか1項に記載の脈圧測定装置。 The user further includes a resting state determination unit that determines whether the user is in a resting state,
The pulse pressure calculation unit according to any one of claims 1 to 16, wherein the pulse pressure calculation unit calculates the pulse pressure from a pulse wave acquired when the resting state determination unit determines that the user is in a resting state. Pressure measuring device. - ユーザが睡眠状態であるか否かを判定する睡眠状態判定部を、さらに備えており、
前記脈圧計算部は、前記睡眠状態判定部によってユーザが睡眠状態であると判定されたときに取得された脈波から脈圧を計算し、ユーザが睡眠状態ではないと判定されたときには脈圧の計算を行わない請求項1乃至17のいずれか1項に記載の脈圧測定装置。 The device further includes a sleep state determination unit that determines whether the user is in a sleep state,
The pulse pressure calculation unit calculates pulse pressure from the pulse wave obtained when the sleep state determination unit determines that the user is in a sleeping state, and calculates the pulse pressure when it is determined that the user is not in a sleep state. The pulse pressure measuring device according to any one of claims 1 to 17, which does not calculate. - ユーザに装着した脈波センサで脈波信号を取得し、
脈圧測定装置が、前記脈波信号の立ち上がりの急峻度に関係する末梢血圧指標を計算し、
前記脈圧測定装置が、前記脈波信号の波形を2階微分して得られる加速度脈波のa波のピークからe波のピークまでの経過時間に関する情報を含むae時間指標を計算し、
前記脈圧測定装置が、前記末梢血圧指標と前記ae時間指標とに基づいて、脈圧を求める脈圧測定方法。 A pulse wave sensor attached to the user acquires a pulse wave signal,
a pulse pressure measuring device calculates a peripheral blood pressure index related to the steepness of the rise of the pulse wave signal;
The pulse pressure measurement device calculates an ae time index that includes information regarding the elapsed time from the peak of the a wave to the peak of the e wave of the accelerated pulse wave obtained by second-order differentiation of the waveform of the pulse wave signal,
A pulse pressure measuring method, wherein the pulse pressure measuring device calculates pulse pressure based on the peripheral blood pressure index and the ae time index. - 前記脈波信号を取得する際に、前記脈波信号に、ユーザの末梢の毛細血管の血圧の変動が反映されるように取得する請求項19に記載の脈圧測定方法。 20. The pulse pressure measuring method according to claim 19, wherein when acquiring the pulse wave signal, the pulse wave signal is acquired so as to reflect fluctuations in blood pressure in peripheral capillaries of the user.
- 前記脈波信号を取得する際に、前記脈波信号に、ユーザの末梢の細動脈の血圧の変動が反映されるように取得する請求項19または20に記載の脈圧測定方法。
21. The pulse pressure measuring method according to claim 19, wherein when acquiring the pulse wave signal, the pulse wave signal is acquired so that fluctuations in blood pressure in peripheral arterioles of the user are reflected in the pulse wave signal.
Applications Claiming Priority (2)
| Application Number | Priority Date | Filing Date | Title |
|---|---|---|---|
| JP2022-128681 | 2022-08-12 | ||
| JP2022128681 | 2022-08-12 |
Publications (1)
| Publication Number | Publication Date |
|---|---|
| WO2024034305A1 true WO2024034305A1 (en) | 2024-02-15 |
Family
ID=89851417
Family Applications (1)
| Application Number | Title | Priority Date | Filing Date |
|---|---|---|---|
| PCT/JP2023/025307 WO2024034305A1 (en) | 2022-08-12 | 2023-07-07 | Pulse pressure measurement device and pulse pressure measurement method |
Country Status (1)
| Country | Link |
|---|---|
| WO (1) | WO2024034305A1 (en) |
Citations (4)
| Publication number | Priority date | Publication date | Assignee | Title |
|---|---|---|---|---|
| JPH1189806A (en) * | 1997-09-18 | 1999-04-06 | Matsushita Electric Ind Co Ltd | Bloodless sphygmomanometer |
| JP2006006897A (en) * | 2004-05-21 | 2006-01-12 | Sony Corp | Method and apparatus for measurement of blood pressure |
| JP2018130319A (en) * | 2017-02-15 | 2018-08-23 | 国立大学法人 東京大学 | Blood pressure measuring device, blood pressure measuring method, and blood pressure measuring program |
| US20220233079A1 (en) * | 2021-01-25 | 2022-07-28 | Samsung Electronics Co., Ltd. | Apparatus and method for estimating blood pressure |
-
2023
- 2023-07-07 WO PCT/JP2023/025307 patent/WO2024034305A1/en unknown
Patent Citations (4)
| Publication number | Priority date | Publication date | Assignee | Title |
|---|---|---|---|---|
| JPH1189806A (en) * | 1997-09-18 | 1999-04-06 | Matsushita Electric Ind Co Ltd | Bloodless sphygmomanometer |
| JP2006006897A (en) * | 2004-05-21 | 2006-01-12 | Sony Corp | Method and apparatus for measurement of blood pressure |
| JP2018130319A (en) * | 2017-02-15 | 2018-08-23 | 国立大学法人 東京大学 | Blood pressure measuring device, blood pressure measuring method, and blood pressure measuring program |
| US20220233079A1 (en) * | 2021-01-25 | 2022-07-28 | Samsung Electronics Co., Ltd. | Apparatus and method for estimating blood pressure |
Non-Patent Citations (2)
| Title |
|---|
| NATARAJAN KEERTHANA, BLOCK ROBERT C., YAVARIMANESH MOHAMMAD, CHANDRASEKHAR ANAND, MESTHA LALIT K., INAN OMER T., HAHN JIN-OH, MUKK: "Photoplethysmography Fast Upstroke Time Intervals Can Be Useful Features for Cuff-Less Measurement of Blood Pressure Changes in Humans", IEEE TRANSACTIONS ON BIOMEDICAL ENGINEERING, IEEE, USA, vol. 69, no. 1, 1 January 2022 (2022-01-01), USA, pages 53 - 62, XP093139920, ISSN: 0018-9294, DOI: 10.1109/TBME.2021.3087105 * |
| OMATA, KUMIKO ET AL.: "Effects of hand skin temperature and blood pressure against accelerated pulse waves and pulse wave velocity", JOURNAL OF CLINICAL PHYSIOLOGY, vol. 46, no. 2, 1 May 2016 (2016-05-01), pages 99 - 100 * |
Similar Documents
| Publication | Publication Date | Title |
|---|---|---|
| JP6672489B2 (en) | Personal health data collection | |
| US20210315524A1 (en) | Chest-based physiological monitor | |
| JP6662459B2 (en) | Blood pressure measurement device | |
| US20150366469A1 (en) | System for measurement of cardiovascular health | |
| EP3030145B1 (en) | Monitoring system and method for monitoring the hemodynamic status of a subject | |
| TWI623298B (en) | Wearable physiological measurement device | |
| CN105342591B (en) | For measuring the body worn system of continuous non-invasive blood pressure (cNIBP) | |
| US7641614B2 (en) | Wearable blood pressure sensor and method of calibration | |
| IL259841A (en) | Observational heart failure monitoring system | |
| US20160081563A1 (en) | Systems and methods to estimate or measure hemodynamic output and/or related cardiac output | |
| JP2018501016A (en) | Wearable hemodynamic sensor | |
| US20190008396A1 (en) | Concave optical sensors | |
| WO2014022906A1 (en) | Mobile device system for measurement of cardiovascular health | |
| JPWO2018043638A1 (en) | Blood pressure estimation device | |
| WO2013165474A1 (en) | Continuously wearable non-invasive apparatus for detecting abnormal health conditions | |
| TWM542444U (en) | Wearable pulse contour analysis device with multiple diagnositic functions | |
| US20170172516A1 (en) | Neck-worn physiological monitor | |
| TWM528727U (en) | Wearable physiological measuring instrument | |
| KR20190105421A (en) | apparatus and method for measuring blood presure based on PPG | |
| WO2024034305A1 (en) | Pulse pressure measurement device and pulse pressure measurement method | |
| WO2023195306A1 (en) | Blood pressure estimation method and biological information measurement system | |
| WO2023233901A1 (en) | Pulse wave signal processing device, biological information measurement device, and pressing force abnormality determination method | |
| WO2023189483A1 (en) | Peripheral blood pressure estimation method and biological information measurement system | |
| WO2023162756A1 (en) | Hemodynamics estimation method | |
| WO2024053380A1 (en) | Vascular endothelial function evaluation system, vascular endothelial function evaluation device, and vascular endothelial function evaluation method |
Legal Events
| Date | Code | Title | Description |
|---|---|---|---|
| 121 | Ep: the epo has been informed by wipo that ep was designated in this application |
Ref document number: 23852288 Country of ref document: EP Kind code of ref document: A1 |