WO2023248355A1 - 不適合検出装置、および、不適合検出方法 - Google Patents
不適合検出装置、および、不適合検出方法 Download PDFInfo
- Publication number
- WO2023248355A1 WO2023248355A1 PCT/JP2022/024750 JP2022024750W WO2023248355A1 WO 2023248355 A1 WO2023248355 A1 WO 2023248355A1 JP 2022024750 W JP2022024750 W JP 2022024750W WO 2023248355 A1 WO2023248355 A1 WO 2023248355A1
- Authority
- WO
- WIPO (PCT)
- Prior art keywords
- image
- model
- learning
- unit
- learning model
- Prior art date
- Legal status (The legal status is an assumption and is not a legal conclusion. Google has not performed a legal analysis and makes no representation as to the accuracy of the status listed.)
- Ceased
Links
Images


Classifications
-
- G—PHYSICS
- G06—COMPUTING OR CALCULATING; COUNTING
- G06T—IMAGE DATA PROCESSING OR GENERATION, IN GENERAL
- G06T7/00—Image analysis
-
- G—PHYSICS
- G06—COMPUTING OR CALCULATING; COUNTING
- G06T—IMAGE DATA PROCESSING OR GENERATION, IN GENERAL
- G06T1/00—General purpose image data processing
- G06T1/20—Processor architectures; Processor configuration, e.g. pipelining
-
- G—PHYSICS
- G06—COMPUTING OR CALCULATING; COUNTING
- G06T—IMAGE DATA PROCESSING OR GENERATION, IN GENERAL
- G06T3/00—Geometric image transformations in the plane of the image
- G06T3/10—Selection of transformation methods according to the characteristics of the input images
-
- G—PHYSICS
- G06—COMPUTING OR CALCULATING; COUNTING
- G06T—IMAGE DATA PROCESSING OR GENERATION, IN GENERAL
- G06T7/00—Image analysis
- G06T7/0002—Inspection of images, e.g. flaw detection
-
- G—PHYSICS
- G06—COMPUTING OR CALCULATING; COUNTING
- G06T—IMAGE DATA PROCESSING OR GENERATION, IN GENERAL
- G06T7/00—Image analysis
- G06T7/0002—Inspection of images, e.g. flaw detection
- G06T7/0004—Industrial image inspection
-
- G—PHYSICS
- G06—COMPUTING OR CALCULATING; COUNTING
- G06T—IMAGE DATA PROCESSING OR GENERATION, IN GENERAL
- G06T7/00—Image analysis
- G06T7/0002—Inspection of images, e.g. flaw detection
- G06T7/0004—Industrial image inspection
- G06T7/0008—Industrial image inspection checking presence/absence
-
- G—PHYSICS
- G06—COMPUTING OR CALCULATING; COUNTING
- G06T—IMAGE DATA PROCESSING OR GENERATION, IN GENERAL
- G06T2207/00—Indexing scheme for image analysis or image enhancement
- G06T2207/10—Image acquisition modality
- G06T2207/10056—Microscopic image
- G06T2207/10061—Microscopic image from scanning electron microscope
-
- G—PHYSICS
- G06—COMPUTING OR CALCULATING; COUNTING
- G06T—IMAGE DATA PROCESSING OR GENERATION, IN GENERAL
- G06T2207/00—Indexing scheme for image analysis or image enhancement
- G06T2207/20—Special algorithmic details
- G06T2207/20081—Training; Learning
-
- G—PHYSICS
- G06—COMPUTING OR CALCULATING; COUNTING
- G06T—IMAGE DATA PROCESSING OR GENERATION, IN GENERAL
- G06T2207/00—Indexing scheme for image analysis or image enhancement
- G06T2207/20—Special algorithmic details
- G06T2207/20084—Artificial neural networks [ANN]
-
- G—PHYSICS
- G06—COMPUTING OR CALCULATING; COUNTING
- G06T—IMAGE DATA PROCESSING OR GENERATION, IN GENERAL
- G06T2207/00—Indexing scheme for image analysis or image enhancement
- G06T2207/30—Subject of image; Context of image processing
- G06T2207/30108—Industrial image inspection
- G06T2207/30141—Printed circuit board [PCB]
-
- G—PHYSICS
- G06—COMPUTING OR CALCULATING; COUNTING
- G06T—IMAGE DATA PROCESSING OR GENERATION, IN GENERAL
- G06T2207/00—Indexing scheme for image analysis or image enhancement
- G06T2207/30—Subject of image; Context of image processing
- G06T2207/30108—Industrial image inspection
- G06T2207/30148—Semiconductor; IC; Wafer
-
- G—PHYSICS
- G06—COMPUTING OR CALCULATING; COUNTING
- G06T—IMAGE DATA PROCESSING OR GENERATION, IN GENERAL
- G06T2207/00—Indexing scheme for image analysis or image enhancement
- G06T2207/30—Subject of image; Context of image processing
- G06T2207/30168—Image quality inspection
Definitions
- the present invention relates to a nonconformity detection device and a nonconformity detection method.
- Patent Document 1 describes a system that uses machine learning to convert a low-quality image to a high-quality image.
- a machine learning learning model is generated using low-quality images and high-quality images.
- the system described in Patent Document 1 uses this learning model to convert a low-quality input image into a high-quality output image by machine learning.
- learning models are prepared in advance for each purpose of image quality improvement. For example, if the purpose is to remove noise, a learning model for noise removal corresponding to the size of the noise is prepared. Alternatively, if the purpose is to improve aberrations, a learning model corresponding to the magnitude of the aberrations is prepared. The user selects the learning model to be used based on the purpose of image quality improvement and the image quality status of the low-quality image (noise and aberration status). In the system described in Patent Document 1, since the user visually selects a learning model for noise removal, it is easy to determine whether the selected learning model is effective for noise removal.
- the image conversion process using the learning model has the property of converting the input image so that it approaches the image of the teaching material data used when learning the learning model. Therefore, when a noisy input image is input to a learning model learned from noise-free teaching material data, it is expected that an output image from which noise has been removed from the input image will be obtained so as to be closer to the teaching material data.
- unexpected side-effect image conversion processing that is different from the purpose of the learning model may also occur.
- the shape and position of subject A in the teaching material data are significantly different from the shape and position of subject B in the input image, subject B in the output image will be deformed so as to be closer to subject A.
- Such unexpected deformation changes the meaning of the image, and this also affects how the converted image is used, for example, when visually inspecting whether the object is a normal product or a defective product. This effect is caused by the fact that the learning model used for image conversion processing is incompatible with the input image.
- the main objective of the present invention is to detect the incompatibility of the learning model used for image conversion processing.
- the nonconformity detection device of the present invention has the following features.
- the present invention includes an image conversion unit that converts an input pre-conversion image into a post-conversion image using a learning model; a mismatch detection unit that detects whether the pre-conversion image and the learning model are mismatched; a nonconformity reporting unit that reports detected nonconformities; a storage unit that stores a distribution of evaluation values of the learning images used in the learning stage of the learning model as a model conformity region in association with the learning model;
- the non-conformity detection unit determines that the learning model is non-conforming when the evaluation value of the pre-conversion image is not within the range of the model conformity region. Other means will be described later.
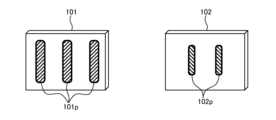
- FIG. 2 is an external view showing the photographing of a semiconductor circuit pattern formed in two upper and lower layers according to the present embodiment.
- FIG. 2 is an explanatory diagram of a circuit pattern formed on the semiconductor wafer of FIG. 1 according to the present embodiment.
- FIG. 3 is an explanatory diagram showing the amount of deviation determined from the semiconductor wafer of FIG. 2 according to the present embodiment.
- FIG. 2 is a configuration diagram of a nonconformity detection unit used in an image conversion system that converts a low-quality image into a high-quality image according to the present embodiment. It is a block diagram of the nonconformity detection part regarding this embodiment. It is a block diagram of the model learning part regarding this embodiment.
- FIG. 3 is a diagram illustrating a method of defining a section of a model conformance region according to the present embodiment. Two types of definition methods are illustrated below.
- FIG. 3 is a diagram illustrating an example of a method for setting a model conformity region according to the present embodiment. 3 is a table showing a first example of a region representation method according to the present embodiment. It is a table which shows the 2nd example of the area
- FIG. 13 is a table showing a modification example in which the cell values of the table of FIG. 12 related to this embodiment are stored with directory names in which learning pair images are stored.
- This is a data structure showing a fourth example of a region representation method in which the table of FIG. 11 related to this embodiment is extended to three-dimensional elements.
- FIG. 2 is a configuration diagram of a nonconformity countermeasure unit according to the present embodiment. 7 is a flowchart showing specific processing of nonconformity countermeasure processing according to the present embodiment.
- FIG. 16 is a configuration diagram showing a modification of the nonconformity countermeasure unit shown in FIG. 15 according to the present embodiment.
- FIG. 1 is a hardware configuration diagram of an image conversion system according to the present embodiment.
- FIG. 1 is a hardware configuration diagram of an image conversion system according to the present embodiment.
- FIG. 12 is an explanatory diagram showing how the numerical values in the table change due to relearning regarding a table of model compatible regions that is expressed in the same manner as in FIG. 11 according to the present embodiment.
- 7 is a graph showing the occurrence of errors in a low-quality image before processing (before image quality improvement) by the image conversion unit according to the present embodiment.
- 7 is a graph showing the occurrence of errors in a high-quality equivalent image after processing by the image conversion unit (after image quality improvement) according to the present embodiment.
- FIG. 7 is a diagram illustrating a measurement error when an image is converted using a learning model in which the amount of deviation of a pair of learning images is set to the model compatible region [ ⁇ 5, 5] according to the present embodiment. It is a graph showing the occurrence of errors based on the results of the first learning according to the present embodiment. It is a graph showing the occurrence of errors based on the results of the second learning according to the present embodiment.
- FIG. 1 is an external view showing that a semiconductor circuit pattern formed in two layers, upper and lower, is photographed.
- the object to be photographed is a semiconductor wafer in which an upper layer circuit 101 and a lower layer circuit 102 are formed into a multilayer structure (in this case, upper and lower layers) by etching, adding impurities, or forming a thin film and are integrated.
- the electron microscope 31 irradiates the semiconductor wafer from above (from the side closer to the upper layer circuit 101) with an electron beam (arrow in the figure) and photographs the semiconductor wafer.
- the semiconductor wafer in the photographing environment 31A is a normal product with no positional deviation between the upper layer circuit 101 and the lower layer circuit 102.
- a semiconductor wafer in which an upper layer circuit 101 and a lower layer circuit 102 are formed and integrated is a photographing target.
- the upper layer circuit 101 of the photographing environment 31B was formed slightly shifted to the left with respect to the lower layer circuit 102. Therefore, in the photographing environment 31B, it is necessary to detect from the photographed image of the electron microscope 31 that the semiconductor wafer is a defective product.
- the upper layer circuit 101 was formed slightly shifted to the right with respect to the lower layer circuit 102. Therefore, even in the photographing environment 31C, it is necessary to detect from the photographed image of the electron microscope 31 that the semiconductor wafer is a defective product.
- FIG. 2 is an explanatory diagram of a circuit pattern formed on the semiconductor wafer of FIG. 1.
- a circuit pattern is formed in the upper layer circuit 101 and the lower layer circuit 102 by using a mask for each layer.
- the circuit pattern 101p of the upper layer circuit 101 is made slightly longer in the vertical direction than the circuit pattern 102p of the lower layer circuit 102.
- FIG. 2 Although there are actually many circuit patterns formed on one semiconductor wafer, a small number of circuit patterns are intentionally shown in FIG. 2 for the sake of explanation.
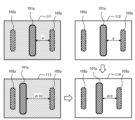
- FIG. 3 is an explanatory diagram showing the amount of deviation determined from the semiconductor wafer in FIG. 2.
- the photographed images 111 to 114 show a part of the photographed images of the semiconductor wafer in which the upper layer circuit 101 and the lower layer circuit 102 are formed and integrated (FIG. 3 is a rough diagram, and the circuit patterns after overlapping are shown). (A portion is extracted and shown enlarged.)
- the electron beam from the electron microscope 31 passes through the upper layer circuit 101 on the front side and the lower layer circuit 102 on the back side, so both circuit patterns are captured in the photographed image.
- the captured images 111 to 114 include, from the left, a first circuit pattern (one of the circuit patterns 102p), a second circuit pattern 101p (one of the circuit patterns 101p), and a third circuit pattern 102p. (one of the circuit patterns 102p) are photographed side by side in the left and right direction.
- Photographed images 111 and 112 are photographed images of normal products with no positional deviation, and the first, second, and third circuit patterns are lined up with an equal distance d in the left-right direction. In other words, the amount of deviation when this distance d is used as a reference is 0.
- the photographed image 111 is a low-quality image that has a rough resolution and includes white noise, distortion, etc. in addition to the circuit pattern (in the figure, the white noise is expressed by hatching).
- the photographed image 112 is a high-quality image with high resolution and low noise and distortion, and has the same circuit pattern arrangement as the photographed image 111, but white noise is not photographed.
- the learning pair images are a pair of images that serve as teaching materials when learning the learning model 14, one of the images serving as input data to the learning model 14, and the other of the pair serving as the output data to the learning model 14. It becomes data.
- the learning model 14 that performs image conversion processing called noise inputs a low-quality image such as the photographed image 111, a high-quality image such as the photographed image 112 is output.
- a pair of photographed images 111 and 112 that depict the same subject is defined as a pair of learning images.
- the learning model 14 receives the captured image 113 before image conversion as input data, and uses the captured image 114 after image conversion as output data.
- the photographed image 114 is a high-quality image whose image quality has been improved by applying the learning model 14 to the photographed image 113. As an effect of image quality improvement, unnecessary white noise included in the captured image 113 is clearly removed from the captured image 114.
- the learning model 14 when the learning model 14 is created using the captured image 112 with a small amount of deviation, in addition to image noise removal, the arrangement information of the circuit pattern is also learned. Therefore, when a photographed image 113 with a large amount of deviation is input, processing is performed to bring it closer to the arrangement information of the photographed image 112 learned during learning, and the photographed image 114 is presumably output.
- Image noise removal is an effective image transformation for improving measurement accuracy, but such movement of circuit patterns is an inappropriate image transformation that reduces measurement accuracy.
- a learning model that performs such inappropriate image conversion is referred to as a "learning model mismatch.”
- FIG. 4 is a configuration diagram of an image conversion system that converts a low-quality image into a high-quality image.
- the image conversion system includes a nonconformity detection section 10, a nonconformity countermeasure section 20, an imaging device 30, an image utilization section 40, and a control display section 50.
- the misfit detection unit 10 detects misfits in a learning model 14 in machine learning used for image conversion processing such as image quality improvement processing.
- the image conversion unit 12 of the nonconformity detection unit 10 converts the low-quality image 11 into a high-quality image using the learning model 14.
- the high-quality image after conversion is used for image observation and image measurement. Generally, the following shooting conditions are used to capture high-quality images. - Increase the imaging time. - Capture multiple short-time exposure images and calculate the cumulative average. ⁇ Irradiate strong illumination light.
- examples of the imaging device 30 include an electron microscope 31 and an X-ray tomography device 32.
- the electron microscope 31 irradiates an object to be observed (for example, a semiconductor wafer) with an electron beam to observe a circuit pattern formed on the wafer. Electron beam irradiation may damage the circuit pattern, causing it to become thinner (shrink). Shrinkage is caused by long-time exposure (including capturing multiple short-time exposure images) and high accelerating voltage. Therefore, high-quality images cannot be captured frequently.
- the X-ray tomography device 32 irradiates the human body with X-rays and images the human body.
- High-quality images can be captured by irradiating for a long time and increasing the X-ray intensity.
- it is difficult to capture high-quality images using this method. Therefore, in order to minimize damage to the subject, it is better to capture a low quality image 11.
- the low-quality image 11 captured by the imaging device 30 in this manner is stored in the captured image storage section 33.
- the image conversion unit 12 converts the low-quality image 11 in the captured image storage unit 33 into a high-quality equivalent image 13 (an image having an image quality equivalent to a high-quality image). Note that although the configuration has been described in which the low-quality image 11 is input to the non-conformity detection section 10 via the captured image storage section 33, the low-quality image 11 may be input directly from the imaging device 30 to the non-conformity detection section 10.
- the high-quality equivalent image 13 output from the nonconformity detection section 10 is input to the image utilization section 40.
- the image utilization section 40 includes an image observation processing section 41, an image measurement processing section 42, and an image classification processing section 43.
- the image observation processing unit 41 performs various image processing such as enlargement/reduction in order to observe the input image.
- the image measurement processing unit 42 measures the size of the shape using image processing. For example, the image measurement processing unit 42 performs image processing using the converted high-quality equivalent image 13, and the circuit pattern 101p of the upper layer circuit 101 and the circuit pattern 102p of the lower layer circuit 102 in FIG. Extract. The image measurement processing unit 42 then extracts the distance d between the edges shown in FIG.
- the image classification processing unit 43 processes what kind of object the input image is classified into. Although not shown, the image utilization unit 40 also performs image processing for processing fields in which processing performance is degraded for low-quality images 11, such as image segmentation processing for classifying image regions.
- the control display section 50 performs various controls of the image utilization section 40 and displays processing results.
- FIG. 5 is a configuration diagram of the nonconformity detection section 10.
- the nonconformity detection section 10 includes an image conversion section 12 and a nonconformity detection section 15.
- the nonconformity detection unit 10 stores a low-quality image 11 (photographed image 113 in FIG. 3), a high-quality equivalent image 13 (photographed image 114 in FIG. 3), and a learning model 14.
- the image conversion unit 12 uses the learning model 14 to output a high-quality equivalent image 13 from the input low-quality image 11 captured by the imaging device 30 .
- the learning model 14 is, for example, a machine learned model such as a CNN (Convolutional Neural Network). CNN is a means for converting a low quality image 11 into a high quality equivalent image 13 using a learning model 14.
- CNN Convolutional Neural Network
- the incompatibility detection unit 15 detects whether the low-quality image 11 input as a processing target of the image conversion unit 12 and the learning model 14 are incompatible.
- information for the nonconformity detection unit 15 to detect nonconformity information on the model conformity area indicating the evaluation value (displacement amount, etc.) of the training pair images used in the learning process of the learning model 14 is used for each learning model 14. is registered in the storage unit of the nonconformity detection unit 10 in association with the .
- Information on the model compatible region is expressed, for example, as an interval of the amount of shift between the pair of learning images used during learning.
- the non-conformance detection unit 15 determines that the learning model 14 is non-conforming when the evaluation value of the input low-quality image 11 is not within the range of the model conformity region.
- the non-conformance reporting unit 16 informs the user that the learning model 14 used for the conversion process of the low-quality image 11 to be processed by the image conversion unit 12 is non-conforming, as a result of the detection by the non-conformity detection unit 15, on a screen display or in audio. Notify the inspector using presentation methods such as
- FIG. 6 is a configuration diagram of the model learning section 10B.
- the model learning section 10B includes an image conversion section 12 and a weight correction section 12B.
- the mismatch detection unit 10 stores a low-quality image 11 (photographed image 111 in FIG. 3), a high-quality equivalent image 13 (photographed image 112 in FIG. 3), a high-quality correct image 13B, and a learning model 14.
- the high-quality correct image 13B is a high-quality image that is the target (correct answer) for image quality improvement for the low-quality image 11.
- the high-quality correct image 13B may be a test wafer in the case of a semiconductor wafer, or an X-ray imaging phantom simulating a human body in the case of X-rays.
- the high-quality correct image 13B is a learning pair image paired with the low-quality image 11, and is an image at the same position and the same angle of view as the low-quality image 11. Note that the photographing conditions for the high-quality correct image 13B require a greater amount of electron beam or X-ray irradiation than the photographing conditions for the low-quality image 11. Once the learning model 14 is generated, the high-quality correct image 13B becomes unnecessary when converting another low-quality image 11.
- the weight correction unit 12B corrects the weight of the learning model 14 so that the image quality of the high quality equivalent image 13 approaches the high quality correct image 13B.
- the weights of the learning model 14 are, for example, weight coefficients of a CNN network. Therefore, in the initial state, no weights are set for the learning model 14. Therefore, there is a discrepancy between the high-quality equivalent image 13 obtained by converting the low-quality image 11 by the image conversion unit 12 and the high-quality correct image 13B.
- the weight correction unit 12B calculates a correction amount for correcting the weighting coefficient of the learning model 14 for correcting the amount of deviation, and corrects the learning model 14.
- the model learning unit 10B stores the distribution of evaluation values of the learning images used in the learning stage of the learning model 14 in the storage unit in association with the learning model 14 as a model compatible region.
- the weight correction process by the weight correction unit 12B is repeated using a plurality of paired learning images, and ends when the weight correction amount becomes smaller. At the end of the weight correction process, the deviation between the high quality equivalent image 13 and the high quality correct image 13B is minimized.
- the image conversion unit 12 can generate a high-quality equivalent image 13 with a quality close to the high-quality correct image 13B from the low-quality image 11.
- FIG. 7 is a flowchart showing the process flow of the nonconformity detection unit 10.
- the image conversion unit 12 acquires the low-quality image 11 to be processed from the captured image storage unit 33 (image multidimensional acquisition data DB) (S11). Note that the image conversion unit 12 may directly obtain the low-quality image 11 from the imaging device 30.
- the image conversion unit 12 uses the learning model 14 to obtain a high-quality equivalent image 13 from the obtained low-quality image 11 (image conversion) (S12).
- the image measurement processing unit 42 calculates the amount of shift between the upper and lower layers by performing the image measurement process described in FIG. 4 using the acquired low-quality image 11 (S13).
- the nonconformity detection unit 15 acquires information on the model conformity region registered in the DB of the learning model 14 (S14).
- the misfit detection unit 15 determines whether the deviation amount of the low-quality image 11 calculated in S13 is within the model compatible region of the learning model 14 (S15), and detects the learning model outside the model compatible region. 14 is considered to be incompatible with the learning model. If Yes in S15, the nonconformity detection unit 15 reports the nonconformity of the learning model 14 in S15 via the nonconformity reporting unit 16 (S16). Further, the nonconformity countermeasure unit 20 may execute countermeasures for nonconformity (S17). On the other hand, if the result is No in S15, the amount of deviation is output (S18).
- FIG. 8 is a diagram illustrating a method for defining a section of a model compatible region. Two types of definition methods are illustrated below.
- the section definition method 121 the section of the shift amount of the pair of learning images used during learning is directly defined as a model compatible region.
- the model compatible region is the union of the first interval ([-5, 5]) with a deviation amount of -5 to +5 and the second interval ([15, 20]) with a deviation amount of +15 to +20. becomes.
- the area is represented by a hatched bar graph.
- the section definition method 122 defines a model conformity region that takes into account the error between the amounts of deviation explained with reference to FIG. In order to increase the reliability of the model adaptation region, it is desirable to take this error into account and reduce both ends of the interval inward for each interval (first interval and second interval).
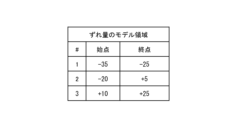
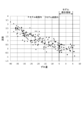
- FIG. 9 is a diagram illustrating an example of a method for setting a model compatible region.
- the method for setting the interval of the model compatible region will be explained.
- the horizontal axis of each graph 131, 132 represents the amount of deviation.
- the graph 131 shows the value of the amount of deviation of the high-quality correct image 13B of a certain pair of learning images as a black dot, and shows the influence curve of the amount of deviation as a sloped curve.
- the functions used to calculate the influence curve, the width of the base, etc. are determined through experiments. There are multiple paired images for learning, and the distribution densities for the amount of deviation are also different.
- a threshold value for determining the influence of the shift amount of the pair of learning images is described.
- the influence curve is greater than or equal to this threshold, it is determined that the region is model compatible.
- the first interval ([-35, -25]), the second interval ([-20, +5]), and the third interval ([+10, +25]) are each within the model adaptation region. It was judged as.
- a graph 132 shows a portion determined as a model compatible region. When reliability and the like are taken into account, the model compatible region may be reduced using the method described in the interval definition method 122 of FIG. 8 based on the model compatible region of the graph 132.
- FIG. 10 is a table showing a first example of a region representation method.
- the value of the model conformity area determined in FIG. 9 is expressed by the amount of deviation between the starting point and the ending point.
- the learning model nonconformity determination process of the nonconformity detection unit 15 executes a determination process (S15) for each item number (#) to determine whether the amount of deviation of the low quality image 11 is within the model compatible region. do it.
- FIG. 11 is a table showing a second example of the area representation method.
- the identifier of the model compatible region is a single value, it is treated as an identifier that identifies each model compatible region having a width.
- the identifier "-10" listed in the table indicates that the model compatible region is [-10,-5).
- the symbol [contains a boundary, and the symbol) does not include a boundary.
- the quantization of the model matching region is set to 5, and the amount of deviation of the starting point is used as its identifier.
- the model learning unit 10B can change the resolution of the model matching region by changing the quantization number.
- the learning model non-conformity determination process (S15) of the non-conformity detection unit 15 determines which model conformance region (left column of the table) the deviation amount of the low-quality image 11 belongs to. , just refer to the flag in the right column of the table to which it belongs. If the flag is 1, it is a model compatible area, and if it is 0, it is not a model compatible area. For example, if the amount of deviation of the low-quality image 11 is 16, the mismatch detection unit 15 sets the region identifier to "15" because it is included in the model compatible region [15, 20). Then, the non-conformity detection unit 15 determines that the model is non-conforming by referring to the area identifier "15" ⁇ flag "0" from the table of FIG.
- the representation method shown in FIG. 11 can be easily multidimensionalized. Until now, only the amount of deviation in the lateral direction was considered as a model fit area. In reality, the amount of deviation in the vertical direction also occurs, and changes in image quality that are completely different from the amount of deviation, for example, due to differences in the acceleration voltage of the electron microscope 31, occur. It is necessary to perform learning using paired training images for each element.
- FIG. 12 is a table showing a third example of the region representation method, which is an extension of the table shown in FIG. 11 to two-dimensional elements. Note that in the table of FIG. 11, the range of identifiers is from -10 to 40, but in the table of FIG. 12, the range of identifiers is from -20 to 30.
- the horizontal items indicate the identifiers of the model compatible regions representing the amount of deviation in the horizontal direction
- the items in the vertical direction represent the identifiers of the model compatible regions representing the amount of deviation in the vertical direction.
- the numerical value inside the cell where the horizontal item and the vertical item intersect is 1 if the model conforms to the area, and 0 if it is not the model compatible area.
- the learning model non-conformity determination process (S15) of the non-conformity detection unit 15 determines which cell in the table the shift amount of each element of the low-quality image 11 belongs to, and selects the cell to which it belongs. Just refer to the internal numbers.
- FIG. 13 is a table showing a modification example in which the cell value of the table in FIG. 12 stores the directory name in which the learning pair images are stored. If the character string inside the cell is not in the model compatible region, it is represented by 0, and if it is in the model compatible region, it is represented by a value other than 0.
- FIG. 14 is a data structure showing a fourth example of a region representation method in which the table of FIG. 11 is extended to three-dimensional elements.
- the X-axis shows the amount of deviation in the horizontal direction
- the Y-axis shows the amount of deviation in the vertical direction
- the Z-axis shows the acceleration voltage. Note that although three-dimensional or more-dimensional representation cannot be illustrated, the region representation method can be expanded to n-dimensionality.
- the learning model non-conformity determination process (S15) of the non-conformity detection unit 15 is performed based on the combination of the horizontal shift amount, the vertical shift amount, and the acceleration voltage of the low-quality image 11.
- the cell belongs to it is sufficient to determine which cell in the table the cell belongs to and refer to the numerical value (not shown) inside the cell to which the cell belongs. According to the first embodiment, it becomes possible to detect that the learning model is incompatible with the image to be processed, and to notify that the error in the measurement result is large.
- FIG. 15 is a configuration diagram of the nonconformity countermeasure unit 20.
- the nonconformity countermeasure section 20 includes a countermeasure method search section 22 , a countermeasure method presentation section 23 , a relearning data input section 24 , a used model changing section 25 , an existing model relearning section 26 , and a new model learning section 27 .
- the nonconformity countermeasure unit 20 stores a countermeasure method DB 21. Details of the nonconformity countermeasure unit 20 will be described below with reference to FIG. 16.
- FIG. 16 is a flowchart showing specific processing of the nonconformity countermeasure processing (S17).
- S17 nonconformity countermeasure processing
- the usage model changing unit 25 searches for another model that can handle the amount of deviation (S171).
- the usage model change unit 25 determines whether the search in S171 was successful and another model was found (S172). If Yes in S172, the usage model changing unit 25 changes the usage model from the current non-conforming model to another model found (S173).
- the used model is the learning model 14 that the image conversion unit 12 uses for conversion processing.
- the usage model change unit 25 changes the nonconformity countermeasure unit 20 to another learning model 14 that corresponds to a model conformity region that matches the evaluation value of the input low-quality image 11.
- the image conversion unit 12 is controlled to search from the storage unit and use another learning model 14 for conversion processing of the input low-quality image 11. Thereby, the image conversion unit 12 can perform appropriate (less error) image conversion processing based on the learning model 14 adapted to the low-quality image 11 to be processed, which has been changed in S173.
- the countermeasure method search unit 22 acquires an existing learning model that can be relearned from the DB of the learning model 14 (S174). What is acquired in S174 may be the current non-conforming model or another existing learning model.
- the countermeasure method search unit 22 determines whether the acquisition of the existing learning model in S174 was successful (S175). If Yes in S175, the existing model relearning unit 26 relearns the existing model (S176). In other words, when the non-conformity detection unit 15 detects non-conformity, the existing model re-learning unit 26 re-learns the non-conforming learning model 14 based on the additional high-quality correct image 13B. The model adaptation area of the learning model 14 is expanded. If No in S175, the new model learning unit 27 learns a new model (S177).
- the relearning data input unit 24 obtains high-quality images of teaching material data used for the relearning process of the existing model relearning unit 26 (S176) and the learning process of the new model learning unit 27 (S177).
- the existing model is a model that has been trained one or more times, and the model compatible region also includes one or more sections.
- a new model is a model in an initial state that has not been trained, and its model compatible region does not include any interval.
- FIG. 17 is a configuration diagram showing a modification of the nonconformity countermeasure unit 20 of FIG. 15.
- a relearning data collection section 24b is provided instead of the relearning data input section 24.
- the relearning data collection unit 24b obtains high-quality images without operator intervention by executing automatic operation according to the programmed operating procedure of the imaging device 30. That is, the relearning data collection unit 24b receives the input of the additional high-quality correct image 13B taken by operating the imaging device 30 according to a preset operating procedure. Further, the relearning data collection unit 24b may perform automatic operation in the same manner as in the other processes shown in FIG.
- the countermeasure presentation unit 23 presents the following three types of countermeasure methods searched from the countermeasure method DB 21 by the countermeasure method search unit 22 and the work procedures required for the countermeasure methods to the user, and selects which countermeasure method to adopt.
- the user may be allowed to select one. Therefore, in the countermeasure method DB 21, information indicating what kind of work should be performed next when the nonconformity reporting unit 16 determines that the model is nonconforming is registered.
- (Countermeasure Method 1) Changing the usage model by the usage model changing unit 25 (S173).
- the countermeasure presentation unit 23 may display candidates for usage models to be changed, and the operator may press a confirmation button or the like to confirm the usage model candidates that have been confirmed.
- Method 2 Re-learning the existing model by the existing model re-learning unit 26 (S176, details will be explained in Example 2).
- the countermeasure presentation unit 23 may display this work procedure (recipe) on the screen in an easy-to-understand manner for the operator to support the operation. Therefore, the countermeasure method DB 21 stores information such as how to take an additional high-quality correct image 13B for relearning, such as "to take a high-quality image, please shine a strong light on the subject.” be done.
- the contents stored in this countermeasure method DB 21 are various messages to be displayed on the operator's screen.
- (Countermeasure Method 3) New model learning by the new model learning unit 27 (S177).
- the countermeasure method presentation unit 23 may display the work procedure (recipe) on the screen in an easy-to-understand manner for the operator.
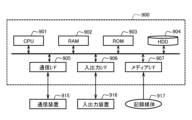
- FIG. 18 is a hardware configuration diagram of the image conversion system.
- Each processing section of the image conversion system includes a CPU 901, a RAM 902, a ROM 903, an HDD 904, It is configured as a computer 900 having a communication I/F 905, an input/output I/F 906, and a media I/F 907.
- the HDD 904 is configured with a storage device that stores the learning model 14, for example.
- Communication I/F 905 is connected to external communication device 915.
- the input/output I/F 906 is connected to the input/output device 916.
- the media I/F 907 reads and writes data from the recording medium 917. Further, the CPU 901 controls each processing unit by executing a program (also called an application or an abbreviation thereof) read into the RAM 902 . This program can also be distributed via a communication line or recorded on a recording medium 917 such as a CD-ROM.
- a processing unit of the image conversion system may be any type of hardware as long as it can perform arithmetic processing on images. For example, it may be a computer equipped with an arithmetic processing unit such as a CPU or GPU, or a storage device such as an HDD to perform arithmetic processing, or it may be an FPGA (field-programmable gate array) that can program logic arithmetic circuits. You can also create dedicated hardware.
- the existing model relearning process (S176) by the existing model relearning unit 26 will be described.
- the relearning process we will describe a method of adjusting the learning model using the commonly used fine tuning and expanding the model adaptation area while adapting the learning model.
- Fine tuning uses an existing model as a pre-learning state.
- the training pair images used for learning are the training pair images used when creating the existing model (registered in the model adaptation area) and the training images of the area to extend the model adaptation area (before being registered in the model adaptation area). Both with paired images.
- fine tuning allows model generation to be performed much faster than when learning a learning model that has not learned anything as an initial state, and is effective in improving processing throughput.
- fine tuning is used to create a learning model that has multiple objectives, such as using a trained learning model for the purpose of noise removal as an initial state and learning using a pair of training images for the purpose of improving aberrations. is also suitable. That is, the retrained learning model can perform image transformation processing that improves both noise removal and aberration, for example.
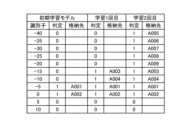
- FIG. 19 is an explanatory diagram illustrating how the numerical values in the table change due to relearning regarding the table of model compatible regions, which is expressed in the same way as in FIG. 11.
- the table in Figure 19 shows the initial learning model in the initial state (columns 1 to 3), the model showing the results of the first relearning (columns 4 and 5), and the results of the second relearning. (columns 6 and 7) are summarized in one table. Since the identifiers of the model matching regions are the same for all three models, they are listed only in the first column.
- the 3rd, 5th, and 7th columns of "storage destination" indicate the directory names in which the learning pair images used when performing fine tuning and adjusting the learning model are stored. The learning pair images contained in this directory are used as learning data during relearning.
- the initial training model shows the model fit region [-5, 5), the result of the first training is extended to the model fit region [-15, 5), and the result of the second training shows the model fit region [-40, 5].
- the learning pair images used in the first learning are stored in directory names "A003, A004", respectively.
- the learning pair images used in the second learning are stored in directory names "A005 to A009", respectively. For example, if the size of the shift amount of the low-quality image 11 that is newly processed is the area [-15, -5), in the initial learning model, some of the areas [-15, -5) are Although they are non-conforming outside the interval, if the results of the first training are used, they are all conforming within the interval.
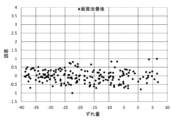
- FIG. 20 is a graph showing the occurrence of errors in the low-quality image 11 before processing by the image conversion unit 12 (before image quality improvement).
- FIG. 21 is a graph showing the occurrence of errors in the high-quality equivalent image 13 after processing by the image conversion unit 12 (after image quality improvement).
- the horizontal axis of the graph indicates the amount of deviation determined using the high-quality equivalent image 13.
- the vertical axis of the graph indicates the error between the amount of deviation obtained using the low-quality image 11 or the high-quality equivalent image 13 and the amount of deviation obtained using the high-quality correct image 13B.
- the learning model 14 is created using a pair of learning images in which the amount of deviation between the upper and lower layers is between -40 and +5.
- the number of images measured to generate the graphs in FIGS. 20 and 21 was 200 each. It can be seen that the variation in errors in FIG. 21 is smaller in all deviation amounts than in FIG. 20. The fact that the error variation is small means that the accuracy is improved, and it can be seen that the image conversion section 12 is intended to improve the measurement accuracy.
- the reason why the horizontal axis is the amount of deviation obtained using the high-quality equivalent image 13 instead of the amount of deviation obtained from the high-quality image is because the reason stated in the problem of obtaining high-quality images is that it is used in the judgment process of learning model incompatibility. This is because high-quality images cannot be used. In FIG.
- a learning model was created using paired images for learning in which the amount of deviation between the upper and lower layers was between ⁇ 40 and +5.
- the misalignment between the upper and lower layers occurs due to some kind of manufacturing process problem, and during actual operation, it is difficult to prepare images with such a wide misalignment amount as paired images for learning.
- FIG. 22 is a diagram illustrating measurement errors when images are converted using a learning model in which the amount of deviation of the pair of learning images is set to the model compatible region [ ⁇ 5, 5].
- the variation in error is approximately the same value as in FIG. 21, and an improvement in measurement accuracy is recognized.
- the error increases as the distance from the model compatible area increases. In this way, if the amount of deviation of the low-quality image 11 is included in the model compatible region, there will be less variation in errors and less inappropriate movement of the circuit pattern. If the amount of shift in the low-quality image 11 is not included in the model conformance region, there will be a lot of variation in errors and there will be a lot of inappropriate movement of the circuit pattern.
- FIG. 23 is a graph showing the occurrence of errors based on the results of the first learning. It can be seen that the model conformance region has been expanded to the interval [-15, 5) by fine tuning, and the error (vertical axis) within this interval has become smaller. Based on the model conformity region [-15, 5) of this learning model 14, the nonconformity detection unit 15 determines subsequent model conformity.
- FIG. 24 is a graph showing the occurrence of errors based on the results of the second learning. It can be seen that the model conformance region has been expanded to the interval [-40, 5) by fine tuning, and the error (vertical axis) in almost the entire interval has become small. Based on the model conformity region [-40, 5) of the learning model 14, the nonconformity detection unit 15 determines subsequent model conformity.
- the amount of deviation of the obtained pair of learning images may be concentrated in one place or become rough.
- the weight of that area becomes large, which may result in unbalanced relearning. Therefore, it is desirable that the quantization width of the model compatible region in a table representing the model compatible region such as in FIG. 11 be constant. This makes it possible to prevent such an imbalance from occurring by keeping the number of paired images for learning in each model compatible region constant.
- the nonconformity detection unit 10 of the present embodiment described above performs nonconformity detection to determine whether the learning model 14 used for converting the low quality image 11 to the high quality equivalent image 13 is compatible with the low quality image 11. Department 15 will do it.
- the non-conformance reporting unit 16 determines that the learning model 14 is incompatible with the low-quality image 11 of the input data, and therefore the high-quality equivalent image 13 does not become the desired high-quality image, according to the judgment of the non-conformity detection unit 15. Notify. Thereby, even if the high-quality equivalent image 13 has been improved, the user can understand the model incompatibility, and thus can prevent misjudgment of image content based on the high-quality equivalent image 13.
- the nonconformity countermeasure unit 20 takes measures such as adding a learning target image corresponding to the low-quality image 11 of the input data for which the learning model 14 is determined to be nonconforming to the learning data and performing relearning. As a result, a learning model 14 to which the low-quality image 11 is compatible is created. In this way, by relearning the learning model 14, it is possible to sequentially expand the model conformity region corresponding to the learning model 14. For example, if the learning model is suitable for noise but not for aberrations, the existing model relearning unit 26 performs relearning using both noise images and aberration images to adapt to both. A learning model 14 can be generated.
- the present invention is not limited to the embodiments described above, and includes various modifications.
- the embodiments described above are described in detail to explain the present invention in an easy-to-understand manner, and the present invention is not necessarily limited to having all the configurations described.
- it is possible to replace a part of the configuration of one embodiment with the configuration of another embodiment and it is also possible to add the configuration of another embodiment to the configuration of one embodiment.
- each of the above-mentioned configurations, functions, processing units, processing means, etc. may be partially or entirely realized in hardware by, for example, designing an integrated circuit.
- each of the configurations, functions, etc. described above may be realized by software by a processor interpreting and executing programs for realizing the respective functions.
- Information such as programs, tables, and files that realize each function can be stored in memory, recording devices such as hard disks, SSDs (Solid State Drives), IC (Integrated Circuit) cards, SD cards, DVDs (Digital Versatile Discs), etc. can be stored on a recording medium. It is also possible to utilize the cloud. Further, the control lines and information lines are shown to be necessary for explanation purposes, and not all control lines and information lines are necessarily shown in the product. In reality, almost all configurations may be considered to be interconnected. Furthermore, the communication means for connecting each device is not limited to wireless LAN, but may be changed to wired LAN or other communication means.
- Nonconformity detection unit (nonconformity detection device) 10B Model learning section 11 Low quality image (image before conversion) 12 Image conversion unit 12B Weight correction unit 13 High quality equivalent image (image after conversion) 13B High quality correct image (learning image) 14 Learning model 15 Nonconformity detection section 16 Nonconformity reporting section 20 Nonconformity countermeasures section (nonconformity detection device) 21 Countermeasure method DB 22 Countermeasure method search section 23 Countermeasure method presentation section 24 Relearning data input section 24b Relearning data collection section 25 Use model changing section 26 Existing model relearning section 27 New model learning section 30 Imaging device 31 Electron microscope 32 X-ray tomography device 33 Captured image storage section 40 Image utilization section 41 Image observation processing section 42 Image measurement processing section 43 Image classification processing section 50 Control display section
Landscapes
- Engineering & Computer Science (AREA)
- Physics & Mathematics (AREA)
- General Physics & Mathematics (AREA)
- Theoretical Computer Science (AREA)
- Computer Vision & Pattern Recognition (AREA)
- Quality & Reliability (AREA)
- Image Analysis (AREA)
- Image Processing (AREA)
- Testing, Inspecting, Measuring Of Stereoscopic Televisions And Televisions (AREA)
Priority Applications (7)
| Application Number | Priority Date | Filing Date | Title |
|---|---|---|---|
| JP2024528155A JPWO2023248355A1 (https=) | 2022-06-21 | 2022-06-21 | |
| KR1020247034296A KR20240163122A (ko) | 2022-06-21 | 2022-06-21 | 부적합 검출 장치, 및, 부적합 검출 방법 |
| US18/872,877 US20250356476A1 (en) | 2022-06-21 | 2022-06-21 | Incompatability detection device and incompatability detection method |
| PCT/JP2022/024750 WO2023248355A1 (ja) | 2022-06-21 | 2022-06-21 | 不適合検出装置、および、不適合検出方法 |
| CN202280096731.3A CN119317938A (zh) | 2022-06-21 | 2022-06-21 | 不适合检测装置以及不适合检测方法 |
| TW113137128A TW202507649A (zh) | 2022-06-21 | 2023-05-18 | 不適合檢測裝置及不適合檢測方法 |
| TW112118457A TWI856660B (zh) | 2022-06-21 | 2023-05-18 | 不適合檢測裝置及不適合檢測方法 |
Applications Claiming Priority (1)
| Application Number | Priority Date | Filing Date | Title |
|---|---|---|---|
| PCT/JP2022/024750 WO2023248355A1 (ja) | 2022-06-21 | 2022-06-21 | 不適合検出装置、および、不適合検出方法 |
Publications (1)
| Publication Number | Publication Date |
|---|---|
| WO2023248355A1 true WO2023248355A1 (ja) | 2023-12-28 |
Family
ID=89379603
Family Applications (1)
| Application Number | Title | Priority Date | Filing Date |
|---|---|---|---|
| PCT/JP2022/024750 Ceased WO2023248355A1 (ja) | 2022-06-21 | 2022-06-21 | 不適合検出装置、および、不適合検出方法 |
Country Status (6)
| Country | Link |
|---|---|
| US (1) | US20250356476A1 (https=) |
| JP (1) | JPWO2023248355A1 (https=) |
| KR (1) | KR20240163122A (https=) |
| CN (1) | CN119317938A (https=) |
| TW (2) | TW202507649A (https=) |
| WO (1) | WO2023248355A1 (https=) |
Cited By (1)
| Publication number | Priority date | Publication date | Assignee | Title |
|---|---|---|---|---|
| WO2025243606A1 (ja) * | 2024-05-24 | 2025-11-27 | 浜松ホトニクス株式会社 | 学習方法、推論モデル、ノイズ低減方法、ノイズ低減システム及びノイズ低減プログラム |
Citations (2)
| Publication number | Priority date | Publication date | Assignee | Title |
|---|---|---|---|---|
| JP2019087229A (ja) * | 2017-11-02 | 2019-06-06 | キヤノン株式会社 | 情報処理装置、情報処理装置の制御方法及びプログラム |
| JP2020008904A (ja) * | 2018-07-02 | 2020-01-16 | パナソニックIpマネジメント株式会社 | 学習データ収集装置、学習データ収集システム、及び学習データ収集方法 |
Family Cites Families (9)
| Publication number | Priority date | Publication date | Assignee | Title |
|---|---|---|---|---|
| EP3618077A1 (en) * | 2018-08-27 | 2020-03-04 | Koninklijke Philips N.V. | Generating metadata for trained model |
| US12014530B2 (en) * | 2018-12-21 | 2024-06-18 | Hitachi High-Tech Corporation | Image recognition device and method |
| JP7153142B2 (ja) * | 2019-09-06 | 2022-10-13 | 株式会社日立ハイテク | レシピ情報提示システム、レシピエラー推定システム |
| JPWO2021095256A1 (https=) | 2019-11-15 | 2021-05-20 | ||
| US11544838B2 (en) * | 2020-03-21 | 2023-01-03 | Kla Corporation | Systems and methods of high-resolution review for semiconductor inspection in backend and wafer level packaging |
| US12051183B2 (en) * | 2020-04-30 | 2024-07-30 | KLA Corp. | Training a machine learning model to generate higher resolution images from inspection images |
| US11769242B2 (en) * | 2020-05-21 | 2023-09-26 | Kla Corporation | Mode selection and defect detection training |
| US11776108B2 (en) * | 2020-08-05 | 2023-10-03 | KLA Corp. | Deep learning based defect detection |
| CN114095662B (zh) * | 2022-01-20 | 2022-07-05 | 荣耀终端有限公司 | 拍摄指引方法及电子设备 |
-
2022
- 2022-06-21 CN CN202280096731.3A patent/CN119317938A/zh active Pending
- 2022-06-21 WO PCT/JP2022/024750 patent/WO2023248355A1/ja not_active Ceased
- 2022-06-21 JP JP2024528155A patent/JPWO2023248355A1/ja active Pending
- 2022-06-21 US US18/872,877 patent/US20250356476A1/en active Pending
- 2022-06-21 KR KR1020247034296A patent/KR20240163122A/ko active Pending
-
2023
- 2023-05-18 TW TW113137128A patent/TW202507649A/zh unknown
- 2023-05-18 TW TW112118457A patent/TWI856660B/zh active
Patent Citations (2)
| Publication number | Priority date | Publication date | Assignee | Title |
|---|---|---|---|---|
| JP2019087229A (ja) * | 2017-11-02 | 2019-06-06 | キヤノン株式会社 | 情報処理装置、情報処理装置の制御方法及びプログラム |
| JP2020008904A (ja) * | 2018-07-02 | 2020-01-16 | パナソニックIpマネジメント株式会社 | 学習データ収集装置、学習データ収集システム、及び学習データ収集方法 |
Cited By (1)
| Publication number | Priority date | Publication date | Assignee | Title |
|---|---|---|---|---|
| WO2025243606A1 (ja) * | 2024-05-24 | 2025-11-27 | 浜松ホトニクス株式会社 | 学習方法、推論モデル、ノイズ低減方法、ノイズ低減システム及びノイズ低減プログラム |
Also Published As
| Publication number | Publication date |
|---|---|
| US20250356476A1 (en) | 2025-11-20 |
| TWI856660B (zh) | 2024-09-21 |
| CN119317938A (zh) | 2025-01-14 |
| TW202507649A (zh) | 2025-02-16 |
| KR20240163122A (ko) | 2024-11-18 |
| JPWO2023248355A1 (https=) | 2023-12-28 |
| TW202401358A (zh) | 2024-01-01 |
Similar Documents
| Publication | Publication Date | Title |
|---|---|---|
| TWI857227B (zh) | 生成可用於檢查半導體樣本的訓練資料 | |
| TWI767108B (zh) | 用於檢查半導體試樣的方法與系統及在其上紀錄相關指令的電腦可讀取媒體 | |
| TWI845781B (zh) | 半導體缺陷偵測及分類的方法及系統,以及非暫時性電腦可讀儲存媒體 | |
| TWI731303B (zh) | 產生可用於檢查半導體樣品的訓練集之方法及其系統 | |
| TWI797699B (zh) | 半導體試樣的基於深度學習之檢查的方法及其系統 | |
| US20240193760A1 (en) | System for Detecting Defect and Computer-Readable Medium | |
| TW490591B (en) | Pattern inspection apparatus, pattern inspection method, and recording medium | |
| CN113269709A (zh) | 探测半导体晶片中缺陷的方法及半导体晶片缺陷探测系统 | |
| JP2012032370A (ja) | 欠陥検出方法、欠陥検出装置、学習方法、プログラム、及び記録媒体 | |
| JP2012014475A (ja) | パターンマッチング方法,画像処理装置、及びコンピュータプログラム | |
| JP7530330B2 (ja) | 半導体試料の画像のセグメンテーション | |
| KR102951844B1 (ko) | 결함 검사 장치 | |
| WO2023248355A1 (ja) | 不適合検出装置、および、不適合検出方法 | |
| TWI906907B (zh) | 圖像檢查裝置及圖像處理方法 | |
| JP3652589B2 (ja) | 欠陥検査装置 | |
| KR20220073640A (ko) | 하전 입자 빔 장치 | |
| TWI908645B (zh) | 缺陷檢測裝置、缺陷檢測方法 | |
| TW202530678A (zh) | 用於半導體樣品檢查的缺陷偏移校正 | |
| CN115698690A (zh) | 图像处理方法、形状检查方法、图像处理系统以及形状检查系统 | |
| WO2024023955A1 (ja) | 測長システム、モデル作成システム及び測長方法 |
Legal Events
| Date | Code | Title | Description |
|---|---|---|---|
| 121 | Ep: the epo has been informed by wipo that ep was designated in this application |
Ref document number: 22947917 Country of ref document: EP Kind code of ref document: A1 |
|
| ENP | Entry into the national phase |
Ref document number: 20247034296 Country of ref document: KR Kind code of ref document: A |
|
| WWE | Wipo information: entry into national phase |
Ref document number: 1020247034296 Country of ref document: KR |
|
| WWE | Wipo information: entry into national phase |
Ref document number: 2024528155 Country of ref document: JP |
|
| WWE | Wipo information: entry into national phase |
Ref document number: 202280096731.3 Country of ref document: CN |
|
| WWE | Wipo information: entry into national phase |
Ref document number: 18872877 Country of ref document: US |
|
| WWP | Wipo information: published in national office |
Ref document number: 202280096731.3 Country of ref document: CN |
|
| NENP | Non-entry into the national phase |
Ref country code: DE |
|
| 122 | Ep: pct application non-entry in european phase |
Ref document number: 22947917 Country of ref document: EP Kind code of ref document: A1 |
|
| WWP | Wipo information: published in national office |
Ref document number: 18872877 Country of ref document: US |