WO2023210441A1 - 異常診断装置、異常診断システム、異常診断方法及びプログラム - Google Patents
異常診断装置、異常診断システム、異常診断方法及びプログラム Download PDFInfo
- Publication number
- WO2023210441A1 WO2023210441A1 PCT/JP2023/015466 JP2023015466W WO2023210441A1 WO 2023210441 A1 WO2023210441 A1 WO 2023210441A1 JP 2023015466 W JP2023015466 W JP 2023015466W WO 2023210441 A1 WO2023210441 A1 WO 2023210441A1
- Authority
- WO
- WIPO (PCT)
- Prior art keywords
- frequency band
- mechanical equipment
- abnormality
- current signal
- abnormality diagnosis
- Prior art date
- Legal status (The legal status is an assumption and is not a legal conclusion. Google has not performed a legal analysis and makes no representation as to the accuracy of the status listed.)
- Ceased
Links
Images











Classifications
-
- G—PHYSICS
- G01—MEASURING; TESTING
- G01R—MEASURING ELECTRIC VARIABLES; MEASURING MAGNETIC VARIABLES
- G01R31/00—Arrangements for testing electric properties; Arrangements for locating electric faults; Arrangements for electrical testing characterised by what is being tested not provided for elsewhere
- G01R31/34—Testing dynamo-electric machines
- G01R31/343—Testing dynamo-electric machines in operation
Definitions
- the present disclosure relates to an abnormality diagnosis device, an abnormality diagnosis system, an abnormality diagnosis method, and a program.
- the present disclosure has been made to solve the above-mentioned problems, and aims to provide an abnormality diagnosis device etc. that can accurately diagnose abnormalities due to failure modes accompanied by minute torque fluctuations.
- An abnormality diagnostic device is an abnormality diagnostic device that diagnoses abnormalities in rotating mechanical equipment, and includes a current signal storage unit that stores a current signal of an electric motor, and a waveform of the current signal stored in the current signal storage unit.
- the frequency analysis section performs frequency analysis, and the frequency analysis section performs frequency analysis of the waveform of the current signal.
- the frequency analysis result is a characteristic frequency band that includes multiple spectral peaks within a predetermined frequency range.
- a characteristic frequency band extraction unit extracts data belonging to the characteristic frequency band, detects multiple spectral peaks from the data belonging to the characteristic frequency band, excludes data detected as multiple spectral peaks from the data belonging to the characteristic frequency band, and extracts data belonging to the characteristic frequency band.
- a feature calculation unit that calculates the sum of signal intensities included in data belonging to a characteristic frequency band excluding data detected as a peak, and diagnoses that the rotating mechanical equipment is abnormal if the sum is equal to or greater than a first threshold;
- An abnormality diagnostic device is an abnormality diagnostic device that diagnoses abnormalities in rotating mechanical equipment, and includes a current signal storage unit that stores a current signal of an electric motor, and a waveform of the current signal stored in the current signal storage unit.
- the frequency analysis section performs frequency analysis, and the frequency analysis section performs frequency analysis of the waveform of the current signal.
- the frequency analysis result is a characteristic frequency band that includes multiple spectral peaks within a predetermined frequency range.
- a characteristic frequency band extraction unit that extracts data belonging to the characteristic frequency band
- a characteristic frequency band extracting unit that sorts the data belonging to the characteristic frequency band in order of signal strength, excludes data whose signal strength is equal to or higher than a second threshold from the data belonging to the characteristic frequency band, and extracts the data belonging to the characteristic frequency band.
- a feature calculation unit that calculates the sum of signal intensities included in the data belonging to the characteristic frequency band excluding data whose intensity is greater than or equal to a second threshold;
- An abnormality diagnosis section that diagnoses an abnormality.
- An abnormality diagnosis system is an abnormality diagnosis system that diagnoses abnormalities in rotating mechanical equipment, and includes a current signal storage section that stores a current signal of an electric motor, and a waveform of the current signal stored in the current signal storage section.
- the frequency analysis section performs frequency analysis, and the frequency analysis section performs frequency analysis of the waveform of the current signal.
- the frequency analysis result is a characteristic frequency band that includes multiple spectral peaks within a predetermined frequency range.
- a characteristic frequency band extraction unit extracts data belonging to the characteristic frequency band, detects multiple spectral peaks from the data belonging to the characteristic frequency band, excludes data detected as multiple spectral peaks from the data belonging to the characteristic frequency band, and extracts data belonging to the characteristic frequency band.
- a feature calculation unit that calculates the sum of signal intensities included in data belonging to a characteristic frequency band excluding data detected as a peak, and diagnoses that the rotating mechanical equipment is abnormal if the sum is equal to or greater than a first threshold;
- An abnormality diagnosis system is an abnormality diagnosis system that diagnoses abnormalities in rotating mechanical equipment, and includes a current signal storage section that stores a current signal of an electric motor, and a waveform of the current signal stored in the current signal storage section.
- the frequency analysis section performs frequency analysis, and the frequency analysis section performs frequency analysis of the waveform of the current signal.
- the frequency analysis result is a characteristic frequency band that includes multiple spectral peaks within a predetermined frequency range.
- a characteristic frequency band extraction unit that extracts data belonging to the characteristic frequency band
- a characteristic frequency band extracting unit that sorts the data belonging to the characteristic frequency band in order of signal strength, excludes data whose signal strength is equal to or higher than a second threshold from the data belonging to the characteristic frequency band, and extracts the data belonging to the characteristic frequency band.
- a feature calculation unit that calculates the sum of signal intensities included in the data belonging to the characteristic frequency band excluding data whose intensity is greater than or equal to a second threshold;
- An abnormality diagnosis section that diagnoses an abnormality.
- the abnormality diagnosis method includes a current signal detection step for detecting a current signal flowing through a motor, a frequency analysis step for frequency analyzing the waveform of the current signal detected in the current signal detection step, and a frequency analysis step for detecting the current signal.
- a characteristic frequency band extraction step of extracting data belonging to the characteristic frequency band so as to include a plurality of spectral peaks within a predetermined frequency range in the frequency analysis result that is the result of frequency analysis of the waveform of the characteristic frequency.
- a data exclusion step that detects multiple spectral peaks from data belonging to a band and excludes data detected as multiple spectral peaks from data belonging to a characteristic frequency band, and a feature that excludes data detected as multiple spectral peaks.
- the present invention is characterized by comprising an abnormality diagnosis step of diagnosing that the mechanical equipment is abnormal.
- An abnormality diagnosis method is an abnormality diagnosis method for diagnosing an abnormality in rotating mechanical equipment, and includes a current signal detection step of detecting a current signal flowing in an electric motor, and a waveform of the current signal detected in the current signal detection step.
- the frequency analysis step analyzes the frequency of the current signal waveform.
- the characteristic frequency band is determined to include multiple spectral peaks within a predetermined frequency range.
- a feature frequency band extraction step for extracting data belonging to the feature frequency band, and data for sorting the data belonging to the feature frequency band in order of signal strength and excluding data whose signal strength is equal to or greater than a second threshold from the data belonging to the feature frequency band.
- an exclusion step a feature quantity calculation step of calculating the sum of signal intensities included in the data belonging to the characteristic frequency band from which data whose signal strength is greater than or equal to a second threshold value is excluded, and whether or not the sum is greater than or equal to the first threshold.
- an abnormality diagnosis step of diagnosing the rotating mechanical equipment as abnormal if the total sum is greater than or equal to a first threshold value.
- a program according to the present disclosure is a program for diagnosing an abnormality in rotating mechanical equipment, and includes a current signal detection step of detecting a current signal flowing through an electric motor, and a waveform of the current signal detected in the current signal detection step.
- the frequency analysis step analyzes the waveform of the current signal.
- a characteristic frequency band extraction step for extracting data belonging to the characteristic frequency band; and a data exclusion step for detecting a plurality of spectral peaks from the data belonging to the characteristic frequency band and excluding data detected as the plurality of spectral peaks from the data belonging to the characteristic frequency band.
- a program according to the present disclosure is a program for diagnosing an abnormality in rotating mechanical equipment, and includes a current signal detection step of detecting a current signal flowing through an electric motor, and a waveform of the current signal detected in the current signal detection step.
- the frequency analysis step analyzes the waveform of the current signal.
- a characteristic frequency band extraction step for extracting data belonging to the characteristic frequency band; and a data exclusion step for detecting a plurality of spectral peaks from the data belonging to the characteristic frequency band and excluding data detected as the plurality of spectral peaks from the data belonging to the characteristic frequency band.
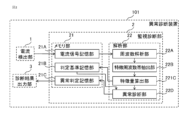
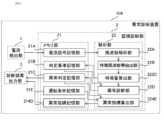
- FIG. 1 is a diagram showing a schematic configuration of an abnormality diagnosis device according to Embodiment 1.
- FIG. 1 is a diagram showing a schematic configuration of an abnormality diagnosis device according to Embodiment 1.
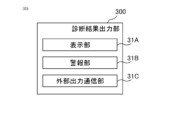
- FIG. 1 is a diagram showing a schematic configuration of a diagnosis result output unit according to Embodiment 1.
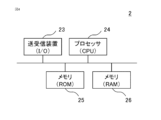
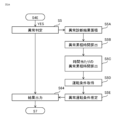
- FIG. 3 is a diagram showing a hardware configuration of a monitoring and diagnosis section according to the first embodiment. 3 is a flowchart showing a processing flow of the abnormality diagnosis device according to Embodiment 1.
- FIG. 5 is a diagram showing an example of a waveform of a current signal measured by the current detection section according to the first embodiment.
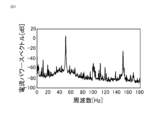
- FIG. 3 is a diagram showing an example of a frequency analysis result of a current signal measured by the current detection unit according to the first embodiment.
- FIG. 3 is a diagram showing an example of a frequency analysis result of a current signal measured by the current detection unit according to the first embodiment.
- FIG. 3 is a diagram showing an example of a frequency analysis result of a current signal measured by the current detection unit according to the first embodiment.
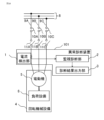
- FIG. 3 is a diagram showing another schematic configuration of the abnormality diagnosis device according to the first embodiment.
- FIG. 3 is a diagram showing another schematic configuration of the abnormality diagnosis device according to the first embodiment.
- 12 is a schematic configuration diagram of the circuit of FIG. 11.
- FIG. 2 is a diagram showing a schematic configuration of an abnormality diagnosis system according to a first modification of the first embodiment; FIG. FIG.
- FIG. 3 is a diagram showing a schematic configuration of an abnormality diagnosis system according to a second modification of the first embodiment.
- FIG. 2 is a diagram showing a schematic configuration of an abnormality diagnosis device according to a second embodiment.
- 7 is a flowchart showing a processing flow of the abnormality diagnosis device according to Embodiment 2.
- FIG. FIG. 7 is a diagram showing an example of a frequency analysis result of a current signal measured by the current detection unit according to the second embodiment.
- 7 is a diagram illustrating an example of sort data according to Embodiment 2.
- FIG. FIG. 3 is a diagram showing a schematic configuration of an abnormality diagnosis system according to a first modification of the second embodiment.
- FIG. 7 is a diagram showing a schematic configuration of an abnormality diagnosis system according to a second modification of the second embodiment.
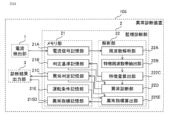
- FIG. 3 is a diagram showing a schematic configuration of an abnormality diagnosis device according to Embodiment 3.
- FIG. 7 is a flowchart showing a processing flow of the abnormality diagnosis device according to Embodiment 3.
- FIG. 7 is a diagram showing a schematic configuration of an abnormality diagnosis device according to a fourth embodiment.
- 12 is a flowchart showing a processing flow of the abnormality diagnosis device according to Embodiment 4.
- FIG. 7 is a diagram showing a schematic configuration of an abnormality diagnosis device according to a fifth embodiment. 12 is a flowchart showing a processing flow of the abnormality diagnosis device according to Embodiment 5.
- an abnormality diagnosis device 101 in this embodiment will be explained using FIGS. 1 to 9.
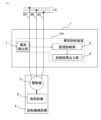
- an abnormality diagnosis device 101 includes a current detection section 1 connected to any one of wirings 9A, 9B, and 9C connected to an electric motor 5, a monitoring diagnosis section 2, and a diagnosis result output section 3. .
- the current detection unit 1 measures the current flowing through the wirings 9A, 9B, and 9C, and thereby obtains the drive current that drives the electric motor 5.
- the current detection unit 1 outputs the acquired drive current to the monitoring and diagnosis unit 2 as a current signal.
- the monitoring and diagnosis section 2 determines whether the rotating mechanical equipment 4 is abnormal. When the monitoring and diagnosis section 2 determines that there is an abnormality in the rotating mechanical equipment 4, the monitoring and diagnosis section 2 sends the determination result to the diagnosis result output section 3.
- the diagnosis result output unit 3 notifies the person in charge of monitoring whether or not an abnormality has occurred.
- the electric motor 5 is a three-phase AC motor, connected to a commercial power source 8 via an inverter 7, and driven by the inverter 7.
- the inverter 7 is connected to a commercial power source 8 and is configured by combining an AC-DC converter that converts AC power from the commercial power source 8 into DC power and a DC-AC converter that converts DC power into AC power. , supplies the AC power converted by the DC-AC converter to the electric motor 5.
- the rotating mechanical equipment 4 includes an electric motor 5 and a load equipment 6 that is connected to the electric motor 5 and uses the electric motor 5 as a power source.
- the load equipment 6 is a water pump, a vacuum pump, a fan, a blower, etc. that are driven by the electric motor 5 as a power source.
- the abnormality diagnosis device 101 is applied to a public plant monitoring and control system including water treatment plants such as water purification plants and sewage treatment plants.
- Load equipment 6 such as a water intake pump and a water supply pump used in a water treatment plant is driven by an electric motor 5.
- the abnormality diagnosis device 101 uses a current signal acquired from the current detection unit 1 connected to any of the wirings 9A, 9B, and 9C connected to the electric motor 5 to detect the load equipment 6 and the electric motor in the monitoring and diagnosis unit 2.
- the abnormality diagnosis of the rotating mechanical equipment 4 consisting of 5 is performed.
- the abnormality of the rotating mechanical equipment 4 determined by the monitoring and diagnosis section 2 is sent to the diagnosis result output section 3, which notifies the operation management operator of the water treatment plant of the presence or absence of an abnormality.
- the rotating mechanical equipment 4 includes an electric motor 5 driven by an inverter 7 and a water pump as a load equipment 6, and by analyzing the current signal input from the current detection unit 1, An example of diagnosing an abnormality due to cavitation in a water pump accompanied by minute torque fluctuations will be explained.
- Cavitation is a phenomenon in which when a liquid is in a low pressure state, the liquid evaporates and bubbles are generated. Further, if the liquid is no longer in a low pressure state again after bubbles are generated, the generated bubbles disappear with a large impact. Therefore, when cavitation occurs within the water pump, the generated bubbles obstruct the flow of liquid within the water pump, reducing the pumping capacity of the water pump. In addition, as cavitation disappears within the water pump, there is a risk that abnormalities such as damage to the water pump and the formation of through holes may occur due to the impact generated when the bubbles disappear.
- the current detection section 1 is connected to one of the commercial power sources 8 connected to the electric motor 5, but it is also possible to install the current detection section 1 in each phase of the commercial power source 8. It's okay. Even in this case, it is sufficient to measure either phase.
- failure modes other than cavitation in water pumps include entrapment of foreign matter in water pumps, entrapment of air, accumulation of byproducts in vacuum pumps, wear of bearings, and loss of blades in fans.
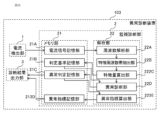
- the monitoring and diagnosis section 2 includes a memory section 21 and an analysis section 22.
- the memory section 21 includes a current signal storage section 21A, a determination criterion storage section 21B, and an abnormality determination storage section 21C.
- the analysis section 22 includes a frequency analysis section 22A, a characteristic frequency band extraction section 22B, a feature amount calculation section 221C, and an abnormality diagnosis section 22D.
- the diagnosis result output section 3 includes a display section 31A, an alarm section 31B, and an external output communication section 31C.
- FIG. 4 is a diagram showing the hardware configuration of the monitoring and diagnosis section 2 in this embodiment.
- the monitoring diagnostic unit 2 includes a transmitting/receiving device 23, a processor (CPU: Central Processing Unit) 24, a memory (ROM: Read Only Memory) 25, and a memory (RAM: Random Access Memory) 26.
- the monitoring diagnosis unit 2 diagnoses abnormalities in the rotating mechanical equipment 4 by having the processor 24 process a program stored in advance in the memory 25, and outputs the diagnosis result.
- various functional modules are realized by the processor 24 executing a predetermined program stored in the memory 25.
- the functional module includes an analysis section 22.
- the memory 25 and the memory 26 include a memory section 21.
- the transmitting/receiving device 23 transmits and receives signals between the current detecting section 1 connected to the monitoring and diagnosing section 2 and the diagnosis result output section 3 connected to the monitoring and diagnosing section 2 .
- each functional module of the monitoring and diagnosis unit 2 may be realized by the processor 24 executing software processing according to a preset program as described above, or at least a part of the functional modules may be realized by implementing the functions corresponding to each functional module.
- the predetermined numerical/logical calculation process may be executed by hardware such as an electronic circuit having the following.
- FIG. 5 Using FIG. 5, a detailed description of each component included in the abnormality diagnosing apparatus 101 and a processing flow of the abnormality diagnosing apparatus 101 in this embodiment will be described. A flowchart consisting of the steps shown below is repeatedly executed every time a predetermined condition is satisfied.
- step S1 the current detection section 1 measures the current flowing through the motor 5, and outputs a current signal to the current signal storage section 21A.
- the current signal storage unit 21A stores current signals.
- FIG. 6 is a diagram showing the waveform of the current signal detected by the current detection section 1. The vertical axis represents current value, and the horizontal axis represents time. The waveform of the current signal is shown by a dotted line (U phase), a broken line (V phase), and a solid line (W phase).
- step S2 the frequency analysis section 22A performs frequency analysis on the waveform of the current signal acquired from the current signal storage section 21A.
- FIG. 7 is a diagram showing a frequency analysis result of the waveform of the U-phase current signal indicated by the dotted line in FIG.
- the vertical axis shows the current power spectrum
- the horizontal axis shows the frequency.
- the frequency analysis results shown in FIG. 7 show a case where the power supply frequency is 50 Hz, and have spectrum peaks at 50 Hz, which is the power supply frequency, and at 150 Hz, which is the third-order component of the power supply frequency.
- the power supply frequency is the frequency of the commercial power supply 8
- the third-order component of the power supply frequency is a frequency three times the power supply frequency.
- x is an integer greater than or equal to 0.
- the reason why the frequency analysis result shown in FIG. 7 has a spectral peak at the power frequency and the third-order component of the power frequency will be explained.
- the operation of the converter circuit converts a fundamental wave with the power supply frequency and a frequency that is an integral multiple of the power supply frequency.
- a current with a distorted waveform is generated, which is a combination of harmonics. This distorted waveform of current affects the voltage waveform and distorts it.
- current with a distorted waveform flows through devices to which a voltage with a distorted waveform is applied.
- the frequency analysis results shown in FIG. 7 have spectral peaks at the power supply frequency and the third order component of the power supply frequency. Further, in this embodiment, an example in which the waveform of the U-phase current signal is frequency-analyzed has been shown, but current signals of a single phase, a plurality of phases, or all phases may be frequency-analyzed.
- FIG. 7 shows an example in which the power supply frequency is 50 Hz, in the following description of the processing flow of the abnormality diagnosis apparatus 101, the processing flow in the case where the power supply frequency is 60 Hz will be described.
- the characteristic frequency band extraction unit 22B extracts data belonging to the characteristic frequency band so as to include a plurality of spectral peaks within a predetermined frequency range.
- data belonging to a characteristic frequency band is extracted so as to include a plurality of spectral peaks within the frequency range from the zero-order component to the second-order component of the power supply frequency.
- the frequency range from 0Hz, which is the zero-order component of the power supply frequency, to 120Hz, which is the second-order component is determined as a characteristic frequency band.
- the characteristic frequency band refers to a frequency range used for calculating a characteristic amount, which will be described later.
- the reason why the frequency range from the zero-order component to the second-order component of the power supply frequency is set as a characteristic frequency band and data belonging to this characteristic frequency band is extracted will be explained.
- the torque of the electric motor 5 required to drive the load equipment 6 varies slightly compared to a case where cavitation does not occur.
- the torque of the electric motor 5 is determined by the current value, slight fluctuations in the torque of the electric motor 5 also affect the drive current of the electric motor 5.
- the signal strength increases in the frequency range from the zero-order component to the second-order component of the power supply frequency, which is a frequency range near the power supply frequency.
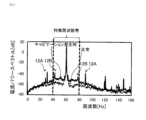
- FIG. 8 is an example of a graph comparing the frequency analysis results of the current signal when a minute torque fluctuation occurs in the load equipment 6 and when it does not occur.
- the vertical axis shows the current power spectrum, and the horizontal axis shows the frequency.
- a solid line indicates a minute torque fluctuation occurs, and a dotted line indicates a case where a minute torque fluctuation does not occur.
- the power supply frequency is 60 Hz
- the rotation frequency of the electric motor 5 is 30 Hz.
- the rotational frequency is the rotational speed of the electric motor 5 expressed as a frequency.
- the signal strength when minute torque fluctuations occur is higher than when no minute torque fluctuations occur, as the signal strength increases on the low frequency side and high frequency side around the power supply frequency of 60Hz. It can be confirmed that the increase occurs in the frequency range of ⁇ 40 Hz, that is, in the frequency range of 20 Hz to 100 Hz. For this reason, the frequency range from 0 Hz, which is the zero-order component of the power supply frequency, to 120 Hz, which is the second-order component, is extracted as a characteristic frequency band.
- Fig. 8 shows the influence of minute torque fluctuations in the frequency range from the zero-order component to the second-order component of the power supply frequency, which is the frequency range near the power supply frequency, in the frequency range near the fifth-order component of the power supply frequency
- the influence of minute torque fluctuations occurs in the frequency range from the 4th component to the 6th component of a certain power supply frequency, and in the frequency range from the 6th component to the 8th component of the power supply frequency, which is the frequency range near the 7th component of the power supply frequency.
- a plurality of spectral peaks appear on both sides of the power supply frequency within the frequency range from the zero-order component to the second-order component of the power supply frequency.
- a spectrum 12A of a sideband component of a modulated wave which will be described later, appears as a spectrum peak at frequencies of the power supply frequency ⁇ rotation frequency, that is, 30 Hz and 90 Hz.
- a spectrum 12B of a noise component resulting from the switching operation of the inverter 7, which will be described later appears as a spectrum peak.
- the modulated wave is one of the elements used in PWM (Pulse Width Modulation) control, which is a power control method for a DC-AC inverter.
- PWM Pulse Width Modulation
- the modulated wave is a fundamental wave
- the modulated wave frequency which is the frequency of the modulated wave
- the sideband components of the modulated wave depend on the rotational frequency of the electric motor 5 and appear at frequencies shifted by the rotational frequency on both sides of the modulated wave frequency.
- a spectrum 12A of sideband components of the modulated wave appears at a frequency of the power supply frequency ⁇ rotation frequency.
- Noise components caused by the switching operation of the inverter 7 are output from the AC-DC converter due to the switching operation of the inverter circuit when the DC-AC inverter converts DC power into AC power during the power conversion process by the inverter 7.
- the DC voltage output to the electric motor 5 and the AC voltage output to the motor 5 vary slightly at the power supply frequency and a frequency that is an integral multiple of the power supply frequency.
- the slightly fluctuated value appears as a spectrum 12B of noise components caused by the switching operation of the inverter 7.
- the noise component spectrum 12B appears at the power supply frequency ⁇ 20 Hz, but it may also appear at a frequency different from the power supply frequency ⁇ 20 Hz depending on the control method, type, etc. of the inverter 7 used.
- the spectrum 12A of the sideband component of the modulated wave and the spectrum 12B of the noise component resulting from the switching operation of the inverter 7 are examples of noise generated due to the influence of inverter driving.
- the sideband component spectrum 12A and the noise component spectrum 12B appear within the frequency range from the zero-order component to the second-order component of the power supply frequency, if an abnormality other than cavitation occurs at the same time, A spectrum peak different from the sideband component spectrum 12A and the noise component spectrum 12B may appear in the frequency range.
- the present invention is not limited to this. Even if data belonging to a characteristic frequency band is extracted so as to include multiple spectral peaks within the frequency range from the 4th to the 6th component of the power supply frequency, or the frequency range from the 6th to the 8th component of the power supply frequency, etc. good.
- the frequency range included in the frequency range of 0Hz to 120Hz the frequency range of 200Hz to 360Hz, the frequency range of 300Hz to 480Hz, etc.
- Data belonging to the characteristic frequency band may be extracted so as to include a plurality of spectral peaks.
- FIG. 9 is a diagram showing a case where data belonging to a characteristic frequency band, that is, a frequency range of 0 to 120 Hz is extracted from a graph comparing the frequency analysis results of the current signals shown in FIG.
- the characteristic frequency band extraction unit 22B extracts data belonging to the characteristic frequency band as shown in FIG. 9 from the frequency analysis result data of the U-phase current signal input from the frequency analysis unit 22A. do.
- the feature value calculation unit 221C calculates the spectrum of the power frequency, the spectrum of the secondary component of the power frequency, and the spectrum of the sideband component from the data belonging to the characteristic frequency band input from the characteristic frequency band extraction unit 22B.
- the spectrum 12A and the noise component spectrum 12B are detected as spectrum peaks and excluded.
- a method for detecting spectral peaks there is a method of detecting a predetermined number of data belonging to a characteristic frequency band, starting from the highest signal strength, as spectral peaks.
- the characteristic frequency band is divided into predetermined frequency increments, and in each divided range, the average value of each signal strength within each range is taken, and each signal strength within each divided range is calculated.
- a method may be used in which data with a signal strength exceeding the average value is detected as a spectral peak by comparing the signal strength with the average value.
- step S31 When step S31 is applied to the data belonging to the characteristic frequency band in FIG. 9, from the data belonging to the characteristic frequency band, the spectrum of the power supply frequency, the spectrum of the secondary component of the power supply frequency, the spectrum 12A of the sideband component, and the spectrum 12B of the noise component. is detected as a spectral peak and excluded.
- the reason why the spectral peak is excluded from the data belonging to the characteristic frequency band in step S31 of FIG. 5 will be explained.
- the frequency characteristic of the current signal affected by the minute torque fluctuation is such that the signal strength increases in the frequency range of ⁇ 40 Hz of the power supply frequency.
- the increase in signal strength in the characteristic frequency band is also minute compared to the spectral peak.
- a spectral peak is included in the data belonging to the characteristic frequency band, there is a possibility that a minute change in signal strength will be buried in the spectral peak. For this reason, the spectral peak is excluded from the data belonging to the characteristic frequency band in step S31.
- the feature quantity calculation unit 221C calculates a feature quantity from data belonging to the characteristic frequency band excluding the spectral peak.
- the feature amount can be calculated by using data belonging to the characteristic frequency band excluding the spectral peak and calculating the sum of all signal intensities included in this data. That is, in this embodiment, the feature amount is the sum of all signal intensities included in the data belonging to the characteristic frequency band excluding the spectral peak.
- the signal strength refers to a current value or a current power spectrum.
- the feature amount corresponds to the sum of all current power spectra included in the data belonging to the feature frequency band excluding the spectral peak.
- step S4A of FIG. 5 the feature value calculation unit 221C determines whether the initial learning recording period T is smaller than the predetermined period T0 , where the initial learning recording period is T and the predetermined period is T0 . Determine whether
- the initial learning record means calculating the feature amount in step S41 during a predetermined period from the start of driving of the rotating mechanical equipment 4, and storing the feature amount in the judgment criterion storage unit 21B.
- the learning record period is a predetermined period during which initial learning records are repeatedly executed in order to generate determination criteria to be described later.
- step S4A YES
- step S4B if the initial learning recording period T is greater than or equal to the predetermined period T 0 (In the case of step S4A: NO), the process advances to step S4E.
- the case where the initial learning recording period T is smaller than the predetermined period T0 refers to the period from the start of driving the rotating mechanical equipment 4 to the initial learning recording period, and the initial learning recording period T is less than the predetermined period T0.
- the period T0 or longer refers to a period during which the abnormality diagnosis device 101 diagnoses the abnormality of the rotating mechanical equipment 4 after the initial learning recording period ends.
- step S4B the feature amount calculation unit 221C stores the feature amount in the determination criterion storage unit 21B and performs initial learning recording. Then, in step S4C, the feature value calculation unit 221C determines whether the initial learning recording period T is smaller than a predetermined period T0 . If the initial learning recording period T is smaller than the predetermined period T 0 (step S4C: YES), the process advances to step S1, and if the initial learning recording period T is greater than or equal to the predetermined period T 0 (In the case of step S4C: NO), the process advances to step S4D.
- step S4D the feature quantity calculation unit 221C performs statistical processing on the feature quantities accumulated in the determination criterion storage unit 21B during a predetermined period T0 from the start of driving of the rotating mechanical equipment 4 based on the initial learning record.
- a determination criterion that is a first threshold value is generated, and the generated determination criterion is stored in the determination criterion storage section 21B.
- a statistical processing method for generating the criterion there is a method of generating the criterion by calculating the average, dispersion ⁇ , 2 ⁇ , 3 ⁇ , etc. of the feature amounts accumulated in the criterion storage unit 21B.
- step S4E the abnormality diagnosis unit 22D determines whether the feature amount is greater than or equal to the first threshold value. If the feature amount is greater than or equal to the first threshold (step S4E: YES), the process proceeds to step S5, and if the feature amount is smaller than the first threshold (step S4E: NO), the process continues. Proceed to step S7.
- step S5 the abnormality diagnosis section 22D diagnoses that the rotating mechanical equipment 4 is abnormal, and outputs the diagnosis result to the abnormality determination storage section 21C.
- the feature quantity calculation unit 221C calculates the judgment criterion data because if the number of data of the criterion generated by the initial learning differs from the number of data of the feature quantity, the comparison between the criterion and the feature quantity cannot be performed accurately. Processing is performed to match the number and the number of feature data. If the number of criteria data is greater than the number of feature data, data with high signal strength is sequentially removed from the criteria data to match the number of criteria data and feature data. Furthermore, if the number of data for the criterion is smaller than the number of data for the feature, data with high signal strength is sequentially excluded from the data for the feature to match the number of data for the feature and the number of criteria.
- the number of data for the judgment criterion and the number of data for the feature amount are different when the resolution of frequency analysis is the same, but the frequency range of the feature frequency band when extracting data belonging to the feature frequency band is different. etc.
- step S6 the diagnosis result output unit 3 acquires the diagnosis result from the abnormality determination storage unit 21C.
- the diagnosis result output unit 3 displays the diagnosis result on a display unit 31A such as a display, and the alarm unit 31B sounds an alarm or outputs an abnormality lamp when the rotating mechanical equipment 4 is diagnosed as abnormal.
- the external output communication unit 31C issues an alarm by lighting or blinking, and the external output communication unit 31C transmits the diagnosis result to an external device such as a control device panel, a PC (Personal Computer), or a cloud server.
- step S7 the abnormality diagnosis section 22D determines whether or not to continue the abnormality diagnosis. If the abnormality diagnosis is to be continued (step S7: YES), the process proceeds to step S1, and if the abnormality diagnosis is not to be continued (step S7: NO), the process is ended.
- a method for determining whether or not to continue abnormality diagnosis is to preset a period for continuing abnormality diagnosis in the abnormality diagnosis unit 22D, and if the period for continuing abnormality diagnosis is exceeded, it is determined that abnormality diagnosis is not to be continued.
- Examples include methods.
- the period during which the abnormality diagnosis is continued may be the period during which the rotating mechanical equipment 4 is in operation. In this way, an abnormality in the rotating mechanical equipment 4 is diagnosed through steps S1 to S7 in FIG.
- the abnormality diagnosis device 101 of the present embodiment compares the sum of all signal intensities included in the data belonging to the characteristic frequency band excluding data detected as spectral peaks with the first threshold value. Then, abnormality diagnosis of the rotating mechanical equipment 4 is performed. This prevents minute changes in signal strength due to minute torque fluctuations from being buried in spectrum peaks, improves the detection accuracy of minute torque fluctuations, and as a result, detects abnormalities caused by failure modes accompanied by minute torque fluctuations. can be diagnosed with high accuracy.
- the abnormality diagnosis device 101 of the present embodiment is an abnormality diagnosis device 101 that diagnoses abnormalities in the rotating mechanical equipment 4, and includes a current signal storage section 21A that stores the current signal of the electric motor 5, and a current signal storage section.
- a frequency analysis section 22A performs frequency analysis on the waveform of the current signal stored in 21A, and a frequency analysis result that is the result of the frequency analysis performed by the frequency analysis section 22A on the waveform of the current signal, within a predetermined frequency range.
- a characteristic frequency band extraction unit 22B extracts data belonging to a characteristic frequency band so as to include a plurality of spectral peaks, and a characteristic frequency band extraction unit 22B detects a plurality of spectral peaks from data belonging to the characteristic frequency band and extracts a plurality of spectra from data belonging to the characteristic frequency band.
- a feature amount calculation unit 221C that calculates the sum of signal intensities included in data belonging to a characteristic frequency band excluding data detected as a peak and data detected as a plurality of spectral peaks;
- An abnormality diagnosis unit 22D is provided, which diagnoses that the rotating mechanical equipment 4 is abnormal when the rotational mechanical equipment 4 is equal to or larger than the threshold value. In this way, minute changes in signal strength due to minute torque fluctuations are prevented from being buried in spectrum peaks, improving detection accuracy of minute torque fluctuations, and as a result, failure modes accompanied by minute torque fluctuations can be prevented. It is possible to accurately diagnose abnormalities caused by
- the abnormality diagnosis method of the present embodiment includes the current signal detection step S1 for detecting the current signal flowing through the electric motor 5, and the frequency analysis step S2 for frequency analyzing the waveform of the current signal detected in the current signal detection step S1.
- the frequency analysis step S2 extracts data belonging to a characteristic frequency band so as to include a plurality of spectral peaks within a predetermined frequency range.
- a characteristic frequency band extraction step S3 a characteristic frequency band extraction step S3; a data exclusion step S31 of detecting a plurality of spectral peaks from data belonging to the characteristic frequency band and excluding data detected as the plurality of spectral peaks from data belonging to the characteristic frequency band; A feature calculation step S41 of calculating the sum of signal intensities included in data belonging to the characteristic frequency band excluding data detected as a spectral peak, and a judgment step S4E of determining whether the sum is equal to or greater than a first threshold value. and an abnormality diagnosis step S5 in which the rotating mechanical equipment 4 is diagnosed as abnormal if the sum is equal to or greater than a first threshold value.
- minute changes in signal strength due to minute torque fluctuations are prevented from being buried in spectrum peaks, improving detection accuracy of minute torque fluctuations, and as a result, failure modes accompanied by minute torque fluctuations can be prevented. It is possible to accurately diagnose abnormalities caused by
- the program of the present embodiment is a program for diagnosing an abnormality in the rotating mechanical equipment 4, and is configured to cause the computer to perform the current signal detection step S1 for detecting the current signal flowing through the electric motor 5, and the current signal detection step S1.
- the frequency analysis step S2 performs frequency analysis on the waveform of the detected current signal
- the frequency analysis step S2 performs frequency analysis on the waveform of the current signal.
- a characteristic frequency band extraction step S3 in which data belonging to the characteristic frequency band is extracted so as to include the spectral peak, and a plurality of spectral peaks are detected from the data belonging to the characteristic frequency band, and a plurality of spectral peaks are extracted from the data belonging to the characteristic frequency band.
- a data exclusion step S31 for excluding detected data
- a feature calculation step S41 for calculating the sum of signal intensities included in data belonging to the characteristic frequency band from which data detected as a plurality of spectral peaks have been excluded
- a determination step S4E in which it is determined whether or not is greater than or equal to a first threshold value
- an abnormality diagnosis step S5 in which the rotating mechanical equipment 4 is diagnosed as abnormal if the sum is greater than or equal to the first threshold value are executed.
- the electric motor 5 is driven by the inverter 7, but as shown in FIG. It may be connected to the commercial power source 8 via the contactors 11A, 11B, and 11C, and may be driven by the commercial power source 8.
- the abnormality diagnosis device 101 has been shown as having the current detection section 1, the monitoring diagnosis section 2, and the diagnosis result output section 3, but the current detection section 1 and the diagnosis result output section 3 are may be provided in an external device different from the abnormality diagnosis device 101.
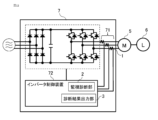
- the abnormality diagnosis device 101 includes a current detection unit 71 built in the inverter 7 and configured to detect the current flowing through the AC bus of the electric motor 5 for inverter control; At least one of the current detection section 1, the monitoring diagnosis section 2, and the diagnosis result output section 3 may be implemented in the inverter 7 by utilizing an inverter control device 72 composed of a processor (CPU) and a memory.
- FIG. 12 is a schematic diagram showing the functional configuration diagram of FIG. 11 as a circuit.
- FIG. 12 shows an example in which the current detection section 1, the monitoring and diagnosis section 2, and the diagnosis result output section 3 are all implemented in the inverter 7.
- the hardware configuration of the inverter control device 72 is similar to the hardware configuration of the monitoring and diagnosis section 2 shown in FIG. It is configured to include a transmitting/receiving device 23, a processor (CPU: Central Processing Unit) 24, a memory (ROM: Read Only Memory) 25, and a memory (RAM: Random Access Memory) 26.
- the inverter control device 72 has the processor 24 process a program stored in advance in the memory 25 to obtain current information flowing through the electric motor 5 from the output result of the current detection unit 71 and a rotation angle sensor (not shown in the figure) provided in the electric motor 5.
- 3-phase/dq conversion is performed from the motor angle detected in (omitted), the d-axis current detection value and the q-axis current detection value are detected and stored in the memory 26, and this and the d-axis given from the host controller are The current command value and the q-axis current command value are compared to calculate the d-axis voltage command value and the q-axis voltage command value.
- the calculated d-axis and q-axis voltage command values and the rotational position information of the motor 5 are converted into two-phase and three-phase data, and the voltage command values are output to the windings of the motor 5 by the transmitting/receiving device 23.
- the inverter control device 72 can be equipped with the monitoring diagnosis section 2 and the diagnosis result output section 3.
- the processor 24 and memories 25 and 26 of the inverter control device 72 can be equipped with the monitoring diagnosis section 2 and the diagnosis result output section 3.
- data belonging to the characteristic frequency band is extracted so as to include a plurality of spectral peaks in the frequency range from the zero-order component to the second-order component of the power supply frequency, and the data belonging to the extracted characteristic frequency band is
- the data belonging to the extracted characteristic frequency band is We have shown an example of diagnosing abnormalities in rotating mechanical equipment using Abnormality diagnosis of rotating mechanical equipment may be performed using the data belonging to the band. For example, in the frequency range from the 0th component to the 2nd component of the power supply frequency and the frequency range from the 4th to 6th component of the power supply frequency, data belonging to the characteristic frequency is extracted so as to include multiple spectral peaks.
- the judgment criteria used for abnormality diagnosis are accumulated by repeatedly performing initial learning recording in which calculated feature quantities are accumulated in the judgment criterion storage unit 21B for a predetermined period from the start of driving of the rotating mechanical equipment.
- predetermined criteria may be set and stored in the criteria storage unit 21B in advance.
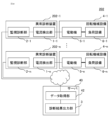
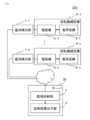
- FIG. 13 is a diagram showing an abnormality diagnosis system 201 according to the first modification of the first embodiment.
- the configuration example shown in FIG. 1 includes an abnormality diagnosis device 101 in which a current detection section 1, a monitoring diagnosis section 2, and a diagnosis result output section 3 are integrated. Diagnosis is performed, and the abnormality diagnosis system 201 shown in FIG.
- the current detection units 1-1 to 1-n are connected to rotating mechanical equipment 4-1 to 4-n, and the current detection units 1-1 to 1-n and the server 30 are connected via a network.
- Connected. n is the number of rotating mechanical equipment 4-1 to 4-n, and is an integer of 1 or more.
- the current detection units 1-1 to 1-n measure current signals of the corresponding rotating mechanical equipment 4-1 to 4-n, respectively.
- the monitoring and diagnosis section 2 of the abnormality diagnosis system 201 acquires current signals from the current detection sections 1-1 to 1-n corresponding to the rotating mechanical equipment 4-1 to 4-n via the network.
- the other operations and configuration of the abnormality diagnosis system 201 are the same as those shown in the first embodiment.
- the abnormality diagnosis system 201 shown in the modified example of FIG. 13 has the effect that it is not necessary to provide the abnormality diagnosis device 101 in each rotating mechanical equipment 4-1 to 4-n.
- the electric motors 5-1 to 5-n may be of the same model, or at least some of them may be of a different model from the other electric motors 5-1 to 5-n. Good too.
- the load equipment 6-1 to 6-n may be of the same type, or may be at least partially different from other types.
- the abnormality diagnosis system 201 of the present embodiment is an abnormality diagnosis system 201 that diagnoses abnormalities in the rotating mechanical equipment 4, and includes a current signal storage section 21A that stores current signals of the electric motor 5, and a current signal storage section.
- a frequency analysis section 22A performs frequency analysis on the waveform of the current signal stored in 21A, and a frequency analysis result that is the result of the frequency analysis performed by the frequency analysis section 22A on the waveform of the current signal, within a predetermined frequency range.
- a characteristic frequency band extraction unit 22B extracts data belonging to a characteristic frequency band so as to include a plurality of spectral peaks, and a characteristic frequency band extraction unit 22B detects a plurality of spectral peaks from data belonging to the characteristic frequency band and extracts a plurality of spectra from data belonging to the characteristic frequency band.
- a feature amount calculation unit 221C that calculates the sum of signal intensities included in data belonging to a characteristic frequency band excluding data detected as a peak and data detected as a plurality of spectral peaks;
- An abnormality diagnosis unit 22D is provided, which diagnoses that the rotating mechanical equipment 4 is abnormal when the rotational mechanical equipment 4 is equal to or larger than the threshold value.
- FIG. 14 is a diagram showing an abnormality diagnosis system 202 according to a second modification of the first embodiment.
- the configuration example shown in FIG. 1 includes an abnormality diagnosis device 101 in which a current detection section 1, a monitoring diagnosis section 2, and a diagnosis result output section 3 are integrated.
- the abnormality diagnosis system 202 shown in FIG. Anomaly diagnosis devices 202-1 to 202-n each including current detection units 1-1 to 1-n and monitoring/diagnosis units 2-1 to 2-n, and a server 40 including a data acquisition unit 42 and a diagnosis result output unit 3.
- the abnormality diagnosis devices 202-1 to 202-n and the server 40 are connected via a network.
- the abnormality diagnostic devices 202-1 to 202-n transmit the diagnostic results via the network, and the diagnostic result output unit 3 of the server 40 receives the diagnostic results from the abnormality diagnostic devices 202-1 to 202-n. Obtain via network.
- the other operations and configuration of the abnormality diagnosis system 202 are the same as those shown in the first embodiment.
- the abnormality diagnosis system 202 shown in FIG. 14 of this modification can display the diagnosis results of the rotating mechanical equipment 4-1 to 4-n at once, and each rotating mechanical equipment 4-1 to 4-n can display the diagnostic results of the rotating mechanical equipment 4-1 to 4-n at once. Comparison between n, overall management, etc. become easier.
- the abnormality diagnosis system 202 of the present embodiment is an abnormality diagnosis system 202 that diagnoses abnormalities in the rotating mechanical equipment 4, and includes a current signal storage section 21A that stores the current signal of the electric motor 5, and a current signal storage section.
- a frequency analysis section 22A performs frequency analysis on the waveform of the current signal stored in 21A, and a frequency analysis result that is the result of the frequency analysis performed by the frequency analysis section 22A on the waveform of the current signal, within a predetermined frequency range.
- a characteristic frequency band extraction unit 22B extracts data belonging to a characteristic frequency band so as to include a plurality of spectral peaks, and a characteristic frequency band extraction unit 22B detects a plurality of spectral peaks from data belonging to the characteristic frequency band and extracts a plurality of spectra from data belonging to the characteristic frequency band.
- a feature amount calculation unit 221C that calculates the sum of signal intensities included in data belonging to a characteristic frequency band excluding data detected as a peak and data detected as a plurality of spectral peaks;
- An abnormality diagnosis unit 22D is provided, which diagnoses that the rotating mechanical equipment 4 is abnormal when the rotational mechanical equipment 4 is equal to or larger than the threshold value.
- Embodiment 2 The abnormality diagnosis device 102 in this embodiment will be explained using FIGS. 15 to 18.
- a configuration will be described in which abnormality diagnosis of the rotating mechanical equipment 4 is performed by comparing the sum of all signal intensities included in data belonging to a characteristic frequency band excluding spectral peaks with a first threshold value.
- sort data is created in which data belonging to the characteristic frequency band is rearranged in order of signal strength, and data whose signal strength is equal to or higher than a predetermined second threshold is excluded from the characteristic frequency band. This is different from the first embodiment in that.
- the other configurations are the same as those in Embodiment 1, and the same reference numerals are given to the same or equivalent parts as in Embodiment 1.
- the abnormality diagnosis device 102 of this embodiment is different from the abnormality diagnosis device 101 of the first embodiment, as shown in FIG. .
- FIG. 16 Using FIG. 16, a detailed explanation of each component included in the abnormality diagnosing apparatus 102 and a processing flow of the abnormality diagnosing apparatus 102 in this embodiment will be described. Processing other than step S32 and step S42 is the same as in the first embodiment.
- step S32 the feature calculation unit 222C creates sorted data in which data belonging to the characteristic frequency band extracted by the characteristic frequency band extraction unit 22B is sorted in order of signal strength, and Data exceeding the threshold value of 2 is excluded from the characteristic frequency band.
- a method for determining the second threshold may include determining the lowest signal strength among the data belonging to the characteristic frequency band, and setting the value of the lowest signal strength +10 dB as the second threshold.
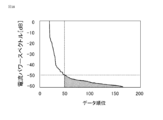
- FIG. 17 shows data included in the frequency range of ⁇ 20 Hz of the power supply frequency, that is, the frequency range of 40 Hz to 80 Hz, extracted from the graph comparing the frequency analysis results of the current signals shown in FIG. 7 as data belonging to the characteristic frequency band. It is a figure showing a case.
- the vertical axis shows the current power spectrum, which is a type of signal strength, and the horizontal axis shows the frequency.
- the frequency analysis unit 22A performs frequency analysis on the current signal at a resolution of 0.25 Hz in step S2
- the number of data belonging to the characteristic frequency band is 160, and the 160 data are rearranged in order of signal strength.
- FIG. 18 is a diagram showing sorted data in which the 160 pieces of data in the characteristic frequency band shown in FIG. 17 are rearranged in order of signal strength from 0 on the left of the page to 160 on the right of the page.
- the vertical axis shows the current power spectrum, which is a type of signal strength
- the horizontal axis shows the data rank.
- data ranks are assigned in order of signal strength.
- data whose signal strength (current power spectrum) is higher than a preset second threshold of -50 dB is excluded from the sorted data.
- the feature quantity calculation unit 222C calculates a feature quantity from data belonging to the characteristic frequency band excluding data whose signal strength is higher than the second threshold value.
- the feature amount corresponds to the sum of all signal intensities included in the data belonging to the characteristic frequency band excluding data having a signal intensity equal to or higher than the second threshold value.
- the abnormality diagnosis device 102 of the present embodiment creates sorted data in which data belonging to the characteristic frequency band is rearranged in order of signal strength, and selects data whose signal strength is equal to or higher than a predetermined second threshold. Exclude from data belonging to the characteristic frequency band.
- Abnormality diagnosis of the rotating mechanical equipment 4 is performed by comparing the sum of all signal intensities included in the data belonging to the characteristic frequency band excluding data equal to or higher than the second threshold value with the first threshold value. This prevents minute changes in signal strength due to minute torque fluctuations from being buried in spectrum peaks, improves the detection accuracy of minute torque fluctuations, and as a result, detects abnormalities caused by failure modes accompanied by minute torque fluctuations. can be diagnosed with high accuracy.
- the abnormality diagnosis device 102 of the present embodiment is an abnormality diagnosis device 102 that diagnoses abnormalities in the rotating mechanical equipment 4, and includes a current signal storage section 21A that stores the current signal of the electric motor 5, and a current signal storage section.
- a frequency analysis section 22A performs frequency analysis on the waveform of the current signal stored in 21A, and a frequency analysis result that is the result of the frequency analysis performed by the frequency analysis section 22A on the waveform of the current signal, within a predetermined frequency range.
- a characteristic frequency band extraction unit 22B extracts data belonging to the characteristic frequency band so as to include a plurality of spectral peaks, and a characteristic frequency band extracting unit 22B which sorts the data belonging to the characteristic frequency band in order of signal strength and extracts the signal strength from the data belonging to the characteristic frequency band.
- a feature amount calculation unit 222C that calculates the sum of signal strengths included in data belonging to the characteristic frequency band excluding data whose signal strength is equal to or higher than the second threshold;
- the apparatus includes an abnormality diagnosis section 22D that diagnoses that the rotating mechanical equipment 4 is abnormal when the sum is equal to or greater than a first threshold value. In this way, minute changes in signal strength due to minute torque fluctuations are prevented from being buried in spectrum peaks, improving detection accuracy of minute torque fluctuations, and as a result, failure modes accompanied by minute torque fluctuations can be prevented. It is possible to accurately diagnose abnormalities caused by
- the abnormality diagnosis method of the present embodiment is an abnormality diagnosis method for diagnosing an abnormality in the rotating mechanical equipment 4, and includes a current signal detection step S1 for detecting a current signal flowing through the electric motor 5, and a current signal detection step S1.
- Frequency analysis step S2 performs frequency analysis on the waveform of the current signal detected in step S2, and frequency analysis step S2 performs frequency analysis on the waveform of the current signal.
- the program of the present embodiment is a program for diagnosing an abnormality in the rotating mechanical equipment 4, and is configured to cause the computer to perform the current signal detection step S1 for detecting the current signal flowing through the electric motor 5, and the current signal detection step S1.
- the frequency analysis step S2 performs frequency analysis on the waveform of the detected current signal
- the frequency analysis step S2 performs frequency analysis on the waveform of the current signal.
- a characteristic frequency band extraction step S3 in which data belonging to the characteristic frequency band is extracted so as to include the spectral peak, and a plurality of spectral peaks are detected from the data belonging to the characteristic frequency band, and a plurality of spectral peaks are extracted from the data belonging to the characteristic frequency band.
- a data exclusion step S32 for excluding the detected data
- a feature value calculation step S42 for calculating the sum of signal intensities included in the data belonging to the characteristic frequency band from which data detected as a plurality of spectral peaks have been excluded
- a determination step S4E in which it is determined whether or not is greater than or equal to a first threshold value
- an abnormality diagnosis step S5 in which the rotating mechanical equipment 4 is diagnosed as abnormal if the sum is greater than or equal to the first threshold value are executed. .
- Abnormalities can be diagnosed with high accuracy.
- the abnormality diagnosis system 203 shown in FIG. 19 of this modification has the effect that it is not necessary to provide the abnormality diagnosis device 102 in each rotating mechanical equipment 4-1 to 4-n.
- the abnormality diagnosis system 203 of the present embodiment is an abnormality diagnosis system 203 that diagnoses abnormalities in the rotating mechanical equipment 4, and includes a current signal storage section 21A that stores the current signal of the electric motor 5, and a current signal storage section.
- a frequency analysis section 22A performs frequency analysis on the waveform of the current signal stored in 21A, and a frequency analysis result that is the result of the frequency analysis performed by the frequency analysis section 22A on the waveform of the current signal, within a predetermined frequency range.
- a characteristic frequency band extraction unit 22B extracts data belonging to the characteristic frequency band so as to include a plurality of spectral peaks, and a characteristic frequency band extracting unit 22B which sorts the data belonging to the characteristic frequency band in order of signal strength and extracts the signal strength from the data belonging to the characteristic frequency band.
- a feature amount calculation unit 222C that calculates the sum of signal strengths included in data belonging to the characteristic frequency band excluding data whose signal strength is equal to or higher than the second threshold;
- the apparatus includes an abnormality diagnosis section 22D that diagnoses that the rotating mechanical equipment 4 is abnormal when the sum is equal to or greater than a first threshold value.
- FIG. 20 An abnormality diagnosis system 204 according to modification 2 of the embodiment will be described using FIG. 20.
- the abnormality diagnosis device includes the current detection units 1-1 to 1-n and the monitoring and diagnosis units 2-1 to 2-n according to the second embodiment.
- This modification differs from the second modification of the first embodiment in that it uses abnormality diagnosis devices 204-1 to 204-n.
- the other configurations are the same as those of the second modification of the first embodiment, and the same reference numerals are given to the same or equivalent components as those of the second modification of the first embodiment.
- the abnormality diagnosis system 204 shown in FIG. 20 of this modification can display the diagnosis results of the rotating mechanical equipment 4-1 to 4-n all at once, and can display the diagnostic results of the rotating mechanical equipment 4-1 to 4-n at once. Comparison between n, overall management, etc. become easier.
- the abnormality diagnosis system 204 of this embodiment is an abnormality diagnosis system 204 that diagnoses abnormalities in the rotating mechanical equipment 4, and includes a current signal storage section 21A that stores the current signal of the electric motor 5, and a current signal storage section.
- a frequency analysis section 22A performs frequency analysis on the waveform of the current signal stored in 21A, and a frequency analysis result that is the result of the frequency analysis performed by the frequency analysis section 22A on the waveform of the current signal, within a predetermined frequency range.
- a characteristic frequency band extraction unit 22B extracts data belonging to the characteristic frequency band so as to include a plurality of spectral peaks, and a characteristic frequency band extracting unit 22B which sorts the data belonging to the characteristic frequency band in order of signal strength and extracts the signal strength from the data belonging to the characteristic frequency band.
- a feature amount calculation unit 222C that calculates the sum of signal strengths included in data belonging to the characteristic frequency band excluding data whose signal strength is equal to or higher than the second threshold;
- the apparatus includes an abnormality diagnosis section 22D that diagnoses that the rotating mechanical equipment 4 is abnormal when the sum is equal to or greater than a first threshold value.
- Embodiment 3 The abnormality diagnosis device 103 in this embodiment will be explained using FIGS. 21 and 22.
- Embodiment 1 or 2 a configuration was described that accurately diagnoses an abnormality due to a failure mode accompanied by minute torque fluctuations, but in this embodiment, the configuration accurately diagnoses an abnormality due to a failure mode accompanied by minute torque fluctuations.
- This embodiment differs from the first or second embodiment in that the total operating time while an abnormality occurs in the rotating mechanical equipment 4 is calculated.
- the other configurations are the same as those in Embodiment 1 or 2, as an example, a case will be described in which the same feature quantity calculation unit 222C as in Embodiment 2 is provided. Components that are the same as or correspond to those in Embodiment 1 or 2 are given the same reference numerals.
- the abnormality diagnosis device 103 of this embodiment is different from the abnormality diagnosis device 101 of the first embodiment or the abnormality diagnosis device 102 of the second embodiment, as shown in FIG. and an abnormality index calculation unit 223E.
- FIG. 22 Using FIG. 22, a detailed description of each component included in abnormality diagnosing apparatus 103 and a processing flow of abnormality diagnosing apparatus 103 in this embodiment will be described. Processing other than step S5A, step S5B, and step S63 is the same as in the first or second embodiment, and the same reference numerals are given to the same or equivalent parts as in the first or second embodiment.
- step S5A the abnormality determination storage section 21C accumulates the diagnosis results output from the abnormality diagnosis section 22D.
- step S5B the abnormality index calculation unit 223E uses the abnormality diagnosis result acquired from the abnormality determination storage unit 21C to determine the total operating time while an abnormality occurs in the rotating mechanical equipment 4 as the abnormality cumulative time. The abnormality cumulative time is calculated and outputted to the abnormality index storage unit 213D.
- the diagnosis result output unit 3 acquires the abnormality cumulative time from the abnormality index storage unit 213D.
- the diagnostic result output unit 3 displays the cumulative abnormality time on the display unit 31A such as a display, and displays the external output communication unit 31C.
- the system notifies the person in charge of monitoring the abnormal cumulative time by outputting the abnormal cumulative time to an external device such as a control device panel, a PC, or a cloud server, and monitors the trend of the abnormal cumulative time.
- the abnormality diagnosis device 103 of the present embodiment can solve the problem by calculating the total operating time while an abnormality occurs in the rotating mechanical equipment 4. It is possible to notify the person in charge of monitoring of the cumulative abnormality time during which an abnormality has occurred in the rotary mechanical equipment 4 together with the diagnostic results, and to monitor the trend of the cumulative abnormality time. In addition, by comparing the abnormality cumulative time of a plurality of rotating mechanical equipment 4, it can be utilized as an index useful for determining the timing of maintenance and updating of the rotating mechanical equipment 4.
- abnormality index calculation unit 223E calculates the abnormality cumulative time
- an external device different from the abnormality diagnosis device 103 may calculate the abnormality cumulative time
- Embodiment 4 The abnormality diagnosis device 104 in this embodiment will be explained using FIGS. 23 and 24.
- Embodiment 3 a configuration will be described in which an abnormality due to a failure mode accompanied by minute torque fluctuations is accurately diagnosed, and the total operating time while an abnormality occurs in the rotating mechanical equipment 4 is calculated as the abnormality cumulative time.
- this embodiment differs from the third embodiment in that the operating conditions of the rotating mechanical equipment 4 that cause the abnormality are estimated.
- the rest of the configuration is the same as that of the third embodiment, and the same reference numerals are given to the same or equivalent parts as in the third embodiment.
- the abnormality diagnosis device 104 of this embodiment is different from the abnormality diagnosis device 103 of the third embodiment, as shown in FIG. It includes an index storage section 214D and an abnormality index calculation section 224E, and further includes an operating condition storage section 21E.
- the operating condition storage unit 21E stores momentary operating conditions of the rotating mechanical equipment 4. For example, when the operating conditions are applied to a public plant monitoring and control system such as a water treatment plant, the flow rate of water sent from the water pump, which is the load equipment 6, the water pressure of the water sent from the water pump, and the water pump to the water pump. This is the opening degree of the valve of the input/output piping that allows water to flow in or out.
- FIG. 24 corresponds to the processing from after the determination of YES in step S4E to step S7 in the processing flow shown in FIG. 22, and for convenience of explanation, only this part is extracted and displayed. There is.
- the abnormality index calculation unit 224E uses the abnormality cumulative time to calculate the abnormality cumulative time per unit operating time of the rotating mechanical equipment 4 and the abnormality cumulative time per total operating time, which is the third threshold.
- the cumulative abnormality time per unit operating time is the percentage of time during which an abnormality occurs in the rotating mechanical equipment 4 during unit operation
- the cumulative abnormality time per total operating time is the percentage of time during which an abnormality occurs in the rotating mechanical equipment 4 during the total operating time. Refers to the percentage of time that occurs.
- the abnormal cumulative time per unit operating time is calculated by dividing the total operating time during which an abnormality occurs in the rotating mechanical equipment 4 during the unit operating time by the unit operating time.
- the abnormality cumulative time per total operating time is calculated by calculating the total operating time during which an abnormality has occurred in the rotating mechanical equipment 4 from the start of driving the rotating mechanical equipment 4 to the present. Calculated by dividing by driving time.
- step S5D the abnormality index calculation unit 224E compares the abnormal cumulative time per unit driving time and the abnormal cumulative time per total driving time. When the abnormal cumulative time per unit operating time exceeds the abnormal cumulative time per total operating time, the abnormality index calculation unit 224E stores the operating conditions of the rotating mechanical equipment 4 that was being executed at that time in the operating condition storage unit 21E. Get from.
- step S5E when an abnormality occurs in the rotating mechanical equipment 4, the abnormality index calculation unit 224E estimates the operating conditions actually applied to the rotating mechanical equipment 4 at that time as the cause of the abnormality occurrence. . That is, the abnormality index calculation unit 224E estimates the operating conditions of the rotating mechanical equipment 4 that cause the abnormality as the abnormality occurrence operating conditions using the operating conditions acquired from the operating condition storage unit 21E. In addition, the abnormality index calculation unit 224E outputs the abnormality occurrence operating conditions to the abnormality index storage unit 214D.
- the diagnosis result output unit 3 acquires the abnormality occurrence operating conditions from the abnormality index storage unit 214D.
- the diagnostic result output unit 3 displays the abnormality occurrence operating conditions on the display unit 31A such as a display in addition to the diagnostic results acquired from the abnormality determination storage unit 21C in the first embodiment or the second embodiment, and displays the abnormality occurrence operating conditions on the display unit 31A such as a display.
- 31C outputs the operating conditions in which the abnormality has occurred to an external device such as a control device panel, a PC, a cloud server, etc., notifies the person in charge of monitoring of the operating conditions in which the abnormality has occurred, and monitors the trend of the operating conditions in which the abnormality has occurred.
- the abnormality diagnosis device 104 of the present embodiment estimates the operating conditions of the rotating mechanical equipment 4 that causes the abnormality, and thereby detects the rotation that causes the abnormality together with the abnormality diagnosis result. It is possible to inform the person in charge of monitoring of the operating conditions of the mechanical equipment 4 and to monitor trends in operating conditions in which abnormalities occur. In addition, by estimating the operating conditions under which the abnormality occurs, it can be utilized as a useful index for determining the operating conditions of the rotating mechanical equipment 4.
- abnormality index calculation unit 224E calculates the abnormality occurrence operating conditions, but an external device different from the abnormality diagnosis device 104 may calculate the abnormality occurrence operating conditions.
- Embodiment 5 The abnormality diagnosis device 105 in this embodiment will be explained using FIGS. 25 and 26.
- the fourth embodiment a configuration for estimating the operating conditions of the rotating mechanical equipment 4 that causes an abnormality has been described, but this embodiment differs from the fourth embodiment in that the degree of deterioration of the rotating mechanical equipment 4 is calculated. .
- the other configurations are the same as those of the fourth embodiment, and the same reference numerals are given to the same or equivalent parts as those of the fourth embodiment.
- the abnormality diagnosis device 105 of this embodiment is different from the abnormality diagnosis device 104 of the fourth embodiment, as shown in FIG. It includes an index storage section 215D and an abnormality index calculation section 225E.
- step S5F and step S65 Processing other than step S5F and step S65 is the same as in the fourth embodiment, and the same reference numerals are given to the same or equivalent parts as in the fourth embodiment.
- FIG. 26 corresponds to the processing from after the determination of YES in step S4E to step S7 in the processing flow shown in FIG. 22, and for convenience of explanation, only this part is extracted and displayed. There is.
- step S5F the abnormality index calculation unit 225E calculates the product of the feature amount calculated in step S41 or step S42 and the cumulative abnormality occurrence time calculated in step S5B as the degree of deterioration of the rotating mechanical equipment 4, or in step S41 or The product of the feature amount calculated in step S42 and the abnormal cumulative time per unit time of the rotating mechanical equipment 4 calculated in step S5C, or the feature amount calculated in step S41 or step S42 and the product of the abnormality cumulative time per unit time of the rotating mechanical equipment 4 calculated in step S5C.
- the product of the abnormal cumulative time per total operating time of the rotating mechanical equipment 4 is calculated.
- the degree of progress of deterioration is an index indicating the degree of progress of deterioration of the rotating mechanical equipment 4 due to an abnormality occurring in the rotating mechanical equipment 4.
- step S65 the diagnosis result output unit 3 acquires the degree of deterioration progress from the abnormality index storage unit 215D.
- the diagnosis result output unit 3 displays the degree of deterioration progress on a display unit 31A such as a display in addition to the diagnosis result acquired from the abnormality determination storage unit 21C in Embodiment 1 or Embodiment 2, and displays the degree of deterioration progress on a display unit 31A such as a display.
- the degree of progress of deterioration is outputted to an external device such as a control device panel, a PC, a cloud server, etc., to inform the person in charge of monitoring the degree of progress of deterioration, and the trend of the degree of deterioration is monitored.
- the abnormality diagnosis device 105 of the present embodiment calculates the degree of deterioration progress and notifies the person in charge of monitoring the degree of deterioration together with the abnormality diagnosis result. Progress trend monitoring can be performed. In addition, by comparing the degree of deterioration of a plurality of rotating mechanical equipment 4, it can be utilized as an index useful for determining the timing of maintenance and updating of the rotating mechanical equipment 4.
- the abnormality index calculation unit 225E calculates the degree of progress of deterioration, but an external device different from the abnormality diagnosis device 105 may calculate the degree of progress of deterioration.
- Embodiment 6 In Embodiment 1 or 2, a configuration for accurately diagnosing an abnormality due to a failure mode accompanied by minute torque fluctuations will be described, and in Embodiment 3, a configuration for accurately diagnosing an abnormality due to a failure mode accompanied by minute torque fluctuations will be described. A configuration for calculating the total as the abnormality cumulative time will be described. In a fourth embodiment, a configuration for estimating the operating conditions of the rotating mechanical equipment 4 that cause the abnormality will be described. In a fifth embodiment, the deterioration progress of the rotating mechanical equipment 4 will be explained. The configuration for calculating the degree has been explained.
- the operating conditions are controlled to suppress the progression of deterioration based on the abnormality detection or cumulative abnormality time, the operating conditions of the rotating mechanical equipment 4 that causes the abnormality, and the degree of progress of deterioration of the rotating mechanical equipment 4. Different from 1 to 5.
- cavitation is a failure mode accompanied by minute torque fluctuations, as described above. Cavitation occurs when the flow rate of liquid locally increases inside the pump, causing the pressure to drop, and when the pressure drops below the saturated vapor pressure of the liquid, the liquid evaporates. Additionally, the sudden change in volume from vapor back to liquid creates a shock that can damage the pump. In order to suppress such cavitation, the rotational speed of the rotating mechanical equipment 4 is lowered than the operating conditions under which cavitation occurs, thereby reducing the flow rate of the liquid.
- Embodiment 1 or 2 when an abnormality is detected, the occurrence of the abnormality can be suppressed by feedback controlling the rotational speed of the rotating mechanical equipment 4. Further, control for suppressing the occurrence of an abnormality may be fed back to the rotating mechanical equipment 4 according to the abnormality cumulative time calculated in the third embodiment. Further, control for suppressing the occurrence of an abnormality may be fed back to the rotating mechanical equipment 4 according to the degree of progress of deterioration calculated in the fifth embodiment. Further, control for operating the rotary mechanical equipment 4 avoiding the operating conditions that cause the abnormality estimated in the fourth embodiment may be fed back. In this case, it is necessary to store the operating conditions of the previous rotating mechanical equipment that were being executed when the abnormality was diagnosed, using the operating condition storage unit that stores the operating conditions of the rotating mechanical equipment.
Landscapes
- Physics & Mathematics (AREA)
- General Physics & Mathematics (AREA)
- Tests Of Circuit Breakers, Generators, And Electric Motors (AREA)
- Control Of Electric Motors In General (AREA)
- Testing Of Devices, Machine Parts, Or Other Structures Thereof (AREA)
Abstract
Description
図1~図9を用いて本実施の形態における異常診断装置101について説明する。
図1において、異常診断装置101は、電動機5に接続されている配線9A、9B、9Cのいずれかに接続された電流検出部1と、監視診断部2と、診断結果出力部3とを有する。
インバータ7は、商用電源8に接続され、商用電源8からの交流電力を直流電力に変換するAC-DCコンバータと、直流電力を交流電力に変換するDC-ACコンバータとを組み合わせて構成されており、DC-ACコンバータが変換した交流電力を電動機5に供給する。
回転機械設備4は、電動機5と、電動機5に接続され電動機5を動力源とする負荷設備6とを有する。例えば、負荷設備6は、電動機5を動力源として駆動する水ポンプ、真空ポンプ、ファン、ブロア等である。
図6は、電流検出部1が検出した電流信号の波形を示す図である。縦軸は電流値を、横軸は時間を表す。電流信号の波形は、点線(U相)、破線(V相)、実線(W相)で示されている。
電源周波数とは、商用電源8の周波数であり、電源周波数の3次成分とは、電源周波数に対して3倍の周波数のことである。周波数は、電源周波数に対してx倍の周波数を持つとき、電源周波数のx次成分であると表現される。xは、0以上の整数である。
インバータ7による電力変換の過程において、AC-DCコンバータにより商用電源8からの交流電力を直流電力に変換する際に、コンバータ回路の動作により電源周波数を持つ基本波と電源周波数の整数倍の周波数をもつ高調波が合成された歪んだ波形の電流が発生する。この歪んだ波形の電流が電圧波形に影響を与え、電圧波形を歪ませる。歪んだ波形の電圧を印加した機器にも同様に歪んだ波形の電流が流れる。
また、図7では電源周波数が50Hzの例を示したが、以降の異常診断装置101の処理フローの説明では、電源周波数が60Hzである場合の処理フローを説明する。
具体的には、周波数解析部22Aから入力されたU相の電流信号の周波数解析結果のデータから、電源周波数の0次成分である0Hzから2次成分である120Hzまでの周波数範囲を特徴周波数帯として、この特徴周波数帯に属するデータを抽出する。
ここで、特徴周波数帯とは、後述する特徴量の算出に用いられる周波数範囲のことである。
結果、微小なトルク変動の影響を受けた電流信号の周波数解析結果は、電源周波数近傍の周波数範囲である電源周波数の0次成分から2次成分の周波数範囲で信号強度が増加する。
このような理由により、電源周波数の0次成分である0Hzから2次成分である120Hzの周波数範囲を特徴周波数帯として抽出する。
変調波の側帯波成分は、電動機5の回転周波数に依存し、変調波周波数の両側に回転周波数分ずれた周波数において現れる。図8では、電源周波数±回転周波数の周波数において変調波の側帯波成分のスペクトル12Aが出現する。
図8では、電源周波数±20Hzにおいてノイズ成分のスペクトル12Bが出現したが、使用するインバータ7の制御方法、種類等により、電源周波数±20Hzとは異なる周波数にも出現する場合がある。
また、側帯波成分のスペクトル12A及びノイズ成分のスペクトル12Bが、電源周波数の0次成分から2次成分の周波数範囲内に出現する例を示したが、キャビテーション以外の異常が同時に発生した場合は、側帯波成分のスペクトル12A及びノイズ成分のスペクトル12Bとは異なるスペクトルピークが当該周波数範囲に出現する場合もある。
例えば、電源周波数が50Hzである場合と電源周波数が60Hzである場合の両方に対応するように、0Hzから120Hzの周波数範囲、200Hzから360Hzの周波数範囲、300Hzから480Hzに含まれる周波数範囲等の中で複数のスペクトルピークを含むように特徴周波数帯に属するデータを抽出してもよい。
図5のステップS3において、特徴周波数帯抽出部22Bは、周波数解析部22Aから入力されたU相の電流信号の周波数解析結果のデータから、図9に示すような特徴周波数帯に属するデータを抽出する。
そして、ステップS4Cにおいて、特徴量算出部221Cは、初期学習記録期間Tが予め定められた期間T0より小さいか否かを判定する。初期学習記録期間Tが予め定められた期間T0より小さい場合(ステップS4C:YESの場合)に、処理をステップS1に進め、初期学習記録期間Tが予め定められた期間T0以上である場合(ステップS4C:NOの場合)に、処理をステップS4Dに進める。
例えば、判定基準を生成するための統計処理の方法としては、判定基準記憶部21Bに蓄積した特徴量の平均、ばらつきσ、2σ、3σ等を算出することにより生成する方法がある。
このように、図5のステップS1~ステップS7により、回転機械設備4の異常を診断する。
例えば、電源周波数の0次成分から2次成分の周波数範囲及び電源周波数の4次成分から6次成分の周波数範囲の中で、複数のスペクトルピークを含むように特徴周波数に属するデータをそれぞれ抽出し、電源周波数の0次成分から2次成分の周波数範囲の中で抽出した特徴周波数帯及び電源周波数の4次成分から6次成分の周波数範囲の中で抽出した特徴周波数帯に属するデータを用いて回転機械設備の異常診断を行ってもよい。
図13は実施の形態1の変形例1に係る異常診断システム201を示す図である。図1に示した構成例では、電流検出部1と、監視診断部2と、診断結果出力部3とが一体化された異常診断装置101を備え、異常診断装置101が回転機械設備4の異常診断を行うが、図13に示した異常診断システム201は、監視診断部2及び診断結果出力部3を備えるサーバ30と、電動機5-1~5-n及び負荷設備6-1~6-nを備える回転機械設備4-1~4-nに接続された電流検出部1-1~1-nと、を備え、電流検出部1-1~1-nとサーバ30とがネットワークを介して接続される。nは、回転機械設備4-1~4-nの数であり、1以上の整数である。電流検出部1-1~1-nは、それぞれ対応する回転機械設備4-1~4-nの電流信号を測定する。この場合、異常診断システム201の監視診断部2は、回転機械設備4-1~4-nに対応する電流検出部1-1~1-nから電流信号を、ネットワークを介して取得する。これ以外の異常診断システム201の動作及び構成は実施の形態1に示した例と同様である。
電動機5-1~5-nは、同一の機種の電動機5-1~5-nであってもよいし、少なくも一部が他の電動機5-1~5-nと異なる機種であってもよい。負荷設備6-1~6-nは、同一の種類の負荷設備6-1~6-nであってもよいし、少なくとも一部が他の種類と異なっていてもよい。
図14は実施の形態1の変形例2に係る異常診断システム202を示す図である。図1に示した構成例では、電流検出部1と、監視診断部2と、診断結果出力部3とが一体化された異常診断装置101を備え、異常診断装置101が回転機械設備4の異常診断を行うが、図12に示した異常診断システム202は、電動機5-1~5-n及び負荷設備6-1~6-nを備える回転機械設備4-1~4-nに接続された電流検出部1-1~1-n、並びに監視診断部2-1~2-nを備える異常診断装置202-1~202-nと、データ取得部42及び診断結果出力部3を備えるサーバ40と、を備え、異常診断装置202-1~202-nとサーバ40とがネットワークを介して接続される。この場合、異常診断装置202-1~202-nは診断結果を、ネットワークを介して送信し、サーバ40の診断結果出力部3は、異常診断装置202-1~202-nから診断結果を、ネットワークを介して取得する。これ以外の異常診断システム202の動作及び構成は実施の形態1に示した例と同様である。
図15~図18を用いて本実施の形態における異常診断装置102について説明する。
実施の形態1において、スペクトルピークを除外した特徴周波数帯に属するデータに含まれる、全ての信号強度の総和と第1の閾値とを比較することで回転機械設備4の異常診断を行う構成について説明したが、本実施の形態では、特徴周波数帯に属するデータを信号強度が強度順に並び変えたソートデータを作成し、信号強度が予め定められた第2の閾値以上のデータを特徴周波数帯から除外する点が実施の形態1と異なる。それ以外の構成は実施の形態1と同様であり、実施の形態1と同一のもの又は相当するものには同一の符号を付している。
図16を用いて、異常診断装置102に含まれる各構成の詳細な説明とともに本実施の形態における異常診断装置102の処理フローについて説明する。ステップS32、ステップS42以外の処理は実施の形態1と同様である。
例えば、第2の閾値の決定方法は、特徴周波数帯に属するデータの中で最下限の信号強度を決定し、最下限の信号強度+10dBの値を第2の閾値とする等が挙げられる。
図17は、図7に示した電流信号の周波数解析結果を比較したグラフから、電源周波数±20Hzの周波数範囲、すなわち40Hz~80Hzの周波数範囲に含まれるデータを特徴周波数帯に属するデータとして抽出した場合を示す図である。縦軸は信号強度の一種である電流パワースペクトル、横軸は周波数を示す。ステップS2において周波数解析部22Aが電流信号を0.25Hzの分解能で周波数解析した場合、特徴周波数帯に属するデータ数は160個となり、160個のデータを信号強度が強度順に並び変えていく。
例えば、先述の第2の閾値の決定方法を用いると、図17において最下限の信号強度を-60dBと決定した場合、第2の閾値は-50dBとなる。
図18は図17に示した特徴周波数帯における160個のデータを信号強度が強度順に紙面左、すなわち0から、紙面右、すなわち160まで並び替えたソートデータを示す図である。縦軸は信号強度の一種である電流パワースペクトル、横軸はデータ順位を示す。図18では、実線で示されるように、信号強度が強度順にデータ順位が割り振られる。加えて、予め設定された第2の閾値である-50dBより信号強度(電流パワースペクトル)が高いデータをソートデータから除外している。
図19を用いて、実施の形態2の変形例1に係る異常診断システム203について説明する。
実施の形態1の変形例1では、図13を参照しつつ、特徴量算出部221Cを含む監視診断部2及び診断結果出力部3を備えるサーバ30と、電動機5-1~5-n及び負荷設備6-1~6-nを備える回転機械設備4-1~4-nに接続された電流検出部1-1~1-nと、を備える構成について説明したが、本変形例では、監視診断部2が実施の形態2に係る監視診断部2である点が実施の形態1の変形例1とは異なる。それ以外の構成は実施の形態1の変形例1と同様であり、実施の形態1の変形例1と同一のもの又は相当するものには同一の符号を付している。
図20を用いて、実施の形態の変形例2に係る異常診断システム204について説明する。
実施の形態1の変形例2では、図14を参照しつつ、電動機5-1~5-n及び負荷設備6-1~6-nを備える回転機械設備4-1~4-nに接続された電流検出部1-1~1-n、並びに監視診断部2-1~2-nを備える異常診断装置202-1~202-nと、データ取得部42及び診断結果出力部3を備えるサーバ40と、を備える構成について説明したが、本変形例では、異常診断装置が電流検出部1-1~1-n、並びに実施の形態2に係る監視診断部2-1~2-nを備える異常診断装置204-1~204-nである点が実施の形態1の変形例2とは異なる。それ以外の構成は実施の形態1の変形例2と同様であり、実施の形態1の変形例2と同一のもの又は相当するものには同一の符号を付している。
図21及び図22を用いて本実施の形態における異常診断装置103について説明する。
実施の形態1又は2において、微小なトルク変動を伴う故障モードによる異常を精度よく診断する構成について説明したが、本実施の形態では、微小なトルク変動を伴う故障モードによる異常を精度よく診断し、さらに回転機械設備4に異常が発生している間の運転時間の合計を算出する点が実施の形態1又は2と異なる。それ以外の構成は実施の形態1又は2と同様だが、例として実施の形態2と同様の特徴量算出部222Cを有する場合について説明する。実施の形態1又は2と同一のもの又は相当するものには同一の符号を付している。
図22を用いて、異常診断装置103に含まれる各構成の詳細な説明とともに本実施の形態における異常診断装置103の処理フローについて説明する。ステップS5A、ステップS5B及びステップS63以外の処理は実施の形態1又は2と同様であり、実施の形態1又は2と同一のもの又は相当するものには同一の符号を付している。
そして、ステップS5Bにおいて、異常指標算出部223Eは、異常判定記憶部21Cから取得した異常診断結果を用いて、回転機械設備4に異常が発生している間の運転時間の合計を異常累積時間として算出し、異常指標記憶部213Dに異常累積時間を出力する。
図23及び図24を用いて本実施の形態における異常診断装置104について説明する。
実施の形態3において、微小なトルク変動を伴う故障モードによる異常を精度よく診断し、さらに回転機械設備4に異常が発生している間の運転時間の合計を異常累積時間として算出する構成について説明したが、本実施の形態では、異常を引き起こす回転機械設備4の運転条件を推定する点が実施の形態3と異なる。それ以外の構成は実施の形態3と同様であり、実施の形態3と同一のもの又は相当するものには同一の符号を付している。
運転条件記憶部21Eは、回転機械設備4の時々刻々の運転条件を格納する。運転条件は、例えば、水処理プラント等の公共プラント監視制御システムに適用する場合における、負荷設備6である水ポンプから送水される水の流量、水ポンプから送水される水の水圧、水ポンプへ水を流入又は排出する入出力配管の弁の開度等である。
ここで、単位運転時間当たりの異常累積時間は、単位運転において回転機械設備4に異常が発生した時間の割合、総運転時間当たりの異常累積時間は、総運転時間において回転機械設備4に異常が発生した時間の割合を指す。
単位運転時間当たりの異常累積時間は、単位運転時間に回転機械設備4に異常が発生している間の運転時間の合計を単位運転時間で割ることにより算出される。
総運転時間当たりの異常累積時間は、回転機械設備4の駆動開始から現在までに回転機械設備4に異常が発生している間の運転時間の合計を回転機械設備4の駆動開始から現在までの運転時間で割ることにより算出される。
図25及び図26を用いて本実施の形態における異常診断装置105について説明する。
実施の形態4において、異常を引き起こす回転機械設備4の運転条件を推定する構成について説明したが、本実施の形態では、回転機械設備4の劣化進行度を算出する点が実施の形態4と異なる。それ以外の構成は実施の形態4と同様であり、実施の形態4と同一のもの又は相当するものには同一の符号を付している。
ここで、劣化進行度は、回転機械設備4に発生した異常を原因とする回転機械設備4の劣化の進行度合いを示す指標である。
実施の形態1又は2において、微小なトルク変動を伴う故障モードによる異常を精度よく診断する構成について説明し、実施の形態3において、回転機械設備4に異常が発生している間の運転時間の合計を異常累積時間として算出する構成について説明し、実施の形態4において、異常を引き起こす回転機械設備4の運転条件を推定する構成について説明し、実施の形態5において、回転機械設備4の劣化進行度を算出する構成について説明した。
例えば、回転機械設備4のなかでもポンプ設備では、既述した通り、微小なトルク変動を伴う故障モードとしてキャビテーションがある。キャビテーションはポンプ内部で局所的に液体の流速が速くなることで、圧力が低下し、液体の飽和蒸気圧力を下回ると、液体が蒸気化することで発生する。さらに、蒸気から液体に戻る際の急激な体積変化によって衝撃が発生し、ポンプに損傷を与える。このようなキャビテーションを抑制するために、キャビテーションが発生する運転条件よりも回転機械設備4の回転速度を低下させることで、液体の流速を低下させる。
従って、例示されていない無数の変形例が、本願明細書に開示される技術の範囲内において想定される。例えば、少なくとも1つの構成要素を変形する場合、追加する場合または省略する場合、さらには、少なくとも1つの構成要素を抽出し、他の実施の形態の構成要素と組み合わせる場合が含まれるものとする。
Claims (28)
- 回転機械設備の異常を診断する異常診断装置であって、
電動機の電流信号を格納する電流信号記憶部と、
前記電流信号記憶部に格納された電流信号の波形を周波数解析する周波数解析部と、
前記周波数解析部が前記電流信号の波形を周波数解析した結果である周波数解析結果において、予め定められた周波数範囲の中で、複数のスペクトルピークを含むように特徴周波数帯に属するデータを抽出する特徴周波数帯抽出部と、
前記特徴周波数帯に属するデータから前記複数のスペクトルピークを検出し、前記特徴周波数帯に属するデータから前記複数のスペクトルピークとして検出されたデータを除外し、前記複数のスペクトルピークとして検出されたデータを除外した前記特徴周波数帯に属するデータに含まれる、信号強度の総和を算出する特徴量算出部と、
前記総和が第1の閾値以上の場合、前記回転機械設備が異常と診断する異常診断部と、
を備える、異常診断装置。 - 回転機械設備の異常を診断する異常診断装置であって、
電動機の電流信号を格納する電流信号記憶部と、
前記電流信号記憶部に格納された電流信号の波形を周波数解析する周波数解析部と、
前記周波数解析部が前記電流信号の波形を周波数解析した結果である周波数解析結果において、予め定められた周波数範囲の中で、複数のスペクトルピークを含むように特徴周波数帯に属するデータを抽出する特徴周波数帯抽出部と、
前記特徴周波数帯に属するデータを信号強度の強度順に並び変え、前記特徴周波数帯に属するデータから前記信号強度が第2の閾値以上であるデータを除外し、前記信号強度が前記第2の閾値以上であるデータを除外した前記特徴周波数帯に属するデータに含まれる、前記信号強度の総和を算出する特徴量算出部と、
前記総和が第1の閾値以上の場合、前記回転機械設備が異常と診断する異常診断部と、
を備える、異常診断装置。 - 前記信号強度は、電流信号の電流値又は電流パワースペクトルである、請求項1又は2に記載の異常診断装置。
- 前記予め定められた周波数範囲は、電源周波数の0次成分から2次成分の周波数範囲である、請求項3に記載の異常診断装置。
- 前記予め定められた周波数範囲は、電源周波数の4次成分から6次成分の周波数範囲である、請求項3に記載の異常診断装置。
- 前記予め定められた周波数範囲は、電源周波数の6次成分から8次成分の周波数範囲である、請求項3に記載の異常診断装置。
- 前記予め定められた周波数範囲は、0Hzから120Hzの周波数範囲である、請求項3に記載の異常診断装置。
- 前記予め定められた周波数範囲は、200Hzから360Hzの周波数範囲である、請求項3に記載の異常診断装置。
- 前記予め定められた周波数範囲は、300Hzから480Hzの周波数範囲である、請求項3に記載の異常診断装置。
- 前記電動機と前記電動機に電力を供給する商用電源とを接続する配線に接続され、前記電動機を駆動する電流を検出し、検出した電流の電流信号を前記電流信号記憶部に出力する電流検出部と、
をさらに備える、請求項3に記載の異常診断装置。 - 前記第1の閾値は、前記回転機械設備の駆動開始から予め設定された期間に蓄積された前記総和に統計処理を施した値である、請求項3に記載の異常診断装置。
- 前記特徴量算出部は、前記総和のデータ数と前記第1の閾値のデータ数とが異なる場合、前記第1の閾値のデータから信号強度の高いデータを順に除外し、又は前記総和のデータから信号強度の高いデータを順に除外して、前記総和のデータ数と前記第1の閾値のデータ数とを一致させる、請求項11に記載の異常診断装置。
- 前記回転機械設備の運転条件を格納する運転条件記憶部と、をさらに備え、
異常と診断された場合に実行されていた前記回転機械設備の運転条件を回避して前記回転機械設備を運転させることを特徴とする請求項1から12のいずれか1項に記載の異常診断装置。 - 前記異常診断部が前記回転機械設備を異常と診断した場合、前記異常診断部の診断結果を格納する異常判定記憶部と、をさらに備える、請求項3に記載の異常診断装置。
- 前記診断結果を表示する表示部、前記回転機械設備が異常と診断された場合に警報を発報する警報部、及び外部装置に前記診断結果を送信する外部出力通信部、のうちの少なくとも一つを有する診断結果出力部と、
をさらに備える、請求項14に記載の異常診断装置。 - 前記異常判定記憶部に格納された診断結果を用いて、前記回転機械設備に異常が発生している間の運転時間の合計である異常累積時間を算出する異常指標算出部と、
をさらに備える、請求項14に記載の異常診断装置。 - 前記回転機械設備の運転条件を格納する運転条件記憶部と、をさらに備え、
前記異常指標算出部は、前記回転機械設備の単位運転時間当たりの前記異常累積時間を算出し、前記回転機械設備の単位運転時間当たりの異常累積時間が第3の閾値以上となった場合、その際に実行されていた前記回転機械設備の運転条件を、前記回転機械設備に異常を引き起こす異常発生運転条件として推定する、請求項16に記載の異常診断装置。 - 前記異常発生運転条件を回避して前記回転機械設備を運転させることを特徴とする請求項17に記載の異常診断装置。
- 前記異常指標算出部は、前記回転機械設備の総運転時間当たりの前記異常累積時間を算出し、前記総和と前記異常累積時間のとの積、前記総和と前記回転機械設備の単位運転時間当たりの前記異常累積時間との積又は前記総和と前記回転機械設備の総運転時間当たりの前記異常累積時間との積である劣化進行度を算出する、請求項16に記載の異常診断装置。
- 前記回転機械設備の運転条件を格納する運転条件記憶部と、をさらに備え、
前記劣化進行度に応じて、異常と診断された場合に実行されていた運転条件を回避して前記回転機械設備を運転させることを特徴とする請求項19に記載の異常診断装置。
- 回転機械設備の異常を診断する異常診断システムであって、
電動機の電流信号を格納する電流信号記憶部と、
前記電流信号記憶部に格納された電流信号の波形を周波数解析する周波数解析部と、
前記周波数解析部が前記電流信号の波形を周波数解析した結果である周波数解析結果において、予め定められた周波数範囲の中で、複数のスペクトルピークを含むように特徴周波数帯に属するデータを抽出する特徴周波数帯抽出部と、
前記特徴周波数帯に属するデータから前記複数のスペクトルピークを検出し、前記特徴周波数帯に属するデータから前記複数のスペクトルピークとして検出されたデータを除外し、前記複数のスペクトルピークとして検出されたデータを除外した前記特徴周波数帯に属するデータに含まれる、信号強度の総和を算出する特徴量算出部と、
前記総和が第1の閾値以上の場合、前記回転機械設備が異常と診断する異常診断部と、
を備える、異常診断システム。 - 回転機械設備の異常を診断する異常診断システムであって、
電動機の電流信号を格納する電流信号記憶部と、
前記電流信号記憶部に格納された電流信号の波形を周波数解析する周波数解析部と、
前記周波数解析部が前記電流信号の波形を周波数解析した結果である周波数解析結果において、予め定められた周波数範囲の中で、複数のスペクトルピークを含むように特徴周波数帯に属するデータを抽出する特徴周波数帯抽出部と、
前記特徴周波数帯に属するデータを信号強度の強度順に並び変え、前記特徴周波数帯に属するデータから前記信号強度が第2の閾値以上であるデータを除外し、前記信号強度が前記第2の閾値以上であるデータを除外した前記特徴周波数帯に属するデータに含まれる、前記信号強度の総和を算出する特徴量算出部と、
前記総和が第1の閾値以上の場合、前記回転機械設備が異常と診断する異常診断部と、
を備える、異常診断システム。 - 前記回転機械設備の運転条件を格納する運転条件記憶部と、をさらに備え、
異常と診断された場合に実行されていた前記回転機械設備の運転条件を回避して前記回転機械設備を運転させることを特徴とする請求項21または22に記載の異常診断システム。 - 回転機械設備の異常を診断する異常診断方法であって、
電動機に流れる電流信号を検出する電流信号検出ステップと、
前記電流信号検出ステップで検出された電流信号の波形を周波数解析する周波数解析ステップと、
前記周波数解析ステップが前記電流信号の波形を周波数解析した結果である周波数解析結果において、予め定められた周波数範囲の中で、複数のスペクトルピークを含むように特徴周波数帯に属するデータを抽出する特徴周波数帯抽出ステップと、
前記特徴周波数帯に属するデータから前記複数のスペクトルピークを検出し、前記特徴周波数帯に属するデータから前記複数のスペクトルピークとして検出されたデータを除外するデータ除外ステップと、
前記複数のスペクトルピークとして検出されたデータを除外した前記特徴周波数帯に属するデータに含まれる、信号強度の総和を算出する特徴量算出ステップと、
前記総和が第1の閾値以上か否かを判定する判定ステップと、
前記総和が第1の閾値以上の場合、前記回転機械設備が異常と診断する異常診断ステップと、
を備える、異常診断方法。 - 回転機械設備の異常を診断する異常診断方法であって、
電動機に流れる電流信号を検出する電流信号検出ステップと、
前記電流信号検出ステップで検出された電流信号の波形を周波数解析する周波数解析ステップと、
前記周波数解析ステップが前記電流信号の波形を周波数解析した結果である周波数解析結果において、予め定められた周波数範囲の中で、複数のスペクトルピークを含むように特徴周波数帯に属するデータを抽出する特徴周波数帯抽出ステップと、
前記特徴周波数帯に属するデータを信号強度の強度順に並び変え、前記特徴周波数帯に属するデータから前記信号強度が第2の閾値以上であるデータを除外するデータ除外ステップと、
前記信号強度が前記第2の閾値以上であるデータを除外した前記特徴周波数帯に属するデータに含まれる、前記信号強度の総和を算出する特徴量算出ステップと、
前記総和が第1の閾値以上か否かを判定する判定ステップと、
前記総和が第1の閾値以上の場合、前記回転機械設備が異常と診断する異常診断ステップと、
を備える、異常診断方法。 - 前記回転機械設備の運転条件を格納する運転条件記憶ステップと、をさらに備え、
前記回転機械設備が異常と診断された場合に実行されていた前記回転機械設備の運転条件を回避して前記回転機械設備を運転させることを特徴とする請求項24または25に記載の異常診断方法。 - 回転機械設備の異常を診断するプログラムであって、
コンピュータに、
電動機に流れる電流信号を検出する電流信号検出ステップと、
前記電流信号検出ステップで検出された電流信号の波形を周波数解析する周波数解析ステップと、
前記周波数解析ステップが前記電流信号の波形を周波数解析した結果である周波数解析結果において、予め定められた周波数範囲の中で、複数のスペクトルピークを含むように特徴周波数帯に属するデータを抽出する特徴周波数帯抽出ステップと、
前記特徴周波数帯に属するデータから前記複数のスペクトルピークを検出し、前記特徴周波数帯に属するデータから前記複数のスペクトルピークとして検出されたデータを除外するデータ除外ステップと、
前記複数のスペクトルピークとして検出されたデータを除外した前記特徴周波数帯に属するデータに含まれる、信号強度の総和を算出する特徴量算出ステップと、
前記総和が第1の閾値以上か否かを判定する判定ステップと、
前記総和が第1の閾値以上の場合、前記回転機械設備が異常と診断する異常診断ステップと、
を実行させる、プログラム。 - 回転機械設備の異常を診断するプログラムであって、
コンピュータに、
電動機に流れる電流信号を検出する電流信号検出ステップと、
前記電流信号検出ステップで検出された電流信号の波形を周波数解析する周波数解析ステップと、
前記周波数解析ステップが前記電流信号の波形を周波数解析した結果である周波数解析結果において、予め定められた周波数範囲の中で、複数のスペクトルピークを含むように特徴周波数帯に属するデータを抽出する特徴周波数帯抽出ステップと、
前記特徴周波数帯に属するデータを信号強度の強度順に並び変え、前記特徴周波数帯に属するデータから前記信号強度が第2の閾値以上であるデータを除外するデータ除外ステップと、
前記信号強度が前記第2の閾値以上であるデータを除外した前記特徴周波数帯に属するデータに含まれる、前記信号強度の総和を算出する特徴量算出ステップと、
前記総和が第1の閾値以上か否かを判定する判定ステップと、
前記総和が第1の閾値以上の場合、前記回転機械設備が異常と診断する異常診断ステップと、
を実行させる、プログラム。
Priority Applications (4)
| Application Number | Priority Date | Filing Date | Title |
|---|---|---|---|
| JP2024517221A JP7789194B2 (ja) | 2022-04-26 | 2023-04-18 | 異常診断装置、異常診断システム、異常診断方法及びプログラム |
| DE112023002172.4T DE112023002172T5 (de) | 2022-04-26 | 2023-04-18 | Anomalie-diagnoseeinrichtung, anomalie-diagnosesystem, anomalie-diagnoseverfahren und programm |
| CN202380035288.3A CN119053871A (zh) | 2022-04-26 | 2023-04-18 | 异常诊断装置、异常诊断系统、异常诊断方法以及程序 |
| TW112115315A TWI861830B (zh) | 2022-04-26 | 2023-04-25 | 異常診斷裝置、異常診斷系統、異常診斷方法以及程式 |
Applications Claiming Priority (2)
| Application Number | Priority Date | Filing Date | Title |
|---|---|---|---|
| JP2022-072528 | 2022-04-26 | ||
| JP2022072528 | 2022-04-26 |
Publications (1)
| Publication Number | Publication Date |
|---|---|
| WO2023210441A1 true WO2023210441A1 (ja) | 2023-11-02 |
Family
ID=88518589
Family Applications (1)
| Application Number | Title | Priority Date | Filing Date |
|---|---|---|---|
| PCT/JP2023/015466 Ceased WO2023210441A1 (ja) | 2022-04-26 | 2023-04-18 | 異常診断装置、異常診断システム、異常診断方法及びプログラム |
Country Status (5)
| Country | Link |
|---|---|
| JP (1) | JP7789194B2 (ja) |
| CN (1) | CN119053871A (ja) |
| DE (1) | DE112023002172T5 (ja) |
| TW (1) | TWI861830B (ja) |
| WO (1) | WO2023210441A1 (ja) |
Cited By (1)
| Publication number | Priority date | Publication date | Assignee | Title |
|---|---|---|---|---|
| CN118244180A (zh) * | 2024-03-07 | 2024-06-25 | 青岛水下机器人系统有限公司 | 一种面向电机的多电流传感器故障诊断方法 |
Citations (11)
| Publication number | Priority date | Publication date | Assignee | Title |
|---|---|---|---|---|
| US20040230384A1 (en) * | 2003-05-13 | 2004-11-18 | Haynes Howard D. | Electric fuel pump condition monitor system using electrical signature analysis |
| JP2016090546A (ja) * | 2014-11-11 | 2016-05-23 | 旭化成エンジニアリング株式会社 | 電流診断装置および電流診断方法 |
| KR20170025310A (ko) * | 2015-08-28 | 2017-03-08 | 고려대학교 산학협력단 | 벨트-풀리 시스템 진단 시스템, 방법, 및 상기 방법을 실행시키기 위한 컴퓨터 판독 가능한 프로그램을 기록한 기록 매체 |
| JP2017061045A (ja) * | 2015-09-24 | 2017-03-30 | 富士ゼロックス株式会社 | 画像処理装置、画像処理プログラム及び画像処理システム |
| WO2018109993A1 (ja) * | 2016-12-15 | 2018-06-21 | 三菱電機株式会社 | 動力伝達機構の異常診断装置および動力伝達機構の異常診断方法 |
| JP2020148461A (ja) * | 2019-03-11 | 2020-09-17 | 株式会社荏原製作所 | 信号処理装置、信号処理方法 |
| WO2020189014A1 (ja) * | 2019-03-15 | 2020-09-24 | オムロン株式会社 | 異常診断装置および異常診断方法 |
| JP6824494B1 (ja) * | 2020-06-29 | 2021-02-03 | 三菱電機株式会社 | 異常診断装置、電力変換装置および異常診断方法 |
| JP6854984B1 (ja) * | 2020-05-29 | 2021-04-07 | 三菱電機株式会社 | レーザ加工システム |
| JP6968323B1 (ja) * | 2021-04-22 | 2021-11-17 | 三菱電機株式会社 | 異常診断装置及び異常診断方法 |
| WO2022224631A1 (ja) * | 2021-04-21 | 2022-10-27 | 株式会社日立産機システム | 回転機システム、及びその診断方法 |
Family Cites Families (5)
| Publication number | Priority date | Publication date | Assignee | Title |
|---|---|---|---|---|
| TWI398629B (zh) * | 2009-11-25 | 2013-06-11 | China Steel Corp | Equipment supervision method |
| WO2020062180A1 (zh) * | 2018-09-29 | 2020-04-02 | 深圳市大疆创新科技有限公司 | 电机状态监测装置和电机状态监测方法 |
| JP2020153965A (ja) | 2019-03-15 | 2020-09-24 | オムロン株式会社 | 異常診断装置および異常診断方法 |
| US11411521B2 (en) * | 2020-10-15 | 2022-08-09 | Mitsubishi Electric Research Laboratories, Inc. | Method for static eccentricity fault detection of induction motors |
| TWM621425U (zh) * | 2021-07-22 | 2021-12-21 | 宇辰系統科技股份有限公司 | 用於電動機之振動監測系統 |
-
2023
- 2023-04-18 WO PCT/JP2023/015466 patent/WO2023210441A1/ja not_active Ceased
- 2023-04-18 JP JP2024517221A patent/JP7789194B2/ja active Active
- 2023-04-18 CN CN202380035288.3A patent/CN119053871A/zh active Pending
- 2023-04-18 DE DE112023002172.4T patent/DE112023002172T5/de active Pending
- 2023-04-25 TW TW112115315A patent/TWI861830B/zh active
Patent Citations (11)
| Publication number | Priority date | Publication date | Assignee | Title |
|---|---|---|---|---|
| US20040230384A1 (en) * | 2003-05-13 | 2004-11-18 | Haynes Howard D. | Electric fuel pump condition monitor system using electrical signature analysis |
| JP2016090546A (ja) * | 2014-11-11 | 2016-05-23 | 旭化成エンジニアリング株式会社 | 電流診断装置および電流診断方法 |
| KR20170025310A (ko) * | 2015-08-28 | 2017-03-08 | 고려대학교 산학협력단 | 벨트-풀리 시스템 진단 시스템, 방법, 및 상기 방법을 실행시키기 위한 컴퓨터 판독 가능한 프로그램을 기록한 기록 매체 |
| JP2017061045A (ja) * | 2015-09-24 | 2017-03-30 | 富士ゼロックス株式会社 | 画像処理装置、画像処理プログラム及び画像処理システム |
| WO2018109993A1 (ja) * | 2016-12-15 | 2018-06-21 | 三菱電機株式会社 | 動力伝達機構の異常診断装置および動力伝達機構の異常診断方法 |
| JP2020148461A (ja) * | 2019-03-11 | 2020-09-17 | 株式会社荏原製作所 | 信号処理装置、信号処理方法 |
| WO2020189014A1 (ja) * | 2019-03-15 | 2020-09-24 | オムロン株式会社 | 異常診断装置および異常診断方法 |
| JP6854984B1 (ja) * | 2020-05-29 | 2021-04-07 | 三菱電機株式会社 | レーザ加工システム |
| JP6824494B1 (ja) * | 2020-06-29 | 2021-02-03 | 三菱電機株式会社 | 異常診断装置、電力変換装置および異常診断方法 |
| WO2022224631A1 (ja) * | 2021-04-21 | 2022-10-27 | 株式会社日立産機システム | 回転機システム、及びその診断方法 |
| JP6968323B1 (ja) * | 2021-04-22 | 2021-11-17 | 三菱電機株式会社 | 異常診断装置及び異常診断方法 |
Non-Patent Citations (2)
| Title |
|---|
| TOYOTA, TOSHIO: "Using motor current signature analysis (MCSA) in diagnostic technologies of motor-driven rotary machines", TAKADA TECHNICAL REPORTS, vol. 20, 1 April 2010 (2010-04-01), pages 3 - 6, XP009550141 * |
| WELCH D.E., HAYNES H.D., COX D.F., MOSES R.J.: "Electrical Signature Analysis (ESA) as a Diagnostic Maintenance Technique for Detecting the High Consequence Fuel Pump Failure Modes", PRESENTATION FOR THE 6TH JOINT FAA/DOD/NASA CONFERENCE ON AGING AIRCRAFT, 19 September 2002 (2002-09-19), pages 1 - 34, XP055960227 * |
Cited By (1)
| Publication number | Priority date | Publication date | Assignee | Title |
|---|---|---|---|---|
| CN118244180A (zh) * | 2024-03-07 | 2024-06-25 | 青岛水下机器人系统有限公司 | 一种面向电机的多电流传感器故障诊断方法 |
Also Published As
| Publication number | Publication date |
|---|---|
| DE112023002172T5 (de) | 2025-02-27 |
| JPWO2023210441A1 (ja) | 2023-11-02 |
| TWI861830B (zh) | 2024-11-11 |
| JP7789194B2 (ja) | 2025-12-19 |
| TW202407372A (zh) | 2024-02-16 |
| CN119053871A (zh) | 2024-11-29 |
Similar Documents
| Publication | Publication Date | Title |
|---|---|---|
| CN102939463B (zh) | 检测泵中的汽蚀的系统和方法 | |
| US11378947B2 (en) | System and methods of failure prediction and prevention for rotating electrical machinery | |
| US9759774B2 (en) | Anomaly diagnosis system, method, and apparatus | |
| JP5985099B1 (ja) | 回転機械系の異常検知方法、その異常検知方法を用いた回転機械系の異常監視方法、及びその異常監視方法を用いた回転機械系の異常監視装置 | |
| CN107155353B (zh) | 电动机的诊断装置 | |
| KR102875507B1 (ko) | 이상 진단 장치 및 이상 진단 방법 | |
| JP7724960B2 (ja) | モータ駆動装置、冷凍サイクル装置および冷凍サイクルシステム | |
| JP2005251185A (ja) | 電気設備診断システム | |
| CN105048924A (zh) | 感应马达速度估算 | |
| JP2020527018A (ja) | 自己学習モータ負荷プロファイルの技術 | |
| KR20190014074A (ko) | 전동기의 진단 장치 | |
| CN113544487A (zh) | 异常诊断装置以及异常诊断方法 | |
| JP2024019278A (ja) | 異常診断装置および異常診断方法 | |
| WO2023210441A1 (ja) | 異常診断装置、異常診断システム、異常診断方法及びプログラム | |
| KR20110072123A (ko) | 설비 구동부 고장 감시 장치 | |
| JP7621572B1 (ja) | 診断装置、診断システム、電力変換装置及び診断方法 | |
| JP7442742B2 (ja) | 電動機付設備の故障徴候検出装置および電動機付設備の故障徴候検出方法 | |
| WO2024204802A1 (ja) | 状態推定装置、駆動システム、冷凍システム、ファンシステム、状態推定方法、状態推定プログラム | |
| JP7843919B2 (ja) | 異常診断装置及び異常診断方法 | |
| US20260029489A1 (en) | System and method for monitoring motor winding degradation | |
| Tseng et al. | A motor rotary fault diagnosis system using dynamic structural neural network |
Legal Events
| Date | Code | Title | Description |
|---|---|---|---|
| 121 | Ep: the epo has been informed by wipo that ep was designated in this application |
Ref document number: 23796184 Country of ref document: EP Kind code of ref document: A1 |
|
| ENP | Entry into the national phase |
Ref document number: 2024517221 Country of ref document: JP Kind code of ref document: A |
|
| WWE | Wipo information: entry into national phase |
Ref document number: 202380035288.3 Country of ref document: CN |
|
| WWE | Wipo information: entry into national phase |
Ref document number: 112023002172 Country of ref document: DE |
|
| WWP | Wipo information: published in national office |
Ref document number: 112023002172 Country of ref document: DE |
|
| 122 | Ep: pct application non-entry in european phase |
Ref document number: 23796184 Country of ref document: EP Kind code of ref document: A1 |