WO2023189261A1 - Computer program, information processing device, and information processing method - Google Patents
Computer program, information processing device, and information processing method Download PDFInfo
- Publication number
- WO2023189261A1 WO2023189261A1 PCT/JP2023/008440 JP2023008440W WO2023189261A1 WO 2023189261 A1 WO2023189261 A1 WO 2023189261A1 JP 2023008440 W JP2023008440 W JP 2023008440W WO 2023189261 A1 WO2023189261 A1 WO 2023189261A1
- Authority
- WO
- WIPO (PCT)
- Prior art keywords
- frames
- hollow organ
- blood vessel
- computer program
- medical image
- Prior art date
Links
- 230000010365 information processing Effects 0.000 title claims abstract description 35
- 238000004590 computer program Methods 0.000 title claims abstract description 32
- 238000003672 processing method Methods 0.000 title claims abstract description 6
- 210000000056 organ Anatomy 0.000 claims abstract description 39
- 238000000034 method Methods 0.000 claims description 36
- 230000005484 gravity Effects 0.000 claims description 30
- 238000004364 calculation method Methods 0.000 claims description 11
- 238000001514 detection method Methods 0.000 claims description 2
- 238000012545 processing Methods 0.000 abstract description 29
- 230000002792 vascular Effects 0.000 abstract 2
- 210000004204 blood vessel Anatomy 0.000 description 116
- 230000011218 segmentation Effects 0.000 description 36
- 238000010586 diagram Methods 0.000 description 32
- 238000004891 communication Methods 0.000 description 14
- 238000002604 ultrasonography Methods 0.000 description 9
- 238000002608 intravascular ultrasound Methods 0.000 description 8
- 239000000523 sample Substances 0.000 description 7
- 230000006870 function Effects 0.000 description 6
- 230000010349 pulsation Effects 0.000 description 6
- 210000004351 coronary vessel Anatomy 0.000 description 4
- 238000003384 imaging method Methods 0.000 description 4
- 238000012014 optical coherence tomography Methods 0.000 description 4
- 244000208734 Pisonia aculeata Species 0.000 description 3
- 230000000052 comparative effect Effects 0.000 description 3
- 238000003745 diagnosis Methods 0.000 description 3
- 238000013146 percutaneous coronary intervention Methods 0.000 description 3
- 230000000747 cardiac effect Effects 0.000 description 2
- 230000003287 optical effect Effects 0.000 description 2
- 238000012805 post-processing Methods 0.000 description 2
- 238000007781 pre-processing Methods 0.000 description 2
- 239000004065 semiconductor Substances 0.000 description 2
- 238000003491 array Methods 0.000 description 1
- 238000002592 echocardiography Methods 0.000 description 1
- 238000005516 engineering process Methods 0.000 description 1
- 238000000605 extraction Methods 0.000 description 1
- 238000001914 filtration Methods 0.000 description 1
- 210000004013 groin Anatomy 0.000 description 1
- 238000007689 inspection Methods 0.000 description 1
- 238000005305 interferometry Methods 0.000 description 1
- 230000003902 lesion Effects 0.000 description 1
- 239000004973 liquid crystal related substance Substances 0.000 description 1
- 239000013307 optical fiber Substances 0.000 description 1
- 230000004044 response Effects 0.000 description 1
- 230000003068 static effect Effects 0.000 description 1
- 230000001360 synchronised effect Effects 0.000 description 1
- 210000000707 wrist Anatomy 0.000 description 1
Images


Classifications
-
- A—HUMAN NECESSITIES
- A61—MEDICAL OR VETERINARY SCIENCE; HYGIENE
- A61B—DIAGNOSIS; SURGERY; IDENTIFICATION
- A61B8/00—Diagnosis using ultrasonic, sonic or infrasonic waves
- A61B8/12—Diagnosis using ultrasonic, sonic or infrasonic waves in body cavities or body tracts, e.g. by using catheters
Definitions
- the present invention relates to a computer program, an information processing device, and an information processing method.
- Patent Document 1 discloses that a catheter is inserted into a blood vessel, and a blood vessel cross-sectional image is generated based on signals (ultrasound waves emitted toward the blood vessel tissue and reflected waves) obtained by an imaging core housed in the catheter. An image diagnostic apparatus is disclosed.
- the present invention has been made in view of the above circumstances, and it is an object of the present invention to provide a computer program, an information processing device, and an information processing method that can extract frames of a specific period from only medical images.
- a computer program causes a computer to acquire medical image data showing cross-sectional images of a plurality of frames of a hollow organ. Based on medical image data, the feature amount of the hollow organ is calculated for each frame, the maximum value of the variation amount of the feature amount between frames is detected, and a plurality of required frames are divided into the plurality of frames based on the detected maximum value. Specify from among the frames and execute the process.
- frames of a specific period can be extracted only from medical images.
- FIG. 1 is a diagram illustrating an example of the configuration of an information processing system according to the present embodiment.
- FIG. 1 is a diagram illustrating an example of the configuration of an information processing device.
- FIG. 3 is a diagram showing a first example of processing using a learning model.
- FIG. 7 is a diagram showing a second example of processing using a learning model. It is a figure showing an example of segmentation data outputted by a learning model.
- FIG. 3 is a diagram showing an example of feature amounts.
- FIG. 3 is a diagram showing an example of feature amounts.
- FIG. 3 is a diagram showing an example of variation in blood vessel center of gravity.
- FIG. 3 is a diagram illustrating an example of a method for identifying a required frame.
- FIG. 3 is a diagram illustrating an example of a method for identifying a required frame.
- FIG. 6 is a diagram illustrating an example of a result of extracting a required frame.
- FIG. 6 is a diagram illustrating an example of a method for identifying a group of corresponding points at a predetermined site when no side branch exists.
- FIG. 3 is a diagram illustrating an example of a method for connecting a group of corresponding points.
- FIG. 7 is a diagram illustrating a first example of a method for identifying a group of corresponding points in a predetermined region when a side branch exists.
- FIG. 7 is a diagram illustrating a second example of a method for identifying a group of corresponding points in a predetermined region when a side branch exists. It is a figure showing an example of a simulated 3D image of a blood vessel.
- FIG. 3 is a diagram illustrating an example of blood vessel information based on required frames.
- FIG. 3 is a diagram illustrating an example of blood vessel information based on required frames.
- FIG. 3 is a diagram illustrating an example of a processing procedure by an information processing device.
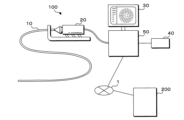
- FIG. 1 is a diagram showing an example of the configuration of an information processing system 100 according to the present embodiment.
- the information processing system 100 is, for example, an image diagnosis system, and is a device for performing intravascular imaging (image diagnosis) used in cardiac catheterization (PCI).
- Cardiac catheterization is a method of treating narrowed coronary arteries by inserting a catheter through a blood vessel in the groin, arm, or wrist.
- intravascular ultrasound IVUS
- OFDI optical frequency domain imaging
- OCT optical coherence tomography
- IVUS uses reflected ultrasound waves to interpret the inside of a blood vessel as a tomographic image.
- a thin catheter equipped with an ultra-small sensor at the tip is inserted into a coronary artery, passed to a lesion, and then a medical image of the inside of the blood vessel can be generated using ultrasound waves emitted from the sensor.
- OFDI uses near-infrared rays to interpret the condition inside blood vessels using high-resolution images.
- a catheter is inserted into a blood vessel, near-infrared rays are irradiated from the tip, and a cross section of the blood vessel is measured using interferometry to generate a medical image.
- OCT is an intravascular image diagnosis that applies near-infrared rays and optical fiber technology.
- a blood vessel will be described as an example of a hollow organ.
- medical images include those generated by IVUS, OFDI, or OCT, but below, the case where the IVUS method is mainly used will be described.
- the information processing system 100 includes a catheter 10, an MDU (Motor Drive Unit) 20, a display device 30, an input device 40, and an information processing device 50.
- a server 200 is connected to the information processing device 50 via the communication network 1.
- the catheter 10 is an image diagnostic catheter for obtaining ultrasonic tomographic images of blood vessels using the IVUS method.
- the catheter 10 has an ultrasonic probe at its tip for obtaining ultrasonic tomographic images of blood vessels.
- the ultrasonic probe includes an ultrasonic transducer that emits ultrasonic waves within a blood vessel, and an ultrasonic sensor that receives reflected waves (ultrasonic echoes) reflected from structures such as living tissue in the blood vessel or medical equipment.
- the ultrasound probe is configured to be able to move forward and backward in the longitudinal direction of the blood vessel while rotating in the circumferential direction of the blood vessel.
- the MDU 20 is a drive device to which the catheter 10 can be detachably attached, and controls the operation of the catheter 10 inserted into a blood vessel by driving a built-in motor in response to operations by a medical worker.
- the MDU 20 can be rotated in the circumferential direction while moving the ultrasound probe of the catheter 10 from the tip (distal) side to the base (proximal) side (pullback operation).
- the ultrasound probe continuously scans the inside of the blood vessel at predetermined time intervals and outputs reflected wave data of the detected ultrasound waves to the information processing device 50.
- the information processing device 50 acquires medical image data showing time-series (multiple frames) cross-sectional images of blood vessels based on the reflected wave data output from the ultrasound probe of the catheter 10.
- the ultrasound probe scans the inside of the blood vessel while moving from the tip (distal) side to the proximal end (proximal) side, so multiple medical images in chronological order are multiple images spanning from distal to proximal. This is a tomographic image of the blood vessels observed at the location.
- the display device 30 includes a liquid crystal display panel, an organic EL display panel, etc., and can display processing results by the information processing device 50. Furthermore, the display device 30 can display medical images generated (acquired) by the information processing device 50.
- the input device 40 is an input interface such as a keyboard or a mouse that accepts input of various setting values when performing an inspection, operation of the information processing device 50, and the like.
- the input device 40 may be a touch panel, soft keys, hard keys, etc. provided on the display device 30.
- the server 200 is, for example, a data server, and may include an image DB that stores medical image data.
- FIG. 2 is a diagram showing an example of the configuration of the information processing device 50.
- the information processing device 50 includes a control unit 51 that controls the entire information processing device 50, a communication unit 52, an interface unit 53, a feature amount calculation unit 54, a frame identification unit 55, a memory 56, a storage unit 57, and a recording medium reading unit 60. Equipped with The storage unit 57 stores a computer program 58 and a learning model 59.
- the feature amount calculation unit 54 and the frame identification unit 55 may be implemented by hardware, software (computer program 58), or both hardware and software. Good too.
- the information processing device 50 may be configured with functions distributed among a plurality of information processing devices.
- the control unit 51 incorporates a required number of CPU (Central Processing Unit), MPU (Micro-Processing Unit), GPU (Graphics Processing Unit), GPGPU (General-purpose computing on graphics processing units), TPU (Tensor Processing Unit), etc. It may be configured as follows. Further, the control unit 51 may be configured by combining DSPs (Digital Signal Processors), FPGAs (Field-Programmable Gate Arrays), quantum processors, and the like.
- DSPs Digital Signal Processors
- FPGAs Field-Programmable Gate Arrays
- quantum processors and the like.
- the control unit 51 can execute processing determined by the computer program 58. That is, the processing by the control unit 51 is also the processing by the computer program 58.
- the memory 56 can be composed of semiconductor memory such as SRAM (Static Random Access Memory), DRAM (Dynamic Random Access Memory), and flash memory.
- the computer program 58 can be loaded into the memory 56 and the control unit 51 can execute the computer program 58.
- the communication unit 52 includes, for example, a communication module and has a communication function with the server 200 via the communication network 1. Further, the communication unit 52 may have a communication function with an external device (not shown) connected to the communication network 1. The communication unit 52 may acquire medical image data showing cross-sectional images of multiple frames of a blood vessel from the server 200.
- the interface section 53 provides an interface function between the catheter 10, the display device 30, and the input device 40.
- the information processing device 50 (control unit 51) can transmit and receive data and information between the catheter 10, the display device 30, and the input device 40 through the interface unit 53.
- the interface unit 53 may acquire medical image data showing cross-sectional images of multiple frames of a blood vessel from the catheter 10.
- the recording medium reading section 60 can be configured with, for example, an optical disk drive, and reads the computer program 58 (program product) recorded on the recording medium 61 (for example, an optically readable disk storage medium such as a CD-ROM) into the recording medium. It can be read by the reading unit 60 and stored in the storage unit 57.
- the computer program 58 is loaded into the memory 56 and executed by the control unit 51. Note that the computer program 58 may be downloaded from an external device via the communication unit 52 and stored in the storage unit 57.
- the storage unit 57 can be configured with, for example, a hard disk or a semiconductor memory, and can store necessary information (for example, data being processed by the information processing device 50, processing results, etc.).
- the feature amount calculation unit 54 has a function as a calculation unit, and calculates the feature amount of blood vessels for each frame based on the medical image data acquired via the interface unit 53 or the communication unit 52. Details of the feature amounts will be described later.
- the frame specifying unit 55 has a function as a detecting unit and a specifying unit, and detects the maximum value (peak) of the variation amount of the feature amount between frames, and selects a plurality of required frames based on the detected maximum value. Identify from within the frame. Details of the method for identifying the required frame will be described later.
- FIG. 3 is a diagram showing a first example of processing by the learning model 59.
- the first example assumes a case where there are no side branches of the blood vessel.
- the learning model 59 includes an input layer 59a, a middle layer 59b, and an output layer 59c, and can be configured with U-Net, for example.
- the intermediate layer 59b includes multiple encoders and multiple decoders. Convolution processing is repeated using a plurality of encoders on the medical image data input to the input layer 59a. Multiple decoders repeatedly perform upsampling (deconvolution) processing on the image convolved by the encoder. When decoding a convolved image, the feature map generated by the encoder is added to the image to be deconvolved. This makes it possible to retain positional information that is lost due to convolution processing, and to output segmentation (which pixel belongs to which class) with higher accuracy.
- the learning model 59 can output segmentation data (region information of a predetermined region) when medical image data is input. Segmentation data is obtained by classifying each pixel of medical image data into classes.
- the learning model 59 can classify each pixel of input medical image data into three classes, eg, classes 1, 2, and 3. Class 1 indicates Background and indicates the area outside the blood vessel. Class 2 indicates (Plaque + Media) and indicates the area of the blood vessel containing plaque. Class 3 indicates Lumen and indicates the inner lumen of a blood vessel. Therefore, the boundary between pixels classified as class 2 and class 3 indicates the boundary of the lumen, and the boundary between pixels classified as class 1 and class 2 represents the boundary of the blood vessel. shows.
- the learning model 59 can output region information of a predetermined portion of a blood vessel (that is, information indicating a lumen boundary and a blood vessel boundary).
- the predetermined region includes a blood vessel border and a lumen border.
- the area information is coordinate data of pixels indicating the boundaries of the blood vessel and the boundaries of the lumen.
- the learning model 59 is not limited to U-Net, and may be, for example, GAN (Generative Adversarial Network), SegNet, or the like.
- the learning model 59 can be generated as follows. First, first training data including medical image data indicating a cross-sectional image of a blood vessel and segmentation data indicating the class of each pixel of the medical image data is acquired. For example, the first training data may be collected and stored in the server 200, and may be acquired from the server 200. Next, based on the first training data, the learning model 59 may be generated so as to output segmentation data when medical image data indicating a cross-sectional image of a blood vessel is input to the learning model 59.
- the learning model 59 is trained to output region information for each of the lumen boundary and the blood vessel boundary.
- a model 59 may be generated.
- FIG. 4 is a diagram showing a second example of processing by the learning model 59.
- the second example assumes that there is a side branch of the blood vessel.
- the learning model 59 when medical image data is input to the learning model 59, the learning model 59 outputs area information for each of the lumen boundary and the blood vessel boundary.
- the learning model 59 can output area information of the lumen boundaries and blood vessel boundaries of the main trunk of the blood vessel and the side branches connected to the main trunk. The rest is the same as in the first example, so the explanation will be omitted.
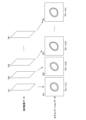
- FIG. 5 is a diagram showing an example of segmentation data output by the learning model 59.
- Medical image data (G1, G2, G3,..., Gn) consisting of cross-sectional images of multiple frames (frames 1 to n) from multiple time-series cross-sectional images of blood vessels obtained by one pullback operation. get.
- the acquired medical image data becomes input data to the learning model 59.
- the learning model 59 outputs segmentation data (S1, S2, S3, . . . , Sn) corresponding to each of frames 1 to n.
- Each segmentation data includes region information of blood vessel boundaries and lumen boundaries, as described in FIG. 3 or 4.
- control unit 51 When medical image data indicating cross-sectional images of multiple frames of a blood vessel is input, the control unit 51 inputs the acquired medical image data to a learning model 59 that outputs region information of a predetermined region of the blood vessel, and then inputs the acquired medical image data for each frame. obtain region information of a predetermined portion of the blood vessel.
- the control unit 51 (feature amount calculation unit 54) can calculate the feature amount of the blood vessel for each frame based on the acquired region information.
- the feature amount calculated by the feature amount calculation unit 54 may be any physical amount that can identify a specific heartbeat cycle that is synchronized with the heartbeat, such as the relative positional relationship between the catheter and the blood vessel that changes with the heartbeat. It is fine as long as it can express.
- the center of gravity of a blood vessel and the average lumen diameter will be described as examples of feature amounts, but the feature amounts are not limited to these. Note that the lumen changes depending on the plaque area ratio (plaque burden), so a blood vessel is preferable.
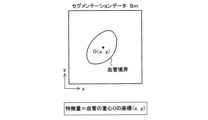
- FIGS. 6A and 6B are diagrams showing examples of feature amounts.
- the feature amount can be calculated using each of the segmentation data S1, S2, S3, . . . , Sn corresponding to frames 1 to n, respectively, illustrated in FIG.
- segmentation data Sm corresponding to frame m will be explained.
- m can be set to 1 to n.
- FIG. 6A shows a case where the coordinates (x, y) of the center of gravity O of the blood vessel are used as the feature amount.
- the center of gravity O of the blood vessel is the center of gravity position of the shape determined by the boundary of the blood vessel represented by the segmentation data.
- the center of gravity O(x,y) can be calculated as follows. In the two-dimensional xy coordinates, the coordinates of a plurality of mass points (all masses are 1) constituting the blood vessel are (x1, y1), (x2, y2), ..., (xn, yn). n is the number of mass points.
- the center of gravity O(x, y) may be calculated as, for example, the center position of a circle that approximates the blood vessel boundary.
- the center of gravity O(x, y) may be calculated, for example, by setting a plurality of vertices on the blood vessel boundary and finding the center of gravity of a polygon made up of each vertex.
- FIG. 6B shows a case where the average lumen diameter D of the blood vessel is used as the feature amount.
- the maximum diameter D1 and the minimum diameter D2 of the line segment passing through the center of gravity O of the blood vessel may be determined, and the average of the maximum diameter D1 and the minimum diameter D2 may be determined as the average lumen diameter D.
- the center of gravity position of the blood vessel is used as the feature amount, but the average lumen diameter D may also be used.
- the feature calculation unit 54 can calculate the center of gravity position O(x, y) of the blood vessel for each of a plurality of frames.
- the feature amount calculation unit 54 calculates the amount of variation in the feature amount for each of a plurality of frames. For example, let the position of the center of gravity in frame (i-1) be ⁇ x(i-1), y(i-1) ⁇ , and let the position of the center of gravity in frame i be ⁇ xi, yi ⁇ .
- the variation amount ⁇ i of the feature amount in frame i is the variation amount from the barycenter position ⁇ x (i-1), y (i-1) ⁇ to the barycenter position ⁇ xi, yi ⁇ , (i-1), y(i-1) ⁇ and ⁇ xi, yi ⁇ .
- FIG. 7 is a diagram showing an example of the variation amount of the blood vessel center of gravity.
- the horizontal axis indicates the frame
- the vertical axis indicates the amount of variation in the center of gravity of the blood vessel.
- the frame identifying unit 55 detects the peak of the blood vessel center of gravity fluctuation amount, and identifies the frame in which the peak is detected as a required frame. Specifically, the frame specifying unit 55 can detect the maximum value (peak) of the amount of variation in the center of gravity of the blood vessel calculated for each frame, and specify the frame corresponding to the detected maximum value as the required frame. Further, at least one of pre-processing and post-processing of the process of detecting a local maximum value (peak) may be performed.
- the preprocessing includes, for example, a process of removing noise in the blood vessel center of gravity fluctuation amount by filtering as preliminary noise removal.
- post-processing includes, for example, (1) processing to remove noise (for example, local maximum values with small values) so that the detected local maximum value (peak) is above a certain level, (2) processing to remove noise between adjacent local maximum values, etc. This includes processing to remove noise (for example, local maximum values with small values) so that the values are equal to or larger than a certain interval. This allows unnecessary noise to be removed.
- noise for example, local maximum values with small values
- FIG. 8 is a diagram showing an example of a method for specifying a required frame.
- the symbol ⁇ indicates the location where the peak of the blood vessel center of gravity fluctuation amount is detected, and the corresponding frame is the required frame.
- the required frame is identified regardless of the presence or absence of side branches.
- the required frame is a frame in which the amount of variation in the blood vessel center of gravity is equal to or greater than a predetermined threshold, and is a frame corresponding to a specific heartbeat cycle.
- the information processing device 50 even if electrocardiogram information etc. cannot be obtained, it is possible to simply obtain medical image data showing cross-sectional images of multiple frames of a blood vessel, and to obtain frames ( (required frame) can be extracted.
- FIG. 9 is a diagram showing an example of the extraction result of required frames.
- FIG. 9A shows the arrangement of blood vessel boundaries of segmentation data (S1, S2, S3, . . . , Sn) corresponding to frames 1 to n of medical image data (G1, G2, G3, . . . , Gn).
- S1, S2, S3, . . . , Sn segmentation data
- FIG. 9A blood vessel boundaries are displayed in all frames, but the blood vessel boundaries vary between frames due to the influence of pulsation, making it difficult to understand the blood vessel boundaries as a whole.
- FIG. 10 is a diagram illustrating an example of a method for identifying a group of corresponding points in a predetermined region when there are no side branches.
- the boundary of a lumen will be described as a predetermined region, but the predetermined region also includes a border of a blood vessel.
- the required frames specified by the frame specifying section 55 are assumed to be 1, 2, 3, . . . , n'. Segmentation data of required frames are assumed to be F1, F2, F3,..., Fi,..., Fj,..., Fn'.
- the number of frames is n', and n' ⁇ total number of frames n.
- Let j be the frame of interest
- i be the corresponding frame corresponding to the frame of interest j.
- the frame of interest j and the corresponding frame i are frames for specifying a group of corresponding points. Note that the frame of interest j and the corresponding frame i do not have to be adjacent frames, and other frames may exist between them.
- the discrete points on the lumen boundary indicated by the segmentation data Fi of frame i are represented by P(i, m), and the discrete points on the lumen boundary indicated by the segmentation data Fj of frame j are represented by P(j, m).
- m is a number from 1 to m and indicates the number of discrete points. Examples of methods for identifying discrete points include (1) sequentially identifying them at the same angle along the boundary, (2) identifying the discrete points so that the distance between them is constant, and (3) identifying the discrete points so that the distance between them is constant. It is possible to use a method of specifying the value so that it is constant. Thereby, regardless of the shape of the boundary, it is possible to suppress excessive twisting and the like and obtain well-balanced discrete points. Furthermore, the number of discrete points on the blood vessel boundary may be less than or equal to the number of discrete points on the lumen boundary. This makes it possible to reduce the number of discrete points on the blood vessel boundary and improve the visibility of the lumen mesh.
- the discrete point P(i,m) with the shortest distance is identified as the corresponding point.
- the distances d1 and d2 between the discrete point P (j, 1) and the discrete points P (i, 1) and P (i, 2) are calculated, and the calculated distances d1 and d2 are compared. Then, since the distance d2 is shorter than the distance d1, the discrete point P(i,2) is selected. Similar comparisons are made for other discrete points.
- FIG. 11 is a diagram showing an example of a method for connecting a group of corresponding points. It is assumed that a group of discrete points on the lumen boundary indicated by segmentation data Fi of frame i is associated with a group of discrete points on the lumen boundary indicated by segmentation data Fj of frame j. Discrete points that are associated with each other are referred to as corresponding points, and corresponding points on the boundary are collectively referred to as a group of corresponding points. Segmentation data Fi for frame i and segmentation data Fj for frame j are arranged along the Z-axis direction with an appropriate distance between them. The Z axis indicates the longitudinal direction of the blood vessel.
- Each corresponding point (corresponding point group) of frames i and j is connected with a straight line in the Z-axis direction. Also, adjacent corresponding points on the boundary are connected with a straight line along the boundary. Thereby, it is possible to generate a 3D image in which the lumen boundaries indicated by the segmentation data of frames i and j are connected in a mesh shape. Similarly, a mesh-like 3D image can be generated for blood vessel boundaries. By performing similar processing on all frames 1 to n, a mesh-like 3D image of the blood vessel can be generated.
- FIG. 12 is a diagram showing a first example of a method for identifying a group of corresponding points in a predetermined region when a side branch exists.
- the presence or absence of side branches can be determined based on segmentation data output by the learning model 59.
- the presence or absence of a side branch may be determined based on the eccentricity of the cross-sectional shape of the blood vessel.
- the eccentricity can be determined by calculating the maximum diameter d1 and minimum diameter d2 of the lumen diameter based on the lumen boundary.
- the presence or absence of a side branch can be determined depending on whether the degree of eccentricity is greater than or equal to a predetermined threshold.
- Circularity may be calculated instead of eccentricity.
- Circularity is the ratio of the area of the inner region of the blood vessel boundary to the circumference of the blood vessel boundary. The closer the degree of circularity is to the ratio of the area of the circle to the length of the circumference, the higher the degree of circularity, and it can be determined that the possibility of a side branch being captured is low.
- the diameter of the target blood vessel border (maximum diameter and minimum diameter) is calculated as a parameter by comparing the diameter of the blood vessel border in the scanned tomographic image, and the diameter
- the presence or absence of a side branch can be determined depending on whether or not there is a sudden change of a predetermined rate or more and a predetermined length or more.
- a learning model for judgment that is trained to output an accuracy corresponding to the possibility that a side branch is captured is used to make a judgment when data on lumen boundaries and blood vessel boundaries are input. You may.
- segmentation data F1,..., F(i-1), Fi have no side branches
- segmentation data Fj, F(j+1) have side branches.
- a frame without a side branch and a frame with a side branch can be associated as corresponding frames.
- segmentation data Fi of frame i and segmentation data Fj of frame j are associated.
- the discrete point group of the lumen boundary of the segmentation Fi and the discrete point group of the main lumen boundary of the segmentation Fj are associated with each other and identified as a corresponding point group, and the same processing as that illustrated in FIG. 10 is performed.
- the discrete point group of the lumen boundary of the side branch of segmentation Fj is left as is and no connection processing is performed.
- FIG. 13 is a diagram showing a second example of a method for identifying a group of corresponding points in a predetermined region when a side branch exists.
- distances d1 and d2 between the discrete point P(j, 1) and the discrete points P(i, 1) and P(i, 2) are calculated.
- it is determined whether or not to perform the association For example, since the distance d1 is shorter than the threshold, the correspondence is made. On the other hand, since the distance d2 is longer than the threshold value, no correspondence is made. In this way, when identifying corresponding points, if the distance between discrete points is equal to or greater than the threshold, they are not connected. Similar comparisons are made for other discrete points.
- control unit 51 specifies a group of corresponding points at a predetermined portion of the blood vessel in two different frames among the required frames specified by the frame specifying unit 55, and calculates the 3D image of the blood vessel based on the specified group of corresponding points. Images can be generated.
- FIGS. 14A and 14B are diagrams showing examples of simulated 3D images of blood vessels.
- the 3D images of blood vessels illustrated in FIGS. 14A and 14B are images that simulate (simulate) what kind of 3D images will become when actually processed.
- FIG. 14A shows a simulated 3D image according to a comparative example.
- a comparative example shows a 3D image of a blood vessel generated using segmentation data of all frames without specifying the required frames. In the comparative example, a lot of blurring occurs in the mesh-like 3D image due to noise caused by pulsation.
- FIG. 14B shows a case where a 3D image according to this embodiment is simulated.
- this embodiment since segmentation data using only required frames is used, noise due to pulsation is removed. As a result, the mesh-like 3D image has almost no blurring, and a clear 3D image can be obtained.
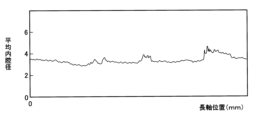
- FIGS. 15A and 15B are diagrams showing examples of blood vessel information based on required frames.
- the horizontal axis shows the position of the long axis of the blood vessel
- the vertical axis shows the plaque area ratio (plaque burden). Since the plaque area ratio shown in FIG. 15A uses segmentation data using only the required frames, noise due to pulsation is removed and it can be calculated with high accuracy. That is, the control unit 51 can generate plaque distribution information (plaque burden) in the axial direction of the blood vessel based on the area information of a predetermined portion of the blood vessel in each of the specified required frames.
- plaque distribution information plaque burden
- the horizontal axis indicates the position of the long axis of the blood vessel
- the vertical axis indicates the average lumen diameter. Since the average lumen diameter shown in FIG. 15B uses segmentation data using only the required frames, noise due to pulsation is removed and can be calculated with high accuracy. That is, the control unit 51 can calculate the average lumen diameter in the axial direction of the blood vessel based on the region information of the predetermined portion of the blood vessel in each of the specified required frames. By obtaining blood vessel information as shown in FIG. 15B, for example, the stent diameter can be determined.
- FIG. 16 is a diagram showing an example of a processing procedure by the information processing device 50.
- the control unit 51 acquires medical image data (S11), inputs the acquired medical image data to the learning model 59, and obtains region information of a predetermined portion of the blood vessel (for example, blood vessel boundary and lumen boundary) for each frame. (S12).
- the control unit 51 calculates the feature amount for each frame (for example, blood vessel centroid) based on the obtained region information of the predetermined region (S13), and calculates the change in the feature amount for each frame based on the difference in the feature amount between frames. The amount is calculated (S14).
- the control unit 51 detects the maximum value (peak) of the amount of variation calculated for each frame and identifies the required frame (S15). For specifying the required frame, see FIG. 8, for example.
- the control unit 51 identifies a group of corresponding points of a predetermined region in two different required frames among the specified required frames (S16), and generates a mesh-like 3D image of a blood vessel using the identified corresponding point group. (S17).
- the control unit 51 calculates the plaque area ratio and average lumen diameter in the long axis direction of the blood vessel based on the area information of the predetermined region in the specified required frame (S18), and ends the process. Note that the process of step S18 can be branched from the process of step S15 and can be performed in parallel with the processes of steps S16 to S17.
- the computer program of the present embodiment causes a computer to acquire medical image data showing cross-sectional images of multiple frames of a hollow organ, and calculates feature amounts of the hollow organ for each frame based on the acquired medical image data. Then, a process is executed to detect a local maximum value of the variation amount of the feature amount between frames, and to specify a plurality of required frames from among the plurality of frames based on the detected local maximum value.
- the computer program of the present embodiment is configured to acquire, when medical image data indicating cross-sectional images of a plurality of frames of a hollow organ is input to a computer, a learning model that outputs area information of a predetermined region of the hollow organ. inputting the medical image data obtained, acquiring area information of a predetermined part of the hollow organ for each frame, and calculating feature amounts of the hollow organ for each frame based on the obtained area information. .
- the feature amount includes the center of gravity position or the average lumen diameter of the hollow organ.
- the computer program of this embodiment causes a computer to execute a process of generating plaque distribution information in the axial direction of the hollow organ based on area information of a predetermined region of the hollow organ in each of the specified required frames.
- the computer program of this embodiment causes a computer to execute a process of calculating the average lumen diameter in the axial direction of the hollow organ based on area information of a predetermined region of the hollow organ in each of the specified required frames.
- the computer program of this embodiment causes a computer to specify a group of corresponding points at a predetermined part of the hollow organ in two different frames among the specified required frames, and to determine whether the hollow organ is connected based on the specified group of corresponding points. Execute processing to generate a 3D image.
- the information processing device of this embodiment includes an acquisition unit that acquires medical image data showing cross-sectional images of a plurality of frames of a hollow organ, and a feature amount of the hollow organ for each frame based on the acquired medical image data. a calculation unit that calculates, a detection unit that detects a maximum value of the variation amount of the feature amount between frames, and a specification unit that identifies a plurality of required frames from among the plurality of frames based on the detected maximum value. Be prepared.
- the information processing method of the present embodiment acquires medical image data showing cross-sectional images of a plurality of frames of a hollow organ, calculates the feature amount of the hollow organ for each frame based on the obtained medical image data, A local maximum value of the variation amount of the feature quantity between frames is detected, and a plurality of required frames are specified from among the plurality of frames based on the detected maximum value.
- Communication network 10 Catheter 20 MDU 30 Display device 40 Input device 50 Information processing device 51 Control unit 52 Communication unit 53 Interface unit 54 Feature calculation unit 55 Frame identification unit 56 Memory 57 Storage unit 58 Computer program 59 Learning model 59a Input layer 59b Intermediate layer 59c Output layer 60 Recording Media reading unit 61 Recording medium 200 Server
Abstract
Provided are a computer program which can extract frames at a specific period only from a medical image, an information processing device, and an information processing method. The computer program causes a computer to execute processing including: acquiring medical image data that represents a cross sectional image of a plurality of frames of a vascular organ; calculating a feature amount of the vascular organ for each of the frames on the basis of the acquired medical image data; detecting a maximum value of a variation amount of the feature amount between the frames; and identifying a plurality of required frames among the plurality of frames on the basis of the detected maximum values.
Description
本発明は、コンピュータプログラム、情報処理装置及び情報処理方法に関する。
The present invention relates to a computer program, an information processing device, and an information processing method.
特許文献1には、血管内にカテーテルを挿入し、カテーテル内に収容されたイメージングコアで得られた信号(血管組織に向けて出射した超音波、及び反射波)に基づいて血管断面画像を生成する画像診断装置が開示されている。
Patent Document 1 discloses that a catheter is inserted into a blood vessel, and a blood vessel cross-sectional image is generated based on signals (ultrasound waves emitted toward the blood vessel tissue and reflected waves) obtained by an imaging core housed in the catheter. An image diagnostic apparatus is disclosed.
医用画像、例えば、IVUS(Intra Vascular Ultra Sound:血管内超音波)画像を取得する際には、心臓の拍動の影響により、カテーテルが冠動脈に対して相対的に前後左右に移動する可能性がある。このため、一定速度でプルバック操作を行って取得した血管断面画像において、血管の形状や位置が変動するため、血管の3次元的な形状を正確に再現できない場合がある。そこで、医用画像とともに心電図情報を同時に取得し、取得した心電図情報に基づいて特定周期のフレームのみを抽出することで、冠動脈に対するカテーテルの相対的な移動を抑制することが考えられる。
When acquiring medical images, such as IVUS (Intra Vascular Ultra Sound) images, there is a possibility that the catheter may move back and forth or left or right relative to the coronary arteries due to the influence of heart beats. be. For this reason, in a blood vessel cross-sectional image obtained by performing a pullback operation at a constant speed, the shape and position of the blood vessel fluctuate, so that the three-dimensional shape of the blood vessel may not be accurately reproduced. Therefore, it may be possible to suppress the movement of the catheter relative to the coronary artery by simultaneously acquiring electrocardiogram information along with the medical image and extracting only frames of a specific period based on the acquired electrocardiogram information.
しかし、PCI(経皮的冠動脈インターベンション)の手技において、心電図情報が常に得られるわけではないため、実際には、血管の3次元的な形状を正確に再現できないという問題が生じる。
However, in the procedure of PCI (percutaneous coronary intervention), since electrocardiogram information is not always obtained, a problem arises in that the three-dimensional shape of the blood vessel cannot be accurately reproduced.
本発明は、斯かる事情に鑑みてなされたものであり、医用画像だけで特定周期のフレームを抽出できるコンピュータプログラム、情報処理装置及び情報処理方法を提供することを目的とする。
The present invention has been made in view of the above circumstances, and it is an object of the present invention to provide a computer program, an information processing device, and an information processing method that can extract frames of a specific period from only medical images.
本願は上記課題を解決する手段を複数含んでいるが、その一例を挙げるならば、コンピュータプログラムは、コンピュータに、管腔器官の複数のフレームの断面画像を示す医用画像データを取得し、取得した医用画像データに基づいて、フレーム毎の管腔器官の特徴量を算出し、フレーム間の前記特徴量の変動量の極大値を検出し、検出した極大値に基づいて複数の所要フレームを前記複数のフレームの中から特定する、処理を実行させる。
The present application includes a plurality of means for solving the above-mentioned problems. To give one example, a computer program causes a computer to acquire medical image data showing cross-sectional images of a plurality of frames of a hollow organ. Based on medical image data, the feature amount of the hollow organ is calculated for each frame, the maximum value of the variation amount of the feature amount between frames is detected, and a plurality of required frames are divided into the plurality of frames based on the detected maximum value. Specify from among the frames and execute the process.
本発明によれば、医用画像だけで特定周期のフレームを抽出できる。
According to the present invention, frames of a specific period can be extracted only from medical images.
以下、本発明の実施の形態について説明する。図1は本実施の形態の情報処理システム100の構成の一例を示す図である。情報処理システム100は、例えば、画像診断システムであり、心臓カテーテル治療(PCI)に用いられる血管内イメージング(画像診断)を行うための装置である。心臓カテーテル治療は、脚の付け根や腕、手首などの血管からカテーテルを差し込んで、冠動脈の狭くなった部分を治療する方法である。血管内イメージングには、血管内超音波検査(IVUS:Intra Vascular Ultra Sound)法、光干渉断層診断(OFDI:Optical Frequency Domain Imaging、OCT:Optical Coherence Tomography)法、の二つの方法がある。IVUSは、超音波の反射を利用して、血管内部を断層画像で読影する。具体的には、先端に超小型センサを搭載した細いカテーテルを冠動脈内に挿入し、病変部まで通した後、センサから発信される超音波で血管内の医用画像を生成することができる。OFDIは、近赤外線を用いて、血管内の状態を高解像度の画像で読影する。具体的には、IVUSと同様に、カテーテルを血管内に挿入し、先端部から近赤外線を照射し、干渉法によって血管の断面を測定し、医用画像を生成する。また、OCTは、近赤外線と光ファイバ技術を応用した血管内画像診断である。本明細書では、管腔器官の例として血管について説明する。また、本明細書において、医用画像(医用画像データ)は、IVUS、OFDI、又はOCTによって生成されたものを含むが、以下では、主にIVUS法を用いた場合について説明する。
Embodiments of the present invention will be described below. FIG. 1 is a diagram showing an example of the configuration of an information processing system 100 according to the present embodiment. The information processing system 100 is, for example, an image diagnosis system, and is a device for performing intravascular imaging (image diagnosis) used in cardiac catheterization (PCI). Cardiac catheterization is a method of treating narrowed coronary arteries by inserting a catheter through a blood vessel in the groin, arm, or wrist. There are two methods for intravascular imaging: intravascular ultrasound (IVUS), optical frequency domain imaging (OFDI), and optical coherence tomography (OCT). IVUS uses reflected ultrasound waves to interpret the inside of a blood vessel as a tomographic image. Specifically, a thin catheter equipped with an ultra-small sensor at the tip is inserted into a coronary artery, passed to a lesion, and then a medical image of the inside of the blood vessel can be generated using ultrasound waves emitted from the sensor. OFDI uses near-infrared rays to interpret the condition inside blood vessels using high-resolution images. Specifically, similar to IVUS, a catheter is inserted into a blood vessel, near-infrared rays are irradiated from the tip, and a cross section of the blood vessel is measured using interferometry to generate a medical image. Furthermore, OCT is an intravascular image diagnosis that applies near-infrared rays and optical fiber technology. In this specification, a blood vessel will be described as an example of a hollow organ. Further, in this specification, medical images (medical image data) include those generated by IVUS, OFDI, or OCT, but below, the case where the IVUS method is mainly used will be described.
情報処理システム100は、カテーテル10、MDU(Motor Drive Unit)20、表示装置30、入力装置40、及び情報処理装置50を備える。情報処理装置50には、通信ネットワーク1を介してサーバ200が接続されている。
The information processing system 100 includes a catheter 10, an MDU (Motor Drive Unit) 20, a display device 30, an input device 40, and an information processing device 50. A server 200 is connected to the information processing device 50 via the communication network 1.
カテーテル10は、IVUS法によって血管の超音波断層像を得るための画像診断用カテーテルである。カテーテル10は、血管の超音波断層像を得るための超音波プローブを先端部に有する。超音波プローブは、血管内において超音波を発する超音波振動子、及び血管の生体組織又は医用機器などの構造物で反射された反射波(超音波エコー)を受信する超音波センサを有する。超音波プローブは、血管の周方向に回転しながら、血管の長手方向に進退可能に構成されている。
The catheter 10 is an image diagnostic catheter for obtaining ultrasonic tomographic images of blood vessels using the IVUS method. The catheter 10 has an ultrasonic probe at its tip for obtaining ultrasonic tomographic images of blood vessels. The ultrasonic probe includes an ultrasonic transducer that emits ultrasonic waves within a blood vessel, and an ultrasonic sensor that receives reflected waves (ultrasonic echoes) reflected from structures such as living tissue in the blood vessel or medical equipment. The ultrasound probe is configured to be able to move forward and backward in the longitudinal direction of the blood vessel while rotating in the circumferential direction of the blood vessel.
MDU20は、カテーテル10を着脱可能に取り付けることができる駆動装置であり、医療従事者の操作に応じて内蔵モータを駆動して、血管内に挿入されたカテーテル10の動作を制御する。MDU20は、カテーテル10の超音波プローブを先端(遠位)側から基端(近位)側へ移動させながら周方向に回転させることができる(プルバック操作)。超音波プローブは、所定の時間間隔で連続的に血管内を走査し、検出された超音波の反射波データを情報処理装置50へ出力する。
The MDU 20 is a drive device to which the catheter 10 can be detachably attached, and controls the operation of the catheter 10 inserted into a blood vessel by driving a built-in motor in response to operations by a medical worker. The MDU 20 can be rotated in the circumferential direction while moving the ultrasound probe of the catheter 10 from the tip (distal) side to the base (proximal) side (pullback operation). The ultrasound probe continuously scans the inside of the blood vessel at predetermined time intervals and outputs reflected wave data of the detected ultrasound waves to the information processing device 50.
情報処理装置50は、カテーテル10の超音波プローブから出力された反射波データに基づいて、血管の時系列(複数のフレーム)の断面画像を示す医用画像データを取得する。超音波プローブは、血管内を先端(遠位)側から基端(近位)側へ移動しながら血管内を走査するため、時系列順の複数の医用画像は、遠位から近位にわたる複数箇所で観測された血管の断層画像となる。
The information processing device 50 acquires medical image data showing time-series (multiple frames) cross-sectional images of blood vessels based on the reflected wave data output from the ultrasound probe of the catheter 10. The ultrasound probe scans the inside of the blood vessel while moving from the tip (distal) side to the proximal end (proximal) side, so multiple medical images in chronological order are multiple images spanning from distal to proximal. This is a tomographic image of the blood vessels observed at the location.
表示装置30は、液晶表示パネル、有機EL表示パネル等を備え、情報処理装置50による処理結果を表示することができる。また、表示装置30は、情報処理装置50が生成(取得)した医用画像を表示することができる。
The display device 30 includes a liquid crystal display panel, an organic EL display panel, etc., and can display processing results by the information processing device 50. Furthermore, the display device 30 can display medical images generated (acquired) by the information processing device 50.
入力装置40は、検査を行う際の各種設定値の入力、情報処理装置50の操作等を受け付けるキーボード、マウス等の入力インタフェースである。入力装置40は、表示装置30に設けられたタッチパネル、ソフトキー、ハードキー等であってもよい。
The input device 40 is an input interface such as a keyboard or a mouse that accepts input of various setting values when performing an inspection, operation of the information processing device 50, and the like. The input device 40 may be a touch panel, soft keys, hard keys, etc. provided on the display device 30.
サーバ200は、例えば、データサーバであり、医用画像データを蓄積した画像DBを備えてもよい。
The server 200 is, for example, a data server, and may include an image DB that stores medical image data.
図2は情報処理装置50の構成の一例を示す図である。情報処理装置50は、情報処理装置50全体を制御する制御部51、通信部52、インタフェース部53、特徴量算出部54、フレーム特定部55、メモリ56、記憶部57、及び記録媒体読取部60を備える。記憶部57は、コンピュータプログラム58、及び学習モデル59を記憶する。
FIG. 2 is a diagram showing an example of the configuration of the information processing device 50. The information processing device 50 includes a control unit 51 that controls the entire information processing device 50, a communication unit 52, an interface unit 53, a feature amount calculation unit 54, a frame identification unit 55, a memory 56, a storage unit 57, and a recording medium reading unit 60. Equipped with The storage unit 57 stores a computer program 58 and a learning model 59.
特徴量算出部54、及びフレーム特定部55は、ハードウエアで構成してもよく、ソフトウエア(コンピュータプログラム58)で実現するようにしてもよく、あるいはハードウエアとソフトウエアの両方で構成してもよい。情報処理装置50は、複数の情報処理装置で機能を分散して構成してもよい。
The feature amount calculation unit 54 and the frame identification unit 55 may be implemented by hardware, software (computer program 58), or both hardware and software. Good too. The information processing device 50 may be configured with functions distributed among a plurality of information processing devices.
制御部51は、CPU(Central Processing Unit)、MPU(Micro-Processing Unit)、GPU(Graphics Processing Unit)、GPGPU(General-purpose computing on graphics processing units)、TPU(Tensor Processing Unit)等が所要数組み込まれて構成されてもよい。また、制御部51は、DSP(Digital Signal Processors)、FPGA(Field-Programmable Gate Arrays)、量子プロセッサなどを組み合わせて構成してもよい。
The control unit 51 incorporates a required number of CPU (Central Processing Unit), MPU (Micro-Processing Unit), GPU (Graphics Processing Unit), GPGPU (General-purpose computing on graphics processing units), TPU (Tensor Processing Unit), etc. It may be configured as follows. Further, the control unit 51 may be configured by combining DSPs (Digital Signal Processors), FPGAs (Field-Programmable Gate Arrays), quantum processors, and the like.
制御部51は、コンピュータプログラム58で定められた処理を実行することができる。すなわち、制御部51による処理は、コンピュータプログラム58による処理でもある。
The control unit 51 can execute processing determined by the computer program 58. That is, the processing by the control unit 51 is also the processing by the computer program 58.
メモリ56は、SRAM(Static Random Access Memory)、DRAM(Dynamic Random Access Memory)、フラッシュメモリ等の半導体メモリで構成することができる。コンピュータプログラム58をメモリ56に展開して、制御部51がコンピュータプログラム58を実行することができる。
The memory 56 can be composed of semiconductor memory such as SRAM (Static Random Access Memory), DRAM (Dynamic Random Access Memory), and flash memory. The computer program 58 can be loaded into the memory 56 and the control unit 51 can execute the computer program 58.
通信部52は、例えば、通信モジュールを備え、通信ネットワーク1を介してサーバ200との間の通信機能を有する。また、通信部52は、通信ネットワーク1に接続されている外部の装置(不図示)との間の通信機能を備えてもよい。通信部52は、血管の複数のフレームの断面画像を示す医用画像データをサーバ200から取得してもよい。
The communication unit 52 includes, for example, a communication module and has a communication function with the server 200 via the communication network 1. Further, the communication unit 52 may have a communication function with an external device (not shown) connected to the communication network 1. The communication unit 52 may acquire medical image data showing cross-sectional images of multiple frames of a blood vessel from the server 200.
インタフェース部53は、カテーテル10、表示装置30及び入力装置40との間のインタフェース機能を提供する。情報処理装置50(制御部51)は、インタフェース部53を通じて、カテーテル10、表示装置30及び入力装置40との間でデータや情報の送信及び受信を行うことができる。インタフェース部53は、血管の複数のフレームの断面画像を示す医用画像データをカテーテル10から取得してもよい。
The interface section 53 provides an interface function between the catheter 10, the display device 30, and the input device 40. The information processing device 50 (control unit 51) can transmit and receive data and information between the catheter 10, the display device 30, and the input device 40 through the interface unit 53. The interface unit 53 may acquire medical image data showing cross-sectional images of multiple frames of a blood vessel from the catheter 10.
記録媒体読取部60は、例えば、光学ディスクドライブで構成することができ、記録媒体61(例えば、CD-ROM等の光学可読ディスク記憶媒体)に記録されたコンピュータプログラム58(プログラム製品)を記録媒体読取部60で読み取って記憶部57に格納することができる。コンピュータプログラム58は、メモリ56に展開されて、制御部51により実行される。なお、コンピュータプログラム58は、通信部52を介して、外部の装置からダウンロードして記憶部57に格納してもよい。
The recording medium reading section 60 can be configured with, for example, an optical disk drive, and reads the computer program 58 (program product) recorded on the recording medium 61 (for example, an optically readable disk storage medium such as a CD-ROM) into the recording medium. It can be read by the reading unit 60 and stored in the storage unit 57. The computer program 58 is loaded into the memory 56 and executed by the control unit 51. Note that the computer program 58 may be downloaded from an external device via the communication unit 52 and stored in the storage unit 57.
記憶部57は、例えば、ハードディスク又は半導体メモリ等で構成することができ、所要の情報(例えば、情報処理装置50による処理途中のデータや処理結果など)を記憶することができる。
The storage unit 57 can be configured with, for example, a hard disk or a semiconductor memory, and can store necessary information (for example, data being processed by the information processing device 50, processing results, etc.).
特徴量算出部54は、算出部としての機能を有し、インタフェース部53又は通信部52を介して取得した医用画像データに基づいて、フレーム毎の血管の特徴量を算出する。特徴量の詳細については後述する。
The feature amount calculation unit 54 has a function as a calculation unit, and calculates the feature amount of blood vessels for each frame based on the medical image data acquired via the interface unit 53 or the communication unit 52. Details of the feature amounts will be described later.
フレーム特定部55は、検出部及び特定部としての機能を有し、フレーム間の特徴量の変動量の極大値(ピーク)を検出し、検出した極大値に基づいて複数の所要フレームを複数のフレームの中から特定する。所要フレームの特定方法の詳細については後述する。
The frame specifying unit 55 has a function as a detecting unit and a specifying unit, and detects the maximum value (peak) of the variation amount of the feature amount between frames, and selects a plurality of required frames based on the detected maximum value. Identify from within the frame. Details of the method for identifying the required frame will be described later.
図3は学習モデル59による処理の第1例を示す図である。第1例は、血管の側枝がない場合を想定している。学習モデル59は、入力層59a、中間層59b、及び出力層59cを備え、例えば、U-Netで構成することができる。中間層59bは、複数のエンコーダ、及び複数のデコーダを備える。入力層59aに入力された医用画像データに対して、複数のエンコーダで畳み込み処理を繰り返す。エンコーダで畳み込まれた画像に対して、複数のデコーダでアップサンプリング(逆畳み込み)処理を繰り返す。畳み込まれた画像をデコードする際に、エンコーダで生成した特徴マップを逆畳み込み処理を行う画像に足し合わせる処理を行う。これにより、畳み込み処理によって失われる位置情報を保持することができ、より精度の高いセグメンテーション(いずれのピクセルがいずれのクラスであるか)を出力することができる。
FIG. 3 is a diagram showing a first example of processing by the learning model 59. The first example assumes a case where there are no side branches of the blood vessel. The learning model 59 includes an input layer 59a, a middle layer 59b, and an output layer 59c, and can be configured with U-Net, for example. The intermediate layer 59b includes multiple encoders and multiple decoders. Convolution processing is repeated using a plurality of encoders on the medical image data input to the input layer 59a. Multiple decoders repeatedly perform upsampling (deconvolution) processing on the image convolved by the encoder. When decoding a convolved image, the feature map generated by the encoder is added to the image to be deconvolved. This makes it possible to retain positional information that is lost due to convolution processing, and to output segmentation (which pixel belongs to which class) with higher accuracy.
学習モデル59は、医用画像データが入力されると、セグメンテーションデータ(所定部位の領域情報)を出力することができる。セグメンテーションデータは、医用画像データの各ピクセルをクラスに分類したものである。学習モデル59は、入力された医用画像データそれぞれのピクセルを、例えば、クラス1、2、3の3つのクラスに分類することができる。クラス1はBackgroundを示し、血管の外側の領域を示す。クラス2は(Plaque + Media)を示し、プラークを含む血管の領域を示す。クラス3はLumenを示し、血管の内腔を示す。従って、クラス2に分類されたピクセルとクラス3に分類されたピクセルとの境界は内腔の境界を示し、クラス1に分類されたピクセルとクラス2に分類されたピクセルとの境界は血管の境界を示す。すなわち、学習モデル59は、医用画像データが入力されると、血管の所定部位の領域情報(すなわち、内腔の境界及び血管の境界を示す情報)を出力することができる。所定部位は、血管の境界及び内腔の境界を含む。領域情報は、血管の境界及び内腔の境界それぞれを示す画素(ピクセル)の座標データである。なお、学習モデル59は、U-Netに限定されるものではなく、例えば、GAN(Generative Adversarial Network)、SegNet等でもよい。
The learning model 59 can output segmentation data (region information of a predetermined region) when medical image data is input. Segmentation data is obtained by classifying each pixel of medical image data into classes. The learning model 59 can classify each pixel of input medical image data into three classes, eg, classes 1, 2, and 3. Class 1 indicates Background and indicates the area outside the blood vessel. Class 2 indicates (Plaque + Media) and indicates the area of the blood vessel containing plaque. Class 3 indicates Lumen and indicates the inner lumen of a blood vessel. Therefore, the boundary between pixels classified as class 2 and class 3 indicates the boundary of the lumen, and the boundary between pixels classified as class 1 and class 2 represents the boundary of the blood vessel. shows. That is, when medical image data is input, the learning model 59 can output region information of a predetermined portion of a blood vessel (that is, information indicating a lumen boundary and a blood vessel boundary). The predetermined region includes a blood vessel border and a lumen border. The area information is coordinate data of pixels indicating the boundaries of the blood vessel and the boundaries of the lumen. Note that the learning model 59 is not limited to U-Net, and may be, for example, GAN (Generative Adversarial Network), SegNet, or the like.
学習モデル59の生成方法は、以下のようにすることができる。まず、血管の断面画像を示す医用画像データ、及び当該医用画像データの各ピクセルのクラスを示すセグメンテーションデータを含む第1訓練データを取得する。例えば、第1訓練データをサーバ200で収集して記憶しておき、サーバ200から取得するようにすればよい。次に、第1訓練データに基づいて、血管の断面画像を示す医用画像データを学習モデル59に入力した場合に、セグメンテーションデータを出力するように学習モデル59を生成すればよい。別言すれば、第1訓練データに基づいて、血管の断面画像を示す医用画像データを学習モデル59に入力した場合に、内腔の境界及び血管の境界それぞれの領域情報を出力するように学習モデル59を生成すればよい。
The learning model 59 can be generated as follows. First, first training data including medical image data indicating a cross-sectional image of a blood vessel and segmentation data indicating the class of each pixel of the medical image data is acquired. For example, the first training data may be collected and stored in the server 200, and may be acquired from the server 200. Next, based on the first training data, the learning model 59 may be generated so as to output segmentation data when medical image data indicating a cross-sectional image of a blood vessel is input to the learning model 59. In other words, based on the first training data, when medical image data indicating a cross-sectional image of a blood vessel is input to the learning model 59, the learning model 59 is trained to output region information for each of the lumen boundary and the blood vessel boundary. A model 59 may be generated.
図4は学習モデル59による処理の第2例を示す図である。第2例は、血管の側枝がある場合と想定している。第1例の場合と同様に、学習モデル59に医用画像データが入力されると、学習モデル59は、内腔の境界及び血管の境界それぞれの領域情報を出力する。学習モデル59は、血管の本幹及び本幹に繋がる側枝それぞれの内腔の境界及び血管の境界の領域情報を出力できる。他は第1例の場合と同様であるので説明を省略する。
FIG. 4 is a diagram showing a second example of processing by the learning model 59. The second example assumes that there is a side branch of the blood vessel. As in the first example, when medical image data is input to the learning model 59, the learning model 59 outputs area information for each of the lumen boundary and the blood vessel boundary. The learning model 59 can output area information of the lumen boundaries and blood vessel boundaries of the main trunk of the blood vessel and the side branches connected to the main trunk. The rest is the same as in the first example, so the explanation will be omitted.
図5は学習モデル59が出力するセグメンテーションデータの一例を示す図である。1回のプルバック操作によって得られた複数の時系列の血管の断面画像から、複数のフレーム(フレーム1~n)の断面画像で構成される医用画像データ(G1,G2,G3,…,Gn)を取得する。取得した医用画像データは、学習モデル59への入力データとなる。学習モデル59は、フレーム1~nそれぞれに対応するセグメンテーションデータ(S1,S2,S3,…,Sn)を出力する。各セグメンテーションデータは、図3又は図4で説明したように、血管の境界及び内腔の境界の領域情報を含む。
FIG. 5 is a diagram showing an example of segmentation data output by the learning model 59. Medical image data (G1, G2, G3,..., Gn) consisting of cross-sectional images of multiple frames (frames 1 to n) from multiple time-series cross-sectional images of blood vessels obtained by one pullback operation. get. The acquired medical image data becomes input data to the learning model 59. The learning model 59 outputs segmentation data (S1, S2, S3, . . . , Sn) corresponding to each of frames 1 to n. Each segmentation data includes region information of blood vessel boundaries and lumen boundaries, as described in FIG. 3 or 4.
制御部51は、血管の複数のフレームの断面画像を示す医用画像データを入力した場合に、血管の所定部位の領域情報を出力する学習モデル59に、取得した医用画像データを入力してフレーム毎の血管の所定部位の領域情報を取得する。制御部51(特徴量算出部54)は、取得した領域情報に基づいてフレーム毎の血管の特徴量を算出することができる。
When medical image data indicating cross-sectional images of multiple frames of a blood vessel is input, the control unit 51 inputs the acquired medical image data to a learning model 59 that outputs region information of a predetermined region of the blood vessel, and then inputs the acquired medical image data for each frame. obtain region information of a predetermined portion of the blood vessel. The control unit 51 (feature amount calculation unit 54) can calculate the feature amount of the blood vessel for each frame based on the acquired region information.
次に、特徴量算出部54が算出する特徴量について説明する。特徴量は、心電図情報などと同様に、拍動と同期する特定心拍周期を同定できるような物理量であればよく、例えば、拍動に伴って変化する、カテーテルと血管との相対的な位置関係を表現できるものであればよい。本明細書では、特徴量として、血管の重心、及び平均内腔径を例として説明するが、特徴量はこれらに限定されない。なお、内腔はプラーク面積率(プラークバーデン)によって変化するので、血管が望ましい。
Next, the feature amount calculated by the feature amount calculation unit 54 will be explained. Similar to electrocardiogram information, the feature amount may be any physical amount that can identify a specific heartbeat cycle that is synchronized with the heartbeat, such as the relative positional relationship between the catheter and the blood vessel that changes with the heartbeat. It is fine as long as it can express. In this specification, the center of gravity of a blood vessel and the average lumen diameter will be described as examples of feature amounts, but the feature amounts are not limited to these. Note that the lumen changes depending on the plaque area ratio (plaque burden), so a blood vessel is preferable.
図6A及び図6Bは特徴量の一例を示す図である。特徴量は、図5に例示した、フレーム1~nそれぞれに対応するセグメンテーションデータS1,S2,S3,…,Snのそれぞれで算出することができる。図6の例では、フレームmに対応するセグメンテーションデータSmについて説明する。ここで、m=1~nとすることができる。
6A and 6B are diagrams showing examples of feature amounts. The feature amount can be calculated using each of the segmentation data S1, S2, S3, . . . , Sn corresponding to frames 1 to n, respectively, illustrated in FIG. In the example of FIG. 6, segmentation data Sm corresponding to frame m will be explained. Here, m can be set to 1 to n.
図6Aは、特徴量として、血管の重心Oの座標(x,y)を用いる場合を示す。具体的には、血管の重心Oは、セグメンテーションデータで表される血管の境界で決定される形状の重心位置である。重心O(x,y)は、以下のようにして算出することができる。xyの2次元座標において、血管を構成する複数の質点(質量は全て1とする)の座標を、(x1,y1)、(x2,y2)、…、(xn,yn)とする。nは質点の数である。x軸方向の重心Oのまわりのモーメントのつり合い条件から、重心Oのx座標は、x=(x1+x2+…+xn)/nで求めることができる。また、y軸方向の重心Oのまわりのモーメントのつり合い条件から、重心Oのy座標は、y=(y1+y2+…+yn)/nで求めることができる。また、重心O(x,y)の算出は、例えば、血管境界に近似する円形の中心位置として求めてもよい。また、重心O(x,y)の算出は、例えば、血管境界上に複数の頂点を設定し、各頂点からなる多角形の重心として求めてもよい。
FIG. 6A shows a case where the coordinates (x, y) of the center of gravity O of the blood vessel are used as the feature amount. Specifically, the center of gravity O of the blood vessel is the center of gravity position of the shape determined by the boundary of the blood vessel represented by the segmentation data. The center of gravity O(x,y) can be calculated as follows. In the two-dimensional xy coordinates, the coordinates of a plurality of mass points (all masses are 1) constituting the blood vessel are (x1, y1), (x2, y2), ..., (xn, yn). n is the number of mass points. From the moment balance condition around the center of gravity O in the x-axis direction, the x coordinate of the center of gravity O can be determined as x=(x1+x2+...+xn)/n. Further, from the moment balance condition around the center of gravity O in the y-axis direction, the y coordinate of the center of gravity O can be determined as y=(y1+y2+...+yn)/n. Further, the center of gravity O(x, y) may be calculated as, for example, the center position of a circle that approximates the blood vessel boundary. Further, the center of gravity O(x, y) may be calculated, for example, by setting a plurality of vertices on the blood vessel boundary and finding the center of gravity of a polygon made up of each vertex.
図6Bは、特徴量として、血管の平均内腔径Dを用いる場合を示す。具体的には、血管の重心Oを通る線分のうち、最大径D1と最小径D2を求め、最大径D1と最小径D2の平均を平均内腔径Dとして求めてもよい。以下では、特徴量として血管の重心位置を用いるが、平均内腔径Dを用いてもよい。
FIG. 6B shows a case where the average lumen diameter D of the blood vessel is used as the feature amount. Specifically, the maximum diameter D1 and the minimum diameter D2 of the line segment passing through the center of gravity O of the blood vessel may be determined, and the average of the maximum diameter D1 and the minimum diameter D2 may be determined as the average lumen diameter D. In the following, the center of gravity position of the blood vessel is used as the feature amount, but the average lumen diameter D may also be used.
上述のように、特徴量算出部54は、複数のフレーム毎に、血管の重心位置O(x,y)を算出することができる。
As described above, the feature calculation unit 54 can calculate the center of gravity position O(x, y) of the blood vessel for each of a plurality of frames.
特徴量算出部54は、複数のフレーム毎に、特徴量の変動量を算出する。例えば、フレーム(i-1)での重心位置を{x(i-1),y(i-1)}とし、フレームiでの重心位置を{xi,yi}とする。フレームiでの特徴量の変動量Δiは、重心位置{x(i-1),y(i-1)}から重心位置{xi,yi}への変動量であり、2つの重心位置{x(i-1),y(i-1)}と{xi,yi}との間の距離で表すことができる。
The feature amount calculation unit 54 calculates the amount of variation in the feature amount for each of a plurality of frames. For example, let the position of the center of gravity in frame (i-1) be {x(i-1), y(i-1)}, and let the position of the center of gravity in frame i be {xi, yi}. The variation amount Δi of the feature amount in frame i is the variation amount from the barycenter position {x (i-1), y (i-1)} to the barycenter position {xi, yi}, (i-1), y(i-1)} and {xi, yi}.
図7は血管重心変動量の一例を示す図である。図中、横軸はフレームを示し、縦軸は血管重心変動量を示す。拍動の影響により、血管とカテーテルとの相対的な位置関係が変化するので、血管断面画像上の血管の形状や位置が変動する。このため、フレーム毎の血管重心変動量は、図7のように、脈流(不安定な変動)として表れる。なお、図中、血管重心変動量のピークが、他のピークよりも大きいフレームが存在しているが、これは血管の側枝が存在する箇所であり、側枝の有無によって、血管の重心位置が大きく変動するからである。
FIG. 7 is a diagram showing an example of the variation amount of the blood vessel center of gravity. In the figure, the horizontal axis indicates the frame, and the vertical axis indicates the amount of variation in the center of gravity of the blood vessel. Because the relative positional relationship between the blood vessel and the catheter changes due to the influence of the pulsations, the shape and position of the blood vessel on the blood vessel cross-sectional image vary. Therefore, the amount of variation in the blood vessel center of gravity for each frame appears as a pulsating flow (unstable variation) as shown in FIG. In addition, in the figure, there are frames in which the peak of the variation of the blood vessel center of gravity is larger than other peaks, but this is a location where a side branch of the blood vessel exists, and the position of the center of gravity of the blood vessel may vary depending on the presence or absence of a side branch. This is because it fluctuates.
フレーム特定部55は、血管重心変動量のピークを検出し、ピークが検出されたフレームを所要フレームとして特定する。具体的には、フレーム特定部55は、フレーム毎に算出された血管重心変動量の極大値(ピーク)を検出し、検出した極大値に対応するフレームを所要フレームとして特定することができる。また、極大値(ピーク)を検出する処理の前処理、及び後処理の少なくとも一方を行ってもよい。前処理は、例えば、事前のノイズ除去として、フィルタ処理で血管重心変動量のノイズを除去する処理を含む。また、後処理は、例えば、(1)検出した極大値(ピーク)が一定以上となるようにノイズ(例えば、値の小さい極大値など)を除去する処理、(2)隣り合う極大値の間が一定間隔以上となるようにノイズ(例えば、値の小さい極大値など)を除去する処理を含む。これにより、不要なノイズを除去できる。
The frame identifying unit 55 detects the peak of the blood vessel center of gravity fluctuation amount, and identifies the frame in which the peak is detected as a required frame. Specifically, the frame specifying unit 55 can detect the maximum value (peak) of the amount of variation in the center of gravity of the blood vessel calculated for each frame, and specify the frame corresponding to the detected maximum value as the required frame. Further, at least one of pre-processing and post-processing of the process of detecting a local maximum value (peak) may be performed. The preprocessing includes, for example, a process of removing noise in the blood vessel center of gravity fluctuation amount by filtering as preliminary noise removal. In addition, post-processing includes, for example, (1) processing to remove noise (for example, local maximum values with small values) so that the detected local maximum value (peak) is above a certain level, (2) processing to remove noise between adjacent local maximum values, etc. This includes processing to remove noise (for example, local maximum values with small values) so that the values are equal to or larger than a certain interval. This allows unnecessary noise to be removed.
図8は所要フレームの特定方法の一例を示す図である。図中、符号▼は、血管重心変動量のピークが検出された箇所を示し、対応するフレームが所要フレームとなる。図8に示すように、側枝の有無にかかわらず、所要フレームが特定される。所要フレームは、血管重心変動量が所定の閾値以上となるフレームであり、特定心拍周期に対応するフレームとなる。
FIG. 8 is a diagram showing an example of a method for specifying a required frame. In the figure, the symbol ▼ indicates the location where the peak of the blood vessel center of gravity fluctuation amount is detected, and the corresponding frame is the required frame. As shown in FIG. 8, the required frame is identified regardless of the presence or absence of side branches. The required frame is a frame in which the amount of variation in the blood vessel center of gravity is equal to or greater than a predetermined threshold, and is a frame corresponding to a specific heartbeat cycle.
上述のように、情報処理装置50によれば、心電図情報などが得られない場合であっても、血管の複数のフレームの断面画像を示す医用画像データを取得するだけで、特定周期のフレーム(所要フレーム)を抽出できる。
As described above, according to the information processing device 50, even if electrocardiogram information etc. cannot be obtained, it is possible to simply obtain medical image data showing cross-sectional images of multiple frames of a blood vessel, and to obtain frames ( (required frame) can be extracted.
図9は所要フレームの抽出結果の一例を示す図である。図9Aは、医用画像データ(G1,G2,G3,…,Gn)のフレーム1~nそれぞれに対応するセグメンテーションデータ(S1,S2,S3,…,Sn)の血管境界を配置したものである。図9Aでは、全てのフレームでの血管境界が表示されているが、拍動の影響により血管境界がフレーム間で変動しているため全体として血管境界が分かりにくい。
FIG. 9 is a diagram showing an example of the extraction result of required frames. FIG. 9A shows the arrangement of blood vessel boundaries of segmentation data (S1, S2, S3, . . . , Sn) corresponding to frames 1 to n of medical image data (G1, G2, G3, . . . , Gn). In FIG. 9A, blood vessel boundaries are displayed in all frames, but the blood vessel boundaries vary between frames due to the influence of pulsation, making it difficult to understand the blood vessel boundaries as a whole.
図9Bは、全フレームから所要フレームだけを抽出し、抽出した所要フレームの血管境界を配置したものである。所要のフレームを1~n′とすると、フレーム数n′<フレーム数nとなる。なお、ここで、元のフレーム1と所要フレーム1とが必ずしも一致するわけではない。同様に、元のフレーム2と所要フレーム2とが必ずしも一致するわけではない。以降のフレームについても同様である。フレーム1~n′は、所要フレームのインデックスを示すものであり、元のフレームのインデクッスを表すものではない。図9Bでは、特定心拍周期に対応するフレームでの血管境界が表示されるので、各フレームでの血管境界が分かりやすい。
In FIG. 9B, only the required frames are extracted from all the frames, and the blood vessel boundaries of the extracted required frames are arranged. If the required frames are 1 to n', then the number of frames n'<the number of frames n. Note that here, the original frame 1 and the required frame 1 do not necessarily match. Similarly, the original frame 2 and the required frame 2 do not necessarily match. The same applies to subsequent frames. Frames 1 to n' indicate the index of the required frame, and do not indicate the index of the original frame. In FIG. 9B, blood vessel boundaries in frames corresponding to a specific heartbeat cycle are displayed, making it easy to understand blood vessel boundaries in each frame.
次に、血管の3D画像の生成方法について説明する。
Next, a method for generating a 3D image of a blood vessel will be explained.
図10は側枝が存在しない場合の所定部位の対応点群の特定方法の一例を示す図である。以下では、所定部位として、内腔の境界について説明するが、所定部位には、血管の境界も含まれる。フレーム特定部55で特定した所要フレームを、1、2、3、…、n′とする。所要のフレームのセグメンテーションデータをF1,F2,F3,…,Fi,…,Fj,…,Fn′とする。フレーム数はn′であり、n′<全フレーム数nである。注目フレームをjとし、注目フレームjに対応する対応フレームをiとする。注目フレームjと対応フレームiとは、対応点群を特定するためのフレームである。なお、注目フレームjと対応フレームiとは、隣接するフレーム同士でなくてもよく、両者の間に他のフレームが存在してもよい。
FIG. 10 is a diagram illustrating an example of a method for identifying a group of corresponding points in a predetermined region when there are no side branches. In the following, the boundary of a lumen will be described as a predetermined region, but the predetermined region also includes a border of a blood vessel. The required frames specified by the frame specifying section 55 are assumed to be 1, 2, 3, . . . , n'. Segmentation data of required frames are assumed to be F1, F2, F3,..., Fi,..., Fj,..., Fn'. The number of frames is n', and n'<total number of frames n. Let j be the frame of interest, and i be the corresponding frame corresponding to the frame of interest j. The frame of interest j and the corresponding frame i are frames for specifying a group of corresponding points. Note that the frame of interest j and the corresponding frame i do not have to be adjacent frames, and other frames may exist between them.
フレームiのセグメンテーションデータFiが示す内腔境界上の離散点をP(i,m)で表し、フレームjのセグメンテーションデータFjが示す内腔境界上の離散点をP(j,m)で表す。mは1~mの数字であり、離散点の数を示す。離散点の特定方法は、例えば、(1)境界に沿って同じ角度で順次特定する方法、(2)離散点同士の距離が一定になるように特定する方法、(3)離散点の数が一定になるように特定する方法などを用いることができる。これにより、境界の形状に関わらず、過度なねじれ等を抑制してバランスよく離散点を取得できる。また、血管境界上の離散点数は、内腔境界上の離散点数以下としてもよい。これにより、血管境界上の離散点数を少なくして内腔のメッシュの視認性を向上させることができる。
The discrete points on the lumen boundary indicated by the segmentation data Fi of frame i are represented by P(i, m), and the discrete points on the lumen boundary indicated by the segmentation data Fj of frame j are represented by P(j, m). m is a number from 1 to m and indicates the number of discrete points. Examples of methods for identifying discrete points include (1) sequentially identifying them at the same angle along the boundary, (2) identifying the discrete points so that the distance between them is constant, and (3) identifying the discrete points so that the distance between them is constant. It is possible to use a method of specifying the value so that it is constant. Thereby, regardless of the shape of the boundary, it is possible to suppress excessive twisting and the like and obtain well-balanced discrete points. Furthermore, the number of discrete points on the blood vessel boundary may be less than or equal to the number of discrete points on the lumen boundary. This makes it possible to reduce the number of discrete points on the blood vessel boundary and improve the visibility of the lumen mesh.
フレームjのセグメンテーションデータFjの離散点P(j,1)とフレームiのセグメンテーションデータFiのm個の各離散点P(i,m)(m=1~m)との間の距離を算出し、最も距離が短い離散点P(i,m)を、対応点として特定する。図10の例では、離散点P(j,1)と、離散点P(i,1)及びP(i,2)それぞれとの距離d1、d2を算出し、算出した距離d1、d2を比較すると、距離d2の方が距離d1よりも短いので、離散点P(i,2)が選択される。他の離散点についても同様の比較がなされる。
Calculate the distance between the discrete point P (j, 1) of the segmentation data Fj of frame j and each of the m discrete points P (i, m) (m = 1 to m) of the segmentation data Fi of frame i. , the discrete point P(i,m) with the shortest distance is identified as the corresponding point. In the example of FIG. 10, the distances d1 and d2 between the discrete point P (j, 1) and the discrete points P (i, 1) and P (i, 2) are calculated, and the calculated distances d1 and d2 are compared. Then, since the distance d2 is shorter than the distance d1, the discrete point P(i,2) is selected. Similar comparisons are made for other discrete points.
同様の処理を、フレームjのセグメンテーションデータFjの各離散点P(j,m)について行うことにより、フレームiとフレームjとで内腔境界の対応点群を特定することができる。
By performing similar processing for each discrete point P(j, m) of the segmentation data Fj of frame j, it is possible to specify a group of corresponding points at the lumen boundary between frame i and frame j.
図11は対応点群の連結方法の一例を示す図である。フレームiのセグメンテーションデータFiが示す内腔境界上の離散点群と、フレームjのセグメンテーションデータFjが示す内腔境界上の離散点群とが対応付けられたとする。相互に対応付けられた離散点同士を対応点と称し、境界上の対応点を纏めて対応点群と称する。フレームiのセグメンテーションデータFiと、フレームjのセグメンテーションデータFjとを適長離隔してZ軸方向に沿って配置する。Z軸は血管の長軸方向を示す。フレームi,jの各対応点(対応点群)をZ軸方向に直線で連結する。また、境界上で隣接する対応点同士を境界に沿って直線で連結する。これにより、フレームi,jの各セグメンテーションデータが示す内腔境界同士をメッシュ状に繋いだ3D画像を生成することができる。血管境界についても同様に、メッシュ状の3D画像を生成することができる。同様の処理を、すべてのフレーム1~nについて行うことにより、血管のメッシュ状の3D画像を生成することができる。
FIG. 11 is a diagram showing an example of a method for connecting a group of corresponding points. It is assumed that a group of discrete points on the lumen boundary indicated by segmentation data Fi of frame i is associated with a group of discrete points on the lumen boundary indicated by segmentation data Fj of frame j. Discrete points that are associated with each other are referred to as corresponding points, and corresponding points on the boundary are collectively referred to as a group of corresponding points. Segmentation data Fi for frame i and segmentation data Fj for frame j are arranged along the Z-axis direction with an appropriate distance between them. The Z axis indicates the longitudinal direction of the blood vessel. Each corresponding point (corresponding point group) of frames i and j is connected with a straight line in the Z-axis direction. Also, adjacent corresponding points on the boundary are connected with a straight line along the boundary. Thereby, it is possible to generate a 3D image in which the lumen boundaries indicated by the segmentation data of frames i and j are connected in a mesh shape. Similarly, a mesh-like 3D image can be generated for blood vessel boundaries. By performing similar processing on all frames 1 to n, a mesh-like 3D image of the blood vessel can be generated.
図12は側枝が存在する場合の所定部位の対応点群の特定方法の第1例を示す図である。側枝の有無は、学習モデル59が出力するセグメンテーションデータに基づいて判定できる。なお、側枝の有無は、血管断面形状の偏心度によって判定してもよい。例えば、内腔境界に基づいて内腔径の最大径d1と最小径d2を算出して偏心度を求めることができる。偏心度は、偏心度=(最大径d1-最小径d2)/最大径d1 という式で算出できる。偏心度が所定の閾値以上であるか否かに応じて、側枝の有無を判定できる。偏心度に代替して、円形度を算出してもよい。円形度とは血管境界の内側領域の面積と血管境界の周の長さとの比である。円形度が、円における面積と円周の長さとの比と近いほど、円形度が高く、側枝が写っている可能性は低いと判断できる。また、側枝の有無の他の判定例として、対象の血管境界の径(最大径、及び最小径)と、走査済みの断層画像に対する血管境界の径とを比較した値をパラメータとして算出し、径が所定の割合以上、所定の長さ以上急変したか否かに応じて、側枝の有無を判定できる。さらに別の判定例として、内腔境界及び血管境界のデータを入力した場合に、側枝が写っている可能性に対応する確度を出力するように学習された判断用の学習モデルを使用して判定してもよい。
FIG. 12 is a diagram showing a first example of a method for identifying a group of corresponding points in a predetermined region when a side branch exists. The presence or absence of side branches can be determined based on segmentation data output by the learning model 59. Note that the presence or absence of a side branch may be determined based on the eccentricity of the cross-sectional shape of the blood vessel. For example, the eccentricity can be determined by calculating the maximum diameter d1 and minimum diameter d2 of the lumen diameter based on the lumen boundary. The eccentricity can be calculated using the formula: eccentricity = (maximum diameter d1 - minimum diameter d2)/maximum diameter d1. The presence or absence of a side branch can be determined depending on whether the degree of eccentricity is greater than or equal to a predetermined threshold. Circularity may be calculated instead of eccentricity. Circularity is the ratio of the area of the inner region of the blood vessel boundary to the circumference of the blood vessel boundary. The closer the degree of circularity is to the ratio of the area of the circle to the length of the circumference, the higher the degree of circularity, and it can be determined that the possibility of a side branch being captured is low. In addition, as another example of determining the presence or absence of side branches, the diameter of the target blood vessel border (maximum diameter and minimum diameter) is calculated as a parameter by comparing the diameter of the blood vessel border in the scanned tomographic image, and the diameter The presence or absence of a side branch can be determined depending on whether or not there is a sudden change of a predetermined rate or more and a predetermined length or more. As another example of judgment, a learning model for judgment that is trained to output an accuracy corresponding to the possibility that a side branch is captured is used to make a judgment when data on lumen boundaries and blood vessel boundaries are input. You may.
図12に示すように、セグメンテーションデータF1,…,F(i-1),Fiでは側枝なし、セグメンテーションデータFj,F(j+1)では側枝ありとする。この場合、対応するフレームとして、側枝なしのフレームと、側枝ありのフレームとを対応付けることができる。図12の例では、フレームiのセグメンテーションデータFiと、フレームjのセグメンテーションデータFjとを対応付ける。セグメンテーションFiの内腔境界の離散点群と、セグメンテーションFjの本幹の内腔境界の離散点群同士を対応付けて対応点群として特定し、図10に例示した処理と同様の処理を行う。一方、セグメンテーションFjの側枝の内腔境界の離散点群は、そのままとし、連結処理は行わない。
As shown in FIG. 12, the segmentation data F1,..., F(i-1), Fi have no side branches, and the segmentation data Fj, F(j+1) have side branches. In this case, a frame without a side branch and a frame with a side branch can be associated as corresponding frames. In the example of FIG. 12, segmentation data Fi of frame i and segmentation data Fj of frame j are associated. The discrete point group of the lumen boundary of the segmentation Fi and the discrete point group of the main lumen boundary of the segmentation Fj are associated with each other and identified as a corresponding point group, and the same processing as that illustrated in FIG. 10 is performed. On the other hand, the discrete point group of the lumen boundary of the side branch of segmentation Fj is left as is and no connection processing is performed.
図13は側枝が存在する場合の所定部位の対応点群の特定方法の第2例を示す図である。図13に示すように、離散点P(j,1)と、離散点P(i,1)及びP(i,2)それぞれとの距離d1、d2を算出する。算出した距離d1、d2が、所定の閾値以上であるか否かに応じて、対応付けを行うか否かを決定する。例えば、距離d1は閾値より短いので、対応付けを行う。一方、距離d2は閾値より長いので対応付けをしない。このように、対応点を特定する際に、離散点同士の距離が閾値以上の場合には、連結しない。他の離散点についても同様の比較がなされる。
FIG. 13 is a diagram showing a second example of a method for identifying a group of corresponding points in a predetermined region when a side branch exists. As shown in FIG. 13, distances d1 and d2 between the discrete point P(j, 1) and the discrete points P(i, 1) and P(i, 2) are calculated. Depending on whether the calculated distances d1 and d2 are greater than or equal to a predetermined threshold, it is determined whether or not to perform the association. For example, since the distance d1 is shorter than the threshold, the correspondence is made. On the other hand, since the distance d2 is longer than the threshold value, no correspondence is made. In this way, when identifying corresponding points, if the distance between discrete points is equal to or greater than the threshold, they are not connected. Similar comparisons are made for other discrete points.
上述のように、制御部51は、フレーム特定部55で特定した所要フレームのうちの異なる2つのフレームで血管の所定部位の対応点群を特定し、特定した対応点群に基づいて血管の3D画像を生成することができる。
As described above, the control unit 51 specifies a group of corresponding points at a predetermined portion of the blood vessel in two different frames among the required frames specified by the frame specifying unit 55, and calculates the 3D image of the blood vessel based on the specified group of corresponding points. Images can be generated.
図14A及び図14Bは血管の模擬3D画像の一例を示す図である。図14A及び図14Bに例示する血管の3D画像は、実際に処理すると、どのような3D画像になるかを想定した(模擬した)画像である。図14Aは比較例による3D画像を模擬した場合を示す。比較例では、所要のフレームを特定することなく全フレームのセグメンテーションデータを用いて生成された血管の3D画像を示す。比較例では、拍動によるノイズの影響で、メッシュ状の3D画像に多くのぶれが生じている。
FIGS. 14A and 14B are diagrams showing examples of simulated 3D images of blood vessels. The 3D images of blood vessels illustrated in FIGS. 14A and 14B are images that simulate (simulate) what kind of 3D images will become when actually processed. FIG. 14A shows a simulated 3D image according to a comparative example. A comparative example shows a 3D image of a blood vessel generated using segmentation data of all frames without specifying the required frames. In the comparative example, a lot of blurring occurs in the mesh-like 3D image due to noise caused by pulsation.
図14Bは本実施形態による3D画像を模擬した場合を示す。本実施形態では、所要のフレームだけを用いたセグメンテーションデータを用いているので、拍動によるノイズが除去される。これにより、メッシュ状の3D画像には、ほとんどぶれが表れず、鮮明な3D画像を得ることができる。
FIG. 14B shows a case where a 3D image according to this embodiment is simulated. In this embodiment, since segmentation data using only required frames is used, noise due to pulsation is removed. As a result, the mesh-like 3D image has almost no blurring, and a clear 3D image can be obtained.
図15A及び図15Bは所要フレームに基づく血管情報の一例を示す図である。図15Aにおいて、横軸は血管の長軸の位置を示し、縦軸はプラーク面積率(プラークバーデン)を示す。図15Aに示すプラーク面積率は、所要のフレームだけを用いたセグメンテーションデータを用いているので、拍動によるノイズが除去され、精度よく算出することができる。すなわち、制御部51は、特定した所要フレームそれぞれの血管の所定部位の領域情報に基づいて、血管の軸方向におけるプラークの分布情報(プラークバーデン)を生成することができる。図15Aに示すような血管情報が得られることにより、例えば、ステントを血管内のどの位置に置けばよいか、ステントの長さをどの程度にすればよいか等を判断することができる。
FIGS. 15A and 15B are diagrams showing examples of blood vessel information based on required frames. In FIG. 15A, the horizontal axis shows the position of the long axis of the blood vessel, and the vertical axis shows the plaque area ratio (plaque burden). Since the plaque area ratio shown in FIG. 15A uses segmentation data using only the required frames, noise due to pulsation is removed and it can be calculated with high accuracy. That is, the control unit 51 can generate plaque distribution information (plaque burden) in the axial direction of the blood vessel based on the area information of a predetermined portion of the blood vessel in each of the specified required frames. By obtaining blood vessel information as shown in FIG. 15A, it is possible to determine, for example, where in the blood vessel the stent should be placed, how long the stent should be, etc.
図15Bにおいて、横軸は血管の長軸の位置を示し、縦軸は平均内腔径を示す。図15Bに示す平均内腔径は、所要のフレームだけを用いたセグメンテーションデータを用いているので、拍動によるノイズが除去され、精度よく算出することができる。すなわち、制御部51は、特定した所要フレームそれぞれの血管の所定部位の領域情報に基づいて、血管の軸方向における平均内腔径を算出することができる。図15Bに示すような血管情報が得られることにより、例えば、ステント径を判断することができる。
In FIG. 15B, the horizontal axis indicates the position of the long axis of the blood vessel, and the vertical axis indicates the average lumen diameter. Since the average lumen diameter shown in FIG. 15B uses segmentation data using only the required frames, noise due to pulsation is removed and can be calculated with high accuracy. That is, the control unit 51 can calculate the average lumen diameter in the axial direction of the blood vessel based on the region information of the predetermined portion of the blood vessel in each of the specified required frames. By obtaining blood vessel information as shown in FIG. 15B, for example, the stent diameter can be determined.
図16は情報処理装置50による処理手順の一例を示す図である。以下では便宜上、処理の主体を制御部51として説明する。制御部51は、医用画像データを取得し(S11)、取得した医用画像データを学習モデル59に入力して、フレーム毎の血管の所定部位(例えば、血管境界、及び内腔境界)の領域情報を取得する(S12)。
FIG. 16 is a diagram showing an example of a processing procedure by the information processing device 50. For convenience, the main body of processing will be described as the control unit 51 below. The control unit 51 acquires medical image data (S11), inputs the acquired medical image data to the learning model 59, and obtains region information of a predetermined portion of the blood vessel (for example, blood vessel boundary and lumen boundary) for each frame. (S12).
制御部51は、取得した所定部位の領域情報に基づいてフレーム毎の特徴量(例えば、血管重心)を算出し(S13)、フレーム間の特徴量の差分に基づいてフレーム毎の特徴量の変動量を算出する(S14)。
The control unit 51 calculates the feature amount for each frame (for example, blood vessel centroid) based on the obtained region information of the predetermined region (S13), and calculates the change in the feature amount for each frame based on the difference in the feature amount between frames. The amount is calculated (S14).
制御部51は、フレーム毎に算出した変動量の極大値(ピーク)を検出して所要フレームを特定する(S15)。所要フレームの特定は、例えば、図8を参照。制御部51は、特定した所要フレームのうちの異なる2つの所要フレームで所定部位の対応点群を特定し(S16)、特定した対応点群を用いて、血管のメッシュ状の3D画像を生成する(S17)。
The control unit 51 detects the maximum value (peak) of the amount of variation calculated for each frame and identifies the required frame (S15). For specifying the required frame, see FIG. 8, for example. The control unit 51 identifies a group of corresponding points of a predetermined region in two different required frames among the specified required frames (S16), and generates a mesh-like 3D image of a blood vessel using the identified corresponding point group. (S17).
制御部51は、特定した所要フレームにおける所定部位の領域情報に基づいて、血管の長軸方向のプラーク面積率、平均内腔径を算出し(S18)、処理を終了する。なお、ステップS18の処理は、ステップS15の処理から分岐して、ステップS16~S17の処理と並列で行うことができる。
The control unit 51 calculates the plaque area ratio and average lumen diameter in the long axis direction of the blood vessel based on the area information of the predetermined region in the specified required frame (S18), and ends the process. Note that the process of step S18 can be branched from the process of step S15 and can be performed in parallel with the processes of steps S16 to S17.
本実施形態のコンピュータプログラムは、コンピュータに、管腔器官の複数のフレームの断面画像を示す医用画像データを取得し、取得した医用画像データに基づいて、フレーム毎の管腔器官の特徴量を算出し、フレーム間の前記特徴量の変動量の極大値を検出し、検出した極大値に基づいて複数の所要フレームを前記複数のフレームの中から特定する、処理を実行させる。
The computer program of the present embodiment causes a computer to acquire medical image data showing cross-sectional images of multiple frames of a hollow organ, and calculates feature amounts of the hollow organ for each frame based on the acquired medical image data. Then, a process is executed to detect a local maximum value of the variation amount of the feature amount between frames, and to specify a plurality of required frames from among the plurality of frames based on the detected local maximum value.
本実施形態のコンピュータプログラムは、コンピュータに、管腔器官の複数のフレームの断面画像を示す医用画像データを入力した場合に、前記管腔器官の所定部位の領域情報を出力する学習モデルに、取得した前記医用画像データを入力してフレーム毎の前記管腔器官の所定部位の領域情報を取得し、取得した領域情報に基づいてフレーム毎の管腔器官の特徴量を算出する、処理を実行させる。
The computer program of the present embodiment is configured to acquire, when medical image data indicating cross-sectional images of a plurality of frames of a hollow organ is input to a computer, a learning model that outputs area information of a predetermined region of the hollow organ. inputting the medical image data obtained, acquiring area information of a predetermined part of the hollow organ for each frame, and calculating feature amounts of the hollow organ for each frame based on the obtained area information. .
本実施形態のコンピュータプログラムにおいて、前記特徴量は、前記管腔器官の重心位置、又は平均内腔径を含む。
In the computer program of this embodiment, the feature amount includes the center of gravity position or the average lumen diameter of the hollow organ.
本実施形態のコンピュータプログラムは、コンピュータに、特定した所要フレームそれぞれの前記管腔器官の所定部位の領域情報に基づいて、前記管腔器官の軸方向におけるプラークの分布情報を生成する、処理を実行させる。
The computer program of this embodiment causes a computer to execute a process of generating plaque distribution information in the axial direction of the hollow organ based on area information of a predetermined region of the hollow organ in each of the specified required frames. let
本実施形態のコンピュータプログラムは、コンピュータに、特定した所要フレームそれぞれの前記管腔器官の所定部位の領域情報に基づいて、前記管腔器官の軸方向における平均内腔径を算出する、処理を実行させる。
The computer program of this embodiment causes a computer to execute a process of calculating the average lumen diameter in the axial direction of the hollow organ based on area information of a predetermined region of the hollow organ in each of the specified required frames. let
本実施形態のコンピュータプログラムは、コンピュータに、特定した所要フレームのうちの異なる2つのフレームで前記管腔器官の所定部位の対応点群を特定し、特定した対応点群に基づいて前記管腔器官の3D画像を生成する、処理を実行させる。
The computer program of this embodiment causes a computer to specify a group of corresponding points at a predetermined part of the hollow organ in two different frames among the specified required frames, and to determine whether the hollow organ is connected based on the specified group of corresponding points. Execute processing to generate a 3D image.
本実施形態の情報処理装置は、管腔器官の複数のフレームの断面画像を示す医用画像データを取得する取得部と、取得した医用画像データに基づいて、フレーム毎の管腔器官の特徴量を算出する算出部と、フレーム間の前記特徴量の変動量の極大値を検出する検出部と、検出した極大値に基づいて複数の所要フレームを前記複数のフレームの中から特定する特定部とを備える。
The information processing device of this embodiment includes an acquisition unit that acquires medical image data showing cross-sectional images of a plurality of frames of a hollow organ, and a feature amount of the hollow organ for each frame based on the acquired medical image data. a calculation unit that calculates, a detection unit that detects a maximum value of the variation amount of the feature amount between frames, and a specification unit that identifies a plurality of required frames from among the plurality of frames based on the detected maximum value. Be prepared.
本実施形態の情報処理方法は、管腔器官の複数のフレームの断面画像を示す医用画像データを取得し、取得した医用画像データに基づいて、フレーム毎の管腔器官の特徴量を算出し、フレーム間の前記特徴量の変動量の極大値を検出し、検出した極大値に基づいて複数の所要フレームを前記複数のフレームの中から特定する。
The information processing method of the present embodiment acquires medical image data showing cross-sectional images of a plurality of frames of a hollow organ, calculates the feature amount of the hollow organ for each frame based on the obtained medical image data, A local maximum value of the variation amount of the feature quantity between frames is detected, and a plurality of required frames are specified from among the plurality of frames based on the detected maximum value.
1 通信ネットワーク
10 カテーテル
20 MDU
30 表示装置
40 入力装置
50 情報処理装置
51 制御部
52 通信部
53 インタフェース部
54 特徴量算出部
55 フレーム特定部
56 メモリ
57 記憶部
58 コンピュータプログラム
59 学習モデル
59a 入力層
59b 中間層
59c 出力層
60 記録媒体読取部
61 記録媒体
200 サーバ 1Communication network 10 Catheter 20 MDU
30Display device 40 Input device 50 Information processing device 51 Control unit 52 Communication unit 53 Interface unit 54 Feature calculation unit 55 Frame identification unit 56 Memory 57 Storage unit 58 Computer program 59 Learning model 59a Input layer 59b Intermediate layer 59c Output layer 60 Recording Media reading unit 61 Recording medium 200 Server
10 カテーテル
20 MDU
30 表示装置
40 入力装置
50 情報処理装置
51 制御部
52 通信部
53 インタフェース部
54 特徴量算出部
55 フレーム特定部
56 メモリ
57 記憶部
58 コンピュータプログラム
59 学習モデル
59a 入力層
59b 中間層
59c 出力層
60 記録媒体読取部
61 記録媒体
200 サーバ 1
30
Claims (8)
- コンピュータに、
管腔器官の複数のフレームの断面画像を示す医用画像データを取得し、
取得した医用画像データに基づいて、フレーム毎の管腔器官の特徴量を算出し、
フレーム間の前記特徴量の変動量の極大値を検出し、
検出した極大値に基づいて複数の所要フレームを前記複数のフレームの中から特定する、
処理を実行させるコンピュータプログラム。 to the computer,
obtaining medical image data showing cross-sectional images of multiple frames of a hollow organ;
Based on the acquired medical image data, the feature values of the hollow organs are calculated for each frame,
Detecting the maximum value of the variation amount of the feature amount between frames,
identifying a plurality of required frames from among the plurality of frames based on the detected local maximum value;
A computer program that performs a process. - コンピュータに、
管腔器官の複数のフレームの断面画像を示す医用画像データを入力した場合に、前記管腔器官の所定部位の領域情報を出力する学習モデルに、取得した前記医用画像データを入力してフレーム毎の前記管腔器官の所定部位の領域情報を取得し、
取得した領域情報に基づいてフレーム毎の管腔器官の特徴量を算出する、
処理を実行させる請求項1に記載のコンピュータプログラム。 to the computer,
When medical image data showing cross-sectional images of multiple frames of a hollow organ is input, the acquired medical image data is input to a learning model that outputs area information of a predetermined part of the hollow organ, and the acquired medical image data is input for each frame. obtaining area information of a predetermined part of the hollow organ;
Calculate the feature amount of the hollow organ for each frame based on the acquired region information,
The computer program according to claim 1, which causes the computer program to execute a process. - 前記特徴量は、
前記管腔器官の重心位置、又は平均内腔径を含む、
請求項1又は請求項2に記載のコンピュータプログラム。 The feature amount is
including the center of gravity position or average lumen diameter of the hollow organ;
The computer program according to claim 1 or claim 2. - コンピュータに、
特定した所要フレームそれぞれの前記管腔器官の所定部位の領域情報に基づいて、前記管腔器官の軸方向におけるプラークの分布情報を生成する、
処理を実行させる請求項1から請求項3のいずれか一項に記載のコンピュータプログラム。 to the computer,
generating plaque distribution information in the axial direction of the hollow organ based on area information of a predetermined region of the hollow organ in each of the identified required frames;
The computer program according to any one of claims 1 to 3, which causes the computer program to execute a process. - コンピュータに、
特定した所要フレームそれぞれの前記管腔器官の所定部位の領域情報に基づいて、前記管腔器官の軸方向における平均内腔径を算出する、
処理を実行させる請求項1から請求項4のいずれか一項に記載のコンピュータプログラム。 to the computer,
calculating an average lumen diameter in the axial direction of the hollow organ based on area information of a predetermined region of the hollow organ in each of the identified required frames;
The computer program according to any one of claims 1 to 4, which causes the computer program to execute a process. - コンピュータに、
特定した所要フレームのうちの異なる2つのフレームで前記管腔器官の所定部位の対応点群を特定し、
特定した対応点群に基づいて前記管腔器官の3D画像を生成する、
処理を実行させる請求項1から請求項5のいずれか一項に記載のコンピュータプログラム。 to the computer,
identifying a group of corresponding points at a predetermined portion of the hollow organ in two different frames among the identified required frames;
generating a 3D image of the hollow organ based on the identified corresponding point group;
The computer program according to any one of claims 1 to 5, which causes the computer program to execute a process. - 管腔器官の複数のフレームの断面画像を示す医用画像データを取得する取得部と、
取得した医用画像データに基づいて、フレーム毎の管腔器官の特徴量を算出する算出部と、
フレーム間の前記特徴量の変動量の極大値を検出する検出部と、
検出した極大値に基づいて複数の所要フレームを前記複数のフレームの中から特定する特定部と
を備える、
情報処理装置。 an acquisition unit that acquires medical image data showing cross-sectional images of a plurality of frames of a hollow organ;
a calculation unit that calculates the feature amount of the hollow organ for each frame based on the acquired medical image data;
a detection unit that detects a maximum value of the variation amount of the feature amount between frames;
and a specifying unit that specifies a plurality of required frames from the plurality of frames based on the detected maximum value.
Information processing device. - 管腔器官の複数のフレームの断面画像を示す医用画像データを取得し、
取得した医用画像データに基づいて、フレーム毎の管腔器官の特徴量を算出し、
フレーム間の前記特徴量の変動量の極大値を検出し、
検出した極大値に基づいて複数の所要フレームを前記複数のフレームの中から特定する、
情報処理方法。 obtaining medical image data showing cross-sectional images of multiple frames of a hollow organ;
Based on the acquired medical image data, the feature values of the hollow organs are calculated for each frame,
Detecting the maximum value of the variation amount of the feature amount between frames,
identifying a plurality of required frames from among the plurality of frames based on the detected local maximum value;
Information processing method.
Applications Claiming Priority (2)
| Application Number | Priority Date | Filing Date | Title |
|---|---|---|---|
| JP2022-054470 | 2022-03-29 | ||
| JP2022054470 | 2022-03-29 |
Publications (1)
| Publication Number | Publication Date |
|---|---|
| WO2023189261A1 true WO2023189261A1 (en) | 2023-10-05 |
Family
ID=88201401
Family Applications (1)
| Application Number | Title | Priority Date | Filing Date |
|---|---|---|---|
| PCT/JP2023/008440 WO2023189261A1 (en) | 2022-03-29 | 2023-03-07 | Computer program, information processing device, and information processing method |
Country Status (1)
| Country | Link |
|---|---|
| WO (1) | WO2023189261A1 (en) |
Citations (4)
| Publication number | Priority date | Publication date | Assignee | Title |
|---|---|---|---|---|
| JPH0759777A (en) * | 1993-08-30 | 1995-03-07 | Aloka Co Ltd | Ultrasonic diagnostic system for lumen |
| JP2016530043A (en) * | 2013-09-11 | 2016-09-29 | ボストン サイエンティフィック サイムド,インコーポレイテッドBoston Scientific Scimed,Inc. | System for selecting and displaying images using an intravascular ultrasound imaging system |
| US20200294659A1 (en) * | 2019-03-17 | 2020-09-17 | Lightlab Imaging, Inc. | Arterial Imaging and Assessment Systems and Methods and Related User Interface Based-Workflows |
| JP2021517034A (en) * | 2018-03-15 | 2021-07-15 | コーニンクレッカ フィリップス エヌ ヴェKoninklijke Philips N.V. | Determination and visualization of anatomical markers for intraluminal lesion assessment and treatment planning |
-
2023
- 2023-03-07 WO PCT/JP2023/008440 patent/WO2023189261A1/en unknown
Patent Citations (4)
| Publication number | Priority date | Publication date | Assignee | Title |
|---|---|---|---|---|
| JPH0759777A (en) * | 1993-08-30 | 1995-03-07 | Aloka Co Ltd | Ultrasonic diagnostic system for lumen |
| JP2016530043A (en) * | 2013-09-11 | 2016-09-29 | ボストン サイエンティフィック サイムド,インコーポレイテッドBoston Scientific Scimed,Inc. | System for selecting and displaying images using an intravascular ultrasound imaging system |
| JP2021517034A (en) * | 2018-03-15 | 2021-07-15 | コーニンクレッカ フィリップス エヌ ヴェKoninklijke Philips N.V. | Determination and visualization of anatomical markers for intraluminal lesion assessment and treatment planning |
| US20200294659A1 (en) * | 2019-03-17 | 2020-09-17 | Lightlab Imaging, Inc. | Arterial Imaging and Assessment Systems and Methods and Related User Interface Based-Workflows |
Similar Documents
| Publication | Publication Date | Title |
|---|---|---|
| JP7375102B2 (en) | How an intravascular imaging system operates | |
| JP5944917B2 (en) | Computer readable medium for detecting and displaying body lumen bifurcation and system including the same | |
| US7359554B2 (en) | System and method for identifying a vascular border | |
| CN111134651B (en) | Method, device and system for calculating fractional flow reserve based on intracavity images and computer storage medium | |
| US20180192983A1 (en) | Vascular Data Processing and Image Registration Systems, Methods, and Apparatuses | |
| EP2967480B1 (en) | Vascular data processing and image registration methods | |
| JP7023715B2 (en) | A programmable processor-based computer device of an intravascular imaging system for detecting how the system operates to determine stent strut coverage within a blood vessel and the area where the stent is placed. | |
| US20080051657A1 (en) | Systems And Methods For Estimating The Size And Position Of A Medical Device To Be Applied Within A Patient | |
| CN108348171B (en) | Method and system for intravascular imaging and detection of guide catheter | |
| Meier et al. | Automated morphometry of coronary arteries with digital image analysis of intravascular ultrasound | |
| EP1534137A2 (en) | System and method for identifying a vascular border | |
| JP2021104337A (en) | Estimating endoluminal path of endoluminal device along lumen | |
| CN103190932A (en) | Method for estimating stress and strain of coronary artery blood vessel wall | |
| WO2021199968A1 (en) | Computer program, information processing method, information processing device, and method for generating model | |
| US20240013385A1 (en) | Medical system, method for processing medical image, and medical image processing apparatus | |
| JP2022055170A (en) | Computer program, image processing method and image processing device | |
| WO2023189261A1 (en) | Computer program, information processing device, and information processing method | |
| WO2022071265A1 (en) | Program, information processing device, and information processing method | |
| WO2023054442A1 (en) | Computer program, information processing device, and information processing method | |
| WO2023100838A1 (en) | Computer program, information processing device, information processing method, and training model generation method | |
| WO2023189260A1 (en) | Computer program, information processing device, and information processing method | |
| JP2023051176A (en) | Computer program, information processing device and information processing method | |
| WO2022209657A1 (en) | Computer program, information processing method, and information processing device | |
| WO2022202323A1 (en) | Program, information processing method, and information processing device | |
| JP2023049952A (en) | Computer program, information processing device, information processing method, and learning model generation method |
Legal Events
| Date | Code | Title | Description |
|---|---|---|---|
| 121 | Ep: the epo has been informed by wipo that ep was designated in this application |
Ref document number: 23779289 Country of ref document: EP Kind code of ref document: A1 |