WO2023189261A1 - Programme informatique, dispositif de traitement d'informations et procédé de traitement d'informations - Google Patents
Programme informatique, dispositif de traitement d'informations et procédé de traitement d'informations Download PDFInfo
- Publication number
- WO2023189261A1 WO2023189261A1 PCT/JP2023/008440 JP2023008440W WO2023189261A1 WO 2023189261 A1 WO2023189261 A1 WO 2023189261A1 JP 2023008440 W JP2023008440 W JP 2023008440W WO 2023189261 A1 WO2023189261 A1 WO 2023189261A1
- Authority
- WO
- WIPO (PCT)
- Prior art keywords
- frames
- hollow organ
- blood vessel
- computer program
- medical image
- Prior art date
Links
- 230000010365 information processing Effects 0.000 title claims abstract description 35
- 238000004590 computer program Methods 0.000 title claims abstract description 32
- 238000003672 processing method Methods 0.000 title claims abstract description 6
- 210000000056 organ Anatomy 0.000 claims abstract description 39
- 238000000034 method Methods 0.000 claims description 36
- 230000005484 gravity Effects 0.000 claims description 30
- 238000004364 calculation method Methods 0.000 claims description 11
- 238000001514 detection method Methods 0.000 claims description 2
- 238000012545 processing Methods 0.000 abstract description 29
- 230000002792 vascular Effects 0.000 abstract 2
- 210000004204 blood vessel Anatomy 0.000 description 116
- 230000011218 segmentation Effects 0.000 description 36
- 238000010586 diagram Methods 0.000 description 32
- 238000004891 communication Methods 0.000 description 14
- 238000002604 ultrasonography Methods 0.000 description 9
- 238000002608 intravascular ultrasound Methods 0.000 description 8
- 239000000523 sample Substances 0.000 description 7
- 230000006870 function Effects 0.000 description 6
- 230000010349 pulsation Effects 0.000 description 6
- 210000004351 coronary vessel Anatomy 0.000 description 4
- 238000003384 imaging method Methods 0.000 description 4
- 238000012014 optical coherence tomography Methods 0.000 description 4
- 244000208734 Pisonia aculeata Species 0.000 description 3
- 230000000052 comparative effect Effects 0.000 description 3
- 238000003745 diagnosis Methods 0.000 description 3
- 238000013146 percutaneous coronary intervention Methods 0.000 description 3
- 230000000747 cardiac effect Effects 0.000 description 2
- 230000003287 optical effect Effects 0.000 description 2
- 238000012805 post-processing Methods 0.000 description 2
- 238000007781 pre-processing Methods 0.000 description 2
- 239000004065 semiconductor Substances 0.000 description 2
- 238000003491 array Methods 0.000 description 1
- 238000002592 echocardiography Methods 0.000 description 1
- 238000005516 engineering process Methods 0.000 description 1
- 238000000605 extraction Methods 0.000 description 1
- 238000001914 filtration Methods 0.000 description 1
- 210000004013 groin Anatomy 0.000 description 1
- 238000007689 inspection Methods 0.000 description 1
- 238000005305 interferometry Methods 0.000 description 1
- 230000003902 lesion Effects 0.000 description 1
- 239000004973 liquid crystal related substance Substances 0.000 description 1
- 239000013307 optical fiber Substances 0.000 description 1
- 230000004044 response Effects 0.000 description 1
- 230000003068 static effect Effects 0.000 description 1
- 230000001360 synchronised effect Effects 0.000 description 1
- 210000000707 wrist Anatomy 0.000 description 1
Images


Classifications
-
- A—HUMAN NECESSITIES
- A61—MEDICAL OR VETERINARY SCIENCE; HYGIENE
- A61B—DIAGNOSIS; SURGERY; IDENTIFICATION
- A61B8/00—Diagnosis using ultrasonic, sonic or infrasonic waves
- A61B8/12—Diagnosis using ultrasonic, sonic or infrasonic waves in body cavities or body tracts, e.g. by using catheters
Definitions
- the present invention relates to a computer program, an information processing device, and an information processing method.
- Patent Document 1 discloses that a catheter is inserted into a blood vessel, and a blood vessel cross-sectional image is generated based on signals (ultrasound waves emitted toward the blood vessel tissue and reflected waves) obtained by an imaging core housed in the catheter. An image diagnostic apparatus is disclosed.
- the present invention has been made in view of the above circumstances, and it is an object of the present invention to provide a computer program, an information processing device, and an information processing method that can extract frames of a specific period from only medical images.
- a computer program causes a computer to acquire medical image data showing cross-sectional images of a plurality of frames of a hollow organ. Based on medical image data, the feature amount of the hollow organ is calculated for each frame, the maximum value of the variation amount of the feature amount between frames is detected, and a plurality of required frames are divided into the plurality of frames based on the detected maximum value. Specify from among the frames and execute the process.
- frames of a specific period can be extracted only from medical images.
- FIG. 1 is a diagram illustrating an example of the configuration of an information processing system according to the present embodiment.
- FIG. 1 is a diagram illustrating an example of the configuration of an information processing device.
- FIG. 3 is a diagram showing a first example of processing using a learning model.
- FIG. 7 is a diagram showing a second example of processing using a learning model. It is a figure showing an example of segmentation data outputted by a learning model.
- FIG. 3 is a diagram showing an example of feature amounts.
- FIG. 3 is a diagram showing an example of feature amounts.
- FIG. 3 is a diagram showing an example of variation in blood vessel center of gravity.
- FIG. 3 is a diagram illustrating an example of a method for identifying a required frame.
- FIG. 3 is a diagram illustrating an example of a method for identifying a required frame.
- FIG. 6 is a diagram illustrating an example of a result of extracting a required frame.
- FIG. 6 is a diagram illustrating an example of a method for identifying a group of corresponding points at a predetermined site when no side branch exists.
- FIG. 3 is a diagram illustrating an example of a method for connecting a group of corresponding points.
- FIG. 7 is a diagram illustrating a first example of a method for identifying a group of corresponding points in a predetermined region when a side branch exists.
- FIG. 7 is a diagram illustrating a second example of a method for identifying a group of corresponding points in a predetermined region when a side branch exists. It is a figure showing an example of a simulated 3D image of a blood vessel.
- FIG. 3 is a diagram illustrating an example of blood vessel information based on required frames.
- FIG. 3 is a diagram illustrating an example of blood vessel information based on required frames.
- FIG. 3 is a diagram illustrating an example of a processing procedure by an information processing device.
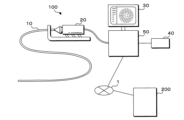
- FIG. 1 is a diagram showing an example of the configuration of an information processing system 100 according to the present embodiment.
- the information processing system 100 is, for example, an image diagnosis system, and is a device for performing intravascular imaging (image diagnosis) used in cardiac catheterization (PCI).
- Cardiac catheterization is a method of treating narrowed coronary arteries by inserting a catheter through a blood vessel in the groin, arm, or wrist.
- intravascular ultrasound IVUS
- OFDI optical frequency domain imaging
- OCT optical coherence tomography
- IVUS uses reflected ultrasound waves to interpret the inside of a blood vessel as a tomographic image.
- a thin catheter equipped with an ultra-small sensor at the tip is inserted into a coronary artery, passed to a lesion, and then a medical image of the inside of the blood vessel can be generated using ultrasound waves emitted from the sensor.
- OFDI uses near-infrared rays to interpret the condition inside blood vessels using high-resolution images.
- a catheter is inserted into a blood vessel, near-infrared rays are irradiated from the tip, and a cross section of the blood vessel is measured using interferometry to generate a medical image.
- OCT is an intravascular image diagnosis that applies near-infrared rays and optical fiber technology.
- a blood vessel will be described as an example of a hollow organ.
- medical images include those generated by IVUS, OFDI, or OCT, but below, the case where the IVUS method is mainly used will be described.
- the information processing system 100 includes a catheter 10, an MDU (Motor Drive Unit) 20, a display device 30, an input device 40, and an information processing device 50.
- a server 200 is connected to the information processing device 50 via the communication network 1.
- the catheter 10 is an image diagnostic catheter for obtaining ultrasonic tomographic images of blood vessels using the IVUS method.
- the catheter 10 has an ultrasonic probe at its tip for obtaining ultrasonic tomographic images of blood vessels.
- the ultrasonic probe includes an ultrasonic transducer that emits ultrasonic waves within a blood vessel, and an ultrasonic sensor that receives reflected waves (ultrasonic echoes) reflected from structures such as living tissue in the blood vessel or medical equipment.
- the ultrasound probe is configured to be able to move forward and backward in the longitudinal direction of the blood vessel while rotating in the circumferential direction of the blood vessel.
- the MDU 20 is a drive device to which the catheter 10 can be detachably attached, and controls the operation of the catheter 10 inserted into a blood vessel by driving a built-in motor in response to operations by a medical worker.
- the MDU 20 can be rotated in the circumferential direction while moving the ultrasound probe of the catheter 10 from the tip (distal) side to the base (proximal) side (pullback operation).
- the ultrasound probe continuously scans the inside of the blood vessel at predetermined time intervals and outputs reflected wave data of the detected ultrasound waves to the information processing device 50.
- the information processing device 50 acquires medical image data showing time-series (multiple frames) cross-sectional images of blood vessels based on the reflected wave data output from the ultrasound probe of the catheter 10.
- the ultrasound probe scans the inside of the blood vessel while moving from the tip (distal) side to the proximal end (proximal) side, so multiple medical images in chronological order are multiple images spanning from distal to proximal. This is a tomographic image of the blood vessels observed at the location.
- the display device 30 includes a liquid crystal display panel, an organic EL display panel, etc., and can display processing results by the information processing device 50. Furthermore, the display device 30 can display medical images generated (acquired) by the information processing device 50.
- the input device 40 is an input interface such as a keyboard or a mouse that accepts input of various setting values when performing an inspection, operation of the information processing device 50, and the like.
- the input device 40 may be a touch panel, soft keys, hard keys, etc. provided on the display device 30.
- the server 200 is, for example, a data server, and may include an image DB that stores medical image data.
- FIG. 2 is a diagram showing an example of the configuration of the information processing device 50.
- the information processing device 50 includes a control unit 51 that controls the entire information processing device 50, a communication unit 52, an interface unit 53, a feature amount calculation unit 54, a frame identification unit 55, a memory 56, a storage unit 57, and a recording medium reading unit 60. Equipped with The storage unit 57 stores a computer program 58 and a learning model 59.
- the feature amount calculation unit 54 and the frame identification unit 55 may be implemented by hardware, software (computer program 58), or both hardware and software. Good too.
- the information processing device 50 may be configured with functions distributed among a plurality of information processing devices.
- the control unit 51 incorporates a required number of CPU (Central Processing Unit), MPU (Micro-Processing Unit), GPU (Graphics Processing Unit), GPGPU (General-purpose computing on graphics processing units), TPU (Tensor Processing Unit), etc. It may be configured as follows. Further, the control unit 51 may be configured by combining DSPs (Digital Signal Processors), FPGAs (Field-Programmable Gate Arrays), quantum processors, and the like.
- DSPs Digital Signal Processors
- FPGAs Field-Programmable Gate Arrays
- quantum processors and the like.
- the control unit 51 can execute processing determined by the computer program 58. That is, the processing by the control unit 51 is also the processing by the computer program 58.
- the memory 56 can be composed of semiconductor memory such as SRAM (Static Random Access Memory), DRAM (Dynamic Random Access Memory), and flash memory.
- the computer program 58 can be loaded into the memory 56 and the control unit 51 can execute the computer program 58.
- the communication unit 52 includes, for example, a communication module and has a communication function with the server 200 via the communication network 1. Further, the communication unit 52 may have a communication function with an external device (not shown) connected to the communication network 1. The communication unit 52 may acquire medical image data showing cross-sectional images of multiple frames of a blood vessel from the server 200.
- the interface section 53 provides an interface function between the catheter 10, the display device 30, and the input device 40.
- the information processing device 50 (control unit 51) can transmit and receive data and information between the catheter 10, the display device 30, and the input device 40 through the interface unit 53.
- the interface unit 53 may acquire medical image data showing cross-sectional images of multiple frames of a blood vessel from the catheter 10.
- the recording medium reading section 60 can be configured with, for example, an optical disk drive, and reads the computer program 58 (program product) recorded on the recording medium 61 (for example, an optically readable disk storage medium such as a CD-ROM) into the recording medium. It can be read by the reading unit 60 and stored in the storage unit 57.
- the computer program 58 is loaded into the memory 56 and executed by the control unit 51. Note that the computer program 58 may be downloaded from an external device via the communication unit 52 and stored in the storage unit 57.
- the storage unit 57 can be configured with, for example, a hard disk or a semiconductor memory, and can store necessary information (for example, data being processed by the information processing device 50, processing results, etc.).
- the feature amount calculation unit 54 has a function as a calculation unit, and calculates the feature amount of blood vessels for each frame based on the medical image data acquired via the interface unit 53 or the communication unit 52. Details of the feature amounts will be described later.
- the frame specifying unit 55 has a function as a detecting unit and a specifying unit, and detects the maximum value (peak) of the variation amount of the feature amount between frames, and selects a plurality of required frames based on the detected maximum value. Identify from within the frame. Details of the method for identifying the required frame will be described later.
- FIG. 3 is a diagram showing a first example of processing by the learning model 59.
- the first example assumes a case where there are no side branches of the blood vessel.
- the learning model 59 includes an input layer 59a, a middle layer 59b, and an output layer 59c, and can be configured with U-Net, for example.
- the intermediate layer 59b includes multiple encoders and multiple decoders. Convolution processing is repeated using a plurality of encoders on the medical image data input to the input layer 59a. Multiple decoders repeatedly perform upsampling (deconvolution) processing on the image convolved by the encoder. When decoding a convolved image, the feature map generated by the encoder is added to the image to be deconvolved. This makes it possible to retain positional information that is lost due to convolution processing, and to output segmentation (which pixel belongs to which class) with higher accuracy.
- the learning model 59 can output segmentation data (region information of a predetermined region) when medical image data is input. Segmentation data is obtained by classifying each pixel of medical image data into classes.
- the learning model 59 can classify each pixel of input medical image data into three classes, eg, classes 1, 2, and 3. Class 1 indicates Background and indicates the area outside the blood vessel. Class 2 indicates (Plaque + Media) and indicates the area of the blood vessel containing plaque. Class 3 indicates Lumen and indicates the inner lumen of a blood vessel. Therefore, the boundary between pixels classified as class 2 and class 3 indicates the boundary of the lumen, and the boundary between pixels classified as class 1 and class 2 represents the boundary of the blood vessel. shows.
- the learning model 59 can output region information of a predetermined portion of a blood vessel (that is, information indicating a lumen boundary and a blood vessel boundary).
- the predetermined region includes a blood vessel border and a lumen border.
- the area information is coordinate data of pixels indicating the boundaries of the blood vessel and the boundaries of the lumen.
- the learning model 59 is not limited to U-Net, and may be, for example, GAN (Generative Adversarial Network), SegNet, or the like.
- the learning model 59 can be generated as follows. First, first training data including medical image data indicating a cross-sectional image of a blood vessel and segmentation data indicating the class of each pixel of the medical image data is acquired. For example, the first training data may be collected and stored in the server 200, and may be acquired from the server 200. Next, based on the first training data, the learning model 59 may be generated so as to output segmentation data when medical image data indicating a cross-sectional image of a blood vessel is input to the learning model 59.
- the learning model 59 is trained to output region information for each of the lumen boundary and the blood vessel boundary.
- a model 59 may be generated.
- FIG. 4 is a diagram showing a second example of processing by the learning model 59.
- the second example assumes that there is a side branch of the blood vessel.
- the learning model 59 when medical image data is input to the learning model 59, the learning model 59 outputs area information for each of the lumen boundary and the blood vessel boundary.
- the learning model 59 can output area information of the lumen boundaries and blood vessel boundaries of the main trunk of the blood vessel and the side branches connected to the main trunk. The rest is the same as in the first example, so the explanation will be omitted.
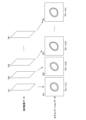
- FIG. 5 is a diagram showing an example of segmentation data output by the learning model 59.
- Medical image data (G1, G2, G3,..., Gn) consisting of cross-sectional images of multiple frames (frames 1 to n) from multiple time-series cross-sectional images of blood vessels obtained by one pullback operation. get.
- the acquired medical image data becomes input data to the learning model 59.
- the learning model 59 outputs segmentation data (S1, S2, S3, . . . , Sn) corresponding to each of frames 1 to n.
- Each segmentation data includes region information of blood vessel boundaries and lumen boundaries, as described in FIG. 3 or 4.
- control unit 51 When medical image data indicating cross-sectional images of multiple frames of a blood vessel is input, the control unit 51 inputs the acquired medical image data to a learning model 59 that outputs region information of a predetermined region of the blood vessel, and then inputs the acquired medical image data for each frame. obtain region information of a predetermined portion of the blood vessel.
- the control unit 51 (feature amount calculation unit 54) can calculate the feature amount of the blood vessel for each frame based on the acquired region information.
- the feature amount calculated by the feature amount calculation unit 54 may be any physical amount that can identify a specific heartbeat cycle that is synchronized with the heartbeat, such as the relative positional relationship between the catheter and the blood vessel that changes with the heartbeat. It is fine as long as it can express.
- the center of gravity of a blood vessel and the average lumen diameter will be described as examples of feature amounts, but the feature amounts are not limited to these. Note that the lumen changes depending on the plaque area ratio (plaque burden), so a blood vessel is preferable.
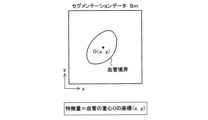
- FIGS. 6A and 6B are diagrams showing examples of feature amounts.
- the feature amount can be calculated using each of the segmentation data S1, S2, S3, . . . , Sn corresponding to frames 1 to n, respectively, illustrated in FIG.
- segmentation data Sm corresponding to frame m will be explained.
- m can be set to 1 to n.
- FIG. 6A shows a case where the coordinates (x, y) of the center of gravity O of the blood vessel are used as the feature amount.
- the center of gravity O of the blood vessel is the center of gravity position of the shape determined by the boundary of the blood vessel represented by the segmentation data.
- the center of gravity O(x,y) can be calculated as follows. In the two-dimensional xy coordinates, the coordinates of a plurality of mass points (all masses are 1) constituting the blood vessel are (x1, y1), (x2, y2), ..., (xn, yn). n is the number of mass points.
- the center of gravity O(x, y) may be calculated as, for example, the center position of a circle that approximates the blood vessel boundary.
- the center of gravity O(x, y) may be calculated, for example, by setting a plurality of vertices on the blood vessel boundary and finding the center of gravity of a polygon made up of each vertex.
- FIG. 6B shows a case where the average lumen diameter D of the blood vessel is used as the feature amount.
- the maximum diameter D1 and the minimum diameter D2 of the line segment passing through the center of gravity O of the blood vessel may be determined, and the average of the maximum diameter D1 and the minimum diameter D2 may be determined as the average lumen diameter D.
- the center of gravity position of the blood vessel is used as the feature amount, but the average lumen diameter D may also be used.
- the feature calculation unit 54 can calculate the center of gravity position O(x, y) of the blood vessel for each of a plurality of frames.
- the feature amount calculation unit 54 calculates the amount of variation in the feature amount for each of a plurality of frames. For example, let the position of the center of gravity in frame (i-1) be ⁇ x(i-1), y(i-1) ⁇ , and let the position of the center of gravity in frame i be ⁇ xi, yi ⁇ .
- the variation amount ⁇ i of the feature amount in frame i is the variation amount from the barycenter position ⁇ x (i-1), y (i-1) ⁇ to the barycenter position ⁇ xi, yi ⁇ , (i-1), y(i-1) ⁇ and ⁇ xi, yi ⁇ .
- FIG. 7 is a diagram showing an example of the variation amount of the blood vessel center of gravity.
- the horizontal axis indicates the frame
- the vertical axis indicates the amount of variation in the center of gravity of the blood vessel.
- the frame identifying unit 55 detects the peak of the blood vessel center of gravity fluctuation amount, and identifies the frame in which the peak is detected as a required frame. Specifically, the frame specifying unit 55 can detect the maximum value (peak) of the amount of variation in the center of gravity of the blood vessel calculated for each frame, and specify the frame corresponding to the detected maximum value as the required frame. Further, at least one of pre-processing and post-processing of the process of detecting a local maximum value (peak) may be performed.
- the preprocessing includes, for example, a process of removing noise in the blood vessel center of gravity fluctuation amount by filtering as preliminary noise removal.
- post-processing includes, for example, (1) processing to remove noise (for example, local maximum values with small values) so that the detected local maximum value (peak) is above a certain level, (2) processing to remove noise between adjacent local maximum values, etc. This includes processing to remove noise (for example, local maximum values with small values) so that the values are equal to or larger than a certain interval. This allows unnecessary noise to be removed.
- noise for example, local maximum values with small values
- FIG. 8 is a diagram showing an example of a method for specifying a required frame.
- the symbol ⁇ indicates the location where the peak of the blood vessel center of gravity fluctuation amount is detected, and the corresponding frame is the required frame.
- the required frame is identified regardless of the presence or absence of side branches.
- the required frame is a frame in which the amount of variation in the blood vessel center of gravity is equal to or greater than a predetermined threshold, and is a frame corresponding to a specific heartbeat cycle.
- the information processing device 50 even if electrocardiogram information etc. cannot be obtained, it is possible to simply obtain medical image data showing cross-sectional images of multiple frames of a blood vessel, and to obtain frames ( (required frame) can be extracted.
- FIG. 9 is a diagram showing an example of the extraction result of required frames.
- FIG. 9A shows the arrangement of blood vessel boundaries of segmentation data (S1, S2, S3, . . . , Sn) corresponding to frames 1 to n of medical image data (G1, G2, G3, . . . , Gn).
- S1, S2, S3, . . . , Sn segmentation data
- FIG. 9A blood vessel boundaries are displayed in all frames, but the blood vessel boundaries vary between frames due to the influence of pulsation, making it difficult to understand the blood vessel boundaries as a whole.
- FIG. 10 is a diagram illustrating an example of a method for identifying a group of corresponding points in a predetermined region when there are no side branches.
- the boundary of a lumen will be described as a predetermined region, but the predetermined region also includes a border of a blood vessel.
- the required frames specified by the frame specifying section 55 are assumed to be 1, 2, 3, . . . , n'. Segmentation data of required frames are assumed to be F1, F2, F3,..., Fi,..., Fj,..., Fn'.
- the number of frames is n', and n' ⁇ total number of frames n.
- Let j be the frame of interest
- i be the corresponding frame corresponding to the frame of interest j.
- the frame of interest j and the corresponding frame i are frames for specifying a group of corresponding points. Note that the frame of interest j and the corresponding frame i do not have to be adjacent frames, and other frames may exist between them.
- the discrete points on the lumen boundary indicated by the segmentation data Fi of frame i are represented by P(i, m), and the discrete points on the lumen boundary indicated by the segmentation data Fj of frame j are represented by P(j, m).
- m is a number from 1 to m and indicates the number of discrete points. Examples of methods for identifying discrete points include (1) sequentially identifying them at the same angle along the boundary, (2) identifying the discrete points so that the distance between them is constant, and (3) identifying the discrete points so that the distance between them is constant. It is possible to use a method of specifying the value so that it is constant. Thereby, regardless of the shape of the boundary, it is possible to suppress excessive twisting and the like and obtain well-balanced discrete points. Furthermore, the number of discrete points on the blood vessel boundary may be less than or equal to the number of discrete points on the lumen boundary. This makes it possible to reduce the number of discrete points on the blood vessel boundary and improve the visibility of the lumen mesh.
- the discrete point P(i,m) with the shortest distance is identified as the corresponding point.
- the distances d1 and d2 between the discrete point P (j, 1) and the discrete points P (i, 1) and P (i, 2) are calculated, and the calculated distances d1 and d2 are compared. Then, since the distance d2 is shorter than the distance d1, the discrete point P(i,2) is selected. Similar comparisons are made for other discrete points.
- FIG. 11 is a diagram showing an example of a method for connecting a group of corresponding points. It is assumed that a group of discrete points on the lumen boundary indicated by segmentation data Fi of frame i is associated with a group of discrete points on the lumen boundary indicated by segmentation data Fj of frame j. Discrete points that are associated with each other are referred to as corresponding points, and corresponding points on the boundary are collectively referred to as a group of corresponding points. Segmentation data Fi for frame i and segmentation data Fj for frame j are arranged along the Z-axis direction with an appropriate distance between them. The Z axis indicates the longitudinal direction of the blood vessel.
- Each corresponding point (corresponding point group) of frames i and j is connected with a straight line in the Z-axis direction. Also, adjacent corresponding points on the boundary are connected with a straight line along the boundary. Thereby, it is possible to generate a 3D image in which the lumen boundaries indicated by the segmentation data of frames i and j are connected in a mesh shape. Similarly, a mesh-like 3D image can be generated for blood vessel boundaries. By performing similar processing on all frames 1 to n, a mesh-like 3D image of the blood vessel can be generated.
- FIG. 12 is a diagram showing a first example of a method for identifying a group of corresponding points in a predetermined region when a side branch exists.
- the presence or absence of side branches can be determined based on segmentation data output by the learning model 59.
- the presence or absence of a side branch may be determined based on the eccentricity of the cross-sectional shape of the blood vessel.
- the eccentricity can be determined by calculating the maximum diameter d1 and minimum diameter d2 of the lumen diameter based on the lumen boundary.
- the presence or absence of a side branch can be determined depending on whether the degree of eccentricity is greater than or equal to a predetermined threshold.
- Circularity may be calculated instead of eccentricity.
- Circularity is the ratio of the area of the inner region of the blood vessel boundary to the circumference of the blood vessel boundary. The closer the degree of circularity is to the ratio of the area of the circle to the length of the circumference, the higher the degree of circularity, and it can be determined that the possibility of a side branch being captured is low.
- the diameter of the target blood vessel border (maximum diameter and minimum diameter) is calculated as a parameter by comparing the diameter of the blood vessel border in the scanned tomographic image, and the diameter
- the presence or absence of a side branch can be determined depending on whether or not there is a sudden change of a predetermined rate or more and a predetermined length or more.
- a learning model for judgment that is trained to output an accuracy corresponding to the possibility that a side branch is captured is used to make a judgment when data on lumen boundaries and blood vessel boundaries are input. You may.
- segmentation data F1,..., F(i-1), Fi have no side branches
- segmentation data Fj, F(j+1) have side branches.
- a frame without a side branch and a frame with a side branch can be associated as corresponding frames.
- segmentation data Fi of frame i and segmentation data Fj of frame j are associated.
- the discrete point group of the lumen boundary of the segmentation Fi and the discrete point group of the main lumen boundary of the segmentation Fj are associated with each other and identified as a corresponding point group, and the same processing as that illustrated in FIG. 10 is performed.
- the discrete point group of the lumen boundary of the side branch of segmentation Fj is left as is and no connection processing is performed.
- FIG. 13 is a diagram showing a second example of a method for identifying a group of corresponding points in a predetermined region when a side branch exists.
- distances d1 and d2 between the discrete point P(j, 1) and the discrete points P(i, 1) and P(i, 2) are calculated.
- it is determined whether or not to perform the association For example, since the distance d1 is shorter than the threshold, the correspondence is made. On the other hand, since the distance d2 is longer than the threshold value, no correspondence is made. In this way, when identifying corresponding points, if the distance between discrete points is equal to or greater than the threshold, they are not connected. Similar comparisons are made for other discrete points.
- control unit 51 specifies a group of corresponding points at a predetermined portion of the blood vessel in two different frames among the required frames specified by the frame specifying unit 55, and calculates the 3D image of the blood vessel based on the specified group of corresponding points. Images can be generated.
- FIGS. 14A and 14B are diagrams showing examples of simulated 3D images of blood vessels.
- the 3D images of blood vessels illustrated in FIGS. 14A and 14B are images that simulate (simulate) what kind of 3D images will become when actually processed.
- FIG. 14A shows a simulated 3D image according to a comparative example.
- a comparative example shows a 3D image of a blood vessel generated using segmentation data of all frames without specifying the required frames. In the comparative example, a lot of blurring occurs in the mesh-like 3D image due to noise caused by pulsation.
- FIG. 14B shows a case where a 3D image according to this embodiment is simulated.
- this embodiment since segmentation data using only required frames is used, noise due to pulsation is removed. As a result, the mesh-like 3D image has almost no blurring, and a clear 3D image can be obtained.
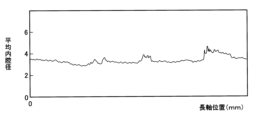
- FIGS. 15A and 15B are diagrams showing examples of blood vessel information based on required frames.
- the horizontal axis shows the position of the long axis of the blood vessel
- the vertical axis shows the plaque area ratio (plaque burden). Since the plaque area ratio shown in FIG. 15A uses segmentation data using only the required frames, noise due to pulsation is removed and it can be calculated with high accuracy. That is, the control unit 51 can generate plaque distribution information (plaque burden) in the axial direction of the blood vessel based on the area information of a predetermined portion of the blood vessel in each of the specified required frames.
- plaque distribution information plaque burden
- the horizontal axis indicates the position of the long axis of the blood vessel
- the vertical axis indicates the average lumen diameter. Since the average lumen diameter shown in FIG. 15B uses segmentation data using only the required frames, noise due to pulsation is removed and can be calculated with high accuracy. That is, the control unit 51 can calculate the average lumen diameter in the axial direction of the blood vessel based on the region information of the predetermined portion of the blood vessel in each of the specified required frames. By obtaining blood vessel information as shown in FIG. 15B, for example, the stent diameter can be determined.
- FIG. 16 is a diagram showing an example of a processing procedure by the information processing device 50.
- the control unit 51 acquires medical image data (S11), inputs the acquired medical image data to the learning model 59, and obtains region information of a predetermined portion of the blood vessel (for example, blood vessel boundary and lumen boundary) for each frame. (S12).
- the control unit 51 calculates the feature amount for each frame (for example, blood vessel centroid) based on the obtained region information of the predetermined region (S13), and calculates the change in the feature amount for each frame based on the difference in the feature amount between frames. The amount is calculated (S14).
- the control unit 51 detects the maximum value (peak) of the amount of variation calculated for each frame and identifies the required frame (S15). For specifying the required frame, see FIG. 8, for example.
- the control unit 51 identifies a group of corresponding points of a predetermined region in two different required frames among the specified required frames (S16), and generates a mesh-like 3D image of a blood vessel using the identified corresponding point group. (S17).
- the control unit 51 calculates the plaque area ratio and average lumen diameter in the long axis direction of the blood vessel based on the area information of the predetermined region in the specified required frame (S18), and ends the process. Note that the process of step S18 can be branched from the process of step S15 and can be performed in parallel with the processes of steps S16 to S17.
- the computer program of the present embodiment causes a computer to acquire medical image data showing cross-sectional images of multiple frames of a hollow organ, and calculates feature amounts of the hollow organ for each frame based on the acquired medical image data. Then, a process is executed to detect a local maximum value of the variation amount of the feature amount between frames, and to specify a plurality of required frames from among the plurality of frames based on the detected local maximum value.
- the computer program of the present embodiment is configured to acquire, when medical image data indicating cross-sectional images of a plurality of frames of a hollow organ is input to a computer, a learning model that outputs area information of a predetermined region of the hollow organ. inputting the medical image data obtained, acquiring area information of a predetermined part of the hollow organ for each frame, and calculating feature amounts of the hollow organ for each frame based on the obtained area information. .
- the feature amount includes the center of gravity position or the average lumen diameter of the hollow organ.
- the computer program of this embodiment causes a computer to execute a process of generating plaque distribution information in the axial direction of the hollow organ based on area information of a predetermined region of the hollow organ in each of the specified required frames.
- the computer program of this embodiment causes a computer to execute a process of calculating the average lumen diameter in the axial direction of the hollow organ based on area information of a predetermined region of the hollow organ in each of the specified required frames.
- the computer program of this embodiment causes a computer to specify a group of corresponding points at a predetermined part of the hollow organ in two different frames among the specified required frames, and to determine whether the hollow organ is connected based on the specified group of corresponding points. Execute processing to generate a 3D image.
- the information processing device of this embodiment includes an acquisition unit that acquires medical image data showing cross-sectional images of a plurality of frames of a hollow organ, and a feature amount of the hollow organ for each frame based on the acquired medical image data. a calculation unit that calculates, a detection unit that detects a maximum value of the variation amount of the feature amount between frames, and a specification unit that identifies a plurality of required frames from among the plurality of frames based on the detected maximum value. Be prepared.
- the information processing method of the present embodiment acquires medical image data showing cross-sectional images of a plurality of frames of a hollow organ, calculates the feature amount of the hollow organ for each frame based on the obtained medical image data, A local maximum value of the variation amount of the feature quantity between frames is detected, and a plurality of required frames are specified from among the plurality of frames based on the detected maximum value.
- Communication network 10 Catheter 20 MDU 30 Display device 40 Input device 50 Information processing device 51 Control unit 52 Communication unit 53 Interface unit 54 Feature calculation unit 55 Frame identification unit 56 Memory 57 Storage unit 58 Computer program 59 Learning model 59a Input layer 59b Intermediate layer 59c Output layer 60 Recording Media reading unit 61 Recording medium 200 Server
Abstract
L'invention concerne un programme informatique qui peut extraire des trames à une période spécifique uniquement à partir d'une image médicale, un dispositif de traitement d'informations et un procédé de traitement d'informations. Le programme informatique amène un ordinateur à exécuter un traitement consistant à : acquérir des données d'image médicale qui représentent une image en coupe transversale d'une pluralité de trames d'un organe vasculaire ; calculer une quantité caractéristique de l'organe vasculaire pour chacune des trames sur la base des données d'image médicale acquises ; détecter une valeur maximale d'une quantité de variation de la quantité caractéristique entre les trames ; et identifier une pluralité de trames requises parmi la pluralité de trames sur la base des valeurs maximales détectées.
Applications Claiming Priority (2)
| Application Number | Priority Date | Filing Date | Title |
|---|---|---|---|
| JP2022-054470 | 2022-03-29 | ||
| JP2022054470 | 2022-03-29 |
Publications (1)
| Publication Number | Publication Date |
|---|---|
| WO2023189261A1 true WO2023189261A1 (fr) | 2023-10-05 |
Family
ID=88201401
Family Applications (1)
| Application Number | Title | Priority Date | Filing Date |
|---|---|---|---|
| PCT/JP2023/008440 WO2023189261A1 (fr) | 2022-03-29 | 2023-03-07 | Programme informatique, dispositif de traitement d'informations et procédé de traitement d'informations |
Country Status (1)
| Country | Link |
|---|---|
| WO (1) | WO2023189261A1 (fr) |
Citations (4)
| Publication number | Priority date | Publication date | Assignee | Title |
|---|---|---|---|---|
| JPH0759777A (ja) * | 1993-08-30 | 1995-03-07 | Aloka Co Ltd | 管腔内超音波診断装置 |
| JP2016530043A (ja) * | 2013-09-11 | 2016-09-29 | ボストン サイエンティフィック サイムド,インコーポレイテッドBoston Scientific Scimed,Inc. | 血管内超音波撮像システムを使用して画像を選択し表示するためのシステム |
| US20200294659A1 (en) * | 2019-03-17 | 2020-09-17 | Lightlab Imaging, Inc. | Arterial Imaging and Assessment Systems and Methods and Related User Interface Based-Workflows |
| JP2021517034A (ja) * | 2018-03-15 | 2021-07-15 | コーニンクレッカ フィリップス エヌ ヴェKoninklijke Philips N.V. | 管腔内病巣評価及び処置計画のための解剖学的標識の決定及び可視化 |
-
2023
- 2023-03-07 WO PCT/JP2023/008440 patent/WO2023189261A1/fr unknown
Patent Citations (4)
| Publication number | Priority date | Publication date | Assignee | Title |
|---|---|---|---|---|
| JPH0759777A (ja) * | 1993-08-30 | 1995-03-07 | Aloka Co Ltd | 管腔内超音波診断装置 |
| JP2016530043A (ja) * | 2013-09-11 | 2016-09-29 | ボストン サイエンティフィック サイムド,インコーポレイテッドBoston Scientific Scimed,Inc. | 血管内超音波撮像システムを使用して画像を選択し表示するためのシステム |
| JP2021517034A (ja) * | 2018-03-15 | 2021-07-15 | コーニンクレッカ フィリップス エヌ ヴェKoninklijke Philips N.V. | 管腔内病巣評価及び処置計画のための解剖学的標識の決定及び可視化 |
| US20200294659A1 (en) * | 2019-03-17 | 2020-09-17 | Lightlab Imaging, Inc. | Arterial Imaging and Assessment Systems and Methods and Related User Interface Based-Workflows |
Similar Documents
| Publication | Publication Date | Title |
|---|---|---|
| JP7375102B2 (ja) | 血管内画像化システムの作動方法 | |
| JP5944917B2 (ja) | 身体内腔分岐を検出及び表示するためのコンピュータ可読媒体及び同コンピュータ可読媒体を含むシステム | |
| US7359554B2 (en) | System and method for identifying a vascular border | |
| US20180192983A1 (en) | Vascular Data Processing and Image Registration Systems, Methods, and Apparatuses | |
| CN111134651B (zh) | 基于腔内影像计算血流储备分数的方法、装置、系统以及计算机存储介质 | |
| EP2967480B1 (fr) | Procédés de traitement de données et d'enregistrement d'images vasculaires | |
| JP7023715B2 (ja) | 血管内のステントストラットカバレッジを決定するためのシステムの作動方法及びステント留置された領域を検出するための血管内画像化システムのプログラム可能なプロセッサベースのコンピュータ装置 | |
| US20080051657A1 (en) | Systems And Methods For Estimating The Size And Position Of A Medical Device To Be Applied Within A Patient | |
| CN108348171B (zh) | 血管内成像和引导导管的检测的方法和系统 | |
| Meier et al. | Automated morphometry of coronary arteries with digital image analysis of intravascular ultrasound | |
| WO2004017823A2 (fr) | Systeme et procede d'identification d'un contour vasculaire | |
| JP2021104337A (ja) | 内腔に沿った管腔内デバイスの管腔内経路の推定 | |
| CN103190932A (zh) | 一种冠状动脉血管壁应力和应变的估算方法 | |
| WO2021199968A1 (fr) | Programme informatique, procédé de traitement d'informations, dispositif de traitement d'informations et procédé de génération de modèle | |
| US20240013385A1 (en) | Medical system, method for processing medical image, and medical image processing apparatus | |
| JP2022055170A (ja) | コンピュータプログラム、画像処理方法及び画像処理装置 | |
| WO2023189261A1 (fr) | Programme informatique, dispositif de traitement d'informations et procédé de traitement d'informations | |
| WO2022071265A1 (fr) | Programme, et dispositif et procédé de traitement d'informations | |
| WO2023054442A1 (fr) | Programme informatique, dispositif de traitement d'informations, et procédé de traitement d'informations | |
| WO2023100838A1 (fr) | Programme informatique, dispositif de traitement d'informations, procédé de traitement d'informations et procédé de génération de modèle d'apprentissage | |
| WO2023189260A1 (fr) | Programme informatique, dispositif de traitement d'informations et procédé de traitement d'informations | |
| JP2023051176A (ja) | コンピュータプログラム、情報処理装置及び情報処理方法 | |
| WO2022209657A1 (fr) | Programme informatique, procédé de traitement d'informations et dispositif de traitement d'informations | |
| WO2022202323A1 (fr) | Programme, procédé de traitement d'informations et dispositif de traitement d'informations | |
| JP2023049952A (ja) | コンピュータプログラム、情報処理装置、情報処理方法及び学習モデル生成方法 |
Legal Events
| Date | Code | Title | Description |
|---|---|---|---|
| 121 | Ep: the epo has been informed by wipo that ep was designated in this application |
Ref document number: 23779289 Country of ref document: EP Kind code of ref document: A1 |