WO2023157505A1 - 光ファイバ - Google Patents
光ファイバ Download PDFInfo
- Publication number
- WO2023157505A1 WO2023157505A1 PCT/JP2023/000220 JP2023000220W WO2023157505A1 WO 2023157505 A1 WO2023157505 A1 WO 2023157505A1 JP 2023000220 W JP2023000220 W JP 2023000220W WO 2023157505 A1 WO2023157505 A1 WO 2023157505A1
- Authority
- WO
- WIPO (PCT)
- Prior art keywords
- core
- concentration
- optical fiber
- alkali metal
- average
- Prior art date
Links
Images


Classifications
-
- C—CHEMISTRY; METALLURGY
- C03—GLASS; MINERAL OR SLAG WOOL
- C03C—CHEMICAL COMPOSITION OF GLASSES, GLAZES OR VITREOUS ENAMELS; SURFACE TREATMENT OF GLASS; SURFACE TREATMENT OF FIBRES OR FILAMENTS MADE FROM GLASS, MINERALS OR SLAGS; JOINING GLASS TO GLASS OR OTHER MATERIALS
- C03C13/00—Fibre or filament compositions
- C03C13/04—Fibre optics, e.g. core and clad fibre compositions
-
- G—PHYSICS
- G02—OPTICS
- G02B—OPTICAL ELEMENTS, SYSTEMS OR APPARATUS
- G02B6/00—Light guides; Structural details of arrangements comprising light guides and other optical elements, e.g. couplings
- G02B6/02—Optical fibres with cladding with or without a coating
Definitions
- the core made of silica-based glass contains an alkali metal element or an alkaline earth metal element
- the viscosity of the core is reduced when an optical fiber is produced by drawing an optical fiber preform, and the glass is not affected by the glass. Since rearrangement is facilitated, transmission loss due to Rayleigh scattering in optical fibers is reduced.
- alkali metal elements and alkaline earth metal elements are referred to as "alkali metal element group”.
- Patent Documents 1 and 2 describe optical fibers in which the core made of silica-based glass contains an alkali metal element group.
- An optical fiber according to an aspect of the present disclosure is an optical fiber made of silica-based glass, and contains one or more elements from an alkali metal element group consisting of an alkali metal element and an alkaline earth metal element, and chlorine. It comprises a core and a cladding surrounding the core and having a refractive index lower than that of the core.
- the average concentration CA of the alkali metal element group over the core and the average concentration CC of chlorine over the core satisfy CC/CA>1.0.
- FIG. 1 is a cross-sectional view of an optical fiber according to an embodiment.
- FIG. 2 is a flow chart showing a method of manufacturing an optical fiber.
- FIG. 3 is a graph showing the relationship between core average Cl concentration/core average K concentration and transmission loss.
- FIG. 4 is a graph showing the relationship between core average Cl concentration/core average K concentration and transmission loss.
- FIG. 5 is a graph showing the relationship between core average Cl concentration/core average K concentration and transmission loss.
- FIG. 6 is a graph showing the relationship between core average Cl concentration/core average K concentration and transmission loss.
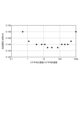
- FIG. 7 is a graph showing the relationship between core average F concentration/core average K concentration and transmission loss.
- the core containing alkali metal elements does not contain chlorine (or if the chlorine content is small)
- the alkali metal elements added to the center of the core in the state of the optical fiber preform are not drawn.
- bonds in the glass molecular structure are broken. As a result, a glass defect is generated, and an increase in transmission loss originating from the glass defect occurs.
- the core contains sufficient chlorine, the chlorine will bind to the glass defects. As a result, the occurrence of glass defects is suppressed, and the increase in transmission loss due to glass defects is reduced.
- the transmission loss of an optical fiber whose core is doped with alkali metal elements includes Rayleigh scattering loss, loss due to glass defects, and loss due to concentration fluctuations of both alkali and halogen. Therefore, in order to reduce the transmission loss, it is necessary to optimize these loss factors. Therefore, optimization of the concentration of a single element cannot sufficiently reduce the transmission loss. For example, although it is a qualitative argument, if the alkali metal element group is small, the chlorine that binds to the glass defects may be small, and if the alkali metal element group is large, the chlorine that binds to the glass defects is required to be large. .
- the optical fibers described in Patent Documents 1 and 2 cannot sufficiently reduce transmission loss.
- An object of the present disclosure is to provide an optical fiber capable of sufficiently reducing transmission loss.
- An optical fiber according to an aspect of the present disclosure is an optical fiber made of silica-based glass, and contains one or more elements from an alkali metal element group consisting of an alkali metal element and an alkaline earth metal element, and chlorine. It comprises a core and a cladding surrounding the core and having a refractive index lower than that of the core.
- the average concentration CA of the alkali metal element group over the core and the average concentration CC of chlorine over the core satisfy CC/CA>1.0. In the present disclosure, all "concentrations" are expressed as "mass fractions.”
- the above optical fiber can sufficiently reduce transmission loss.
- CC/CA may be smaller than 500.
- a straight line obtained by approximating the values of CC(r)/CA(r) by the method of least squares may have a positive slope.
- CC(r)/CA(r) may be less than 1 within a range of 1 ⁇ m from the central axis of the optical fiber.
- the core may further contain fluorine, and the average fluorine concentration CF of the entire core may satisfy CF/CA ⁇ 100.
- the average concentration CA of the alkali metal element group in the entire core may be 0.2 ppm or more and 2000 ppm or less in mass fraction.
- the core may contain one or more elements among sodium, potassium, rubidium, cesium, and calcium as the alkali metal element group.
- FIG. 1 is a cross-sectional view of an optical fiber according to an embodiment.
- an optical fiber 1 according to an embodiment includes a core 10 and a clad 20.
- the optical fiber 1 is made of silica-based glass.
- the core 10 extends along the central axis 1a of the optical fiber 1.
- the diameter (core diameter) of the core 10 is, for example, 7 ⁇ m or more and 20 ⁇ m or less.
- Core 10 has a refractive index higher than that of cladding 20 .
- the core 10 contains one or more elements from the alkali metal element group consisting of alkali metal elements and alkaline earth metal elements, and chlorine.
- Core 10 contains one or more elements among sodium, potassium, rubidium, cesium, and calcium as an alkali metal element group.
- the average concentration of the alkali metal element group in the entire core 10 is 0.2 ppm or more and 2000 ppm or less in mass fraction.
- the average concentration of chlorine in the entire core 10 is 10 ppm or more and 10000 ppm or less in mass fraction.
- CA is the average concentration of the alkali metal element group throughout the core 10 and CC is the average concentration of chlorine throughout the core 10, CC/CA is greater than 1.0 and less than 500. From the central axis 1a of the optical fiber 1 to the half radius position of the core 10, the concentration CA(r) of the alkali metal element group at the position of the radius r from the central axis 1a with respect to the concentration CC(r) of chlorine A straight line obtained by approximating the value of the ratio CC(r)/CA(r) by the method of least squares has a positive slope.
- the core 10 further contains fluorine.
- the average concentration of fluorine in the entire core 10 is 30 ppm or more and 5100 ppm or less in mass fraction.
- CF/CA is 1000 or less, where CF is the average concentration of fluorine in the entire core 10 .
- Other dopants and impurities contained in the core 10 have a mass fraction of 10 ppm or less.
- a method for measuring the concentration of elements contained in the optical fiber 1 is, for example, as follows.
- the end face of the optical fiber 1 perpendicular to the central axis 1a is polished, and the radius of the element to be measured is measured by an electron probe micro analyzer (EPMA) at each position along a straight line passing through the center position on the end face.
- EPMA measurement conditions are, for example, an acceleration voltage of 20 kV, a probe beam diameter of 1 ⁇ m or less, and a measurement interval of 100 nm or less.
- the average concentration of the element to be measured in the entire core 10 is expressed by the following formula (1).
- CA(r) is the sum of the concentrations obtained with each element as the measurement target, and the average concentration obtained with each element as the measurement target. Let the sum be the average concentration CA.
- the cladding 20 surrounds the core 10 and has a refractive index lower than that of the core 10 .
- the diameter of the clad 20 is, for example, 124 ⁇ m or more and 126 ⁇ m or less.
- the clad 20 includes, for example, a first clad surrounding the core 10 and a second clad surrounding the first clad.
- the cutoff wavelength of the optical fiber 1 is, for example, 1200 nm or more and 1600 nm or less.
- the effective cross-sectional area of the optical fiber 1 is, for example, 70 ⁇ m 2 or more and 170 ⁇ m 2 or less.
- FIG. 2 is a flow chart showing the method for manufacturing an optical fiber. The following description also describes an example of specific conditions.
- the optical fiber 1 undergoes a preparation process (step S1), an addition process (step S2), a diameter reduction process (step S3), an etching process (step S4), and a solidification process (step S5).
- a stretch grinding process step S6
- a rod-in-collapse process step S7
- an OVD process step S8
- drawing process step S9
- a glass pipe made of silica-based glass into which a dopant such as an alkali metal element group is to be diffused is prepared.
- the glass pipe has an outer diameter of 30 mm or more and 40 mm or less, and an inner diameter of 15 mm or more and 25 mm or less.
- the cylindrical body of silica-based glass from which this glass pipe is made contains chlorine and fluorine.
- the concentration of fluorine contained in this cylindrical body is 30 ppm or more and 5100 ppm or less in mass fraction.
- the concentration of other dopants and impurities contained in this cylindrical body is 10 ppm or less in mass fraction.
- the density referred to here is the average density of the entire cylindrical body, and is expressed by the following formula (2), where b is the radius of the cylindrical body.
- the concentration C(r) of the element at the position of the radius r in the cylindrical body is measured by EPMA in the same way as in the optical fiber.
- the measurement conditions may differ from those for optical fibers. There is no problem if the concentration is calculated using the calibration curve under each condition.
- a dopant of the alkali metal element group is added to the inner surface of the silica-based glass glass pipe (hereinafter referred to as the glass pipe).
- the glass pipe the silica-based glass glass pipe
- the case of adding potassium element will be described.
- 6 g or more and 50 g or less of potassium bromide (KBr) is used as a raw material.
- This raw material is heated to a temperature of 750° C. or higher and 850° C. or lower by an external heat source to generate raw material vapor.
- a carrier gas made of oxygen at a flow rate of 1 SLM (1 liter / min in terms of standard conditions
- the outer surface of the glass pipe is heated to a temperature of 1400 ° C.
- an oxyhydrogen burner from the outside.
- a glass pipe is heated so that it may become 2000 degrees C or less.
- the burner is traversed at a speed of 30 mm/min or more and 60 mm/min or less, and heating is performed for a total of 5 turns or more and 20 turns or less to diffusely add the potassium element to the inner surface of the glass pipe.
- step S3 the diameter of the potassium-added glass pipe is reduced.
- the glass pipe is heated by an external heat source so that the outer surface of the glass pipe reaches a temperature of 2000° C. or more and 2300° C. or less while flowing oxygen into the inside of the glass pipe at a temperature of 0.5 SLM or more and 1.0 SLM or less.
- An external heat source is traversed and heated by a total of 5 turns or more and 15 turns or less to reduce the inner diameter of the glass pipe to 3 mm or more and 8 mm or less.
- step S4 the inner surface of the glass pipe is etched.
- a mixed gas of SF 6 (0.2 SLM or more and 1.0 SLM or less) and chlorine (0.5 SLM or more and 1.0 SLM or less) is introduced into the inside of the glass pipe, the glass pipe is heated by an external heat source.
- a phase etch is performed. By doing so, the inner surface of the glass pipe containing a high concentration of impurities added together with the target dopant can be scraped, and the impurities can be removed.
- the glass pipe is solidified.
- a single or mixed gas of oxygen 0.1 SLM or more and 0.5 SLM or less
- He 0.5 SLM or more and 1.0 SLM or less
- the absolute pressure in the glass pipe is While reducing the pressure to 97 kPa or less
- the surface temperature is set to 2000° C. or more and 2300° C. or less to solidify the glass pipe.
- a core portion (with an outer diameter of 20 mm or more and 30 mm or less) made of a glass rod is obtained.
- a core layer containing no alkali metal element group may be provided on the outside of this glass rod by a known method such as the OVD (Outside Vapor Deposition) method or the collapse method.
- the core portion is stretched to a diameter of 15 mm or more and 25 mm or less, and the outer peripheral portion of the core portion is further ground to a diameter of 15 mm or more and 25 mm or less.
- This portion becomes the core 10 of the optical fiber 1 .
- the diameter immediately after stretching is larger than the diameter after grinding.
- rod-in-collapse is performed by using the core portion as a rod and using a fluorine-added silica-based glass pipe as a pipe.
- the core portion and the silica-based glass pipe to which fluorine is added are heated by an external heat source and integrated. This adds a first clad portion around the core portion.
- the maximum relative refractive index difference between the core portion and the first clad portion is about 0.34%.
- step S8 the rod formed by integrating the core portion and the first clad portion is stretched to a predetermined diameter, and then the second clad portion containing fluorine is synthesized on the outside of the rod by the OVD method. .
- an optical fiber preform is manufactured.
- the optical fiber 1 is manufactured by drawing the optical fiber preform.
- the drawing speed is 600 m/min or more and 2300 m/min or less.
- the drawing tension is, for example, 0.5N.
- Table 1 is a table summarizing the specifications of each optical fiber manufactured and evaluated.
- Table 1 shows the transmission loss ( ⁇ 1.55) at a wavelength of 1550 nm, the core diameter, the cutoff wavelength ( ⁇ cc), the effective area (Aeff) at a wavelength of 1550 nm, and the average concentration of potassium in the entire core ( Core average K concentration CA), average chlorine concentration throughout the core (core average Cl concentration CC), average fluorine concentration throughout the core (core average F concentration CF), core average Cl concentration/core average K concentration (CC/CA ), and the core mean F concentration/core mean K concentration (CF/CA). All concentrations are "mass fractions".
- Fibers 1 to 13 are optical fibers manufactured by changing the core average Cl concentration from 20 ppm to 40000 ppm in mass fraction.
- the core average Cl concentration was varied depending on the chlorine concentration of the cylindrical body of silica-based glass that was the base of the glass pipe prepared in the preparation step.
- the core average K concentration is kept between 40 ppm and 43 ppm mass fraction.
- the core average F concentration is generally kept at 2000 ppm mass fraction.
- FIG. 3 core average Cl concentration/core average K concentration and transmission loss at a wavelength of 1550 nm are plotted for each of fibers 1 to 13.
- FIG. 4 is a graph in which the horizontal axis of FIG. 3 is Log scale.
- the transmission loss increases when the core average Cl concentration/core average K concentration is less than 1.0. This is probably because the concentration of potassium added is relatively high with respect to the concentration of chlorine added, and the amount of chlorine combined with the amount of glass defects generated during wire drawing is insufficient.
- the core average Cl concentration/core average K concentration exceeds 500, the transmission loss also increases. In this case, although chlorine is sufficiently bonded to the glass defects, the concentration of chlorine added is high, and it is considered that the transmission loss increased due to concentration fluctuations.
- Fibers 14 to 24 are a group of optical fibers manufactured by varying the core average K concentration from 1 ppm to 2500 ppm mass fraction.
- the core average K concentration was varied by the amount of potassium added in the addition step.
- the core average Cl concentration is kept at approximately 2000 ppm mass fraction.
- the core average F concentration is generally kept at 2000 ppm mass fraction.
- FIG. 5 the core average Cl concentration/core average K concentration and the transmission loss at a wavelength of 1550 nm are plotted for each of the fibers 14 to 24.
- FIG. 6 is a graph in which the horizontal axis of FIG. 5 is Log scale. 5 and 6, similarly to FIGS. 3 and 4, the transmission loss increases when the core average Cl concentration/core average K concentration is less than 1.0. It is considered that this is because the concentration of potassium added is relatively high with respect to the concentration of chlorine added, and the amount of chlorine combined with the amount of glass defects generated during wire drawing is insufficient. On the other hand, when the core average Cl concentration/core average K concentration exceeds 500, the transmission loss also increases. In this case, although chlorine is sufficiently bonded to the glass defects, the added concentration of chlorine is high, and it is considered that the transmission loss increased due to concentration fluctuations.
- Fibers 25 to 33 are optical fibers manufactured by changing the core average F concentration from 30 ppm to 5100 ppm in mass fraction.
- the core average F concentration was changed by the fluorine concentration of the cylindrical body of silica-based glass that was the base of the glass pipe prepared in the preparation step.
- the core average K concentration is kept between 41 ppm and 43 ppm mass fraction.
- the core average Cl concentration is generally kept at 2000 ppm mass fraction.
- the core average F concentration/core average K concentration and the transmission loss at a wavelength of 1550 nm are plotted for each of the fibers 25 to 33.
- the transmission loss is stably low. It is considered that this is because the effect of reducing transmission loss and the effect of increasing transmission loss caused by the addition of fluorine are approximately the same.
- the effect of reducing transmission loss occurs because the addition of fluorine lowers the viscosity, thereby reducing Rayleigh scattering.
- the effect of increasing transmission loss is caused by the increase in concentration fluctuation due to the addition of fluorine.
- the core average F density/core average K density is greater than 100, the transmission loss increases. This is probably because the effect of increasing the transmission loss was greater than the effect of reducing the transmission loss caused by the addition of fluorine.
- Table 2 is a table showing the results of investigating the relationship between the radial profile of Cl concentration/K concentration, which is the ratio of potassium concentration to chlorine concentration in the core, and transmission loss.
- Table 2 shows whether or not the Cl concentration/K concentration profile has an increasing tendency in a range of less than 1/2 of the core radius and a range of more than 1/2 of the core radius from the central axis of the optical fiber. It is shown.
- the slope is obtained by the method of least squares using the radius and Cl concentration/K concentration, and when the slope is positive, it is assumed that there is an increasing tendency. A zero or negative value indicates no upward trend.
- Fibers A1 to A4 are a group of optical fibers manufactured with varying profiles of Cl concentration/K concentration in the core. Since the chlorine concentration is generally constant throughout the core, the Cl concentration/K concentration profile in the core can be changed by the potassium concentration profile.
- the fibers A1 to A4 have an effective cross-sectional area of 110 ⁇ m 2 or more and 115 ⁇ m 2 or less, a cutoff wavelength of 1500 nm or more and 1525 nm or less, a core average K concentration of 38 ppm or more and 43 ppm or less, and a core average Cl concentration of 1000 ppm or more and 1500 ppm. It was manufactured with the core average F concentration in the range of 1800 ppm or more and 2200 ppm or less.
- Table 3 is a table showing the results of investigation focusing on the maximum value of Cl concentration/K concentration within a range of 1 ⁇ m from the central axis of the optical fiber.
- the Cl concentration/K concentration profile in the core tends to increase in the range from the central axis of the optical fiber to less than 1/2 of the core radius and in the range of more than 1/2 of the core radius. It is an optical fiber group manufactured so as to be. Fibers B1 to B4 were manufactured with an effective area in the range of 110 ⁇ m 2 to 115 ⁇ m 2 inclusive, a cutoff wavelength in the range of 1500 nm to 1525 nm inclusive, and a core average K concentration in the range of 38 ppm to 43 ppm inclusive.
Abstract
光ファイバは、シリカ系ガラスからなる。光ファイバは、アルカリ金属元素及びアルカリ土類金属元素からなるアルカリ金属元素群のうち一種類以上の元素、及び、塩素を含むコアと、コアを取り囲み、コアの屈折率よりも低い屈折率を有するクラッドと、を備える。アルカリ金属元素群のコア全体の平均濃度CA、及び、塩素のコア全体の平均濃度CCは、CC/CA>1.0を満たす。
Description
本開示は、光ファイバに関する。本出願は、2022年2月16日出願の日本出願第2022-021856号に基づく優先権を主張し、前記日本出願に記載された全ての記載内容を援用するものである。
一般に、シリカ系ガラスからなるコアがアルカリ金属元素またはアルカリ土類金属元素を含んでいると、光ファイバ母材を線引して光ファイバを製造する際にコアの粘性が低減されるともにガラスの再配列が促進されるので、光ファイバのレイリ散乱起因の伝送損失が低減される。以下では、アルカリ金属元素及びアルカリ土類金属元素の双方を「アルカリ金属元素群」という。
特許文献1及び特許文献2には、シリカ系ガラスからなるコアがアルカリ金属元素群を含む光ファイバが記載されている。
本開示の一態様に係る光ファイバは、シリカ系ガラスからなる光ファイバであって、アルカリ金属元素及びアルカリ土類金属元素からなるアルカリ金属元素群のうち一種類以上の元素、及び、塩素を含むコアと、コアを取り囲み、コアの屈折率よりも低い屈折率を有するクラッドと、を備える。アルカリ金属元素群のコア全体の平均濃度CA、及び、塩素のコア全体の平均濃度CCは、CC/CA>1.0を満たす。
[本開示が解決しようとする課題]
アルカリ金属元素群を含むコアにおいて塩素が含有されていない場合(または、塩素含有量が少ない場合)、光ファイバ母材の状態ではコア部の中心部に添加されていたアルカリ金属元素群が線引時に拡散する際に、ガラス分子構造の結合が切断される。これにより、ガラス欠陥が発生し、ガラス欠陥由来の伝送損失増加が生じる。コアが十分な量の塩素を含んでいる場合、その塩素がガラス欠陥に結合する。これにより、ガラス欠陥の発生が抑制され、ガラス欠陥由来の伝送損失増加が低減される。
アルカリ金属元素群を含むコアにおいて塩素が含有されていない場合(または、塩素含有量が少ない場合)、光ファイバ母材の状態ではコア部の中心部に添加されていたアルカリ金属元素群が線引時に拡散する際に、ガラス分子構造の結合が切断される。これにより、ガラス欠陥が発生し、ガラス欠陥由来の伝送損失増加が生じる。コアが十分な量の塩素を含んでいる場合、その塩素がガラス欠陥に結合する。これにより、ガラス欠陥の発生が抑制され、ガラス欠陥由来の伝送損失増加が低減される。
アルカリ金属元素群をコアに添加した光ファイバの伝送損失は、レイリ散乱損失、ガラス欠陥由来の損失、アルカリとハロゲン両方の濃度揺らぎ由来の損失を含む。よって、伝送損失を下げるためには、これらの損失の要因を最適化することが必要である。そのため、単一の元素の濃度の最適化だけでは伝送損失を十分に下げることができない。例えば定性的な議論ではあるが、アルカリ金属元素群が少ない場合にはガラス欠陥に結合する塩素が少なくてもよく、アルカリ金属元素群が多い場合にはガラス欠陥に結合する塩素が多く必要となる。特許文献1及び特許文献2に記載の光ファイバでは、伝送損失を十分に低減することができない。
本開示は、伝送損失を十分に低減することができる光ファイバを提供することを目的とする。
[本開示の効果]
本開示によれば、伝送損失を十分に低減することができる光ファイバを提供することができる。
本開示によれば、伝送損失を十分に低減することができる光ファイバを提供することができる。
[本開示の実施態様の説明]
最初に本開示の実施態様を列記して説明する。本開示の一態様に係る光ファイバは、シリカ系ガラスからなる光ファイバであって、アルカリ金属元素及びアルカリ土類金属元素からなるアルカリ金属元素群のうち一種類以上の元素、及び、塩素を含むコアと、コアを取り囲み、コアの屈折率よりも低い屈折率を有するクラッドと、を備える。アルカリ金属元素群のコア全体の平均濃度CA、及び、塩素のコア全体の平均濃度CCは、CC/CA>1.0を満たす。なお、本開示では、「濃度」はすべて「質量分率」で表現する。
最初に本開示の実施態様を列記して説明する。本開示の一態様に係る光ファイバは、シリカ系ガラスからなる光ファイバであって、アルカリ金属元素及びアルカリ土類金属元素からなるアルカリ金属元素群のうち一種類以上の元素、及び、塩素を含むコアと、コアを取り囲み、コアの屈折率よりも低い屈折率を有するクラッドと、を備える。アルカリ金属元素群のコア全体の平均濃度CA、及び、塩素のコア全体の平均濃度CCは、CC/CA>1.0を満たす。なお、本開示では、「濃度」はすべて「質量分率」で表現する。
上記光ファイバでは、伝送損失を十分に低減することができる。
CC/CAは、500よりも小さくてもよい。
光ファイバの中心軸からコアの半径の1/2の位置までにおいて、光ファイバの中心軸から半径rの位置でのアルカリ金属元素群の濃度CA(r)の塩素の濃度CC(r)に対する比CC(r)/CA(r)の値を最小二乗法で近似した直線は、正の傾きを有してもよい。
CC(r)/CA(r)は、光ファイバの中心軸から1μmの範囲内で1未満であってもよい。
コアは、フッ素を更に含み、フッ素のコア全体の平均濃度CFは、CF/CA≦100を満たしてもよい。
アルカリ金属元素群のコア全体の平均濃度CAは、質量分率0.2ppm以上2000ppm以下であってもよい。
コアは、アルカリ金属元素群としてナトリウム、カリウム、ルビジウム、セシウム、及び、カルシウムのうち一種類以上の元素を含んでもよい。
[本開示の実施形態の詳細]
本開示の光ファイバの具体例を、以下に図面を参照しつつ説明する。なお、本発明はこれらの例示に限定されるものではなく、請求の範囲によって示され、請求の範囲と均等の意味及び範囲内でのすべての変更が含まれることが意図される。図面の説明において同一の要素には同一の符号を付し、重複する説明を省略する。
本開示の光ファイバの具体例を、以下に図面を参照しつつ説明する。なお、本発明はこれらの例示に限定されるものではなく、請求の範囲によって示され、請求の範囲と均等の意味及び範囲内でのすべての変更が含まれることが意図される。図面の説明において同一の要素には同一の符号を付し、重複する説明を省略する。
図1は、実施形態に係る光ファイバの断面図である。図1に示されるように、実施形態に係る光ファイバ1は、コア10と、クラッド20と、を備える。光ファイバ1は、シリカ系ガラスからなる。
コア10は、光ファイバ1の中心軸1aに沿って延在している。コア10の直径(コア径)は、例えば、7μm以上20μm以下である。コア10は、クラッド20の屈折率よりも高い屈折率を有する。コア10は、アルカリ金属元素及びアルカリ土類金属元素からなるアルカリ金属元素群のうち一種類以上の元素、及び、塩素を含む。コア10は、アルカリ金属元素群として、ナトリウム、カリウム、ルビジウム、セシウム、カルシウムのうち一種類以上の元素を含む。アルカリ金属元素群のコア10全体の平均濃度は、質量分率0.2ppm以上2000ppm以下である。塩素のコア10全体の平均濃度は、質量分率10ppm以上10000ppm以下である。
アルカリ金属元素群のコア10全体の平均濃度をCA、塩素のコア10全体の平均濃度をCCとすると、CC/CAは、1.0よりも大きく、500よりも小さい。光ファイバ1の中心軸1aからコア10の半径の1/2の位置までにおいて、中心軸1aから半径rの位置でのアルカリ金属元素群の濃度CA(r)の塩素の濃度CC(r)に対する比CC(r)/CA(r)の値を最小二乗法で近似した直線は、正の傾きを有する。
コア10は、フッ素を更に含む。フッ素のコア10全体の平均濃度は、質量分率30ppm以上5100ppm以下である。フッ素のコア10全体の平均濃度をCFとすると、CF/CAは、1000以下である。コア10に含まれるその他のドーパント及び不純物の濃度は、質量分率10ppm以下である。
光ファイバ1に含まれる元素濃度の測定方法は、例えば次のとおりである。中心軸1aに垂直な光ファイバ1の端面を研磨し、その端面において中心位置を通る直線に沿った各位置で電子線マイクロアナライザ(EPMA:Electron Probe Micro Analyzer)により、測定対象とする元素の半径rの位置での濃度C(r)を測定する。EPMAによる測定の条件は、例えば、加速電圧が20kVであり、プローブビーム径が1μm以下であり、測定間隔が100nm以下である。コア10の半径をaとすると、測定対象とする元素のコア10全体における平均濃度は、下記(1)式で表される。なお、コア10がアルカリ金属元素群のうちの二種類以上の元素を含む場合、各元素を測定対象として求めた濃度の和をCA(r)とし、各元素を測定対象として求めた平均濃度の和を平均濃度CAとする。

クラッド20は、コア10を取り囲み、コア10の屈折率よりも低い屈折率を有する。クラッド20の直径は、例えば、124μm以上126μm以下である。クラッド20は、例えば、コア10を取り囲んでいる第1クラッドと、第1クラッドを取り囲んでいる第2クラッドとを含む。
光ファイバ1のカットオフ波長は、例えば、1200nm以上1600nm以下である。光ファイバ1の実効断面積は、例えば、70μm2以上170μm2以下である。
図2は、光ファイバの製造方法を示すフローチャートである。以下の説明では、具体的な条件の一例についても記載している。図2に示されるように、光ファイバ1は、準備工程(ステップS1)、添加工程(ステップS2)、縮径工程(ステップS3)、エッチング工程(ステップS4)、中実化工程(ステップS5)、延伸研削工程(ステップS6)、ロッドインコラプス工程(ステップS7)、OVD工程(ステップS8)、及び、線引工程(ステップS9)を順に経て製造される。
準備工程(ステップS1)では、アルカリ金属元素群等のドーパントを拡散させるべきシリカ系ガラスのガラスパイプを準備する。このガラスパイプの外直径は30mm以上40mm以下であり、内直径は15mm以上25mm以下である。このガラスパイプの元になるシリカ系ガラスの円柱体は、塩素及びフッ素を含む。この円柱体に含まれるフッ素の濃度は、質量分率30ppm以上5100ppm以下である。この円柱体に含まれるその他のドーパント及び不純物の濃度は、質量分率10ppm以下である。ここでいう濃度とは、円柱体全体の平均濃度であり、円柱体の半径をbとすると、下記(2)式で表される。

円柱体における元素の半径rの位置での濃度C(r)は、光ファイバの時と同じくEPMAにより測定される。測定条件は、光ファイバの時と異なっていてもよい。それぞれの条件での検量線を用いて濃度を算出していれば問題は無い。
添加工程(ステップS2)では、アルカリ金属元素群のドーパントをシリカ系ガラスのガラスパイプ(以下、ガラスパイプ)の内表面に添加する。ここでは、カリウム元素を添加する場合について説明する。原料として臭化カリウム(KBr)6g以上50g以下を用いる。この原料を外部熱源で温度750℃以上850℃以下に加熱して、原料蒸気を発生させる。1SLM(標準状態に換算して1リットル/min)の流量の酸素からなるキャリアガスと共に原料蒸気をガラスパイプの内部に導入しながら、外部から酸水素バーナによってガラスパイプの外表面が温度1400℃以上2000℃以下となるようにガラスパイプを加熱する。このとき、30mm/min以上60mm/min以下の速さでバーナをトラバースさせて合計5ターン以上20ターン以下で加熱し、カリウム元素をガラスパイプの内面に拡散添加させる。
縮径工程(ステップS3)では、カリウムが添加されたガラスパイプを縮径する。このとき、ガラスパイプの内部に酸素を0.5SLM以上1.0SLM以下で流しながら、外部熱源によってガラスパイプの外表面が2000℃以上2300℃以下となるようにガラスパイプを加熱する。外部熱源をトラバースさせて合計5ターン以上15ターン以下で加熱し、ガラスパイプを内直径が3mm以上8mm以下になるまで縮径する。
エッチング工程(ステップS4)では、ガラスパイプの内面をエッチングする。このとき、SF6(0.2SLM以上1.0SLM以下)及び塩素(0.5SLM以上1.0SLM以下)の混合ガスをガラスパイプの内部に導入しながら、外部熱源でガラスパイプを加熱して気相エッチングを行う。このようにすることで、目的のドーパントと共に添加された不純物を高濃度に含むガラスパイプの内面を削ることができ、この不純物を除去することができる。
中実化工程(ステップS5)では、ガラスパイプを中実化する。中実化工程では、酸素(0.1SLM以上0.5SLM以下)及びHe(0.5SLM以上1.0SLM以下)の単一あるいは混合ガスをガラスパイプの内部に導入し、ガラスパイプ内の絶対圧を97kPa以下に減圧しながら、表面温度を2000℃以上2300℃以下として、ガラスパイプ中実化する。この中実化により、ガラスロッドからなるコア部(外径20mm以上30mm以下)を得る。このガラスロッドの外側にOVD(Outside Vapor Deposition)法またはコラプス法といった公知の方法でアルカリ金属元素群を含まないコア層を付与してもよい。
延伸研削工程(ステップS6)では、コア部を延伸して直径15mm以上25mm以下とし、更にコア部の外周部を研削して直径15mm以上25mm以下とする。この部分が光ファイバ1のコア10となる。ただし、延伸直後の直径の方が研削後の直径よりも大きいこととする。
ロッドインコラプス工程(ステップS7)では、コア部をロッドとして用いると共に、フッ素が添加されたシリカ系ガラスパイプをパイプとして用い、ロッドインコラプスを行う。このロッドインコラプス法によれば、コア部と、フッ素が添加されたシリカ系ガラスパイプとは、外部熱源により加熱されて一体化される。これによりコア部の周りに第1クラッド部が付加される。コア部と第1クラッド部との相対比屈折率差は最大で0.34%程度である。このロッドインコラプス法による第1クラッド部の付加の結果、コア部及びその近傍の第1クラッド部の水分量を十分に低く抑制することが可能である。
OVD工程(ステップS8)では、コア部及び第1クラッド部が一体化されてなるロッドを延伸して所定径とした後、そのロッドの外側にフッ素を含む第2クラッド部をOVD法により合成する。これにより、光ファイバ母材が製造される。
線引工程(ステップS9)では、光ファイバ母材を線引することにより光ファイバ1を製造する。線引き速度は600m/min以上2300m/min以下である。線引き張力は、例えば0.5Nである。
表1は、製造し評価した光ファイバそれぞれの諸元を纏めた表である。表1には、光ファイバのそれぞれについて、波長1550nmにおける伝送損失(α1.55)、コア径、カットオフ波長(λcc)、波長1550nmにおける実効断面積(Aeff)、カリウムのコア全体の平均濃度(コア平均K濃度CA)、塩素のコア全体の平均濃度(コア平均Cl濃度CC)、フッ素のコア全体の平均濃度(コア平均F濃度CF)、コア平均Cl濃度/コア平均K濃度(CC/CA)、及び、コア平均F濃度/コア平均K濃度(CF/CA)が示されている。濃度はすべて「質量分率」である。

ファイバ1から13は、コア平均Cl濃度を質量分率20ppmから40000ppmまで変化させて製造した光ファイバ群である。コア平均Cl濃度は、準備工程で準備したガラスパイプの元となるシリカ系ガラスの円柱体の塩素濃度により変化させた。ファイバ1から13では、コア平均K濃度は、質量分率40ppmから43ppmの間に保たれている。コア平均F濃度は、概ね質量分率2000ppmに保たれている。
図3では、ファイバ1から13のそれぞれについて、コア平均Cl濃度/コア平均K濃度と波長1550nmにおける伝送損失とがプロットされている。図4は、図3の横軸をLogスケールにしたグラフである。図3及び図4に示されるように、コア平均Cl濃度/コア平均K濃度が1.0より小さい場合に伝送損失が大きくなる。これは塩素の添加濃度に対し、相対的にカリウムの添加濃度が高く、線引時に生じたガラス欠陥の量に対して結合する塩素が不足するためと考えられる。一方、コア平均Cl濃度/コア平均K濃度が500より大きくなる場合にも伝送損失が大きくなる。この場合、ガラス欠陥に対して塩素が十分に結合しているものの、塩素の添加濃度が高く、濃度揺らぎ起因の伝送損失増が生じたと考えられる。
ファイバ14から24は、コア平均K濃度を質量分率1ppmから2500ppmまで変化させて製造した光ファイバ群である。コア平均K濃度は、添加工程におけるカリウムの添加量により変化させた。ファイバ14から24では、コア平均Cl濃度は、概ね質量分率2000ppmに保たれている。コア平均F濃度は、概ね質量分率2000ppmに保たれている。
図5では、ファイバ14から24のそれぞれについて、コア平均Cl濃度/コア平均K濃度と波長1550nmにおける伝送損失とがプロットされている。図6は、図5の横軸をLogスケールにしたグラフである。図3及び図4と同様に図5及び図6においても、コア平均Cl濃度/コア平均K濃度が1.0より小さい場合に伝送損失が大きくなっている。これは塩素の添加濃度に対し、相対的にカリウムの添加濃度が高く、線引時に生じたガラス欠陥の量に対して結合する塩素が不足するためと考えられる。一方、コア平均Cl濃度/コア平均K濃度が500より大きくなる場合にも伝送損失が大きくなる。この場合、ガラス欠陥に対して塩素が十分に結合しているものの、塩素の添加濃度が高く、濃度揺らぎ起因の伝送損失増が生じたと考えられる。
ファイバ25からファイバ33は、コア平均F濃度を質量分率30ppmから5100ppmまで変化させて製造した光ファイバ群である。コア平均F濃度は、準備工程で準備したガラスパイプの元となるシリカ系ガラスの円柱体のフッ素濃度により変化させた。ファイバ25から33では、コア平均K濃度は、質量分率41ppmから43ppmの間に保たれている。コア平均Cl濃度は、概ね質量分率2000ppmに保たれている。
図7では、ファイバ25から33のそれぞれについて、コア平均F濃度/コア平均K濃度と波長1550nmにおける伝送損失とがプロットされている。図7に示されるように、コア平均F濃度/コア平均K濃度が100以下の場合、伝送損失が安定して低い。これは、フッ素の添加により生じる伝送損失低減効果と伝送損失増加効果とが概ね同等であるからと考えられる。伝送損失低減効果は、フッ素の添加により粘性が低下し、それによりレイリ散乱が低下するために生じる。伝送損失増加効果は、フッ素の添加により濃度揺らぎが増加するために生じる。一方、コア平均F濃度/コア平均K濃度が100より大きくなる場合、伝送損失が大きくなる。これは、フッ素の添加により生じる伝送損失低減効果よりも、伝送損失増加効果が大きくなったためと考えられる。
表2は、コアにおけるカリウム濃度と塩素濃度との比であるCl濃度/K濃度の半径方向のプロファイルと伝送損失との関係について調査した結果を示す表である。表2では、Cl濃度/K濃度のプロファイルが、光ファイバの中心軸からコア半径の1/2より小さい範囲、及び、コア半径の1/2より大きい範囲のそれぞれにおいて、増加傾向か否かが示されている。ここで、半径とCl濃度/K濃度とで最小二乗法による傾きを取得し、その傾きが正の場合に増加傾向であるとする。ゼロまたは負の場合を増加傾向ではないとする。

ファイバA1からA4は、コアにおけるCl濃度/K濃度のプロファイルを変化させて製造した光ファイバ群である。塩素濃度はコア全体で概ね一定であるため、コアにおけるCl濃度/K濃度のプロファイルは、カリウムの濃度プロファイルにより変化させることができる。ファイバA1からA4は、実効断面積を110μm2以上115μm2以下の範囲、カットオフ波長を1500nm以上1525nm以下の範囲、コア平均K濃度を38ppm以上43ppm以下の範囲、コア平均Cl濃度を1000ppm以上1500ppm以下の範囲、コア平均F濃度を1800ppm以上2200ppm以下の範囲として製造された。
コア半径の1/2より小さい範囲におけるCl濃度/K濃度のプロファイルが増加傾向であれば、コア半径の1/2よりも大きい範囲におけるCl濃度/K濃度のプロファイルがどのような傾向を示すかによらず、伝送損失は良好であった。これは、伝送される光のパワーが高いコア中心部において、Cl濃度/K濃度を単調増加させることにより、コア内における屈折率などの不整合による散乱損失が低減されるためと考えられる。
表3は、光ファイバの中心軸から1μmの範囲内のCl濃度/K濃度の最大値に着目して調査した結果を示す表である。

ファイバB1からB4は、コアにおけるCl濃度/K濃度のプロファイルが、光ファイバの中心軸からコア半径の1/2より小さい範囲、及び、コア半径の1/2より大きい範囲のそれぞれにおいて、増加傾向となるように製造された光ファイバ群である。ファイバB1からB4は、実効断面積を110μm2以上115μm2以下の範囲、カットオフ波長を1500nm以上1525nm以下の範囲、コア平均K濃度を38ppm以上43ppm以下の範囲として製造された。
光ファイバの中心軸から1μmの範囲内のCl濃度/K濃度の最大値が1.0以上の場合に、伝送損失が高くなる。この理由について、同じK濃度に対して塩素濃度が高くなることにより、光ファイバ母材にした時に微細な結晶が発生し、それが光ファイバにした時に散乱損失の増加につながるためと推測される。
以上、実施形態について説明してきたが、本開示は必ずしも上述した実施形態及び変形例に限定されるものではなく、その要旨を逸脱しない範囲で様々な変更が可能である。
1…光ファイバ
1a…中心軸
10…コア
20…クラッド
1a…中心軸
10…コア
20…クラッド
Claims (7)
- シリカ系ガラスからなる光ファイバであって、
アルカリ金属元素及びアルカリ土類金属元素からなるアルカリ金属元素群のうち一種類以上の元素、及び、塩素を含むコアと、
前記コアを取り囲み、前記コアの屈折率よりも低い屈折率を有するクラッドと、を備え、
前記アルカリ金属元素群の前記コア全体の平均濃度CA、及び、塩素の前記コア全体の平均濃度CCは、CC/CA>1.0を満たす、
光ファイバ。 - 前記CC/CAは、500よりも小さい、
請求項1に記載の光ファイバ。 - 前記光ファイバの中心軸から前記コアの半径の1/2の位置までにおいて、前記光ファイバの中心軸から半径rの位置での前記アルカリ金属元素群の濃度CA(r)の塩素の濃度CC(r)に対する比CC(r)/CA(r)の値を最小二乗法で近似した直線は、正の傾きを有する、
請求項1または請求項2に記載の光ファイバ。 - 前記CC(r)/CA(r)は、前記光ファイバの中心軸から1μmの範囲内で1未満である、
請求項3に記載の光ファイバ。 - 前記コアは、フッ素を更に含み、
フッ素の前記コア全体の平均濃度CFは、CF/CA≦100を満たす、
請求項1から請求項4のいずれか一項に記載の光ファイバ。 - 前記アルカリ金属元素群の前記コア全体の平均濃度CAは、質量分率0.2ppm以上2000ppm以下である、
請求項1から請求項5のいずれか一項に記載の光ファイバ。 - 前記コアは、前記アルカリ金属元素群としてナトリウム、カリウム、ルビジウム、セシウム、及び、カルシウムのうち一種類以上の元素を含む、
請求項1から請求項6のいずれか一項に記載の光ファイバ。
Applications Claiming Priority (2)
| Application Number | Priority Date | Filing Date | Title |
|---|---|---|---|
| JP2022-021856 | 2022-02-16 | ||
| JP2022021856 | 2022-02-16 |
Publications (1)
| Publication Number | Publication Date |
|---|---|
| WO2023157505A1 true WO2023157505A1 (ja) | 2023-08-24 |
Family
ID=87578060
Family Applications (1)
| Application Number | Title | Priority Date | Filing Date |
|---|---|---|---|
| PCT/JP2023/000220 WO2023157505A1 (ja) | 2022-02-16 | 2023-01-06 | 光ファイバ |
Country Status (1)
| Country | Link |
|---|---|
| WO (1) | WO2023157505A1 (ja) |
Cited By (2)
| Publication number | Priority date | Publication date | Assignee | Title |
|---|---|---|---|---|
| US20230066680A1 (en) * | 2019-01-29 | 2023-03-02 | Sterlite Technologies Limited | Ultra-low loss optical fiber |
| US20230060842A1 (en) * | 2019-01-29 | 2023-03-02 | Sterlite Technologies Limited | Method for drawing an optical fiber using rod-in cylinder technique |
Citations (8)
| Publication number | Priority date | Publication date | Assignee | Title |
|---|---|---|---|---|
| JP2007504080A (ja) * | 2003-08-29 | 2007-03-01 | コーニング インコーポレイテッド | アルカリ金属酸化物を含有する光ファイバおよびその製造方法と装置 |
| JP2009541796A (ja) * | 2006-06-21 | 2009-11-26 | コーニング インコーポレイテッド | アルカリ金属酸化物を含有する光ファイバ |
| JP2012229150A (ja) * | 2011-04-15 | 2012-11-22 | Sumitomo Electric Ind Ltd | 光ファイバおよび光ファイバ母材 |
| JP2015105199A (ja) * | 2013-11-29 | 2015-06-08 | 住友電気工業株式会社 | 光ファイバおよび光ファイバ母材 |
| JP2017076053A (ja) * | 2015-10-15 | 2017-04-20 | 住友電気工業株式会社 | 光ファイバ |
| JP2019191297A (ja) * | 2018-04-20 | 2019-10-31 | 住友電気工業株式会社 | 光ファイバ |
| JP2020012933A (ja) * | 2018-07-17 | 2020-01-23 | 住友電気工業株式会社 | 光ファイバ |
| US20210294029A1 (en) * | 2020-03-18 | 2021-09-23 | Corning Incorporated | Reduced diameter optical fiber with improved microbending |
-
2023
- 2023-01-06 WO PCT/JP2023/000220 patent/WO2023157505A1/ja unknown
Patent Citations (8)
| Publication number | Priority date | Publication date | Assignee | Title |
|---|---|---|---|---|
| JP2007504080A (ja) * | 2003-08-29 | 2007-03-01 | コーニング インコーポレイテッド | アルカリ金属酸化物を含有する光ファイバおよびその製造方法と装置 |
| JP2009541796A (ja) * | 2006-06-21 | 2009-11-26 | コーニング インコーポレイテッド | アルカリ金属酸化物を含有する光ファイバ |
| JP2012229150A (ja) * | 2011-04-15 | 2012-11-22 | Sumitomo Electric Ind Ltd | 光ファイバおよび光ファイバ母材 |
| JP2015105199A (ja) * | 2013-11-29 | 2015-06-08 | 住友電気工業株式会社 | 光ファイバおよび光ファイバ母材 |
| JP2017076053A (ja) * | 2015-10-15 | 2017-04-20 | 住友電気工業株式会社 | 光ファイバ |
| JP2019191297A (ja) * | 2018-04-20 | 2019-10-31 | 住友電気工業株式会社 | 光ファイバ |
| JP2020012933A (ja) * | 2018-07-17 | 2020-01-23 | 住友電気工業株式会社 | 光ファイバ |
| US20210294029A1 (en) * | 2020-03-18 | 2021-09-23 | Corning Incorporated | Reduced diameter optical fiber with improved microbending |
Cited By (2)
| Publication number | Priority date | Publication date | Assignee | Title |
|---|---|---|---|---|
| US20230066680A1 (en) * | 2019-01-29 | 2023-03-02 | Sterlite Technologies Limited | Ultra-low loss optical fiber |
| US20230060842A1 (en) * | 2019-01-29 | 2023-03-02 | Sterlite Technologies Limited | Method for drawing an optical fiber using rod-in cylinder technique |
Similar Documents
| Publication | Publication Date | Title |
|---|---|---|
| WO2023157505A1 (ja) | 光ファイバ | |
| JP6187644B2 (ja) | 光ファイバ | |
| US11048040B2 (en) | Optical fiber | |
| US20190154911A1 (en) | Low loss optical fiber with core codoped with two or more halogens | |
| US10031282B2 (en) | Optical fiber | |
| US20150370008A1 (en) | Optical-fiber preform and method for manufacturing optical-fiber preform | |
| GB2449164A (en) | A method of forming optical fibres | |
| US20200241198A1 (en) | Optical fiber | |
| US10723650B2 (en) | Optical fiber preform | |
| US20160318793A1 (en) | Optical fiber preform | |
| US11181684B2 (en) | Optical fiber | |
| WO2015079987A1 (ja) | 光ファイバ及び光ファイバ母材 | |
| JP2014214079A (ja) | 光ファイバ母材 | |
| CN112955792B (zh) | 光纤 | |
| WO2023286608A1 (ja) | 光ファイバ及び光ファイバ母材 | |
| WO2021085236A1 (ja) | 光ファイバ | |
| WO2024048356A1 (ja) | 光ファイバ母材の製造方法及び光ファイバ母材 | |
| WO2022004415A1 (ja) | 光ファイバ母材の製造方法及び光ファイバ母材 | |
| US20230322605A1 (en) | Production method for optical fiber base material, and optical fiber base material | |
| WO2023112968A1 (ja) | 光ファイバ |
Legal Events
| Date | Code | Title | Description |
|---|---|---|---|
| 121 | Ep: the epo has been informed by wipo that ep was designated in this application |
Ref document number: 23756033 Country of ref document: EP Kind code of ref document: A1 |