WO2023100671A1 - リアクション検知システムおよびリアクション検知結果表示方法 - Google Patents
リアクション検知システムおよびリアクション検知結果表示方法 Download PDFInfo
- Publication number
- WO2023100671A1 WO2023100671A1 PCT/JP2022/042720 JP2022042720W WO2023100671A1 WO 2023100671 A1 WO2023100671 A1 WO 2023100671A1 JP 2022042720 W JP2022042720 W JP 2022042720W WO 2023100671 A1 WO2023100671 A1 WO 2023100671A1
- Authority
- WO
- WIPO (PCT)
- Prior art keywords
- reaction
- participant
- information
- participants
- presentation
- Prior art date
- Legal status (The legal status is an assumption and is not a legal conclusion. Google has not performed a legal analysis and makes no representation as to the accuracy of the status listed.)
- Ceased
Links
Images





Classifications
-
- G—PHYSICS
- G06—COMPUTING OR CALCULATING; COUNTING
- G06V—IMAGE OR VIDEO RECOGNITION OR UNDERSTANDING
- G06V40/00—Recognition of biometric, human-related or animal-related patterns in image or video data
- G06V40/10—Human or animal bodies, e.g. vehicle occupants or pedestrians; Body parts, e.g. hands
- G06V40/16—Human faces, e.g. facial parts, sketches or expressions
- G06V40/174—Facial expression recognition
-
- G—PHYSICS
- G06—COMPUTING OR CALCULATING; COUNTING
- G06Q—INFORMATION AND COMMUNICATION TECHNOLOGY [ICT] SPECIALLY ADAPTED FOR ADMINISTRATIVE, COMMERCIAL, FINANCIAL, MANAGERIAL OR SUPERVISORY PURPOSES; SYSTEMS OR METHODS SPECIALLY ADAPTED FOR ADMINISTRATIVE, COMMERCIAL, FINANCIAL, MANAGERIAL OR SUPERVISORY PURPOSES, NOT OTHERWISE PROVIDED FOR
- G06Q10/00—Administration; Management
- G06Q10/10—Office automation; Time management
-
- G—PHYSICS
- G06—COMPUTING OR CALCULATING; COUNTING
- G06T—IMAGE DATA PROCESSING OR GENERATION, IN GENERAL
- G06T11/00—Two-dimensional [2D] image generation
- G06T11/20—Drawing from basic elements
- G06T11/26—Drawing of charts or graphs
-
- H—ELECTRICITY
- H04—ELECTRIC COMMUNICATION TECHNIQUE
- H04N—PICTORIAL COMMUNICATION, e.g. TELEVISION
- H04N21/00—Selective content distribution, e.g. interactive television or video on demand [VOD]
- H04N21/20—Servers specifically adapted for the distribution of content, e.g. VOD servers; Operations thereof
- H04N21/25—Management operations performed by the server for facilitating the content distribution or administrating data related to end-users or client devices, e.g. end-user or client device authentication, learning user preferences for recommending movies
- H04N21/258—Client or end-user data management, e.g. managing client capabilities, user preferences or demographics, processing of multiple end-users preferences to derive collaborative data
Definitions
- the present disclosure relates to a reaction detection system and a reaction detection result display method that detect reactions shown by participants in an online event and visualize and present the detection results.
- Patent Document 1 a technology for detecting the nodding motion of a participant by image recognition of a camera image of a participant and displaying information on the number and frequency of nodding motions for each participant on a terminal.
- Patent Document 1 since the participant performs the input operation himself/herself, it is not always possible to obtain the information of the reaction actually shown by the participant.
- the reaction action (nodding action) shown by the participant is detected by image recognition of the camera image, so information on the reaction actually shown by the participant can be obtained.
- the reaction status of the participants is displayed in a state where the individual is identified, the participants can be aware that reactions are being detected during the online event.
- the information of the reaction that is naturally shown by is not obtained.
- a main object of the present invention is to provide a reaction detection system and a reaction detection result display method that enable a user to grasp the situation of reactions naturally shown by participants.
- a reaction detection system of the present disclosure is a reaction detection system that detects reactions shown by participants of an online event, visualizes and presents the detection results, and includes a terminal device having a camera that captures each participant, A server that acquires a camera image of each participant from the terminal device, detects the reaction shown by each participant based on the camera image of each participant, and generates display information that visualizes the detection result. and a device, wherein the server device aggregates reaction detection results for each participant, generates reaction information for all participants, and generates the display information by visualizing the reaction information. .
- the reaction detection result display method of the present disclosure is a reaction detection result display method in which an information processing device performs a process of detecting a reaction shown by a participant of an online event and visualizing and presenting the detection result, Acquire camera images of each participant from a terminal device having a camera that captures each participant, detect the reaction shown by each participant based on the camera image of each participant, and react to each participant
- the detection results are aggregated to generate reaction information for all participants, and display information is generated by visualizing the reaction information.
- display information that visualizes reaction information for all participants of an online event is presented to users such as participants. This allows participants to be unaware that reactions are being detected by not identifying individuals when presenting the status of reactions shown by participants in online events to users. The user can grasp the situation of reactions that are naturally shown.
- a first invention made to solve the above-mentioned problems is a reaction detection system that detects reactions shown by participants in an online event and visualizes and presents the detection results, wherein each participant is photographed.
- a terminal device having a camera and a camera image of each participant taken from the terminal device, detect the reaction shown by each participant based on the camera image of each participant, and visualize the detection result and a server device for generating display information according to the above, wherein the server device aggregates reaction detection results for each participant, generates reaction information for all participants, and visualizes the reaction information. It is configured to generate information.
- display information that visualizes the reaction information of all participants in the online event is presented to users such as participants. This allows participants to be unaware that reactions are being detected by not identifying individuals when presenting the status of reactions shown by participants in online events to users. The user can grasp the situation of reactions that are naturally shown.
- the server device In a second invention, the server device generates the display information based on the real-time reaction detection result of each participant.
- users such as participants can experience the atmosphere of the event as if they were there.
- the server device generates, as the reaction information, level information representing the degree of positive or negative reaction for all participants.
- the server device is configured to generate, as the reaction information, ratio information representing a ratio for each reaction type for all participants.
- the server device after the online event ends, the server device generates, as the display information, a graph representing changes in reactions in each stage of the online event.
- the online event is a presentation
- the server device determines whether the reaction indicated by the target participant is concentration, fatigue, satisfaction, dissatisfaction, or doubt as the reaction detection result. .
- the reactions shown by the participants of the online event can be appropriately categorized.
- a seventh aspect of the present invention is a reaction detection result display method for detecting a reaction shown by a participant of an online event and performing a process of visualizing and presenting the detection result by an information processing device, wherein each participant is Acquire camera images of each participant from a terminal device that has a camera that takes pictures, detect reactions shown by each participant based on the camera images of each participant, and aggregate reaction detection results for each participant. Then, reaction information for all participants is generated, and display information is generated by visualizing the reaction information.
- the participants are aware that the reaction is being detected by not specifying the individual when presenting the reaction status of the participant of the online event to the user. Since the user does not have to do so, the user can grasp the situation of the reaction naturally shown by the participant.
- FIG. 1 is an overall configuration diagram of the reaction detection system according to this embodiment.
- This system detects the reactions of participants in an online conference (online event), visualizes the detection results, and presents them to participants and organizers.
- This system includes an analysis server 1 (server device, information processing device) and user terminals 2 (terminal devices) operated by the organizer and participants.
- the analysis server 1 is connected to user terminals 2 via a network.
- the analysis server 1 acquires a camera image of the participant from the participant's user terminal 2, performs image analysis processing on the camera image, detects the reaction shown by the participant, and detects the reaction. Generate display information that visualizes the results. This display information is transmitted to the user terminal 2 and displayed on the screen.
- the user terminal 2 is equipped with a camera 5 that captures images of the participants, and a display 6 that displays the screen distributed from the analysis server 1.
- the participant's user terminal 2 transmits a camera image of the participant captured by the camera 5 to the analysis server 1 .
- the user terminal 2 of the host (presenter) also transmits a camera image of the host captured by the camera 5 to the analysis server 1 as necessary.
- the user terminal 2 receives the display information that visualizes the reaction detection result from the analysis server 1 and displays it on the screen.
- the target online event is a conference, particularly a presentation, but the target online event is not limited to a conference, and may be, for example, a lecture, a workshop, an online class, or the like. .
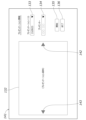
- 2 and 3 are explanatory diagrams showing presentation screens 101 and 111 displayed on the user terminals 2 of the participants.
- Presentation screens 101 and 111 are displayed on the user terminals 2 of the participants during the online conference (presentation).
- a document display section 102 is provided on the presentation screens 101 and 111 .
- Presentation materials are displayed on the document display section 102 .
- the presentation materials are uploaded in advance from the user terminal 2 of the host (presenter) to the analysis server 1 and distributed to the user terminals 2 of each participant.
- the presentation material is displayed on the organizer's user terminal 2 and each participant's user terminal 2, and the presentation material is shared between the organizer and each participant.
- the analysis server 1 may cooperate with an online conference management server (not shown) and an online conference application installed in the user terminal 2 to deliver the presentation screens 101 and 111 to the user. .
- the presentation screens 101 and 111 are provided with a level button 103 and a ratio button 104 .
- the presentation screen 101 (see FIG. 2) in the level display mode is displayed.
- the ratio button 104 the presentation screen 111 (see FIG. 3) in the ratio display mode is displayed.
- an analysis result display section 105 is provided on the presentation screens 101 and 111.
- the analysis result display section 105 displays the reactions of all the participants in real time.
- the display contents of the analysis result display section 105 differ according to the display mode (level display mode and ratio display mode).
- the display contents of the analysis result display unit 105 are updated as the real-time reaction detection processing and reaction analysis processing are executed at predetermined intervals (eg, 1 second, 3 seconds, 5 seconds, etc.).
- predetermined intervals eg, 1 second, 3 seconds, 5 seconds, etc.
- an image 106 representing the reaction level (level information) representing the degree of positive reaction for all participants is displayed in the analysis result display section 105.
- Reaction level is the percentage of participants showing positive reactions.
- a plurality of bars are drawn side by side, and the bar is illuminated according to the height of the reaction level.
- the bar may be displayed in color, for example gray, blue, green, yellow, and red in descending order of level.
- Participants can grasp how many participants are showing positive reactions by the reaction level.
- the reaction level is high, many participants show positive reactions, that is, the participants can understand that the online conference is lively.
- the reaction level is low, the participants can understand that there are few participants showing positive reactions, that is, the online conference is not lively. In this case, the participants should try to activate the online conference by asking questions.
- the analysis result display section 105 displays an image 112 representing the reaction ratio (ratio information) representing the ratio of each reaction type for all participants.
- the ratio for each reaction type is represented by a 100% stacked bar graph.
- Reaction types include concentration, tiredness, satisfaction, dissatisfaction, and question, and the ratio of each reaction type is drawn in a different color.
- Participants can understand what kind of reaction many participants show from the reaction ratio. Here, for example, if there are many participants who show reactions of concentration or fatigue, it is preferable that the participants ask questions or chat to revitalize the online conference.
- the presentation screens 101 and 111 are displayed on the user terminals 2 of the participants, but similar screens may be displayed on the user terminals 2 of the host (presenter).
- the organizer can grasp how many participants show a positive reaction from the reaction level, and can grasp what kind of state many participants are in from the reaction ratio.
- the host (presenter) should try to revitalize the online conference by changing the development of the online conference, asking questions and chatting.
- the reaction level representing the ratio of participants who gave a positive reaction to all the participants is displayed on the presentation screen 101 (see FIG. 2) in the level display mode.
- a positive reaction is a case where the reaction type is concentration and consent.
- the reaction level may represent the percentage of participants showing a negative reaction to all participants. Negative reactions are those where the reaction types are fatigue, frustration and question.
- the reaction level for each reaction type (concentration, fatigue, satisfaction, dissatisfaction, and doubt) specified by the user (participant or organizer) from a reaction level setting screen (not shown) may be displayed. .
- the reaction ratio is represented by the ratio for each reaction type (concentration, fatigue, satisfaction, dissatisfaction, and doubt) on the presentation screen 111 (see FIG. 3) in the ratio display mode.
- the reaction ratio may be expressed as a ratio for each of positive, negative, and neutral, with a neutral reaction being a reaction that does not correspond to either a positive reaction or a negative reaction.
- FIG. 4 is an explanatory diagram showing the post-analysis result screen 121. As shown in FIG. Note that the post-analysis result screen 121 may be displayed on the user terminal 2 of the participant.
- the post-analysis result screen 121 is displayed on the organizer's user terminal 2 .
- a post-analysis result screen 121 displays a bar graph 122 and a line graph 123 representing the results of post-reaction analysis processing.
- a bar graph 122 and a line graph 123 represent changes in participants' reactions at each stage of the online conference. Specifically, the period during which each page of the presentation material is explained corresponds to each stage of an online conference (presentation).
- a bar graph 122 and a line graph 123 express whether or not the reaction was shown.
- the bar graph 122 shows the ratio of each reaction type for all participants on the page. Represented by a 100% stacked bar graph in units.
- the line graph 123 is the same as the reaction level image 106 displayed in the analysis result display section 105 of the presentation screen 101 (see FIG. 2) in the level display mode.
- the reaction level which represents the percentage of This allows the user (presenter, etc.) to grasp how many participants showed positive reactions when the presenter explained each page of the presentation material. Further, the line graph 123 may represent the ratio of participants who show negative reactions to all participants.
- the user can grasp the reaction status of the participants for each page after the fact, which cannot be grasped by the questionnaire conducted for the participants. It is.
- a user can specify a page where the reaction of the participant is not favorable, and can confirm the problems of description and explanation of the page.
- presentation screens 131 and 141 displayed on the user terminal 2 of the presenter will be described.
- 5 and 6 are explanatory diagrams showing presentation screens 131 and 141 displayed on the user terminal 2 of the presenter (sponsor).
- the presentation screen 131 (initial screen) shown in FIG. 5 is displayed when starting the presentation.
- a document display section 132 is provided on the presentation screen 131 shown in FIG.
- the document display section 132 displays presentation materials set to be shared with the participants.
- the presentation screen 131 is provided with a presentation ID input section 133 and a presenter name input section 134 .
- presentation ID input section 133 the presenter can input a presentation ID by entering characters or selecting from a pull-down menu.
- presenter name input section 134 the presenter can input his/her name by entering characters or selecting from a pull-down menu.
- the presentation ID may be automatically assigned when the presentation material is registered in the analysis server 1, and notified to the presenter in advance.
- the presentation screen 131 is provided with a start button 135 and an end button 136 .
- the presenter operates the start button 135 when starting the presentation.
- the presenter operates the end button 136 when the presentation ends.
- the analysis server 1 can acquire the implementation period (start time and end time) of the presentation.
- the presenter operates the start button 135 on the presentation screen 131 (see FIG. 5), the presentation screen 141 shown in FIG. 6 is displayed.
- a page forward button 142 and a page backward button 143 are displayed in the document display section 132.
- the presenter operates the page forward button 142
- the presentation material displayed on the document display section 132 transitions to the next page.
- the presenter operates the page return button 143
- the presentation material displayed on the document display section 132 returns to the previous page.
- the analysis server 1 can acquire the page display period (start time and end time) by acquiring the time when the page forward button 142 and the page return button 143 are operated.
- FIG. 7 is a block diagram showing a schematic configuration of the analysis server 1.
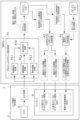
- FIG. 8 is a block diagram showing an overview of the processing performed by the analysis server 1. As shown in FIG.
- the analysis server 1 includes a communication unit 11, a storage unit 12, and a processor 13.
- the communication unit 11 communicates with the user terminal 2 of the organizer and the user terminals 2 of the participants via the network.
- the storage unit 12 stores programs and the like executed by the processor 13 . Further, the storage unit 12 stores registration information of the document DB and registration information of the reaction DB (see FIG. 9).
- the processor 13 performs various processes by executing programs stored in the storage unit 12 .
- the processor 13 performs a real-time reaction detection process P1, a real-time reaction analysis process P2, a post-reaction analysis process P3, an information management process P4, and the like.
- the processor 13 acquires the camera image of each participant from the user terminal 2, and detects the reaction shown by each participant in real time based on the camera image of each participant. .
- facial expression detection process P11, line-of-sight detection process P12, action recognition process P13, and integrated judgment process P14 are performed.
- the processor 13 detects facial expressions of the participants based on the camera image.
- the processor 13 detects the line-of-sight of the participant based on the camera image.
- action recognition processing P13 the processor 13 recognizes the action of the participant based on the camera image.
- the processor 13 determines the target participant as a reaction detection result based on the detection result of the facial expression detection process P11, the detection result of the gaze detection process P12, and the recognition result of the action recognition process P13. It is determined whether the reaction is concentrated, tired, convinced, dissatisfied, or doubtful.
- a reaction type such as dissatisfaction is determined.
- the degree of concentration of the participant is estimated from the movement of the participant's line of sight detected in the line-of-sight detection process P12. Further, when the line of sight of the participant detected in the line of sight detection process P12 is in the direction of the display screen of the user terminal 2, it is estimated that the participant is gazing at the display screen. On the other hand, when the line of sight of the participant is not in the direction of the display screen, it is estimated that the participant is looking away. Based on these estimation results, reaction types such as concentration and fatigue are determined.
- the fatigue reaction type is determined from the body movements and postures of the participants detected in the action recognition process P13. Also, the acceptable reaction type is determined from the nodding motion of the participant detected in the motion recognition process P13. Further, the questionable reaction type is determined from the motion of tilting the head of the participant detected in the motion recognition process P13.
- reaction indicated by the target participant is of concentration, fatigue, satisfaction, dissatisfaction, or question as the reaction detection result.
- a type may be set. For example, when it is difficult to set one of the five reaction types, a non-responsive reaction type may be set.
- the processor 13 acquires the latest reaction detection result (reaction type) for each participant acquired in the reaction detection process P1, and aggregates the latest reaction detection results for each participant. Then, reaction information is generated for all participants, and display information is generated by visualizing the reaction information.
- the processor 13 generates level information (reaction level) regarding the proportion of participants who showed a positive reaction to all participants, and generates display information that visualizes the level information.
- the level information indicates the ratio of the number of participants who fall under the positive reaction type to the total number of participants as a percentage.
- the display information is an image 106 representing the reaction level displayed in the analysis result display section 105 of the presentation screen 101 (see FIG. 2) in the level display mode.
- the processor 13 generates ratio information regarding the ratio of participants for each reaction type, and generates display information that visualizes the ratio information.
- the ratio information indicates the ratio of the number of participants for each reaction type as a percentage, with the total number of participants being 100%.
- the display information is an image 112 representing the reaction ratio displayed in the analysis result display section 105 of the presentation screen 111 (see FIG. 3) in the ratio display mode.
- the processor 13 selects the time of each participant related to the target online conference (presentation) from among the information acquired in the reaction detection process P1 and registered in the reaction DB. Acquire the reaction detection results, aggregate the reaction detection results of each participant at each time, generate reaction information for each stage of the online conference, and visualize the reaction information for each stage Generate information.
- the target online conference (online event) is a presentation
- the period during which the presenter explains each page of the presentation material that is, the display period of each page (the time from the start time to the end time) ) corresponds to each stage of the online conference.
- the display period of each page is obtained from the document DB.
- a graph is generated that shows how reactions change for each page.
- the processor 13 generates level information for each display period of the page, specifically, information on the percentage of participants who showed a positive reaction to all participants, and generates the information for each display period of the page. Generates display information that visualizes the level information of The display information is a line graph 123 displayed on the post-analysis result screen 121 (see FIG. 4) on the user terminal 2 of the participant.
- the processor 13 generates ratio information for each display period of the page, specifically, information on the ratio of participants for each reaction type, and displays display information that visualizes the ratio information for each display period of the page. Generate.
- the display information is a bar graph 122 displayed on the post-analysis result screen 121 (see FIG. 4) on the user terminal 2 of the participant.
- reaction information level information and ratio information
- the processor 13 manages a document DB in which information related to documents (presentation materials) used in the online conference is registered. Also, in the information management process, the processor 13 manages a reaction DB in which information about reactions given by participants in the online conference (presentation) is registered.
- the registration information of the document DB and the registration information of the reaction DB are stored in the storage unit 12 .
- facial expression detection processing, line-of-sight detection processing, and action recognition processing may be performed using a machine learning model (image recognition engine) constructed by machine learning such as deep learning.
- the result integration process may be performed using a machine learning model constructed by machine learning such as deep learning.
- FIG. 9 is an explanatory diagram showing registered information in the document DB and registered information in the reaction DB.
- the documents shared between the presenter (sponsor) and the participants in the online conference (presentation), specifically, the information on the presentation materials are managed by the document DB.
- the document DB registers the document ID (presentation ID) of the presentation material, the total number of pages of the presentation material, the name of the presenter, and the like.
- document ID presentation ID
- page numbers, page display periods (start time and end time), etc. are registered as information on each page of the presentation material.
- reaction DB information about reactions indicated by participants in the online conference is managed by a reaction DB.
- the document ID (presentation ID), page number, etc. are registered in the reaction DB as information related to the target online conference (presentation).
- the reaction DB the reception ID of the target participant, the time when the reaction detection process was executed, the reaction detection result (reaction type), etc. are registered as information on the reaction detection process.
- FIG. 10 is a flowchart showing the procedure of real-time reaction detection processing.
- the analysis server 1 executes real-time reaction detection processing. At this time, while the online conference (presentation) is being held, reaction detection processing is repeatedly executed at each time for all participants of the online conference.
- the analysis server 1 repeatedly executes the processes (ST101 to ST110) related to the first reaction detection loop.
- the processing related to the first reaction detection loop is periodically repeated until the target period, specifically, the current online conference (presentation) ends.
- the analysis server 1 repeatedly executes the processing (ST102 to ST109) related to the second reaction detection loop. Processing related to the second reaction detection loop is performed for all participants in the online conference, and is repeated until processing for all participants in the online conference is completed.
- the analysis server 1 first acquires a camera image from the target participant's user terminal 2 (ST103).
- the user terminal 2 may detect the head of the participant from the camera image, extract a partial image corresponding to the face image, and the analysis server 1 may acquire this.
- the analysis server 1 since the amount of data of the obtained image can be reduced, the load on the network can be suppressed, and subsequent processing can be performed efficiently.
- the analysis server 1 detects the facial expression of the target participant based on the camera image (facial expression detection processing) (ST104).
- the analysis server 1 detects the line of sight of the target participant based on the camera image (line of sight detection processing) (ST105).
- the analysis server 1 recognizes the motion of the target participant based on the camera image (motion recognition processing) (ST106).
- the analysis server 1 based on the detection result of the facial expression detection process, the detection result of the line-of-sight detection process, and the recognition result of the action recognition process, determines the reaction type (concentration, fatigue, etc.) of the target participant as the reaction detection result. , satisfaction, dissatisfaction, or question) (integrated determination processing) (ST107).
- the analysis server 1 stores the target participant's reaction detection result (reaction type) together with the current time in the storage unit 12 (ST108).
- each participant's reaction detection result at each time during the target period are accumulated in the storage unit 12 .
- FIG. 11 is a flowchart showing the procedure of real-time reaction analysis processing.
- the analysis server 1 When the analysis server 1 receives a request for real-time reaction analysis results from the participant's user terminal 2 (ST201), it starts processing related to the reaction analysis loop (ST202 to ST210). The reaction analysis loop is repeated at a predetermined cycle until the request from the user terminal 2 ends.
- the analysis server 1 first acquires the latest reaction detection result (reaction type) of each participant (ST203). Next, it is determined whether the information requested by the user terminal 2 is level information or ratio information (ST204).
- the analysis server 1 aggregates the latest reaction detection results (reaction types) of each participant. Then, the latest level information, specifically, information on the ratio of participants who showed positive reactions to all participants is generated (ST205). Next, the analysis server 1 generates display information that visualizes the latest level information (ST206).
- ratio information in ST204
- the analysis server 1 aggregates the latest reaction detection results (reaction types) of each participant.
- the latest ratio information specifically, information on the ratio of participants for each reaction type is generated (ST207).
- analysis server 1 generates display information that visualizes the latest ratio information (ST208).
- the analysis server 1 transmits to the user terminal 2 the information requested by the user terminal 2, that is, the display information in which the latest level information or ratio information is visualized (ST209).
- the image 106 representing the reaction level is displayed in the analysis result display section 105 of the presentation screen 101 (see FIG. 2), or the analysis result display section 105 of the presentation screen 111 (see FIG. 3)
- An image 112 representing the reaction ratio is displayed.
- FIG. 12 is a flowchart showing the procedure of post-reaction analysis processing.
- reaction server 1 When the analysis server 1 receives a post reaction analysis result request from the participant's user terminal 2 (ST301), the reaction detection result of each participant related to the target presentation (online conference) at each time is sent. , reaction DB (see FIG. 9B) (ST302).
- the analysis server 1 aggregates reaction detection results of each participant at each time, and level information (reaction information) for each page display period (from the start time to the end time), specifically, Information about the ratio of participants who showed a positive reaction to all the participants is generated (ST303).
- the analysis server 1 aggregates reaction detection results of each participant at each time, and provides ratio information (reaction information) for each page display period. Information on the ratio of participants for each dissatisfaction and question) is generated (ST304).
- the analysis server 1 generates display information that visualizes the level information for each display period of the page and display information that visualizes the ratio information for each display period of the page (ST305).
- the analysis server 1 transmits display information regarding the level information and the ratio information to the user terminal 2 (ST306).
- the user terminal 2 displays the bar graph 122 and the line graph 123 on the post-analysis result screen 121 (see FIG. 4).
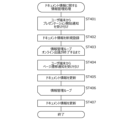
- FIG. 13 is a flow chart showing the procedure of information management processing regarding the document DB.
- the analysis server 1 manages a document DB (see FIG. 9A) in which information related to documents used in online meetings, specifically presentation materials, is registered (information management processing).
- the presenter On the user terminal 2 of the presenter (sponsor), the presenter performs an operation of inputting the document ID (presentation ID) and the name of the presenter on the presentation screens 131 and 141 (see FIGS. 5 and 6), and performs the presentation.
- a start operation is performed, a page transition operation is performed, and a presentation end operation is performed.
- information management processing is performed based on the notification transmitted from the user terminal 2 according to the presenter's operation.
- the analysis server 1 when the analysis server 1 first receives a presentation start notification from the user terminal 2 (ST401), it sets the time at that time as the start time of the first page of the presentation material, and sets the time at that time as the start time of the first page of the presentation material.
- a new document related to is registered in the document DB (ST402).
- the analysis server 1 starts processing related to the information management loop (ST403-ST406).
- the processing related to the information management loop is periodically repeated until the current online conference (presentation) ends.
- the analysis server 1 when the analysis server 1 receives a page transition notification from the user terminal 2 (ST404), the time at that time is set as the end time of the transition source page and the start time of the transition destination page. to update the registered information in the document DB regarding this presentation (ST405).
- the processing related to the information management loop is repeated until the current presentation ends, specifically until the presentation end notification from the user terminal 2 is received.
- the analysis server 1 sets the end time of the last page to the time when the presentation end notification is received from the user terminal 2, and updates the registered information in the document DB regarding the current presentation (ST407). .
- the analysis server 1 acquires a camera image of the participant from the user terminal 2 of the participant, performs image analysis processing on the camera image, and detects the reaction indicated by the participant. shall be detected.
- a camera image taken of a participant is subjected to image analysis processing on the camera image at the participant's user terminal 2, and the reaction detection result indicated by the participant is transmitted to the server device and stored in the reaction DB. You may make it accumulate
- the embodiment has been described as an example of the technology disclosed in this application.
- the technology in the present disclosure is not limited to this, and can also be applied to embodiments with modifications, replacements, additions, omissions, and the like. Further, it is also possible to combine the constituent elements described in the above embodiments to create new embodiments.
- the reaction detection system and the reaction detection result display method according to the present disclosure do not identify the individual when presenting the reaction status indicated by the participants of the online event to the user, so that it is possible to confirm that the reaction is being detected. It has the effect of allowing users to grasp the situation of reactions that participants naturally show without being conscious of it, detects reactions shown by participants of online events, and visualizes the detection results. It is useful as a reaction detection system and a reaction detection result display method, etc.
Landscapes
- Engineering & Computer Science (AREA)
- Physics & Mathematics (AREA)
- General Physics & Mathematics (AREA)
- Theoretical Computer Science (AREA)
- Multimedia (AREA)
- Business, Economics & Management (AREA)
- Health & Medical Sciences (AREA)
- General Health & Medical Sciences (AREA)
- Oral & Maxillofacial Surgery (AREA)
- Human Computer Interaction (AREA)
- Human Resources & Organizations (AREA)
- Entrepreneurship & Innovation (AREA)
- Databases & Information Systems (AREA)
- Strategic Management (AREA)
- General Business, Economics & Management (AREA)
- Marketing (AREA)
- Operations Research (AREA)
- Quality & Reliability (AREA)
- Tourism & Hospitality (AREA)
- Economics (AREA)
- Computer Graphics (AREA)
- Data Mining & Analysis (AREA)
- Signal Processing (AREA)
- Two-Way Televisions, Distribution Of Moving Picture Or The Like (AREA)
- Management, Administration, Business Operations System, And Electronic Commerce (AREA)
- User Interface Of Digital Computer (AREA)
- Information Transfer Between Computers (AREA)
Priority Applications (1)
| Application Number | Priority Date | Filing Date | Title |
|---|---|---|---|
| US18/714,489 US20250118105A1 (en) | 2021-12-03 | 2022-11-17 | Reaction sensing system and method for displaying reaction sensing result |
Applications Claiming Priority (2)
| Application Number | Priority Date | Filing Date | Title |
|---|---|---|---|
| JP2021196799A JP7792591B2 (ja) | 2021-12-03 | 2021-12-03 | リアクション検知システムおよびリアクション検知結果表示方法 |
| JP2021-196799 | 2021-12-03 |
Publications (1)
| Publication Number | Publication Date |
|---|---|
| WO2023100671A1 true WO2023100671A1 (ja) | 2023-06-08 |
Family
ID=86612138
Family Applications (1)
| Application Number | Title | Priority Date | Filing Date |
|---|---|---|---|
| PCT/JP2022/042720 Ceased WO2023100671A1 (ja) | 2021-12-03 | 2022-11-17 | リアクション検知システムおよびリアクション検知結果表示方法 |
Country Status (3)
| Country | Link |
|---|---|
| US (1) | US20250118105A1 (https=) |
| JP (1) | JP7792591B2 (https=) |
| WO (1) | WO2023100671A1 (https=) |
Families Citing this family (2)
| Publication number | Priority date | Publication date | Assignee | Title |
|---|---|---|---|---|
| US20240087203A1 (en) * | 2022-09-08 | 2024-03-14 | The Royal Institution For The Advancement Of Learning / Mcgill University | System and method for displaying reaction animations |
| US20260095342A1 (en) * | 2024-09-30 | 2026-04-02 | Zoom Communications, Inc. | Reaction Use In Video Meetings |
Citations (5)
| Publication number | Priority date | Publication date | Assignee | Title |
|---|---|---|---|---|
| JP2018036536A (ja) * | 2016-08-31 | 2018-03-08 | 富士通株式会社 | 参加レベル算出システム、装置、プログラム、および方法 |
| JP2018036690A (ja) * | 2016-08-29 | 2018-03-08 | 米澤 朋子 | 一対多コミュニケーションシステムおよびプログラム |
| JP2018205638A (ja) * | 2017-06-08 | 2018-12-27 | 大和ハウス工業株式会社 | 集中度評価機構 |
| WO2020054855A1 (ja) * | 2018-09-14 | 2020-03-19 | 日本電気株式会社 | 授業支援システム、判定装置、授業支援方法及びプログラム |
| JP6934233B1 (ja) * | 2020-09-07 | 2021-09-15 | 株式会社Shift | プログラム、情報処理装置、及び方法 |
Family Cites Families (4)
| Publication number | Priority date | Publication date | Assignee | Title |
|---|---|---|---|---|
| US11281676B2 (en) * | 2015-09-08 | 2022-03-22 | Sap Se | Time-based display of search results |
| US11755905B2 (en) * | 2018-06-22 | 2023-09-12 | Semiconductor Energy Laboratory Co., Ltd. | Data processing method, image display method, data processing device, and image display device |
| EP4046387A4 (en) * | 2019-10-17 | 2023-11-15 | D-Box Technologies Inc. | METHOD AND SYSTEM FOR SYNCHRONIZING A VIEWER EFFECT SIGNAL OF MULTIMEDIA CONTENT WITH A MULTIMEDIA SIGNAL OF THE MULTIMEDIA CONTENT |
| JP7653641B2 (ja) * | 2020-05-22 | 2025-03-31 | i Smart Technologies株式会社 | オンライン会議システム |
-
2021
- 2021-12-03 JP JP2021196799A patent/JP7792591B2/ja active Active
-
2022
- 2022-11-17 US US18/714,489 patent/US20250118105A1/en active Pending
- 2022-11-17 WO PCT/JP2022/042720 patent/WO2023100671A1/ja not_active Ceased
Patent Citations (5)
| Publication number | Priority date | Publication date | Assignee | Title |
|---|---|---|---|---|
| JP2018036690A (ja) * | 2016-08-29 | 2018-03-08 | 米澤 朋子 | 一対多コミュニケーションシステムおよびプログラム |
| JP2018036536A (ja) * | 2016-08-31 | 2018-03-08 | 富士通株式会社 | 参加レベル算出システム、装置、プログラム、および方法 |
| JP2018205638A (ja) * | 2017-06-08 | 2018-12-27 | 大和ハウス工業株式会社 | 集中度評価機構 |
| WO2020054855A1 (ja) * | 2018-09-14 | 2020-03-19 | 日本電気株式会社 | 授業支援システム、判定装置、授業支援方法及びプログラム |
| JP6934233B1 (ja) * | 2020-09-07 | 2021-09-15 | 株式会社Shift | プログラム、情報処理装置、及び方法 |
Also Published As
| Publication number | Publication date |
|---|---|
| JP7792591B2 (ja) | 2025-12-26 |
| JP2023082833A (ja) | 2023-06-15 |
| US20250118105A1 (en) | 2025-04-10 |
Similar Documents
| Publication | Publication Date | Title |
|---|---|---|
| JP7177476B2 (ja) | 情報処理システム | |
| WO2023100671A1 (ja) | リアクション検知システムおよびリアクション検知結果表示方法 | |
| JP6744652B1 (ja) | 混雑情報報知システム | |
| WO2019163542A1 (ja) | 滞在状況表示システムおよび滞在状況表示方法 | |
| JP7117424B2 (ja) | 顧客呼び出しシステム | |
| JP7658421B2 (ja) | 通信システム、出力装置、通信方法、出力方法および出力プログラム | |
| JP2024033520A (ja) | コンテンツ生成装置、管理サーバ、コンテンツ生成装置の制御方法、管理サーバの制御方法、及びプログラム | |
| JP2012054646A (ja) | 端末装置、情報提示方法および情報提示プログラム | |
| JP5217877B2 (ja) | 会議支援装置 | |
| KR100691530B1 (ko) | 정보표시장치 및 정보표시방법 | |
| KR20220069355A (ko) | 사용자 맞춤형 체형관리가 가능한 스마트 미러 | |
| Assarasee et al. | Meerkat: A framework for developing presence monitoring software based on face recognition | |
| CN114240326A (zh) | 多人现场虚拟现实会议时空人工智能方法和机器人 | |
| JP2025031982A (ja) | 情報処理装置 | |
| JP4287770B2 (ja) | 情報伝達方法及びこの方法を実現するための通信装置とそのプログラム | |
| CN112987916A (zh) | 一种汽车展会展台互动系统及方法 | |
| JP7676846B2 (ja) | 会議支援制御装置および会議支援方法 | |
| WO2023203960A1 (ja) | 情報処理装置、情報処理方法、プログラム及び情報処理システム | |
| JP2023134183A5 (https=) | ||
| JP2015075907A (ja) | 感情情報表示制御装置、その方法及びプログラム | |
| JP2015075906A (ja) | 感情情報表示制御装置、その方法及びプログラム | |
| JP2023000288A (ja) | 情報処理システム、その制御方法、および、プログラム | |
| JP2014025988A (ja) | 撮影指導システム、サーバ装置、撮影指導方法及びプログラム | |
| JP6934098B1 (ja) | 情報処理装置、情報処理方法及びプログラム | |
| CN116883056B (zh) | 目标用户的识别方法、装置、电子设备及存储介质 |
Legal Events
| Date | Code | Title | Description |
|---|---|---|---|
| 121 | Ep: the epo has been informed by wipo that ep was designated in this application |
Ref document number: 22901104 Country of ref document: EP Kind code of ref document: A1 |
|
| WWE | Wipo information: entry into national phase |
Ref document number: 18714489 Country of ref document: US |
|
| NENP | Non-entry into the national phase |
Ref country code: DE |
|
| 122 | Ep: pct application non-entry in european phase |
Ref document number: 22901104 Country of ref document: EP Kind code of ref document: A1 |
|
| WWP | Wipo information: published in national office |
Ref document number: 18714489 Country of ref document: US |