WO2023084785A1 - 係数導出装置、係数導出方法及びプログラム - Google Patents
係数導出装置、係数導出方法及びプログラム Download PDFInfo
- Publication number
- WO2023084785A1 WO2023084785A1 PCT/JP2021/041964 JP2021041964W WO2023084785A1 WO 2023084785 A1 WO2023084785 A1 WO 2023084785A1 JP 2021041964 W JP2021041964 W JP 2021041964W WO 2023084785 A1 WO2023084785 A1 WO 2023084785A1
- Authority
- WO
- WIPO (PCT)
- Prior art keywords
- throughput
- value
- estimated
- coefficient
- values
- Prior art date
- Legal status (The legal status is an assumption and is not a legal conclusion. Google has not performed a legal analysis and makes no representation as to the accuracy of the status listed.)
- Ceased
Links
Images






Classifications
-
- H—ELECTRICITY
- H04—ELECTRIC COMMUNICATION TECHNIQUE
- H04N—PICTORIAL COMMUNICATION, e.g. TELEVISION
- H04N21/00—Selective content distribution, e.g. interactive television or video on demand [VOD]
- H04N21/20—Servers specifically adapted for the distribution of content, e.g. VOD servers; Operations thereof
- H04N21/23—Processing of content or additional data; Elementary server operations; Server middleware
- H04N21/24—Monitoring of processes or resources, e.g. monitoring of server load, available bandwidth, upstream requests
Definitions
- the present invention relates to a coefficient derivation device, a coefficient derivation method, and a program.
- the video bit rate it is necessary to set the video bit rate to be distributed in real time according to the network throughput. If the video bit rate is set higher than the throughput of the network when the network quality is degraded, the video will be disturbed due to packet loss and the associated retransmission. As a result, the quality of experience of the user deteriorates and the service level deteriorates.
- ABR Adaptive Bitrate Streaming
- ABR is a technique for automatically changing video quality according to terminals, line speeds, and the like.
- standards such as MPEG-DASH and HLS are widely used.
- One method for selecting an appropriate video quality (video bitrate) in ABR is to estimate the available throughput and select the video bitrate according to the throughput estimate. Such a method is also implemented in existing OSS (Open Source Software) (Non-Patent Document 1).
- Non-Patent Document 1 based on the fact that the estimated throughput value contains an error, the estimated throughput value is multiplied by a certain ratio (hereinafter referred to as " ⁇ ").
- ⁇ a certain ratio
- the video bitrate does not exceed the value.
- the value of ⁇ is often given as a fixed value in the system.
- the value of ⁇ can be said to be a safety margin based on the estimation error, it should be determined according to the error in the estimated throughput value with respect to the actual throughput value (the ratio of the measured throughput value to the estimated throughput value).
- the throughput estimation techniques such as those using past throughput information and those using wireless parameter information, but these estimation errors are considered to fluctuate according to communication conditions.
- the present invention has been made in view of the above points, and aims to realize a comfortable video viewing experience by improving the estimation accuracy of the ratio of the throughput actual measurement value to the throughput estimation value.
- the coefficient derivation device among the first histories of throughput estimated values and throughput actual measured values in a plurality of communication environments, for each second history common to the communication environment, a coefficient derivation unit configured to derive coefficients of a model for estimating a ratio of measured throughput to estimated throughput based on a set of historical throughput estimates and actual throughput values;
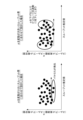
- FIG. 10 is a diagram illustrating an example of the relationship between throughput estimation values and estimation errors;
- FIG. 10 is a diagram for explaining problems caused by using a fixed value of ⁇ ;
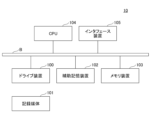
- 2 is a diagram showing a hardware configuration example of the bit rate control device 10 according to the embodiment of the present invention;
- FIG. 1 is a diagram showing a functional configuration example of a bit rate control device 10 according to an embodiment of the present invention;
- FIG. 4 is a flowchart for explaining an example of a processing procedure executed by a log accumulation unit 11 and a coefficient derivation unit 12 according to the embodiment of the present invention;
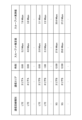
- 3 is a diagram showing a configuration example of a log storage unit 14;
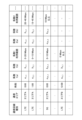
- FIG. 5 is a diagram showing an example of calculation results of coefficient values of an estimation model;
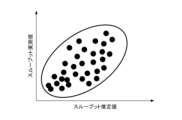
- FIG. 4 is a diagram showing the relationship between an estimated throughput value and a measured throughput value;
- FIG. 10 is a diagram for explaining changes in the relationship between ⁇ and throughput estimation values;
- 3 is a diagram showing a configuration example of a coefficient derivation unit 12 in the first embodiment;
- FIG. 4 is a conceptual diagram for explaining a method of calculating coefficients in the first embodiment;
- FIG. 10 is a diagram showing a configuration example of a coefficient derivation unit 12 in the second embodiment;
- FIG. FIG. 11 is a conceptual diagram for explaining a method of calculating coefficients in the second embodiment;
- the error (estimation error) of the estimated throughput value with respect to the measured throughput value may fluctuate from the following two viewpoints.
- the area granularity varies according to the error characteristics, such as for each base station or for each mesh.
- the throughput is likely to vary greatly depending on time, making estimation difficult and the error large.
- communication lines and areas where the number of people does not change much there is no large change in throughput as described above and the throughput is stable, so estimation is easy and error is expected to be small.
- such changes in characteristics also change according to changes in the settings of base stations that determine communication areas, construction of new buildings, and the like.
- the second is the fluctuation of the error according to the estimated throughput band (interval related to throughput estimation value) within the same communication environment.
- the estimated throughput band (interval related to throughput estimation value) within the same communication environment.
- throughput is estimated according to radio quality.
- High throughput is very rare when the radio quality is very low (left end of the graph in FIG. 1).
- the radio quality is very high, it is very rare for low throughput to occur (the right end of the graph in FIG. 1).
- the wireless quality is neither high nor low, the throughput is likely to fluctuate due to small changes in the environment, so the error between the measured throughput value and the estimated throughput value is likely to increase (center of the graph in FIG. 1). In this way, even within the same communication environment, it is conceivable that the error varies according to the estimated throughput band.
- ⁇ is a value by which the throughput estimate is multiplied considering that the throughput estimate includes an error, and the ratio of the throughput actual measurement value to the throughput estimate is the optimum value.
- FIG. 2 is a diagram for explaining problems caused by using a fixed value of ⁇ .
- the graph on the left side of FIG. 2 shows a problem when ⁇ is set to a constant value (horizontal arrow in the figure) according to a throughput band with small fluctuations. In this case, a bit rate higher than the throughput is set in the throughput band indicated by the ellipse, which causes packet loss and lowers the service level.
- the graph on the right side of FIG. 2 shows a problem when ⁇ is set to a constant value (horizontal arrow in the figure) in accordance with a throughput band that fluctuates greatly. In this case, the bit rate is excessively reduced in the throughput band with small fluctuations, which is indicated by the two ellipses, resulting in deterioration of the service level.
- the present embodiment addresses the following two problems in order to improve the accuracy of estimating the ratio of the actual throughput value to the estimated throughput value.
- problem 2 Since ⁇ changes according to the estimated throughput band even within the same communication environment, it is necessary to determine the coefficient value considering the error fluctuation for each estimated throughput band (hereinafter referred to as "problem 2").
- Equation (2) is an example of an estimation model for ⁇ .
- bitrate is the bitrate to be set (selected) according to the throughput estimate.
- the value of ⁇ is changed by changing the value of the coefficient of the estimation model for ⁇ (hereinafter simply referred to as "estimation model").
- estimate model the value of the coefficient of the estimation model for ⁇
- the error characteristics change due to changes in base station settings, construction of new buildings, and the like.
- actual measurement information is collected at any time, and the value of the coefficient of the estimation model for ⁇ can be updated at any time.
- FIG. 3 is a diagram showing a hardware configuration example of the bit rate control device 10 according to the embodiment of the present invention.
- the bit rate control device 10 of FIG. 3 has a drive device 100, an auxiliary storage device 102, a memory device 103, a CPU 104, an interface device 105, etc., which are connected to each other via a bus B, respectively.
- a program that implements processing in the bit rate control device 10 is provided by a recording medium 101 such as a CD-ROM.
- a recording medium 101 such as a CD-ROM.
- the program is installed from the recording medium 101 to the auxiliary storage device 102 via the drive device 100 .
- the program does not necessarily need to be installed from the recording medium 101, and may be downloaded from another computer via the network.
- the auxiliary storage device 102 stores installed programs, as well as necessary files and data.
- the memory device 103 reads and stores the program from the auxiliary storage device 102 when a program activation instruction is received.
- the CPU 104 executes functions related to the bit rate control device 10 according to programs stored in the memory device 103 .
- the interface device 105 is used as an interface for connecting to a network.
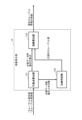
- FIG. 4 is a diagram showing a functional configuration example of the bit rate control device 10 according to the embodiment of the present invention.
- the bitrate control device 10 has a log storage unit 11, a coefficient derivation unit 12, and a bitrate control unit 13. FIG. Each of these units is realized by processing that one or more programs installed in the bit rate control device 10 cause the CPU 104 to execute.
- the bitrate control device 10 also utilizes the log storage unit 14 .
- the log storage unit 14 can be implemented using, for example, the auxiliary storage device 102 or a storage device that can be connected to the bit rate control device 10 via a network.
- FIG. 5 is a flowchart for explaining an example of a processing procedure executed by the log accumulation unit 11 and the coefficient derivation unit 12 according to the embodiment of the present invention.
- the log accumulation unit 11 stores the estimated throughput value, the measured throughput value, Log information including the communication line type of the communication line, the communication area, and the time information at that time is recorded in the log storage unit 14 (S101). It should be noted that the throughput of a certain communication line can be estimated by the same technique as that used by the control unit 13 .
- FIG. 6 is a diagram showing a configuration example of the log storage unit 14. As shown in FIG. One line in FIG. 6 is the log information recorded in one step S101. One piece of log information includes communication line type, communication area, time, throughput estimated value, throughput actual measurement value, and the like. As shown in FIG. 6, the log storage unit 14 stores log information on multiple communication environments (histories of throughput estimated values and throughput actual measurement values in multiple communication environments).
- throughput estimation and actual measurement may be performed at any timing. For example, it may be performed at regular time intervals t for each communication line from which the estimation model learning data is collected. Also, the estimation and actual measurement of throughput for a plurality of communication lines may be performed in parallel (simultaneously).
- Step S101 is repeated until a certain period of time T (> certain period of time t) passes (S102).
- the log information for the fixed time T is added to the log storage unit 14 .
- the coefficient deriving unit 12 collects the log information (estimated throughput value, measured throughput value, communication line type, communication area information, time information) recorded during the certain period of time T. Based on , the values of the coefficients of the estimation model are derived for each communication line type, communication area, time, and estimated throughput band (S103). More specifically, the coefficient deriving unit 12 calculates, for each second history having a common communication environment (communication area information, time information) among the first histories of log information recorded during the certain period of time T, The coefficient is derived (calculated) based on a set of estimated throughput values and measured throughput values related to the history of No. 2.
- FIG. 7 is a diagram showing an example of calculation results of the coefficient values of the estimation model.
- the calculation result by the coefficient deriving unit 12 is the coefficient x(a) and the coefficient x(b).
- the coefficient x utilization range corresponds to the estimated throughput band.
- FIG. 7 shows an example where x is 1 or 2 (that is, there are two estimated throughput bands), but the number of estimated throughput bands and the range of each estimated throughput band are , is determined in the coefficient calculation process by the coefficient derivation unit 12 .
- Coefficient x(a) is the value of coefficient a when the throughput estimate is included in the coefficient x usage range.
- Coefficient x(b) is the value of coefficient b when the throughput estimate is included in the coefficient x utilization range.
- the time is set in units of hours, but may be set in units of minutes or other granularity.
- the communication area may be set in units of meshes, base stations, sectors, or the like.
- the coefficient derivation unit 12 outputs the calculation result (coefficient value for each communication line type/communication area/time/estimated throughput band) as shown in FIG. 7 to the bit rate control unit 13 (S104).
- the value of the coefficient is updated based on the history of the log information at each fixed time T (at multiple timings). Therefore, even if a change in communication characteristics (change in base station settings, construction of a new building, etc.) occurs, it is possible to obtain coefficients that reflect the change. As a result, the problem 1 can be dealt with.
- the timing at which the communication characteristics have changed may be explicitly input from the outside.
- the coefficient derivation unit 12 may calculate the value of the coefficient using the log information for a certain period of time T from the timing.
- the coefficient values of the estimation model are calculated for each communication area, time, and estimated throughput band. Therefore, the problem 2 can be dealt with.
- the bit rate control unit 13 controls, for example, a certain communication line (hereinafter referred to as “target communication line”) and a certain communication area (hereinafter referred to as “target area”) during actual operation of the video distribution service. , operates at times when bitrate selection based on throughput estimates given as inputs is required.
- a throughput estimate given as an input may be calculated using a known throughput estimation technique.
- the coefficients a and b corresponding to the communication line type of the target communication line, the target area, the current time, and the estimated throughput value are calculated as the calculation result last output from the coefficient derivation unit 12 up to the current time (Fig. 7 ).
- the bit rate control unit 13 applies the retrieved coefficients a and b to Equation (2) to calculate ⁇ .
- the bit rate control unit 13 applies the calculated ⁇ to Equation (1) to calculate the bit rate, and sets the bit rate in the encoder.
- step S103 Next, the details of step S103 will be described.
- the coefficient derivation unit 12 utilizes the characteristic that the error of the throughput estimation value with respect to the actual throughput value is small when the throughput estimation value is very high and when the throughput estimation value is very low.
- the correspondence relationship between the estimated throughput value and the measured throughput value forms an ellipse as shown in FIG.
- ⁇ is the value obtained by dividing the actual throughput value by the estimated throughput value, when the estimated throughput value is small, even if the error between the actual measured throughput value and the estimated throughput value is small, it becomes a large value. Therefore, as shown in FIG. 9, the relationship between ⁇ and the estimated throughput value (characteristics of the error of the estimated throughput value with respect to the measured throughput value) up to and after the convex part of the ellipse of the estimated throughput value and the actual throughput value. changes. Based on this characteristic, the coefficient deriving unit 12 derives a formula (that is, a coefficient value) for estimating ⁇ from the throughput estimation value for pre-convexity and post-convexity.
- the coefficient deriving unit 12 uses the change in the variance of ⁇ to determine whether it is pre-convex or post-convex.
- a threshold value is set because the variance of ⁇ becomes smaller after convexity as shown in FIG.
- the coefficient derivation unit 12 determines a point at which the variance is equal to or less than the threshold as a convex portion.
- FIG. 10 is a diagram showing a configuration example of the coefficient derivation unit 12 in the first embodiment.
- FIG. 11 is a conceptual diagram for explaining the coefficient calculation method according to the first embodiment. 10 and 11 both show the method of calculating coefficients for a certain communication environment (communication line type, communication area, time). The communication environment is called a target communication environment. Therefore, the processing described below is executed for each communication environment.
- the coefficient derivation unit 12 includes a representative point calculation unit 121, a projection determination unit 122 and a coefficient calculation unit 123.
- the representative point calculation unit 121 receives a set of pairs of measured throughput values and estimated throughput values of the target communication environment (for example, the data in FIG. 8), and calculates ⁇ for each pair. ⁇ for each pair can be calculated by dividing the measured throughput value for the pair by the estimated throughput value for the pair. As a result, for example, the data group shown in FIG. 9 (data group showing the correspondence relationship between the estimated throughput value and ⁇ ) is obtained.
- the representative point calculation unit 121 divides the data group by a certain width (for example, 10 Mbps) of the estimated throughput value (left diagram in FIG. 11).
- the representative point calculation unit 121 selects a representative value of ⁇ for each divided data group (upper part in FIG. 11).
- ⁇ is a safety margin for preventing packet loss, so it is appropriate to select a small value such as a minimum value or a 5%-tile value as the representative value to be selected.
- the representative point calculation unit 121 also calculates the variance of ⁇ for each divided data group, and outputs the calculation result of the variance to the projection determination unit 122 .
- the convex portion determination unit 122 determines that the data group before the variance of ⁇ falls below the threshold is a convex portion (separation of the estimated throughput band) (lower part of FIG. 11).
- the coefficient calculation unit 123 performs logarithmic regression of the estimated throughput value with respect to the representative value of ⁇ output from the representative point calculation unit 121 for each section (estimated throughput band) before and after the convex portion determined by the convex portion determination unit 122. , Calculate the value of the coefficient of the estimation model (Fig. 11 right figure). In the example of FIG. 11, a coefficient is calculated for each two estimated throughput bands.
- all data are subject to division according to the estimated throughput value.
- an upper limit and a lower limit of the throughput estimation value to be used may be set and only part of the data may be divided. That is, the required video quality differs depending on the target service.
- a very high bit rate is required to enjoy movies in 4K video with a video distribution service, but such high resolution and high bit rate video is not necessary when checking surveillance video.
- the coefficient may be calculated using only the data contained within the range of the lower and upper limit values of the bit rate required for the service as input. .
- the first embodiment it is possible to realize a comfortable video viewing experience by improving the estimation accuracy of the ratio of the throughput actual measurement value to the throughput estimation value.
- ⁇ it is possible to suppress packet loss and avoid excessive reduction in the distribution bit rate. This can improve the service level.
- 2nd Embodiment demonstrates a different point from 1st Embodiment. Points not specifically mentioned in the second embodiment may be the same as in the first embodiment.
- the second embodiment is greatly different from the first embodiment in the technology applied to the projection determination unit 122 shown in FIG.
- FIG. 12 is a diagram showing a configuration example of the coefficient derivation unit 12 in the second embodiment.
- FIG. 12 parts corresponding to those in FIG. 10 are given the same reference numerals.
- FIG. 13 is a conceptual diagram for explaining a coefficient calculation method according to the second embodiment.
- the coefficient derivation unit 12 includes a convex hull scanning unit 124 instead of the representative point calculation unit 121 and the convex portion determination unit 122 .
- the convex hull scanning unit 124 receives as input a set of pairs of measured throughput values and estimated throughput values of the target communication environment (for example, the data in FIG. 8), and calculates ⁇ for each pair. ⁇ for each pair can be calculated by dividing the measured throughput value for the pair by the estimated throughput value for the pair. As a result, for example, the data group shown in FIG. 9 (data group showing the correspondence relationship between the estimated throughput value and ⁇ ) is obtained.
- the convex hull scanning unit 124 performs convex hull scanning on (a set of points corresponding to) the data group in the two-dimensional coordinate system of ⁇ and the estimated throughput value, An estimated value is calculated (the left figure in FIG. 13).
- the convex hull scanning unit 124 outputs ⁇ of each vertex and the estimated throughput value to the coefficient calculation unit 123 .
- the coefficient calculation unit 123 calculates the coefficient value of the estimation model by logarithmic regression for each adjacent point only for the vertices with small values of ⁇ among the vertices. That is, the coefficient calculation unit 123 determines the adjacent point as a delimiter of an estimated throughput band (a section related to estimated throughput values having different error characteristics of the estimated throughput value with respect to the measured throughput value).
- the coefficient calculation unit 123 first selects two points, the vertex (point A) where the estimated throughput value is the minimum and the maximum (point B). Next, the coefficient calculation unit 123 selects the vertex (point C) with a small value of ⁇ among adjacent points (adjacent vertices) of the point with the smallest estimated throughput value. Subsequently, the coefficient calculation unit 123 performs logarithmic regression in the selected section from point A to point C (the section between the vertices at both ends of the estimated throughput band) to calculate the coefficient of the section (the estimated throughput band). .
- the coefficient calculation unit 123 selects the other adjacent point of point C (point D), performs logarithmic regression in the section (estimated throughput band) from point C to point D, and performs logarithmic regression on the section (estimated Throughput band) coefficient is calculated.
- the coefficient calculator 123 repeats this until the point B is connected to the regression line. (Fig. 13, right diagram) As a result, coefficients are calculated for each of the three estimated throughput bands.
- the points with the minimum or maximum estimated throughput values were selected.
- the minimum value above the lower limit value and the maximum value below the upper limit value may be selected in consideration of the lower limit value and upper limit value of the bit rate required for the service.
- bit rate control device 10 is an example of a coefficient derivation device.
- bit rate control device 11 log accumulation unit 12 coefficient derivation unit 13 bit rate control unit 14 log storage unit 100 drive device 101 recording medium 102 auxiliary storage device 103 memory device 104 CPU 105 interface device 121 representative point calculation unit 122 convex portion determination unit 123 coefficient calculation unit 124 convex hull scanning unit B bus
Landscapes
- Engineering & Computer Science (AREA)
- Multimedia (AREA)
- Signal Processing (AREA)
- Data Exchanges In Wide-Area Networks (AREA)
Abstract
係数導出装置は、複数の通信環境におけるスループット推定値及びスループット実測値の第1の履歴のうち、前記通信環境が共通する第2の履歴ごとに、当該第2の履歴に係るスループット推定値及びスループット実測値の集合に基づいて、スループット推定値に対するスループット実測値の割合を推定するモデルの係数を導出するように構成された係数導出部、を有することで、スループット推定値に対するスループット実測値の割合の推定精度を向上させることで、快適な映像の視聴経験を実現する。
Description
本発明は、係数導出装置、係数導出方法及びプログラムに関する。
近年、映像ストリーミングサービスや、リアルタイムなライブ配信サービスの利用が増加している。また、IoTデバイスの普及などにより、遠隔監視システムのような、無線を利用した映像監視サービスの利用も増加している。
このようなサービスでは、配信する映像ビットレートをネットワークのスループットに合わせてリアルタイムに設定することが必要である。ネットワーク品質が低下した際にネットワークのスループットよりも高い映像ビットレートを設定してしまうと、パケット損失の発生や、それに伴う再送の発生により映像が乱れてしまう。その結果、ユーザの体感品質の低下等、サービスレベルの低下を引き起こしてしまう。
このような課題に対して、特に映像ストリーミングサービスでは、ABR(Adaptive Bitrate Streaming)という技術が広く利用されている。ABRは、端末や回線速度等に応じて映像の品質を自動で変更する技術である。ABRに関しては、MPEG-DASHやHLS等の規格が広く利用されている。
ABRにおいて適切な映像の品質(映像ビットレート)を選択する方法の一つに、利用可能なスループットを推定し、スループット推定値に合わせて映像ビットレートを選択する方法がある。そのような方法は既存のOSS(Open Source Software)(非特許文献1)等にも実装されている。
非特許文献1では、スループット推定値が誤差を含むことを踏まえて一定の割合(以降「α」と記載する。)をスループット推定値に乗じた値以下を映像ビットレートとすることで、スループット推定値に対して映像ビットレートが超えないようにしている。このαの値はシステムにおいて固定の値として与えられることが多い。
[online]、インターネット、<URL:https://github.com/google/ExoPlayer/blob/release-v2/library/core/src/main/java/com/google/android/exoplayer2/trackselection/AdaptiveTrackSelection.java>
αの値は推定誤差を踏まえた安全マージンといえるため、スループット実測値に対するスループット推定値の誤差(スループット推定値に対するスループット実測値の割合)に応じて決定されるべきである。スループット推定技術は過去のスループット情報を利用するものや、無線パラメータの情報を利用するものなど様々存在するが、これらの推定誤差は通信状況に応じて変動すると考えられる。
本発明は、上記の点に鑑みてなされたものであって、スループット推定値に対するスループット実測値の割合の推定精度を向上させることで、快適な映像の視聴経験を実現することを目的とする。
そこで上記課題を解決するため、係数導出装置は、複数の通信環境におけるスループット推定値及びスループット実測値の第1の履歴のうち、前記通信環境が共通する第2の履歴ごとに、当該第2の履歴に係るスループット推定値及びスループット実測値の集合に基づいて、スループット推定値に対するスループット実測値の割合を推定するモデルの係数を導出するように構成された係数導出部、を有する。
スループット推定値に対するスループット実測値の割合の推定精度を向上させることで、快適な映像の視聴経験を実現することができる。
本実施の形態では、スループット実測値に対するスループット推定値の誤差(推定誤差)が以下の2つの観点で変動する可能性が有ると考える。
一つは、通信環境(通信回線(LTE,5G等)、エリア、時刻)に応じた誤差の変動である。ここでエリアの粒度は基地局単位やメッシュ単位等、誤差特性に応じて変化する。例えば、人の増減が多い通信回線・エリアはスループットが時間依存で大きく変化するため推定が難しく誤差も大きくなることが想定される。一方で、人の増減があまりない通信回線・エリアは上記のようなスループットの大きな変化がなく、安定しているため、推定が容易であり、誤差が小さくなることが想定される。また、このような特性の変化は通信エリアを決定する基地局の設定変更や新しい建物の建築等に応じても変化する。
2つ目は、同一通信環境内における推定スループット帯(スループット推定値に関する区間)に応じた誤差の変動である。例えば、無線品質に応じてスループットを推定している場合を例にとる。無線品質が非常に低い状態では高スループットが出ることは非常にまれである(図1グラフ左端)。同様に無線品質が非常に高い状態であれば低スループットが出ることは非常にまれである(図1グラフ右端)。一方で、無線品質が高くも低くもない場合においては小さな環境変化によりスループットが変動すると考えられるため、スループット実測値とスループット推定値の誤差が大きくなりやすいと考えられる(図1グラフ中央)。このように同一通信環境内においても推定スループット帯に応じて誤差が変動することが考えられる。
上記記載した推定誤差が変動する状況が想定されるにもかかわらず、従来のように一つのαの値を利用すると、サービスレベルの低下を引き起こす可能性がある。なお、αとは、スループット推定値が誤差を含むことを踏まえてスループット推定値に対して乗ぜられる値であり、スループット推定値に対するスループット実測値の割合が最適値である。
図2は、αの値を固定して利用することによる問題点を説明するための図である。図2の左のグラフは、αを変動が小さいスループット帯に合わせて一定の値(図中の水平の矢印)で設定した場合の問題点を示す。この場合、楕円で示される、変動が大きなスループット帯においては、スループットより高いビットレートが設定するためパケット損失が発生してしまいサービスレベルの低下を引き起こす。一方、図2の右のグラフは、αを変動が大きなスループット帯に合わせて一定の値(図中の水平の矢印)で設定した場合の問題点を示す。この場合、2つの楕円で示される、変動が小さなスループット帯においてはビットレートを過剰に下げてしまうことでサービスレベルの低下を引き起こしてしまう。
上記より、本実施の形態では、スループット推定値に対するスループット実測値の割合の推定精度を向上させるため、以下の2つの課題を対象とする。
最適なαは通信環境に応じたスループット推定値の誤差変動特性によって変化するため、αの推定モデルの係数(以下、単に「係数」という。)には、通信環境毎に異なる値を求める必要がある。また、通信環境の特性も基地局の設定変更や新しい建物の建築などで変化するため、特性の変化にも対応する必要がある(以下、「課題1」という)。
αは同一通信環境内においても推定スループット帯に応じて変化するため、推定スループット帯毎の誤差変動を考慮して係数の値を求める必要がある(以下、「課題2」という)。
なお、本実施の形態において、映像ストリーミングサービス等の映像配信サービスにおけるビットレートを選択するために用いるスループット推定値の計算式は以下の式(1)及び式(2)の通りであるとする。なお、式(2)は、αの推定モデルの一例である。

本実施の形態では、課題1を解決するために実測情報(スループット推定値、スループット実測値、通信回線種別、通信エリア、時刻情報)を利用して、αの推定モデル(式(2))の係数(an、bn)の値を、通信回線種別、通信エリア、時刻ごとに算出可能とする。
すなわち、本実施の形態では、αの推定モデル(以下、単に「推定モデル」という。)の係数の値を変えることで、αの値を変化させる。また、同一通信環境であっても、基地局の設定変更や新しい建造物ができること等で誤差特性は変化する。そのような変化に対応するために、本実施の形態では、実測情報を随時収集し、αの推定モデルの係数の値を随時更新可能とする。
また、課題2を解決するために、推定スループット帯に応じてスループット実測値との誤差が変化する特性を考慮して、推定スループット帯に応じてαが変化するような推定モデル(の係数の)の導出法を示す。
以下、図面に基づいて本発明の実施の形態を説明する。
図3は、本発明の実施の形態におけるビットレート制御装置10のハードウェア構成例を示す図である。図3のビットレート制御装置10は、それぞれバスBで相互に接続されているドライブ装置100、補助記憶装置102、メモリ装置103、CPU104、及びインタフェース装置105等を有する。
ビットレート制御装置10での処理を実現するプログラムは、CD-ROM等の記録媒体101によって提供される。プログラムを記憶した記録媒体101がドライブ装置100にセットされると、プログラムが記録媒体101からドライブ装置100を介して補助記憶装置102にインストールされる。但し、プログラムのインストールは必ずしも記録媒体101より行う必要はなく、ネットワークを介して他のコンピュータよりダウンロードするようにしてもよい。補助記憶装置102は、インストールされたプログラムを格納すると共に、必要なファイルやデータ等を格納する。
メモリ装置103は、プログラムの起動指示があった場合に、補助記憶装置102からプログラムを読み出して格納する。CPU104は、メモリ装置103に格納されたプログラムに従ってビットレート制御装置10に係る機能を実行する。インタフェース装置105は、ネットワークに接続するためのインタフェースとして用いられる。
図4は、本発明の実施の形態におけるビットレート制御装置10の機能構成例を示す図である。図4において、ビットレート制御装置10は、ログ蓄積部11、係数導出部12及びビットレート制御部13を有する。これら各部は、ビットレート制御装置10にインストールされた1以上のプログラムが、CPU104に実行させる処理により実現される。ビットレート制御装置10は、また、ログ記憶部14を利用する。ログ記憶部14は、例えば、補助記憶装置102、又はビットレート制御装置10にネットワークを介して接続可能な記憶装置等を用いて実現可能である。
以下、ビットレート制御装置10が実行する処理手順について説明する。図5は、本発明の形態におけるログ蓄積部11及び係数導出部12が実行する処理手順の一例を説明するためのフローチャートである。
映像配信サービスが提供される或る通信エリアにおける或る通信回線のスループットが推定され、かつ、その時点の実測値が計測されるたびに、ログ蓄積部11は、スループット推定値、スループット実測値、当該通信回線の通信回線種別、当該通信エリア、及びその時点の時刻情報を含むログ情報をログ記憶部14に記録する(S101)。なお、或る通信回線のスループットは、制御部13と同様の技術で推定可能である。
図6は、ログ記憶部14の構成例を示す図である。図6における1行が、1回のステップS101において記録されるログ情報である。1つのログ情報は、通信回線種別、通信エリア、時刻、スループット推定値及びスループット実測値等を含む。図6が示すように、ログ記憶部14は、複数の通信環境に関するログ情報(複数の通信環境におけるスループット推定値及びスループット実測値の履歴)を記憶する。
なお、スループットの推定及び実測は、任意のタイミングで行われればよい。例えば、推定モデルの学習用データの収集対象の通信回線ごとに、一定時間tごとに行われてもよい。また、複数の通信回線に対するスループットの推定及び実測は、並行して(同時に)行われてもよい。
ステップS101は、一定時間T(>一定時間t)が経過するまで繰り返される(S102)。その結果、ログ記憶部14には、一定時間T分のログ情報が追加される。
一定時間Tが経過すると(S102でYes)、係数導出部12は、当該一定時間Tに記録されたログ情報(スループット推定値、スループット実測値、通信回線種別、通信エリア情報、時刻情報)の履歴に基づいて、通信回線種別、通信エリア別、時刻別、推定スループット帯別に推定モデルの係数の値を導出する(S103)。より詳しくは、係数導出部12は、当該一定時間Tに記録されたログ情報の第1の履歴のうち、通信環境(通信エリア情報、時刻情報)が共通する第2の履歴ごとに、当該第2の履歴に係るスループット推定値及びスループット実測値の集合に基づいて当該係数を導出(計算)する。
図7は、推定モデルの係数の値の計算結果の一例を示す図である。図7に示されるように、係数導出部12による計算結果は、通信回線種別、通信エリア、時刻及び係数x利用範囲(x=1,2・・・)の組み合わせごとに、係数x(a)及び係数x(b)を含む。ここで、係数x利用範囲は、推定スループット帯に対応する。図7では、xが1又は2である(すなわち、推定スループット帯が2つである)例が示されているが、推定スループット帯の数及び各推定スループット帯の範囲は、後述されるように、係数導出部12による係数の算出過程において決定される。係数x(a)は、スループット推定値が係数x利用範囲に含まれる場合の係数aの値である。係数x(b)は、スループット推定値が係数x利用範囲に含まれる場合の係数bの値である。
なお、図7において、時刻は時間単位にしているが分単位など別の粒度に設定されてもよい。また、通信エリアは、メッシュ単位、基地局単位、セクタ単位等の粒度に設定されてもよい。
続いて、係数導出部12は、図7に示されるような計算結果(通信回線種別/通信エリア/時刻/推定スループット帯ごとの係数の値)をビットレート制御部13へ出力する(S104)。
図5の処理手順によれば、一定時間Tごとに(複数のタイミングで)、当該一定時間Tにおけるログ情報の履歴に基づいて、係数の値が更新される。したがって、通信特性変化(基地局の設定変更、新しい建物の建築等)が発生した場合であっても、当該変化が反映された係数を求めることができる。その結果、課題1に対応することができる。なお、通信特性が変化したタイミングが明示的に外部から入力されてもよい。この場合、係数導出部12は、当該タイミングから一定時間Tのログ情報を利用して係数の値を算出してもよい。
また、図5の処理手順によれば、通信エリア別、時刻別、推定スループット帯別に推定モデルの係数の値を計算される。したがって、課題2に対応することができる。
一方、ビットレート制御部13は、例えば、映像配信サービスの実運用時において、或る通信回線(以下、「対象通信回線」という。)及び或る通信エリア(以下、「対象エリア」という。)について、入力として与えられるスループット推定値に基づくビットレートの選択が必要とされるタイミングで動作する。入力として与えられるスループット推定値は、公知のスループット推定技術を用いて算出されればよい。
具体的には、対象通信回線の通信回線種別、対象エリア、現在時刻、スループット推定値に対応する係数a及びbを、現在時刻までにおいて最後に係数導出部12から出力された計算結果(図7)から検索する。続いて、ビットレート制御部13は、検索された係数a及びbを式(2)に当てはめて、αを算出する。続いて、ビットレート制御部13は、算出したαを式(1)に当てはめてビットレートを算出し、当該ビットレートをエンコーダに設定する。
次に、ステップS103の詳細について説明する。
第1の実施の形態において、係数導出部12は、スループット推定値が非常に高い際、及びスループット推定値が非常に低い際にスループット実測値に対するスループット推定値の誤差が小さいという特性を利用する。
このような場合において、スループット推定値とスループット実測値との対応関係は図8に示すように楕円形を形成する。
αは、スループット実測値をスループット推定値で割った値となるため、スループット推定値が小さい時点においてはスループット実測値とスループット推定値の誤差が小さくても大きな値となる。そのため、図9のように、スループット推定値とスループット実測値の楕円形が凸になる部分までと凸以降とで、αとスループット推定値の関係(スループット実測値に対するスループット推定値の誤差の特性)が変化する。係数導出部12は、本特性に基づき、凸以前と凸以降に分けて、スループット推定値からαを推定する式(すなわち、係数の値)を導出する。
係数導出部12は、凸以前と凸以降を判定するためにαの分散の変化を利用する。αの分散は、図9に示したように凸以降になると小さくなるため、閾値が設定される。係数導出部12は、分散が閾値以下になった点を凸部と判定する。
図10は、第1の実施の形態における係数導出部12の構成例を示す図である。また、図11は、第1の実施の形態における係数の算出方法を説明するための概念図である。なお、図10及び図11は、いずれも或る1つの通信環境(通信回線種別、通信エリア、時刻)に対する係数の算出方法を示す。当該通信環境を対象通信環境という。したがって、以下において説明する処理は、通信環境ごとに実行される。
図10に示すように、第1の実施の形態において、係数導出部12は、代表点算出部121、凸部判定部122及び係数算出部123を含む。
代表点算出部121は、対象通信環境のスループット実測値及びスループット推定値のペアの集合(例えば、図8のデータ)を入力とし、当該ペアごとにαを算出する。各ペアのαは、当該ペアのスループット実測値を当該ペアのスループット推定値で除することで算出可能である。その結果、例えば、図9のデータ群(スループット推定値とαとの対応関係を示すデータ群)が得られる。
続いて、代表点算出部121は、当該データ群を、スループット推定値の一定幅(例えば10Mbps)ごとに分割する(図11左図)。
続いて、代表点算出部121は、分割したデータ群毎にαの代表値を選択する(図11中図上)。ここで、αはパケットロスを発生させないための安全マージンとなるため、選択する代表値は、最小値や5%-tile値等、小さい値を選択することが適切である。代表点算出部121は、また、分割したデータ群毎にαの分散を算出し、分散の算出結果を凸部判定部122に出力する。
凸部判定部122は、αの分散が閾値以下に低下する前のデータ群を凸部(推定スループット帯の区切り)と判定する(図11中図下)。
係数算出部123は、凸部判定部122で判定された凸部の前後それぞれの区間(推定スループット帯)について、代表点算出部121から出力されたαの代表値に対するスループット推定値の対数回帰により、推定モデルの係数の値を算出(図11右図)。図11の例では2つの推定スループット帯ごとに、係数が算出される。
なお、上記の例では、全てのデータ(スループット推定値とαとの対応データ)を、スループット推定値に応じた分割対象として。しかし、利用するスループット推定値の上限及び下限を設けて一部のデータだけを分割対象としてもよい。すなわち、対象サービスに応じて必要となる映像品質は異なる。映像配信サービスで映画を4K映像で楽しむような場合は非常に高いビットレートが必要となるが、監視映像を確認する場合等においてはそこまで高解像度、高ビットレートの映像は不要である。そのような特性を利用して、サービスで必要なビットレートの下限値、上限値を入力として、当該下限値及び上限値の範囲内に含まれるデータのみを利用して係数が算出されてもよい。
上述したように、第1の実施の形態によれば、スループット推定値に対するスループット実測値の割合の推定精度を向上させることで、快適な映像の視聴経験を実現することができる。その結果、適切なαを設定することで、パケット損失の抑制や配信ビットレートの過剰な低減を回避することができる。これによりサービスレベルを向上することができる。
次に、第2の実施の形態について説明する。第2の実施の形態では第1の実施の形態と異なる点について説明する。第2の実施の形態において特に言及されない点については、第1の実施の形態と同様でもよい。
第2の実施の形態は、第1の実施の形態において図10に示した凸部判定部122における適用技術が大きく異なる。
図12は、第2の実施の形態における係数導出部12の構成例を示す図である。図12中、図10に対応する部分には同一符号を付している。また、図13は、第2の実施の形態における係数の算出方法を説明するための概念図である。
図12において、係数導出部12は、代表点算出部121及び凸部判定部122の代わりに凸包走査部124を含む。
凸包走査部124は、対象通信環境のスループット実測値及びスループット推定値のペアの集合(例えば、図8のデータ)を入力とし、当該ペアごとにαを算出する。各ペアのαは、当該ペアのスループット実測値を当該ペアのスループット推定値で除することで算出可能である。その結果、例えば、図9のデータ群(スループット推定値とαとの対応関係を示すデータ群)が得られる。
続いて、凸包走査部124は、αとスループット推定値との2次元座標系における当該データ群(に対応する点集合)に対して凸包走査を行い、凸包の各頂点のα及びスループット推定値を算出する(図13左図)。
続いて、凸包走査部124は、各頂点のα及びスループット推定値を係数算出部123へ出力する。
続いて、係数算出部123は、各頂点のうちαが小さい値の頂点のみに対する隣接点ごとの対数回帰により、推定モデルの係数の値を算出する。すなわち、係数算出部123は、当該隣接点を推定スループット帯(スループット実測値に対するスループット推定値の誤差の特性が異なるスループット推定値に関する区間)の区切りとして判定する。
具体的には、係数算出部123は、まず、スループット推定値が最小である頂点(点A)と、最大(点B)の2点を選択する。続いて、係数算出部123は、スループット推定値が最小の点の隣接点(隣接する頂点)のうち、αの値が小さい頂点(点C)を選択する。続いて、係数算出部123は、選択した点Aから点Cの区間(推定スループット帯の両端の頂点の区間)で対数回帰を実施して、当該区間(当該推定スループット帯)の係数を算出する。
続いて、係数算出部123は、点Cのもう一方の隣接点を選択(点D)し、点Cから点Dの区間(推定スループット帯)で対数回帰を実施して、当該区間(当該推定スループット帯)の係数を算出する。係数算出部123は、これを点Bに回帰直線がつながる迄繰り返し実施する。(図13右図)その結果、3つの推定スループット帯ごとに係数が算出される。
なお、上記例では、点A及び点Bを選択する際にスループット推定値が最小又は最大である点を選択した。しかし、第1の実施の形態と同様に、サービスで必要なビットレート下限値及び上限値を加味して、下限値以上の最小値、上限値以下の最大値が選択させるようにしてもよい。
なお、上記各実施の形態において、ビットレート制御装置10は、係数導出装置の一例である。
以上、本発明の実施の形態について詳述したが、本発明は斯かる特定の実施形態に限定されるものではなく、請求の範囲に記載された本発明の要旨の範囲内において、種々の変形・変更が可能である。
10 ビットレート制御装置
11 ログ蓄積部
12 係数導出部
13 ビットレート制御部
14 ログ記憶部
100 ドライブ装置
101 記録媒体
102 補助記憶装置
103 メモリ装置
104 CPU
105 インタフェース装置
121 代表点算出部
122 凸部判定部
123 係数算出部
124 凸包走査部
B バス
11 ログ蓄積部
12 係数導出部
13 ビットレート制御部
14 ログ記憶部
100 ドライブ装置
101 記録媒体
102 補助記憶装置
103 メモリ装置
104 CPU
105 インタフェース装置
121 代表点算出部
122 凸部判定部
123 係数算出部
124 凸包走査部
B バス
Claims (7)
- 複数の通信環境におけるスループット推定値及びスループット実測値の第1の履歴のうち、前記通信環境が共通する第2の履歴ごとに、当該第2の履歴に係るスループット推定値及びスループット実測値の集合に基づいて、スループット推定値に対するスループット実測値の割合を推定するモデルの係数を導出するように構成された係数導出部、
を有することを特徴とする係数導出装置。 - 前記係数導出部は、複数のタイミングで、当該タイミングにおける前記第2の履歴に係るスループット推定値及びスループット実測値の集合に基づいて前記係数を導出する、
ことを特徴とする請求項1記載の係数導出装置。 - 前記係数導出部は、スループット実測値に対するスループット推定値の誤差の特性が異なるスループット帯ごとに、当該スループット帯に係るスループット推定値及びスループット実測値の集合に基づいて前記係数を導出する、
ことを特徴とする請求項1又は2記載の係数導出装置。 - 前記係数導出部は、
前記第2の履歴に係るスループット推定値の一定幅ごとに、当該一定幅に含まれる各スループット推定値についてのスループット実測値の割合を算出し、前記一定幅ごとの当該割合の分散に基づいて前記スループット帯の区切りを判定し、
前記スループット帯ごとに、当該スループット帯に含まれる前記一定幅ごとの前記割合の代表点に基づいて、前記係数を算出する、
ことを特徴する請求項3記載の係数導出装置。 - 前記係数導出部は、
前記第2の履歴に係るスループット推定値ごとの当該スループット推定値と前記割合との集合に対して凸包走査を行うことで特定される凸包の頂点を前記スループット帯の区切りとして判定し、
前記スループット帯ごとに、当該スループット帯の両端の前記頂点に係る前記スループット推定値及び前記割合に基づいて、前記係数を算出する、
ことを特徴とする請求項3記載の係数導出装置。 - 複数の通信環境におけるスループット推定値及びスループット実測値の第1の履歴のうち、前記通信環境が共通する第2の履歴ごとに、当該第2の履歴に係るスループット推定値及びスループット実測値の集合に基づいて、スループット推定値に対するスループット実測値の割合を推定するモデルの係数を導出する係数導出手順、
をコンピュータが実行することを特徴とする係数導出方法。 - 複数の通信環境におけるスループット推定値及びスループット実測値の第1の履歴のうち、前記通信環境が共通する第2の履歴ごとに、当該第2の履歴に係るスループット推定値及びスループット実測値の集合に基づいて、スループット推定値に対するスループット実測値の割合を推定するモデルの係数を導出する係数導出手順、
をコンピュータに実行させることを特徴とするプログラム。
Priority Applications (1)
| Application Number | Priority Date | Filing Date | Title |
|---|---|---|---|
| PCT/JP2021/041964 WO2023084785A1 (ja) | 2021-11-15 | 2021-11-15 | 係数導出装置、係数導出方法及びプログラム |
Applications Claiming Priority (1)
| Application Number | Priority Date | Filing Date | Title |
|---|---|---|---|
| PCT/JP2021/041964 WO2023084785A1 (ja) | 2021-11-15 | 2021-11-15 | 係数導出装置、係数導出方法及びプログラム |
Publications (1)
| Publication Number | Publication Date |
|---|---|
| WO2023084785A1 true WO2023084785A1 (ja) | 2023-05-19 |
Family
ID=86335563
Family Applications (1)
| Application Number | Title | Priority Date | Filing Date |
|---|---|---|---|
| PCT/JP2021/041964 Ceased WO2023084785A1 (ja) | 2021-11-15 | 2021-11-15 | 係数導出装置、係数導出方法及びプログラム |
Country Status (1)
| Country | Link |
|---|---|
| WO (1) | WO2023084785A1 (ja) |
Citations (1)
| Publication number | Priority date | Publication date | Assignee | Title |
|---|---|---|---|---|
| WO2006075447A1 (ja) * | 2005-01-12 | 2006-07-20 | Nec Corporation | ユーザスループット地理的分布推定システムおよびユーザスループット地理的分布推定方法 |
-
2021
- 2021-11-15 WO PCT/JP2021/041964 patent/WO2023084785A1/ja not_active Ceased
Patent Citations (1)
| Publication number | Priority date | Publication date | Assignee | Title |
|---|---|---|---|---|
| WO2006075447A1 (ja) * | 2005-01-12 | 2006-07-20 | Nec Corporation | ユーザスループット地理的分布推定システムおよびユーザスループット地理的分布推定方法 |
Non-Patent Citations (1)
| Title |
|---|
| OKUYAMA, TAKALUMI ET AL.: "A server-assisted throughput prediction method for video quality selection", LECTURE PROCEEDINGS OF THE 2018 IEICE GENERAL CONFERENCE: COMMUNICATION 2, 6 March 2018 (2018-03-06), pages 273, XP009545615 * |
Similar Documents
| Publication | Publication Date | Title |
|---|---|---|
| CA2617893C (en) | Video communication quality estimation device, method, and program | |
| US10374928B1 (en) | Efficient bandwidth estimation | |
| KR101276190B1 (ko) | 네트워크 속도들을 할당하기 위한 방법 및 장치 | |
| US20150264098A1 (en) | System and Method for Dynamic Effective Rate Estimation for Real-Time Video Traffic | |
| JP7103530B2 (ja) | 映像分析方法、映像分析システム及び情報処理装置 | |
| US20170041817A1 (en) | Communication management apparatus, wireless terminal, and non-transitory machine-readable storage medium | |
| US11729106B2 (en) | Service quality control device, method, and program | |
| CN111464458B (zh) | 抗丢包方法、装置、设备及存储介质 | |
| CN111901861B (zh) | 功率控制方法、装置、通信节点及存储介质 | |
| JP7494938B2 (ja) | スループット推定装置、スループット推定方法及びプログラム | |
| US11531569B2 (en) | System and method for scaling provisioned resources | |
| CN114745079B (zh) | 一种自适应调制编码方法、接入网设备及存储介质 | |
| JP6468193B2 (ja) | 通信装置及び通信装置におけるネットワーク利用可能帯域推定方法、並びにネットワーク利用可能帯域推定プログラム | |
| JP4490374B2 (ja) | 映像品質評価装置および方法 | |
| JP5533177B2 (ja) | パケットロス率推定装置、パケットロス率推定方法、パケットロス率推定プログラム、及び、通信システム | |
| JP4460506B2 (ja) | ユーザ体感品質推定装置、方法、およびプログラム | |
| JP7056565B2 (ja) | 送信端末、送信方法および送信プログラム | |
| JP7672276B2 (ja) | 制御装置、リソース割当制御方法及びコンピュータプログラム | |
| WO2025150096A1 (ja) | 選択可能ビットレート決定装置及び選択可能ビットレート決定方法 | |
| CN116260799B (zh) | 一种调整网络状态的方法和电子设备 | |
| CN114079536A (zh) | 一种内环mcs值确定方法、装置、存储介质和计算机设备 | |
| CN121396854B (zh) | Rsma系统中时延分析和功率分配方法及装置 | |
| WO2022049699A1 (ja) | 推定装置、制御装置、推定方法、制御方法、プログラム及び制御システム | |
| CN118827580A (zh) | 网络切片的资源分配方法、装置、设备和存储介质 | |
| CN117693054A (zh) | 资源配置信息的确定方法、装置、存储介质及电子设备 |
Legal Events
| Date | Code | Title | Description |
|---|---|---|---|
| 121 | Ep: the epo has been informed by wipo that ep was designated in this application |
Ref document number: 21964138 Country of ref document: EP Kind code of ref document: A1 |
|
| 122 | Ep: pct application non-entry in european phase |
Ref document number: 21964138 Country of ref document: EP Kind code of ref document: A1 |
|
| NENP | Non-entry into the national phase |
Ref country code: JP |