WO2023062829A1 - 状態検知システム、状態検知方法および状態検知プログラム - Google Patents
状態検知システム、状態検知方法および状態検知プログラム Download PDFInfo
- Publication number
- WO2023062829A1 WO2023062829A1 PCT/JP2021/038283 JP2021038283W WO2023062829A1 WO 2023062829 A1 WO2023062829 A1 WO 2023062829A1 JP 2021038283 W JP2021038283 W JP 2021038283W WO 2023062829 A1 WO2023062829 A1 WO 2023062829A1
- Authority
- WO
- WIPO (PCT)
- Prior art keywords
- group
- data
- signal
- state detection
- groups
- Prior art date
- Legal status (The legal status is an assumption and is not a legal conclusion. Google has not performed a legal analysis and makes no representation as to the accuracy of the status listed.)
- Ceased
Links
Images









Classifications
-
- G—PHYSICS
- G05—CONTROLLING; REGULATING
- G05B—CONTROL OR REGULATING SYSTEMS IN GENERAL; FUNCTIONAL ELEMENTS OF SUCH SYSTEMS; MONITORING OR TESTING ARRANGEMENTS FOR SUCH SYSTEMS OR ELEMENTS
- G05B23/00—Testing or monitoring of control systems or parts thereof
- G05B23/02—Electric testing or monitoring
-
- G—PHYSICS
- G01—MEASURING; TESTING
- G01M—TESTING STATIC OR DYNAMIC BALANCE OF MACHINES OR STRUCTURES; TESTING OF STRUCTURES OR APPARATUS, NOT OTHERWISE PROVIDED FOR
- G01M99/00—Subject matter not provided for in other groups of this subclass
- G01M99/005—Testing of complete machines, e.g. washing-machines or mobile phones
-
- G—PHYSICS
- G05—CONTROLLING; REGULATING
- G05B—CONTROL OR REGULATING SYSTEMS IN GENERAL; FUNCTIONAL ELEMENTS OF SUCH SYSTEMS; MONITORING OR TESTING ARRANGEMENTS FOR SUCH SYSTEMS OR ELEMENTS
- G05B23/00—Testing or monitoring of control systems or parts thereof
- G05B23/02—Electric testing or monitoring
- G05B23/0205—Electric testing or monitoring by means of a monitoring system capable of detecting and responding to faults
- G05B23/0218—Electric testing or monitoring by means of a monitoring system capable of detecting and responding to faults characterised by the fault detection method dealing with either existing or incipient faults
- G05B23/0224—Process history based detection method, e.g. whereby history implies the availability of large amounts of data
- G05B23/024—Quantitative history assessment, e.g. mathematical relationships between available data; Functions therefor; Principal component analysis [PCA]; Partial least square [PLS]; Statistical classifiers, e.g. Bayesian networks, linear regression or correlation analysis; Neural networks
Definitions
- This disclosure relates to technology for detecting anomalies in equipment.
- Patent Literature 1 discloses a technique aimed at detecting anomalies in production equipment. In that technique, first, operation data consisting of a plurality of bit signals is collected when the operation status of the facility is in a steady state. Next, a normal model is generated for determining the operational status of the facility. Next, the normal model is used to compare the expected values of the operation data of the equipment with the actual values of the operation data. Then, it is detected whether or not the operation status of the facility is in an unsteady state.
- Patent Document 1 has the problem that when the scale of production equipment increases and the number of signals increases, the relationship between signals becomes complicated, and the required learning time and the required amount of learning data increase. be.
- a plurality of workpieces are often processed in parallel in the production equipment of a factory.
- the processing timing of each work will be different each time due to the influence of a shift in the input timing of the work. Therefore, when learning the operation of the entire facility with one trained model, the required learning time and the required amount of learning data increase if trying to cover the processing timings of a plurality of workpieces.
- the purpose of the present disclosure is to enable generation of a trained model for detecting the state of equipment with a short learning time and a small amount of learning data.
- the state detection system of the present disclosure is a system that detects the state of equipment through which works are passed.
- the state detection system includes: a collecting unit for collecting in time series collected data indicating a plurality of signal values of a plurality of signals reacting in order according to the flow of the work; a dividing unit that divides a set of the signal values included in the time-series collected data into a plurality of groups to generate collected divided data showing one or more signal values in the group in time series for each group; a learning unit that generates a normal model, which is a trained model, for each group by performing machine learning using the collected divided data for each group as learning data; a state detection unit that detects the state of the facility using the normal model for each group.
- FIG. 1 is a configuration diagram of an equipment system 200 according to Embodiment 1.
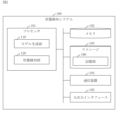
- FIG. 1 is a configuration diagram of a state detection system 100 according to Embodiment 1;
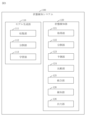
- FIG. 3 is a configuration diagram of a model generation unit 110 and a state detection unit 120 according to Embodiment 1.
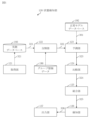
- FIG. 3 is a functional relationship diagram of a model generation unit 110 according to Embodiment 1.
- FIG. 4 is a functional relationship diagram of the state detection unit 120 according to Embodiment 1.
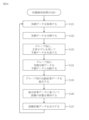
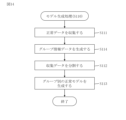
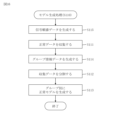
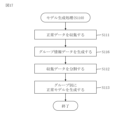
- FIG. 4 is a flowchart of a state detection method according to Embodiment 1; 4 is a flowchart of model generation processing (S110) according to the first embodiment;
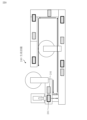
- 2 is a diagram showing an example of a production facility 240 according to Embodiment 1;
- FIG. 4 is a diagram showing an example of grouping of production equipment 240 according to Embodiment 1.
- FIG. 4 is a flowchart of state detection processing (S120) according to the first embodiment; The figure which shows an example of the variable of the normal model 301 in Embodiment 2.
- FIG. 11 is a functional relationship diagram of a model generation unit 110 according to Embodiment 3; 10 is a flowchart of model generation processing (S110) according to the third embodiment;
- Embodiment 1 The state detection system 100 will be described based on FIGS. 1 to 10.
- FIG. 1 A block diagram illustrating an exemplary computing environment in accordance with the present disclosure.
- the equipment system 200 includes equipment 210 and the state detection system 100 .
- Equipment 210 is equipment for processing or assembling a work. A work is passed through the equipment 210 . A work is an object to be processed or assembled.
- the facility 210 includes a control device 220 and multiple target devices 230 .
- the control equipment 220 is equipment for factories and controls the equipment 210 .
- control device 220 is a programmable logic controller (PLC).
- PLC programmable logic controller
- the control device 220 may be a general computer.
- the target device 230 is a device controlled by the control device 220 and inputs/outputs various signals. Specific examples of target device 230 are sensor 231 and actuator 232 .
- Control device 220 and state detection system 100 are connected to each other via network 201 .
- the control device 220 and each target device 230 are connected to each other via the network 202 .
- Networks 201 and 202 are field networks, general networks, or dedicated input/output lines.
- a specific example of a field network is CC-Link.
- a specific example of a common network is Ethernet.
- the networks 201 and 202 may be the same type of network, or may be different types of networks.
- the configuration of the state detection system 100 will be described based on FIG.
- the state detection system 100 is a computer including hardware such as a processor 101 , a memory 102 , a storage 103 , a communication device 104 and an input/output interface 105 . These pieces of hardware are connected to each other via signal lines.
- the processor 101 is an IC that performs arithmetic processing and controls other hardware.
- processor 101 is a CPU.
- IC is an abbreviation for Integrated Circuit.
- CPU is an abbreviation for Central Processing Unit.
- Memory 102 is a volatile or non-volatile storage device. Memory 102 is also referred to as main storage or main memory. For example, memory 102 is RAM. Data stored in the memory 102 is saved in the storage 103 as needed. RAM is an abbreviation for Random Access Memory.
- the storage 103 is a non-volatile storage device.
- storage 103 is ROM, HDD, flash memory, or a combination thereof. Data stored in the storage 103 is loaded into the storage 103 as needed.
- ROM is an abbreviation for Read Only Memory.
- HDD is an abbreviation for Hard Disk Drive.
- Communication device 104 is a receiver and transmitter.
- communication device 104 is a communication board, communication chip or NIC.
- Communication of the state detection system 100 is performed using the communication device 104 .
- NIC is an abbreviation for Network Interface Card.
- the input/output interface 105 is a port to which an input device and an output device are connected.
- the input/output interface 105 is a USB terminal.
- An example of an input device is a keyboard and mouse.
- An example of an output device is a display.
- An example of an input/output device is a touch panel.
- Input/output of the state detection system 100 is performed using the input/output interface 105 .
- USB is an abbreviation for Universal Serial Bus.
- the state detection system 100 includes elements such as a model generation unit 110 and a state detection unit 120 . These elements are implemented in software.
- the storage 103 stores a state detection program for causing the computer to function as the model generation unit 110 and the state detection unit 120 .
- the state detection program is loaded into memory 102 and executed by processor 101 .
- the storage 103 also stores an OS. At least part of the OS is loaded into memory 102 and executed by processor 101 .
- the processor 101 executes the state detection program while executing the OS.
- OS is an abbreviation for Operating System.
- Input/output data of the state detection program is stored in the storage unit 190 .
- Storage 103 functions as storage unit 190 .
- a storage device such as the memory 102 , a register within the processor 101 and a cache memory within the processor 101 may function as the storage unit 190 instead of or together with the storage 103 .
- the state detection system 100 may include multiple processors that substitute for the processor 101 .
- the state detection program can be recorded (stored) in a computer-readable manner on a non-volatile recording medium such as an optical disc or flash memory.
- the state detection system 100 may be composed of multiple computers.
- the state detection system 100 may be configured with a computer functioning as the model generation unit 110 and a computer functioning as the state detection unit 120 .
- the model generation unit 110 includes elements such as a collection unit 111 , a division unit 112 and a learning unit 113 .
- the state detection unit 120 includes elements such as an acquisition unit 121 , a division unit 122 , a prediction unit 123 , a comparison unit 124 , an integration unit 125 , a detection unit 126 and an output unit 127 . The function of these elements will be described later.
- FIG. 4 shows the functional relationship of the model generator 110.
- FIG. 5 shows the functional relationship of the state detection unit 120.
- a collection database 191 a normal model database 192 , an actual measurement database 193 and group information data 199 are stored in the storage unit 190 . The contents of these data will be described later.
- the operating procedure of the state detection system 100 corresponds to the state detection method. Further, the procedure of operation of the state detection system 100 corresponds to the procedure of processing by the state detection program.
- step S110 the model generator 110 generates normal models 301 for each group.
- the procedure of the model generation process (S110) will be described.
- the state of the facility 210 is normal.
- Normal can be rephrased as "steady”.
- the collection unit 111 collects the normal data 311 in chronological order. That is, the collection unit 111 collects the normal data 311 at each time. Specifically, the collection unit 111 receives time-series normal data 311 from the control device 220 .
- the normal data 311 is operation data of the facility 210 in a normal state. Normal data 311 indicates a plurality of normal values. A normal value is a signal value at equipment 210 in a normal state.
- the operation data is data indicating the operation status of the equipment 210 .
- the operational data indicates multiple signal values corresponding to multiple signals.
- a plurality of signals react in sequence according to the flow of work in the equipment 210 through which the work is flowed.
- a signal response corresponds to a change in signal value.
- Each signal is identified by a signal identifier.
- a plurality of signal values are collected from a plurality of target devices 230 by the control device 220 .
- control device 220 receives multiple signal values from multiple target devices 230 .
- a signal value is a value indicated by an input/output signal of the target device 230 .
- the signal value indicates workpiece detection by the sensor 231 or the state (on or off) of the actuator 232 .
- Each signal value is shown in association with a signal identifier.
- the collection unit 111 stores the collected time-series normal data 311 in the collection database 191 .
- Step S111 is executed until the collection condition is satisfied. For example, step S111 is executed until a specified amount of normal data 311 is accumulated. Alternatively, step S111 is executed until the specified time elapses.
- step S111 the amount of normal data 311 necessary for generating the normal model 301 for each group is accumulated in the collection database 191.
- FIG. The accumulated time-series normal data 311 that is, the collected time-series normal data 311 is referred to as collected data 312 .
- step S ⁇ b>112 the dividing unit 112 acquires collected data 312 from the collected database 191 . Then, the dividing unit 112 divides the set of normal values included in the collected data 312 into a plurality of groups.
- the division unit 112 divides the set of normal values into a plurality of groups based on the group information data 199 .
- Group information data 199 indicates a plurality of signals divided into a plurality of groups according to the reaction order.
- Group information data 199 is stored in advance in storage unit 190 .
- group information data 199 is generated by the user.
- the dividing unit 112 selects a group to which the signal corresponding to the normal value belongs from a plurality of groups indicated by the group information data 199, and determines the selected group as the group to which the normal value belongs.
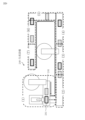
- FIG. 8 shows the production facility 240 viewed from above.
- Production facility 240 is an example of facility 210 .
- FIG. 8 shows how two workpieces 241 flow through the production equipment 240 .
- FIG. 9 shows production equipment 240 divided into multiple groups.
- the production equipment 240 is divided into seven groups (1) to (7) in the order in which the works 241 flow.
- a plurality of signals respond in sequence according to the flow of work 241 .
- Group information data 199 indicates one or more signals for each of groups (1)-(7).
- the dividing unit 112 generates normal divided data 313 (an example of collected divided data) for each group.
- the normal division data 313 indicates one or more normal values in the group in chronological order.
- step S113 the learning unit 113 performs machine learning by using the normal divided data 313 as learning data for each group. As a result, the learning unit 113 generates normal models 301 for each group.
- a normal model 301 is a trained model for predicting one or more signal values within a group.
- step S120 will be described.
- the state detection unit 120 detects the state of the facility 210 using the normal model 301 for each group.
- Steps S121 to S127 are executed at each time.
- the state of the equipment 210 is normal or abnormal. "Abnormal” can be rephrased as “unsteady”.
- Acquisition unit 121 acquires measured data 321 . Specifically, the acquisition unit 121 receives the measured data 321 from the control device 220 .
- the measured data 321 is operation data of the facility 210 .
- the measured data 321 indicates a plurality of measured values.
- the multiple measured values are the multiple signal values obtained in step S121.
- the acquisition unit 121 stores the measured data 321 in the measured database 193 .
- step S ⁇ b>122 the dividing unit 122 acquires the measured data 321 from the measured data base 193 .
- the dividing unit 122 divides a plurality of measured values in the measured data 321 into a plurality of groups. Specifically, the dividing unit 122 divides the plurality of measured values into a plurality of groups based on the group information data 199 .
- the grouping method is the same as the method in step S112. Then, the dividing unit 122 generates measured divided data 322 for each group.
- the measured split data 322 indicates one or more measured values within the group.
- step S123 the prediction unit 123 generates prediction data 323 using the normal model 301 for each group.
- Prediction data 323 indicates one or more prediction values within a group.
- the predicted value is the signal value predicted to be obtained next time.
- the prediction unit 123 operates as follows for each group. First, the prediction unit 123 acquires the normal model 301 of the target group from the normal model database 192 . Then, the prediction unit 123 inputs the previous measured divided data 322 of the target group and calculates the normal model 301 . This yields one or more predictors for the target group.
- a normal model 301 has one or more explanatory variables and one or more objective variables.
- the prediction unit 123 sets one or more measured values indicated in the previous measured divided data 322 as one or more explanatory variables.
- the prediction unit 123 computes the normal model 301 .
- the prediction unit 123 acquires one or more predicted values set for one or more objective variables.
- the prediction unit 123 may compute a plurality of normal models 301 for a plurality of groups in parallel.
- step S124 the comparison unit 124 compares the measured divided data 322 with the predicted data 323 for each group. Specifically, the comparison unit 124 selects a predicted value corresponding to the measured value from the predicted data 323 for each measured value indicated in the measured divided data 322 . Then, the comparison unit 124 compares each measured value indicated in the measured divided data 322 with the selected predicted value.
- the comparison unit 124 then generates group-by-group comparison result data 324 .
- the comparison result data 324 indicates the result of comparison between the measured divided data 322 and the predicted data 323 . That is, the comparison result data 324 indicates the comparison result for each measured value indicated in the measured divided data 322 .
- a specific comparison result is the difference between the measured value and the predicted value.
- step S125 the integration unit 125 integrates the comparison result data 324 for each group. Thereby, the integration unit 125 generates integration result data 325 .
- Integrated result data 325 includes all comparison result data 324 .
- step S ⁇ b>126 the detection unit 126 detects the state of the equipment 210 based on the integration result data 325 . Specifically, the detection unit 126 calculates the total difference indicated in the integration result data 325 and determines the state of the facility 210 based on the calculated total. When the calculated total is equal to or less than the threshold, the detection unit 126 determines that the equipment 210 is in a normal state. Further, when the calculated total is larger than the threshold, the detection unit 126 determines that the state of the facility 210 is abnormal.
- the detection unit 126 then generates the equipment state data 326 .
- Equipment state data 326 indicates the state of equipment 210 .
- step S ⁇ b>127 the output unit 127 outputs the equipment state data 326 .
- the output unit 127 displays a message indicating the abnormal condition of the equipment 210 on the display.
- the division by division unit 112 and division unit 122 may be performed according to a user's instruction.
- the dividing unit 112 displays the collected data 312 on the display.
- the user operates the input device to instruct the division method.
- the dividing unit 112 divides the collected data 312 according to the instructed dividing method.
- the dividing unit 122 divides the measured data 321 in the same manner.
- the state detection system 100 divides the learning target production equipment into a plurality of appropriate groups and applies machine learning to each group. As a result, when the scale of the target production equipment increases and the number of signals increases, the relationship between signals becomes complicated, and the required learning time and the required amount of learning data increase. becomes possible. Dividing the production equipment to be learned into appropriate groups simplifies the behavior to be learned compared to learning without division. Further, exhaustive learning data becomes unnecessary, and the required learning time and the required amount of learning data are reduced. In addition, by executing multiple trained models in parallel, it is expected to reduce the time required for diagnosis. Furthermore, since the number of target variables handled by one trained model is reduced, it becomes easier to concentrate on the target variables to be learned and to learn motions, and an improvement in prediction accuracy can be expected.
- Collected data 312 may include time-series anomaly data. That is, the normal model 301 for each group may be generated based on the time-series normal data 311 and the time-series abnormal data.
- the collection unit 111 collects normal data 311 in time series when the equipment 210 is in a normal state, and collects abnormal data in time series when the equipment 210 is in an abnormal state. Then, the collecting unit 111 accumulates the time-series normal data 311 and the time-series abnormal data as collected data 312 in the collection database 191 .
- the dividing unit 112 divides the set of signal values (normal values or abnormal values) included in the collected data 312 into a plurality of groups to generate collected divided data for each group.
- Collected split data indicates one or more signal values (normal or abnormal) within a group in chronological order.
- the learning unit 113 performs machine learning using the collected divided data for each group as learning data, and generates the normal model 301 for each group.
- a machine learning method is used to determine the boundary between normal and abnormal.
- the learning unit 113 automatically learns the classification of normal and abnormal using an unsupervised learning technique.
- an unsupervised learning technique is K-means.
- the learning unit 113 learns the boundaries between normal labels and abnormal labels using a supervised learning technique.
- a group having an abnormality is specifically designated according to an abnormality such as work clogging.
- a specific example of a supervised learning technique is support vector machines.
- Embodiment 2 Regarding the parameters of the normal model 301, differences from the first embodiment will be mainly described with reference to FIG.
- Configuration description *** The configuration of the equipment system 200 is the same as the configuration in the first embodiment.
- the configuration of state detection system 100 is the same as the configuration in the first embodiment.
- the configuration of the parameters of the normal model 301 will be explained.
- a group corresponding to each normal model 301 is called a target group.
- the group immediately before the target group is referred to as the previous group, and the group immediately after the target group is referred to as the subsequent group.
- the normal model 301 has one or more explanatory variables for the target group, one or more explanatory variables for the anterior group, and one or more explanatory variables for the posterior group.
- the normal model 301 also has one or more objective variables for the target group.
- FIG. 11 shows an example of combinations of variables in the normal model 301. As shown in FIG. "0" means an explanatory variable. “1” means objective variable and explanatory variable. Assume that there are four groups in the order group A, group B, group C, and group D.
- Normal model 301 for Group A has two explanatory variables (and objective variables) for Group A and three explanatory variables for Group B.
- the signal values of the two signals (1, 2) belonging to group A are set to the two explanatory variables for group A.
- FIG. The signal values of the three signals (3 to 5) belonging to group B are set as the three explanatory variables for group B.
- Normal model 301 for Group B has two explanatory variables for Group A, three explanatory variables (and objective variables) for Group B, and two explanatory variables for Group C.
- the two explanatory variables for group C are set to the signal values of the two signals (6, 7) belonging to group C.
- Normal model 301 for Group C has 3 explanatory variables for Group B, 2 explanatory variables (and objective variables) for Group C, and 2 explanatory variables for Group D.
- the two explanatory variables for group D are set to the signal values of the two signals (8, 9) belonging to group D.
- the normal model 301 for group D has two explanatory variables for group C and two explanatory variables for group D (and the objective variable).
- the procedure of the state detection method is the same as the procedure in the first embodiment.
- the method of generating the normal model 301 in step S113 is different from the method of generating in the first embodiment.
- the usage of the normal model 301 in step S123 is different from that in the first embodiment.
- step S113 the learning unit 113 performs machine learning by using the normal divided data 313 as learning data for each group.
- the learning unit 113 uses the normal divided data 313 of the target group, the normal divided data 313 of the previous group, and the normal divided data 313 of the subsequent group as learning data.
- the learning unit 113 sets one or more normal values of the target group as one or more explanatory variables for the target group.
- the learning unit 113 sets one or more normal values of the previous group as one or more explanatory variables for the previous group.
- the learning unit 113 sets one or more normal values of the posterior group as one or more explanatory variables for the posterior group. Then, the learning unit 113 performs machine learning. This generates a normal model 301 of the target group.
- step S123 the prediction unit 123 generates prediction data 323 using the normal model 301 for each group.
- the prediction unit 123 uses the previous measured divided data 322 of the target group, the previous measured divided data 322 of the previous group, and the previous measured divided data 322 of the subsequent group as input data.
- the prediction unit 123 sets one or more previous measured values of the target group as one or more explanatory variables for the target group.
- the prediction unit 123 sets one or more previous measured values of the previous group as one or more explanatory variables for the previous group.
- the prediction unit 123 sets one or more previous measured values of the posterior group as one or more explanatory variables for the posterior group.
- the prediction unit 123 calculates the normal model 301 of the target group. Thereby, one or more prediction values for the target group are calculated.
- the calculated one or more predicted values are set to one or more objective variables for the target group.
- the prediction unit 123 acquires one or more predicted values for the target group from one or more objective variables for the target group.
- Embodiment 2 *** Effect of Embodiment 2 ***
- explanatory variables for the signals in the groups before and after are added to the learning target.
- work is transferred from the previous group to the group in question. Therefore, it is preferable to add the signals of the previous group as explanatory variables in order to predict the behavior of the signals of that group.
- the group cannot send out work unless the latter group becomes free. Therefore, it is preferable to add the signals of the later group as explanatory variables in order to predict the behavior of the signals of that group.
- Embodiment 2 enables more accurate learning. Then, more accurate prediction becomes possible. As a result, more accurate state detection is possible.
- Embodiment 3 A mode for generating group information data 199 will be described mainly with reference to FIGS. 12 to 15 for differences from the first and second embodiments.
- State detection system 100 further includes data analysis section 130 .
- the state detection program further causes the computer to function as data analysis section 130 .
- FIG. 13 shows the functional relationship between the model generation unit 110 and the data analysis unit 130.
- Signal order data 198 indicates the reaction order of a plurality of signals in facility 210 .
- the signal order data 198 is pre-stored in the storage unit 190 .
- signal order data 198 is user generated.
- Step S114 is executed after step S111 and before step S112.
- step S114 the data analysis unit 130 analyzes the collected data 312 to determine one or more signals belonging to each group.
- data analysis section 130 generates data indicating one or more signals belonging to each group.
- the generated data is group information data 199 .
- data analysis section 130 stores group information data 199 in storage section 190 .
- the data analysis unit 130 may analyze all of the collected data 312, or may analyze a portion of the collected data 312 (for example, data for 30 minutes).
- the one or more signals belonging to each group are determined as follows.
- the data analysis unit 130 determines the reaction order of the multiple signals in the equipment 210 by referring to the signal order data 198 .
- the data analysis unit 130 determines the signal (base signal) that reacts first in the facility 210 as the first signal in the first group.
- the data analysis unit 130 selects 0 or 1 or more signals that sequentially react after the first signal in the first group reacts and before the next reaction of the first signal in the first group.
- a signal belonging to the top group is determined.
- data analysis section 130 determines the signal that reacts after the last signal in the previous group to be the first signal in each group after the second group.
- the data analysis unit 130 selects one or more signals that sequentially react after the first signal in each of the second and subsequent groups reacts until the next reaction of the first signal in each of the second and subsequent groups. Signals are determined as those belonging to the second and subsequent groups.
- the data analysis unit 130 may perform grouping based on the collected data 312 in the time period in which each section is narrow. In other words, when the determined groups differ depending on the time period, the data analysis unit 130 may select a plurality of groups in which the number of signals belonging to each group is small.
- Signal X1 is the base signal. Each signal reacts in the order of signal X1, signal Y1, signal X2, signal Y2, and signal X3. Signal Y1, signal X2 and signal Y2 react in order after signal X1 reacts and before signal X1 reacts next time. On the other hand, the signal X3 does not react after the signal X1 reacts until the signal X1 next reacts. Therefore, the signal X1, the signal Y1, the signal X2 and the signal Y2 belong to the leading group. Also, the signal X3 is the leading signal of the second group.
- Embodiment 3 *** Effect of Embodiment 3 ***
- the production facility is divided into sections in which multiple works do not exist at the same time.
- the state detection system 100 analyzes and divides operation data of production equipment. At this time, it is premised that the reaction order of the signals is clear. A section in which a plurality of works do not exist at the same time forms one group. Then, the state detection system 100 divides the plurality of signals in the production equipment in order of reaction. Embodiment 3 eliminates the need for manual group division and reduces the user's trouble.
- Embodiment 4 A mode for generating the signal order data 198 will be described mainly with reference to FIG. 16 for differences from the third embodiment.
- Step S115 is performed before step S111.
- the user sends only one work to the facility 210.
- the data analysis unit 130 collects operation data at each time while only one work is flowing through the equipment 210 . Specifically, data analysis unit 130 receives operation data at each time from control device 220 . Next, the data analysis unit 130 identifies the order of the signals whose signal values have changed by analyzing the operation data at each time. The specified order is the reaction order of the signals. Next, the data analysis unit 130 generates data indicating the reaction order of the multiple signals. The generated data is signal order data 198 . Then, the data analysis section 130 stores the signal order data 198 in the storage section 190 .
- Embodiment 4 *** Effect of Embodiment 4 ***
- reaction orders of a plurality of signals are analyzed.
- the state detection system 100 estimates the order in which a plurality of signals react by analyzing log data (operation data at each time) when only one work is sent to the production equipment. Then, the state detection system 100 uses the reaction order of the signals at the time of automatic division. According to the fourth embodiment, it is unnecessary to manually input the signal reaction order, and the user's trouble can be reduced.
- Embodiment 5 A mode of integrating groups when the number of groups is large will be described mainly with reference to FIG. 17 for differences from the third embodiment.
- Step S116 corresponds to step S114 in the third embodiment.
- step S116 data analysis section 130 groups one or more signals belonging to each group, as in step S114 of the third embodiment.
- the data analysis unit 130 determines whether to integrate the groups based on the number of groups. If the number of groups is greater than a threshold (for example, 10 groups), the data analysis unit 130 determines to integrate the groups.
- the data analysis unit 130 integrates the groups according to the integration rule. For example, the data analysis unit 130 integrates two or more consecutive groups into one group so that the number of groups to be integrated is uniform. When the number of groups is 40 and the threshold is 10 groups, the data analysis unit 130 integrates four groups from the leading group. This brings the number of groups to ten. For example, the data analysis unit 130 integrates two or more consecutive groups into one group so that the number of signals belonging to each group after integration is uniform. Next, data analysis section 130 generates data indicating one or more signals belonging to each group after integration. The generated data is group information data 199 . Then, data analysis section 130 stores group information data 199 in storage section 190 .
- the data analysis unit 130 If it is determined not to integrate the groups, the data analysis unit 130 generates data indicating one or more signals belonging to each group without integrating the groups. The generated data is group information data 199 . Then, data analysis section 130 stores group information data 199 in storage section 190 .
- Embodiment 5 groups are integrated when the number of groups is large. As a result of automatic division, when the number of groups is large (eg, 40 groups), it becomes difficult to operate all trained models at the same time. In such a case, the state detection system 100 integrates groups (eg, 10 groups) and applies machine learning. According to Embodiment 5, the number of learned models to be operated simultaneously can be adjusted.
- the fifth embodiment may be implemented in combination with the fourth embodiment. That is, the data analysis section 130 may generate the signal order data 198 .
- Embodiment 6 A mode for improving the accuracy of prediction by the normal model 301 will be described mainly with reference to FIGS. 18 to 20 for differences from the first embodiment.
- State detection system 100 further includes an accuracy evaluation unit 140 .
- the state detection program also causes the computer to function as the accuracy evaluation unit 140 .
- FIG. 19 shows the functional relationship between the state detection unit 120 and the accuracy evaluation unit 140. As shown in FIG.
- the anomaly degree database 194 is stored in the storage unit 190 .
- Steps S601 to S604 are executed at each time.
- step S ⁇ b>601 the detection unit 126 detects the state for each group based on the comparison result data 324 for each group. For example, the detection unit 126 calculates the total difference indicated in the comparison result data 324, and determines the state of the group based on the calculated total. If the calculated total is equal to or less than the threshold, the detection unit 126 determines that the state of the group is normal. Further, when the calculated total is larger than the threshold, the detection unit 126 determines that the state of the group is abnormal.
- step S602 the detection unit 126 selects the comparison result data 324 of each group in the normal state.
- the detection unit 126 calculates the degree of abnormality based on the comparison result data 324 for each normal state group. For example, the detection unit 126 calculates the sum of the differences indicated in the comparison result data 324 as the degree of abnormality.
- the degree of anomaly represents the error of one or more predicted values with respect to one or more measured values.
- the detection unit 126 generates data indicating the degree of abnormality for each normal state group. The generated data is the anomaly degree data 327 .
- the detection unit 126 stores the group-by-group anomaly degree data 327 of the normal state in the anomaly degree database 194 .
- step S ⁇ b>603 the accuracy evaluation unit 140 acquires the abnormality degree data 327 for each group from the abnormality database 194 . Then, the accuracy evaluation unit 140 identifies the deterioration group based on the group-by-group abnormality degree data 327 .
- the deterioration group is a group corresponding to normal models 301 whose accuracy is estimated to have deteriorated.
- the accuracy evaluation unit 140 identifies a group in which the degree of abnormality has deteriorated as a deteriorated group. For example, when the degree of abnormality is greater than the threshold, the accuracy evaluation unit 140 determines that the degree of abnormality has deteriorated.
- An example threshold is 1.5 times the reference value.
- a reference value is a value defined as a reference for the degree of abnormality in a normal state.
- the accuracy evaluation unit 140 calculates an average degree of abnormality in one or more pieces of degree of abnormality data 327 accumulated for a certain period of time (for example, one day). When the calculated average is larger than the threshold, the accuracy evaluation unit 140 determines that the degree of abnormality has deteriorated.
- the accuracy evaluation unit 140 determines the trend of the degree of abnormality in one or more pieces of degree-of-abnormality data 327 accumulated for a certain period of time (for example, one week).
- the trend of the degree of abnormality is represented by, for example, the slope of the regression line.
- the accuracy evaluation unit 140 determines that the degree of anomaly has deteriorated.
- step S604 the model generation unit 110 performs machine learning on the deterioration group. That is, the model generation unit 110 performs re-learning for the worsened group. Specifically, the model generating unit 110 performs machine learning using the normal divided data 313 of the deteriorated group after the previous machine learning was performed on the deteriorated group as learning data. This updates the normal model 301 of the deteriorating group.
- the procedure of step S604 is the same as the procedure of the model generation process (S110).
- the collection unit 111 should store the actual measurement data 321 when the equipment 210 is determined to be in a normal state as the normal data 311 in the collection database 191 .
- Embodiment 6 re-learning is performed for each group. In production equipment, only specific parts are often refurbished. Therefore, the state detection system 100 evaluates the trained model for each group and automatically checks the accuracy periodically. Then, the state detection system 100 automatically performs relearning only for the specific group when the accuracy of the specific group deteriorates. According to Embodiment 6, re-learning can be performed in a short time compared to the case of re-learning for the entire facility.
- Re-learning may be performed using collected divided data as learning data, as in the modification of the first embodiment.
- Embodiment 6 may be implemented in combination with at least one of Embodiments 2 to 5.
- Deterioration group identification may be done manually.
- the user evaluates the false positive rate or false negative rate for each group to identify the worsening group. Then, the user operates the input device to specify the deterioration group to the state detection system 100 .
- the model generating unit 110 receives designation of a deterioration group and performs re-learning for the designated deterioration group.
- Condition detection system 100 includes processing circuitry 109 .
- the processing circuit 109 is hardware that implements the model generation unit 110 , the state detection unit 120 , the data analysis unit 130 and the accuracy evaluation unit 140 .
- the processing circuit 109 may be dedicated hardware, or may be a processing circuit 109 that executes a program stored in the memory 102 .
- processing circuitry 109 may be, for example, a single circuit, multiple circuits, a programmed processor, a parallel programmed processor, an ASIC, an FPGA, or a combination thereof.
- ASIC is an abbreviation for Application Specific Integrated Circuit.
- FPGA is an abbreviation for Field Programmable Gate Array.
- the state detection system 100 may include a plurality of processing circuits that substitute for the processing circuit 109.
- processing circuit 109 some functions may be implemented by dedicated hardware, and the remaining functions may be implemented by software or firmware.
- the functions of the state detection system 100 can be implemented in hardware, software, firmware, or a combination thereof.
- the "unit”, which is an element of the state detection system 100, may be read as "processing", “process", “circuit” or “circuitry”.
- 100 state detection system 101 processor, 102 memory, 103 storage, 104 communication device, 105 input/output interface, 109 processing circuit, 110 model generation unit, 111 collection unit, 112 division unit, 113 learning unit, 120 state detection unit, 121 acquisition unit, 122 division unit, 123 prediction unit, 124 comparison unit, 125 integration unit, 126 detection unit, 127 output unit, 130 data analysis unit, 140 accuracy evaluation unit, 190 storage unit, 191 collection database, 192 normal model database, 193 Actual measurement database, 194 Abnormality database, 198 Signal order data, 199 Group information data, 200 Equipment system, 201 Network, 202 Network, 210 Equipment, 220 Control equipment, 230 Target equipment, 231 Sensor, 232 Actuator, 240 Production equipment, 241 work, 301 normal model, 311 normal data, 312 collected data, 313 normal divided data, 321 measured data, 322 measured divided data, 323 predicted data, 324 comparison result data, 325 integrated result data, 326 equipment status data, 327 abnormal degree data.
Landscapes
- Physics & Mathematics (AREA)
- General Physics & Mathematics (AREA)
- Engineering & Computer Science (AREA)
- Automation & Control Theory (AREA)
- Artificial Intelligence (AREA)
- Evolutionary Computation (AREA)
- Mathematical Physics (AREA)
- Testing And Monitoring For Control Systems (AREA)
- Debugging And Monitoring (AREA)
Abstract
Description
特許文献1は、生産設備の異常検知を目的とした技術を開示している。
その技術では、まず、設備の稼働状況が定常状態である時に、複数のビット信号からなる稼働データが収集される。次に、設備の稼働状況を判定するための正常モデルが生成される。次に、正常モデルを利用して設備の稼働データの期待値と稼働データの実測値が比較される。そして、設備の稼働状況が非定常状態であるか否かが検出される。
工場の生産設備では、複数のワークが並列に処理されることが多い。複数のワークが並列に処理され各処理の同期が取られていない場合、ワークの投入タイミングのズレ等の影響によって、各ワークの処理タイミングが毎回異なる可能性がある。
そのため、1個の学習済みモデルで設備全体の動作を学習する場合、複数のワークの処理タイミングを網羅しようとすると、必要な学習時間および必要な学習データ量が増大する。
前記状態検知システムは、
前記ワークの流れに応じて順番に反応する複数の信号の複数の信号値を示す収集データを時系列に収集する収集部と、
時系列の前記収集データに含まれる前記信号値の集合を複数のグループに分けることによって、グループ内の1つ以上の信号値を時系列に示す収集分割データをグループ別に生成する分割部と、
グループ別に前記収集分割データを学習データにして機械学習を行うことによって、学習済みモデルである正常モデルをグループ別に生成する学習部と、
グループ別の前記正常モデルを用いて前記設備の状態を検知する状態検知部と、を備える。
状態検知システム100について、図1から図10に基づいて説明する。
図1に基づいて、設備システム200の構成を説明する。
設備システム200は、設備210と、状態検知システム100と、を備える。
制御機器220は、工場向けの機器であり、設備210を制御する。例えば、制御機器220は、プログラマブルロジックコントローラ(PLC)である。但し、制御機器220は、一般的なコンピュータであってもよい。
対象機器230は、制御機器220によって制御される機器であり、各種信号を入出力する。対象機器230の具体例は、センサ231およびアクチュエータ232である。
制御機器220と各対象機器230は、互いにネットワーク202を介して接続される。
ネットワーク201およびネットワーク202は、フィールドネットワーク、一般的なネットワークまたは専用の入出力線である。フィールドネットワークの具体例はCC-Linkである。一般的なネットワークの具体例はイーサネット(登録商標)である。
ネットワーク201とネットワーク202は、同じ種類のネットワークであってもよいし、互いに異なる種類のネットワークであってもよい。
状態検知システム100は、プロセッサ101とメモリ102とストレージ103と通信装置104と入出力インタフェース105といったハードウェアを備えるコンピュータである。これらのハードウェアは、信号線を介して互いに接続されている。
ICは、Integrated Circuitの略称である。
CPUは、Central Processing Unitの略称である。
RAMは、Random Access Memoryの略称である。
ROMは、Read Only Memoryの略称である。
HDDは、Hard Disk Driveの略称である。
NICは、Network Interface Cardの略称である。
USBは、Universal Serial Busの略称である。
ストレージ103には、さらに、OSが記憶されている。OSの少なくとも一部は、メモリ102にロードされて、プロセッサ101によって実行される。
プロセッサ101は、OSを実行しながら、状態検知プログラムを実行する。
OSは、Operating Systemの略称である。
ストレージ103は記憶部190として機能する。但し、メモリ102、プロセッサ101内のレジスタおよびプロセッサ101内のキャッシュメモリなどの記憶装置が、ストレージ103の代わりに、又は、ストレージ103と共に、記憶部190として機能してもよい。
例えば、状態検知システム100は、モデル生成部110として機能するコンピュータと、状態検知部120として機能するコンピュータと、で構成されてもよい。
モデル生成部110は、収集部111と分割部112と学習部113といった要素を備える。
状態検知部120は、取得部121と分割部122と予測部123と比較部124と統合部125と検知部126と出力部127といった要素を備える。
これら要素の機能については後述する。
図5に、状態検知部120の機能関係を示す。
収集データベース191、正常モデルデータベース192、実測データベース193およびグループ情報データ199は、記憶部190に記憶される。
これらデータの内容については後述する。
状態検知システム100の動作の手順は状態検知方法に相当する。また、状態検知システム100の動作の手順は状態検知プログラムによる処理の手順に相当する。
ステップS110において、モデル生成部110は、グループ別の正常モデル301を生成する。
ステップS111において、設備210の状態は正常状態である。「正常」は「定常」と言い換えることができる。
収集部111は、正常データ311を時系列に収集する。つまり、収集部111は、各時刻の正常データ311を収集する。具体的には、収集部111は、時系列の正常データ311を制御機器220から受信する。
正常データ311は、複数の正常値を示す。
正常値は、正常状態の設備210における信号値である。
稼働データは、複数の信号に対応する複数の信号値を示す。
各信号は、信号識別子によって識別される。
信号値は、対象機器230の入出力信号で示される値である。例えば、信号値は、センサ231によるワークの検知またはアクチュエータ232の状態(オンまたはオフ)を示す。
各信号値は、信号識別子に対応付けて示される。
蓄積された時系列の正常データ311、すなわち収集された時系列の正常データ311を収集データ312と称する。
そして、分割部112は、収集データ312に含まれる正常値の集合を複数のグループに分ける。
グループ情報データ199は、反応順番にしたがって複数のグループに分けられた複数の信号をグループ別に示す。グループ情報データ199は、記憶部190に予め記憶される。例えば、グループ情報データ199は利用者によって生成される。
分割部112は、グループ情報データ199に示される複数のグループから正常値に対応する信号が属するグループを選択し、選択されたグループを正常値が属するグループに決定する。
図8は、2つのワーク241が生産設備240を流れる様子を示している。
生産設備240は、ワーク241が流れる順に7つのグループ(1)~(7)に分けられる。複数の信号は、ワーク241の流れに応じて順番に反応する。
グループ情報データ199は、グループ(1)~(7)のそれぞれの1つ以上の信号を示す。
分割部112は、グループ別の正常分割データ313(収集分割データの一例)を生成する。
正常分割データ313は、グループ内の1つ以上の正常値を時系列に示す。
これにより、学習部113は、グループ別の正常モデル301を生成する。
正常モデル301は、グループ内の1つ以上の信号値を予測するための学習済みモデルである。
ステップS120において、状態検知部120は、グループ別の正常モデル301を用いて、設備210の状態を検知する。
ステップS121からステップS127は各時刻に実行される。
取得部121は、実測データ321を取得する。具体的には、取得部121は、制御機器220から実測データ321を受信する。
実測データ321は、設備210の稼働データである。
実測データ321は、複数の実測値を示す。
複数の実測値は、ステップS121で得られた複数の信号値である。
次に、分割部122は、実測データ321の中の複数の実測値を複数のグループに分ける。
具体的には、分割部122は、グループ情報データ199に基づいて、複数の実測値を複数のグループに分ける。グループ分けの方法は、ステップS112における方法と同様である。
そして、分割部122は、グループ別の実測分割データ322を生成する。
実測分割データ322は、グループ内の1つ以上の実測値を示す。
予測データ323は、グループ内の1つ以上の予測値を示す。
予測値は、次回に得られると予測される信号値である。
まず、予測部123は、対象グループの正常モデル301を正常モデルデータベース192から取得する。
そして、予測部123は、対象グループの前回の実測分割データ322を入力にして正常モデル301を演算する。これにより、対象グループの1つ以上の予測値が得られる。
まず、予測部123は、前回の実測分割データ322に示される1つ以上の実測値を1つ以上の説明変数に設定する。
次に、予測部123は、正常モデル301を演算する。
そして、予測部123は、1つ以上の目的変数に設定された1つ以上の予測値を取得する。
具体的には、比較部124は、実測分割データ322に示される実測値ごとに、予測データ323から実測値に対応する予測値を選択する。そして、比較部124は、実測分割データ322に示される実測値ごとに、実測値を選択された予測値と比較する。
比較結果データ324は、実測分割データ322と予測データ323の比較結果を示す。つまり、比較結果データ324は、実測分割データ322に示される実測値ごとに比較結果を示す。具体的な比較結果は、実測値と予測値の差である。
統合結果データ325は、全ての比較結果データ324を含む。
具体的には、検知部126は、統合結果データ325に示される差の合計を算出し、算出された合計に基づいて設備210の状態を判定する。算出された合計が閾値以下である場合、検知部126は、設備210の状態が正常状態である、と判定する。また、算出された合計が閾値より大きい場合、検知部126は、設備210の状態が異常状態である、と判定する。
設備状態データ326は、設備210の状態を示す。
例えば、設備状態データ326が異常状態を示す場合、出力部127は、設備210の異常状態を示すメッセージをディスプレイに表示する。
分割部112および分割部122による分割は、利用者の指示にしたがって行われてもよい。その場合、分割部112は、収集データ312をディスプレイに表示する。利用者は、入力装置を操作して分割方法を指示する。そして、分割部112は、指示された分割方法にしたがって収集データ312を分割する。また、分割部122は、同様に実測データ321を分割する。
状態検知システム100は、学習対象の生産設備を複数の適切なグループに分割し、各グループに機械学習を適用する。
これにより、対象の生産設備の規模が大きくなり、信号数が増えた場合に、信号間の関係性が複雑になり、必要な学習時間および必要な学習データ量が増える、という課題を解決することが可能になる。
学習対象の生産設備を複数の適切なグループに分割することで、分割せずに学習する場合と比較して学習対象の動作が単純化される。そして、網羅的な学習データが不要となり、必要な学習時間および必要な学習データ量が少なくなる。
また、複数の学習済みモデルを並列に実行することで、診断に要する時間の短縮を期待できる。さらに、1個の学習済みモデルで扱う目的変数の数が減るため、学習対象の目的変数に集中して動作を学習しやすくなり、予測精度の向上を期待できる。
収集データ312が時系列の異常データを含んでもよい。つまり、時系列の正常データ311と時系列の異常データとに基づいて、グループ別の正常モデル301が生成されてもよい。
まず、収集部111は、設備210の状態が正常状態であるときに正常データ311を時系列に収集し、設備210の状態が異常状態であるときに異常データを時系列に収集する。そして、収集部111は、時系列の正常データ311と時系列の異常データとを収集データ312として収集データベース191に蓄積する。
次に、分割部112は、収集データ312に含まれる信号値(正常値または異常値)の集合を複数のグループに分けて、グループ別の収集分割データを生成する。
収集分割データは、グループ内の1つ以上の信号値(正常値または異常値)を時系列に示す。
そして、学習部113は、グループ別に収集分割データを学習データにして機械学習を行って、グループ別の正常モデル301を生成する。
このとき、正常と異常の境界を判断するような機械学習手法が利用される。
例えば、学習部113は、教師なし学習技術で正常と異常の分類を自動で学習する。教師なし学習技術の具体例はK平均法である。
例えば、学習部113は、教師あり学習技術で正常ラベルと異常ラベルの境界を学習する。この場合、ワークの詰まりなどの異常に応じて異常があるグループが具体的に指定される。教師あり学習技術の具体例はサポートベクターマシンである。
正常モデル301のパラメータについて、主に実施の形態1と異なる点を図11に基づいて説明する。
設備システム200の構成は、実施の形態1における構成と同じである。
状態検知システム100の構成は、実施の形態1における構成と同じである。
ここで、各正常モデル301に対応するグループを対象グループと称する。また、対象グループの1つ前のグループを前グループと称し、対象グループの1つ後のグループを後グループと称する。
正常モデル301は、対象グループに対する1つ以上の説明変数と、前グループに対する1つ以上の説明変数と、後グループに対する1つ以上の説明変数と、を有する。また、正常モデル301は、対象グループに対する1つ以上の目的変数を有する。
グループA、グループB、グループC、グループDの順番で4つのグループが存在すると仮定する。
グループAに対する2つの説明変数には、グループAに属する2つの信号(1、2)の信号値が設定される。
グループBに対する3つの説明変数には、グループBに属する3つの信号(3~5)の信号値が設定される。
グループCに対する2つの説明変数には、グループCに属する2つの信号(6、7)の信号値が設定される。
グループDに対する2つの説明変数には、グループDに属する2つの信号(8、9)の信号値が設定される。
状態検知方法の手順は、実施の形態1における手順と同じである。
但し、ステップS113における正常モデル301の生成方法が実施の形態1における生成方法と異なる。
また、ステップS123における正常モデル301の使い方が実施の形態1における使い方と異なる。
このとき、学習部113は、対象グループの正常分割データ313と、前グループの正常分割データ313と、後グループの正常分割データ313と、を学習データとして用いる。
具体的には、学習部113は、対象グループの1つ以上の正常値を対象グループに対する1つ以上の説明変数に設定する。また、学習部113は、前グループの1つ以上の正常値を前グループに対する1つ以上の説明変数に設定する。また、学習部113は、後グループの1つ以上の正常値を後グループに対する1つ以上の説明変数に設定する。そして、学習部113は機械学習を行う。これにより、対象グループの正常モデル301が生成される。
このとき、予測部123は、対象グループの前回の実測分割データ322と、前グループの前回の実測分割データ322と、後グループの前回の実測分割データ322と、を入力データとして用いる。
具体的には、予測部123は、対象グループの前回の1つ以上の実測値を対象グループに対する1つ以上の説明変数に設定する。また、予測部123は、前グループの前回の1つ以上の実測値を前グループに対する1つ以上の説明変数に設定する。また、予測部123は、後グループの前回の1つ以上の実測値を後グループに対する1つ以上の説明変数に設定する。そして、予測部123は、対象グループの正常モデル301を演算する。これにより、対象グループの1つ以上の予測値が算出される。算出された1つ以上の予測値は、対象グループに対する1つ以上の目的変数に設定される。予測部123は、対象グループに対する1つ以上の目的変数から対象グループの1つ以上の予測値を取得する。
実施の形態2において、前後のグループの信号に対する説明変数が学習対象に追加される。
生産設備では、前のグループから当該グループにワークが運ばれる。そのため、当該グループの信号の動作を予測するために、前のグループの信号を説明変数として追加することが好ましい。また、後のグループが空かないと当該グループはワークを送り出せない。そのため、当該グループの信号の動作を予測するために、後のグループの信号を説明変数として追加することが好ましい。
実施の形態2により、より精度の良い学習が可能となる。そして、より精度の良い予測が可能となる。その結果、より精度の良い状態検知が可能となる。
グループ情報データ199を生成する形態について、主に実施の形態1および実施の形態2と異なる点を図12から図15に基づいて説明する。
図12に基づいて、状態検知システム100の構成を説明する。
状態検知システム100は、さらに、データ解析部130を備える。
状態検知プログラムは、さらに、データ解析部130としてコンピュータを機能させる。
信号順番データ198は、設備210における複数の信号の反応順番を示す。信号順番データ198は、記憶部190に予め記憶される。例えば、信号順番データ198は、利用者によって生成される。
状態検知方法において、モデル生成処理(S110)の手順が実施の形態1における手順と異なる。
ステップS114は、ステップS111の後、ステップS112の前に実行される。
次に、データ解析部130は、各グループに属する1つ以上の信号を示すデータを生成する。生成されるデータがグループ情報データ199である。
そして、データ解析部130は、グループ情報データ199を記憶部190に記憶する。
まず、データ解析部130は、設備210において最初に反応する信号(基点信号)を、先頭のグループにおける先頭の信号に決定する。
次に、データ解析部130は、先頭のグループにおける先頭の信号が反応してから先頭のグループにおける先頭の信号が次に反応するまでの間に順番に反応する0または1つ以上の信号を、先頭のグループに属する信号に決定する。
さらに、データ解析部130は、1つ前のグループにおける最後の信号の次に反応する信号を、2番目以降の各グループにおける先頭の信号に決定する。
そして、データ解析部130は、2番目以降の各グループにおける先頭の信号が反応してから2番目以降の各グループにおける先頭の信号が次に反応するまでの間に順番に反応する1つ以上の信号を、2番目以降の各グループに属する信号に決定する。
信号X1が基点信号である。信号X1、信号Y1、信号X2、信号Y2、信号X3の順番に各信号が反応する。
信号X1が反応してから信号X1が次に反応するまでの間に、信号Y1、信号X2および信号Y2が順番に反応する。一方、信号X3は、信号X1が反応してから信号X1が次に反応するまでの間に反応しない。
そのため、信号X1、信号Y1、信号X2および信号Y2が先頭グループに属することとなる。また、信号X3は、2番目のグループの先頭の信号となる。
実施の形態3において、生産設備は複数のワークが同時に存在しない区間ごとに分割される。
状態検知システム100は、生産設備の稼働データを解析して分割を行う。このとき、信号の反応順番が明らかであることが前提となる。また、複数のワークが同時に存在しない区間が1つのグループになる。そして、状態検知システム100は、生産設備における複数の信号を反応順に分割する。
実施の形態3により、手動でのグループ分割が不要になり、利用者の手間を軽減できる。
信号順番データ198を生成する形態について、主に実施の形態3と異なる点を図16に基づいて説明する。
状態検知システム100の構成は、実施の形態3における構成と同じである。
状態検知方法において、モデル生成処理(S110)の手順が実施の形態3における手順と異なる。
ステップS115は、ステップS111の前に実行される。
まず、データ解析部130は、ワークが設備210に1つだけ流されている間の各時刻の稼働データを収集する。具体的には、データ解析部130は、制御機器220から各時刻の稼働データを受信する。
次に、データ解析部130は、各時刻の稼働データを解析することによって、信号値が変化した信号の順番を特定する。特定される順番が複数の信号の反応順番である。
次に、データ解析部130は、複数の信号の反応順番を示すデータを生成する。生成されるデータが信号順番データ198である。
そして、データ解析部130は、信号順番データ198を記憶部190に記憶する。
実施の形態4において、複数の信号の反応順番が解析される。
状態検知システム100は、ワークが1個だけ生産設備に流された場合のログデータ(各時刻の稼働データ)を解析することによって、複数の信号が反応する順番を推測する。そして、状態検知システム100は、信号の反応順番を自動分割時に利用する。
実施の形態4により、信号の反応順番を手動で入力することが不要になり、利用者の手間を軽減できる。
グループの数が多い場合にグループを統合する形態について、主に実施の形態3と異なる点を図17に基づいて説明する。
状態検知システム100の構成は、実施の形態3における構成と同じである。
状態検知方法において、状態検知処理(S110)の手順が実施の形態3における手順と異なる。
ステップS116は、実施の形態3のステップS114に相当する。
次に、データ解析部130は、グループの数に基づいてグループを統合するか判定する。グループの数が閾値(例えば10グループ)より多い場合、データ解析部130は、グループを統合すると判定する。
例えば、データ解析部130は、統合されるグループの数が均等になるように、連続する2つ以上のグループを1つのグループに統合する。グループの数が40であり、閾値が10グループである場合、データ解析部130は、先頭グループから4グループずつ統合する。これにより、グループの数が10になる。
例えば、データ解析部130は、統合後の各グループに属する信号の数が均等になるように、連続する2つ以上のグループを1つのグループに統合する。
次に、データ解析部130は、統合後の各グループに属する1つ以上の信号を示すデータを生成する。生成されるデータがグループ情報データ199である。
そして、データ解析部130は、グループ情報データ199を記憶部190に記憶する。
そして、データ解析部130は、グループ情報データ199を記憶部190に記憶する。
実施の形態5において、グループの数が多い場合にグループが統合される。
自動分割の結果、グループの数が多い(例:40グループ)場合、同時に全ての学習済みモデルを動作させることが難しくなる。このような場合に、状態検知システム100は、グループを統合(例:10グループ)して機械学習を適用する。
実施の形態5により、同時に動作させる学習済みモデルの数を調整できる。
実施の形態5は、実施の形態4と組み合わせて実施してもよい。つまり、データ解析部130が信号順番データ198を生成してもよい。
正常モデル301による予測の精度を高める形態について、主に実施の形態1と異なる点を図18から図20に基づいて説明する。
図18に基づいて、状態検知システム100の構成を説明する。
状態検知システム100は、さらに、精度評価部140を備える。
状態検知プログラムは、さらに、精度評価部140としてコンピュータを機能させる。
異常度データベース194は、記憶部190に記憶される。
図20に基づいて、再学習方法を説明する。再学習方法は状態検知方法の一部である。
ステップS601からステップS604は、各時刻に実行される。
例えば、検知部126は、比較結果データ324に示される差の合計を算出し、算出された合計に基づいてグループの状態を判定する。算出された合計が閾値以下である場合、検知部126は、グループの状態が正常状態である、と判定する。また、算出された合計が閾値より大きい場合、検知部126は、グループの状態が異常状態である、と判定する。
次に、検知部126は、正常状態のグループ別に比較結果データ324に基づいて異常度を算出する。例えば、検知部126は、比較結果データ324に示される差の合計を異常度として算出する。異常度は、1つ以上の実測値に対する1つ以上の予測値の誤差を表す。
次に、検知部126は、正常状態のグループ別に、異常度を示すデータを生成する。生成されるデータが異常度データ327である。
そして、検知部126は、正常状態のグループ別の異常度データ327を異常度データベース194に記憶する。
そして、精度評価部140は、グループ別の異常度データ327に基づいて悪化グループを特定する。
悪化グループは、精度が悪化したと推測される正常モデル301に対応するグループである。
例えば、異常度が閾値より大きい場合、精度評価部140は、異常度が悪化したと判定する。閾値の一例は基準値の1.5倍である。基準値は、正常状態における異常度の基準として定められた値である。
例えば、精度評価部140は、一定期間(例えば1日)に蓄積された1つ以上の異常度データ327における異常度の平均を算出する。算出された平均が閾値より大きい場合、精度評価部140は、異常度が悪化したと判定する。
例えば、精度評価部140は、一定期間(例えば1週間)に蓄積された1つ以上の異常度データ327における異常度のトレンドを判定する。異常度のトレンドは例えば回帰直線の傾きで表される。異常度のトレンドが一定以上の上昇傾向にある場合、精度評価部140は、異常度が悪化したと判定する。
特定グループがない場合、処理はステップS601に進む。
具体的には、モデル生成部110は、悪化グループに対する前回の機械学習が行われた後の悪化グループの正常分割データ313を学習データにして機械学習を行う。
これにより、悪化グループの正常モデル301が更新される。
ステップS604の手順は、モデル生成処理(S110)の手順と同じである。
実施の形態6において、グループ毎に再学習が行われる。
生産設備では、特定箇所だけが改修されることが多い。そのため、状態検知システム100は、グループ毎に学習済みモデルの評価を実施し、精度を定期的に自動で確認する。そして、状態検知システム100は、特定のグループの精度が悪化した際に特定のグループだけを対象にして自動で再学習を行う。
実施の形態6により、設備全体に対して再学習する場合と比較して短時間での再学習が可能となる。
再学習は、実施の形態1の変形例と同じく、収集分割データを学習データにして行われてもよい。
悪化グループの特定が人手で行われてもよい。
利用者は、グループ別に誤検出率または検出漏れ率を評価して悪化グループを特定する。そして、利用者は、入力装置を操作して悪化グループを状態検知システム100に指定する。
モデル生成部110は、悪化グループの指定を受け付け、指定された悪化グループに対する再学習を行う。
図21に基づいて、状態検知システム100のハードウェア構成を説明する。
状態検知システム100は処理回路109を備える。
処理回路109は、モデル生成部110と状態検知部120とデータ解析部130と精度評価部140とを実現するハードウェアである。
処理回路109は、専用のハードウェアであってもよいし、メモリ102に格納されるプログラムを実行する処理回路109であってもよい。
ASICは、Application Specific Integrated Circuitの略称である。
FPGAは、Field Programmable Gate Arrayの略称である。
Claims (16)
- ワークが流される設備の状態を検知する状態検知システムであり、
前記ワークの流れに応じて順番に反応する複数の信号の複数の信号値を示す収集データを時系列に収集する収集部と、
時系列の前記収集データに含まれる前記信号値の集合を複数のグループに分けることによって、グループ内の1つ以上の信号値を時系列に示す収集分割データをグループ別に生成する分割部と、
グループ別に前記収集分割データを学習データにして機械学習を行うことによって、学習済みモデルである正常モデルをグループ別に生成する学習部と、
グループ別の前記正常モデルを用いて前記設備の状態を検知する状態検知部と、
を備える状態検知システム。 - 前記複数のグループの中の対象グループの前記正常モデルが、前記対象グループに対する1つ以上の説明変数と、前記対象グループの1つ前のグループである前グループに対する1つ以上の説明変数と、前記対象グループの1つ後のグループである後グループに対する1つ以上の説明変数と、を有し、
前記学習部は、前記対象グループと前記前グループと前記後グループのそれぞれの前記1つ以上の信号値をそれぞれのグループに対する前記1つ以上の説明変数に設定して前記機械学習を行うことによって、前記対象グループの前記正常モデルを生成する
請求項1に記載の状態検知システム。 - 前記分割部は、反応順番にしたがって前記複数のグループに分けられた前記複数の信号をグループ別に示すグループ情報データに基づいて、前記信号値の集合を前記複数のグループに分ける
請求項1または請求項2に記載の状態検知システム。 - 前記状態検知システムは、
時系列の前記収集データを解析することによって各グループに属する1つ以上の信号を決定し、各グループに属する1つ以上の信号を示すデータを前記グループ情報データとして生成するデータ解析部を備え、
前記データ解析部は、
前記設備において最初に反応する信号を、先頭のグループにおける先頭の信号に決定し、前記先頭のグループにおける前記先頭の信号が反応してから前記先頭のグループにおける前記先頭の信号が次に反応するまでの間に順番に反応する0または1つ以上の信号を、前記先頭のグループに属する信号に決定し、
1つ前のグループにおける最後の信号の次に反応する信号を、2番目以降の各グループにおける先頭の信号に決定し、
前記2番目以降の各グループにおける前記先頭の信号が反応してから前記2番目以降の各グループにおける前記先頭の信号が次に反応するまでの間に順番に反応する1つ以上の信号を、前記2番目以降の各グループに属する信号に決定する
請求項3に記載の状態検知システム。 - 前記データ解析部は、
前記ワークが前記設備に1つだけ流されている間の各時刻の複数の信号値を示す稼働データを収集し、
各時刻の前記稼働データを解析することによって、信号値が変化した信号の順番を前記複数の信号の前記反応順番として特定し、
前記複数の信号の前記反応順番を示すデータを信号順番データとして生成し、
各グループに属する信号を決定するときに、前記信号順番データを参照することによって前記複数の信号の前記反応順番を判定する
請求項4に記載の状態検知システム。 - 前記データ解析部は、
各グループに属する1つ以上の信号を決定した後にグループの数に基づいてグループを統合するか判定し、
グループを統合しないと判定した場合、グループを統合せずに、各グループに属する1つ以上の信号を示すデータを前記グループ情報データとして生成し、
グループを統合すると判定した場合、統合規則にしたがってグループを統合し、統合後の各グループに属する1つ以上の信号を示すデータを前記グループ情報データとして生成する
請求項4または請求項5に記載の状態検知システム。 - 前記状態検知部は、
前記複数の信号の複数の信号値を複数の実測値として示す実測データを取得し、
前記実測データの中の前記複数の実測値を前記複数のグループに分けることによって、グループ内の1つ以上の実測値を示す実測分割データをグループ別に生成し、
グループ別の前記正常モデルを用いて、グループ内の予測の1つ以上の信号値を1つ以上の予測値として示す予測データをグループ別に生成し、
グループ別に前記実測分割データを前記予測データと比較し、グループ別に比較結果データを生成し、
グループ別の前記比較結果データを統合して統合結果データを生成し、
前記統合結果データに基づいて前記設備の状態を検知する
請求項1に記載の状態検知システム。 - 前記複数のグループの中の対象グループの前記正常モデルが、前記対象グループに対する1つ以上の説明変数と、前記対象グループの1つ前のグループである前グループに対する1つ以上の説明変数と、前記対象グループの1つ後のグループである後グループに対する1つ以上の説明変数と、を有し、
前記学習部は、前記対象グループと前記前グループと前記後グループのそれぞれの前記1つ以上の信号値をそれぞれのグループに対する前記1つ以上の説明変数に設定して前記機械学習を行うことによって、前記対象グループの前記正常モデルを生成し、
前記状態検知部は、前記対象グループと前記前グループと前記後グループのそれぞれの前回の前記1つ以上の実測値をそれぞれのグループに対する前記1つ以上の説明変数に設定して前記対象グループの前記正常モデルを演算することによって、前記対象グループの前記1つ以上の予測値を算出する
請求項7に記載の状態検知システム。 - 前記分割部は、反応順番にしたがって複数のグループに分けられた前記複数の信号をグループ別に示すグループ情報データに基づいて、前記信号値の集合を前記複数のグループに分け、
前記状態検知部は、前記グループ情報データに基づいて、前記複数の実測値を前記複数のグループに分ける
請求項7または請求項8に記載の状態検知システム。 - 前記状態検知システムは、
時系列の前記収集データを解析することによって各グループに属する信号を決定し、各グループに属する信号を示すデータを前記グループ情報データとして生成するデータ解析部を備え、
前記データ解析部は、
前記設備において最初に反応する信号を、先頭のグループにおける先頭の信号に決定し、前記先頭のグループにおける前記先頭の信号が反応してから前記先頭のグループにおける前記先頭の信号が次に反応するまでの間に順番に反応する0または1つ以上の信号を、前記先頭のグループに属する信号に決定し、
1つ前のグループにおける最後の信号の次に反応する信号を、2番目以降の各グループにおける先頭の信号に決定し、
前記2番目以降の各グループにおける前記先頭の信号が反応してから前記2番目以降の各グループにおける前記先頭の信号が次に反応するまでの間に順番に反応する1つ以上の信号を、前記2番目以降の各グループに属する信号に決定する
請求項9に記載の状態検知システム。 - 前記データ解析部は、
前記ワークが前記設備に1つだけ流されている間の各時刻の複数の信号値を示す稼働データを収集し、
各時刻の前記稼働データを解析することによって、信号値が変化した信号の順番を前記複数の信号の前記反応順番として特定し、
前記複数の信号の前記反応順番を示すデータを信号順番データとして生成し、
各グループに属する信号を決定するときに、前記信号順番データを参照することによって前記複数の信号の前記反応順番を判定する
請求項10に記載の状態検知システム。 - 前記データ解析部は、
各グループに属する信号を決定した後にグループの数に基づいてグループを統合するか判定し、
グループを統合しないと判定した場合、グループを統合せずに、各グループに属する信号を示すデータを前記グループ情報データとして生成し、
グループを統合すると判定した場合、統合規則にしたがってグループを統合し、統合後の各グループに属する信号を示すデータを前記グループ情報データとして生成する
請求項10または請求項11に記載の状態検知システム。 - 前記状態検知システムは、精度評価部を備え、
前記状態検知部は、グループ別の前記比較結果データに基づいてグループ別に状態を検知し、正常状態のグループ別に前記比較結果データに基づいて前記1つ以上の予測値の異常度を算出し、正常状態のグループ別に前記異常度を示す異常度データを生成し、
前記精度評価部は、グループ別の前記異常度データに基づいて、精度が悪化したと推測される前記正常モデルに対応するグループを悪化グループとして特定し、
前記学習部は、前記悪化グループに対する前記機械学習を行うことによって、前記悪化グループの前記正常モデルを更新する
請求項7から請求項12のいずれか1項に記載の状態検知システム。 - 前記学習部は、精度が悪化したと推測される前記正常モデルに対応する悪化グループの指定を受け付け、前記悪化グループに対する前記機械学習を行うことによって前記悪化グループの前記正常モデルを更新する
請求項1から請求項6のいずれか1項に記載の状態検知システム。 - ワークが流される設備の状態を検知する状態検知方法であり、
前記ワークの流れに応じて順番に反応する複数の信号の複数の信号値を示す収集データを時系列に収集し、
時系列の前記収集データに含まれる前記信号値の集合を複数のグループに分けることによって、グループ内の1つ以上の信号値を時系列に示す収集分割データをグループ別に生成し、
グループ別に前記収集分割データを学習データにして機械学習を行うことによって、学習済みモデルである正常モデルをグループ別に生成し、
グループ別の前記正常モデルを用いて前記設備の状態を検知する
状態検知方法。 - ワークが流される設備の状態を検知するための状態検知プログラムであり、
前記ワークの流れに応じて順番に反応する複数の信号の複数の信号値を示す収集データを時系列に収集する収集処理と、
時系列の前記収集データに含まれる前記信号値の集合を複数のグループに分けることによって、グループ内の1つ以上の信号値を時系列に示す収集分割データをグループ別に生成する分割処理と、
グループ別に前記収集分割データを学習データにして機械学習を行うことによって、学習済みモデルである正常モデルをグループ別に生成する学習処理と、
グループ別の前記正常モデルを用いて前記設備の状態を検知する状態検知処理と、
をコンピュータに実行させるための状態検知プログラム。
Priority Applications (7)
| Application Number | Priority Date | Filing Date | Title |
|---|---|---|---|
| CN202180103200.8A CN118076931A (zh) | 2021-10-15 | 2021-10-15 | 状态检测系统、状态检测方法以及状态检测程序 |
| KR1020247011002A KR102764787B1 (ko) | 2021-10-15 | 2021-10-15 | 상태 검지 시스템, 상태 검지 방법 및 기록 매체에 저장된 상태 검지 프로그램 |
| JP2021574333A JP7055260B1 (ja) | 2021-10-15 | 2021-10-15 | 状態検知システム、状態検知方法および状態検知プログラム |
| PCT/JP2021/038283 WO2023062829A1 (ja) | 2021-10-15 | 2021-10-15 | 状態検知システム、状態検知方法および状態検知プログラム |
| DE112021008086.5T DE112021008086B4 (de) | 2021-10-15 | 2021-10-15 | Zustandserfassungssystem, zustandserfassungsverfahren und zustandserfassungsprogramm |
| TW111111317A TWI849392B (zh) | 2021-10-15 | 2022-03-25 | 狀態檢知系統、狀態檢知方法以及狀態檢知程式產品 |
| US18/585,794 US20240192095A1 (en) | 2021-10-15 | 2024-02-23 | State detection system, state detection method, and computer readable medium |
Applications Claiming Priority (1)
| Application Number | Priority Date | Filing Date | Title |
|---|---|---|---|
| PCT/JP2021/038283 WO2023062829A1 (ja) | 2021-10-15 | 2021-10-15 | 状態検知システム、状態検知方法および状態検知プログラム |
Related Child Applications (1)
| Application Number | Title | Priority Date | Filing Date |
|---|---|---|---|
| US18/585,794 Continuation US20240192095A1 (en) | 2021-10-15 | 2024-02-23 | State detection system, state detection method, and computer readable medium |
Publications (1)
| Publication Number | Publication Date |
|---|---|
| WO2023062829A1 true WO2023062829A1 (ja) | 2023-04-20 |
Family
ID=81289241
Family Applications (1)
| Application Number | Title | Priority Date | Filing Date |
|---|---|---|---|
| PCT/JP2021/038283 Ceased WO2023062829A1 (ja) | 2021-10-15 | 2021-10-15 | 状態検知システム、状態検知方法および状態検知プログラム |
Country Status (7)
| Country | Link |
|---|---|
| US (1) | US20240192095A1 (ja) |
| JP (1) | JP7055260B1 (ja) |
| KR (1) | KR102764787B1 (ja) |
| CN (1) | CN118076931A (ja) |
| DE (1) | DE112021008086B4 (ja) |
| TW (1) | TWI849392B (ja) |
| WO (1) | WO2023062829A1 (ja) |
Citations (4)
| Publication number | Priority date | Publication date | Assignee | Title |
|---|---|---|---|---|
| JP2019159728A (ja) * | 2018-03-12 | 2019-09-19 | 株式会社リコー | 診断装置、診断方法およびプログラム |
| JP6678824B2 (ja) * | 2017-06-30 | 2020-04-08 | 三菱電機株式会社 | 非定常検出装置、非定常検出システム、および非定常検出方法 |
| JP2021033961A (ja) * | 2019-08-29 | 2021-03-01 | 株式会社鈴康 | 動画生成プログラム、動画生成装置及び動画生成方法 |
| JP6865901B1 (ja) * | 2020-03-30 | 2021-04-28 | 三菱電機株式会社 | 診断システム、診断方法及びプログラム |
Family Cites Families (9)
| Publication number | Priority date | Publication date | Assignee | Title |
|---|---|---|---|---|
| JP2005121639A (ja) * | 2003-09-22 | 2005-05-12 | Omron Corp | 検査方法および検査装置ならびに設備診断装置 |
| JP6076421B2 (ja) | 2015-07-23 | 2017-02-08 | 株式会社日立パワーソリューションズ | 設備状態監視方法およびその装置 |
| JP6463518B2 (ja) * | 2016-02-08 | 2019-02-06 | 三菱電機株式会社 | コントローラおよび搬送システム |
| KR101827108B1 (ko) | 2016-05-04 | 2018-02-07 | 두산중공업 주식회사 | 플랜트 이상 감지 학습 시스템 및 방법 |
| US11300949B2 (en) * | 2017-08-11 | 2022-04-12 | Jtekt Corporation | Data processing device of production equipment |
| JP6879239B2 (ja) * | 2018-03-14 | 2021-06-02 | オムロン株式会社 | 異常検知システム、サポート装置およびモデル生成方法 |
| JP7134051B2 (ja) | 2018-10-01 | 2022-09-09 | 三菱電機株式会社 | 劣化検知システム |
| DE102019220609A1 (de) | 2019-12-30 | 2021-07-01 | Robert Bosch Gmbh | Zustandsüberwachung technischer Systeme anhand von Messgrößen |
| KR102497374B1 (ko) | 2020-03-03 | 2023-02-07 | 미쓰비시덴키 가부시키가이샤 | 비정상 검출 시스템, 비정상 검출 방법 및 기록 매체에 저장된 비정상 검출 프로그램 |
-
2021
- 2021-10-15 WO PCT/JP2021/038283 patent/WO2023062829A1/ja not_active Ceased
- 2021-10-15 DE DE112021008086.5T patent/DE112021008086B4/de active Active
- 2021-10-15 JP JP2021574333A patent/JP7055260B1/ja active Active
- 2021-10-15 KR KR1020247011002A patent/KR102764787B1/ko active Active
- 2021-10-15 CN CN202180103200.8A patent/CN118076931A/zh active Pending
-
2022
- 2022-03-25 TW TW111111317A patent/TWI849392B/zh active
-
2024
- 2024-02-23 US US18/585,794 patent/US20240192095A1/en active Pending
Patent Citations (4)
| Publication number | Priority date | Publication date | Assignee | Title |
|---|---|---|---|---|
| JP6678824B2 (ja) * | 2017-06-30 | 2020-04-08 | 三菱電機株式会社 | 非定常検出装置、非定常検出システム、および非定常検出方法 |
| JP2019159728A (ja) * | 2018-03-12 | 2019-09-19 | 株式会社リコー | 診断装置、診断方法およびプログラム |
| JP2021033961A (ja) * | 2019-08-29 | 2021-03-01 | 株式会社鈴康 | 動画生成プログラム、動画生成装置及び動画生成方法 |
| JP6865901B1 (ja) * | 2020-03-30 | 2021-04-28 | 三菱電機株式会社 | 診断システム、診断方法及びプログラム |
Also Published As
| Publication number | Publication date |
|---|---|
| CN118076931A (zh) | 2024-05-24 |
| TWI849392B (zh) | 2024-07-21 |
| DE112021008086B4 (de) | 2025-08-14 |
| US20240192095A1 (en) | 2024-06-13 |
| KR20240047487A (ko) | 2024-04-12 |
| KR102764787B1 (ko) | 2025-02-06 |
| TW202318125A (zh) | 2023-05-01 |
| DE112021008086T5 (de) | 2024-05-29 |
| JPWO2023062829A1 (ja) | 2023-04-20 |
| JP7055260B1 (ja) | 2022-04-15 |
Similar Documents
| Publication | Publication Date | Title |
|---|---|---|
| JP6636214B1 (ja) | 診断装置、診断方法及びプログラム | |
| US11163277B2 (en) | Abnormality detection system, support device, and model generation method | |
| KR102351538B1 (ko) | 패턴 학습 및 진단 알고리즘을 이용한 자동화 설비의 고장 예측 시스템 및 그 방법 | |
| US10317853B2 (en) | Machine learning method and machine learning device for learning fault conditions, and fault prediction device and fault prediction system including the machine learning device | |
| Wang et al. | Fault detection and diagnosis for multiple faults of VAV terminals using self-adaptive model and layered random forest | |
| JP2025071343A5 (ja) | ||
| US20170293862A1 (en) | Machine learning device and machine learning method for learning fault prediction of main shaft or motor which drives main shaft, and fault prediction device and fault prediction system including machine learning device | |
| US10684608B2 (en) | Abnormality detection apparatus and machine learning device | |
| US8448025B2 (en) | Fault analysis apparatus, fault analysis method, and recording medium | |
| US20120296606A1 (en) | Method, computer program, and system for performing interpolation on sensor data for high system availability | |
| JP2021015573A (ja) | 異常判定装置及び異常判定システム | |
| TWI861824B (zh) | 異常診斷方法、異常診斷裝置以及異常診斷程式 | |
| JP6790311B1 (ja) | 非定常検出システム、非定常検出方法および非定常検出プログラム | |
| JP6854995B1 (ja) | 学習システム、学習方法及びプログラム | |
| US20210080924A1 (en) | Diagnosis Method and Diagnosis System for a Processing Engineering Plant and Training Method | |
| JP7151312B2 (ja) | 制御システム | |
| CN113646786A (zh) | 信号选择装置、学习装置、信号选择方法及程序 | |
| JP7055260B1 (ja) | 状態検知システム、状態検知方法および状態検知プログラム | |
| JP2019164762A (ja) | 情報処理装置,機械学習装置及びシステム | |
| US20220188570A1 (en) | Learning apparatus, learning method, computer program and recording medium | |
| JP2013200245A (ja) | 前処理方法 | |
| JP7639574B2 (ja) | 予測システム、情報処理装置および情報処理プログラム | |
| JP2023142779A (ja) | 精度監視システム、精度監視方法、および、精度監視プログラム | |
| EP4379618A1 (en) | Computer implemented method for determining a quality result for input data of a data model | |
| CN116662105A (zh) | 一种云盘异常检测方法、系统、电子设备及存储介质 |
Legal Events
| Date | Code | Title | Description |
|---|---|---|---|
| WWE | Wipo information: entry into national phase |
Ref document number: 2021574333 Country of ref document: JP |
|
| 121 | Ep: the epo has been informed by wipo that ep was designated in this application |
Ref document number: 21960682 Country of ref document: EP Kind code of ref document: A1 |
|
| ENP | Entry into the national phase |
Ref document number: 20247011002 Country of ref document: KR Kind code of ref document: A |
|
| WWE | Wipo information: entry into national phase |
Ref document number: 202180103200.8 Country of ref document: CN |
|
| WWE | Wipo information: entry into national phase |
Ref document number: 202447029942 Country of ref document: IN |
|
| 122 | Ep: pct application non-entry in european phase |
Ref document number: 21960682 Country of ref document: EP Kind code of ref document: A1 |
|
| WWG | Wipo information: grant in national office |
Ref document number: 112021008086 Country of ref document: DE |