WO2023008428A1 - 細胞画像解析方法 - Google Patents
細胞画像解析方法 Download PDFInfo
- Publication number
- WO2023008428A1 WO2023008428A1 PCT/JP2022/028777 JP2022028777W WO2023008428A1 WO 2023008428 A1 WO2023008428 A1 WO 2023008428A1 JP 2022028777 W JP2022028777 W JP 2022028777W WO 2023008428 A1 WO2023008428 A1 WO 2023008428A1
- Authority
- WO
- WIPO (PCT)
- Prior art keywords
- cell
- cell image
- image
- value
- probability
- Prior art date
- Legal status (The legal status is an assumption and is not a legal conclusion. Google has not performed a legal analysis and makes no representation as to the accuracy of the status listed.)
- Ceased
Links
Images








Classifications
-
- G—PHYSICS
- G06—COMPUTING OR CALCULATING; COUNTING
- G06T—IMAGE DATA PROCESSING OR GENERATION, IN GENERAL
- G06T7/00—Image analysis
-
- C—CHEMISTRY; METALLURGY
- C12—BIOCHEMISTRY; BEER; SPIRITS; WINE; VINEGAR; MICROBIOLOGY; ENZYMOLOGY; MUTATION OR GENETIC ENGINEERING
- C12M—APPARATUS FOR ENZYMOLOGY OR MICROBIOLOGY; APPARATUS FOR CULTURING MICROORGANISMS FOR PRODUCING BIOMASS, FOR GROWING CELLS OR FOR OBTAINING FERMENTATION OR METABOLIC PRODUCTS, i.e. BIOREACTORS OR FERMENTERS
- C12M1/00—Apparatus for enzymology or microbiology
- C12M1/34—Measuring or testing with condition measuring or sensing means, e.g. colony counters
-
- C—CHEMISTRY; METALLURGY
- C12—BIOCHEMISTRY; BEER; SPIRITS; WINE; VINEGAR; MICROBIOLOGY; ENZYMOLOGY; MUTATION OR GENETIC ENGINEERING
- C12Q—MEASURING OR TESTING PROCESSES INVOLVING ENZYMES, NUCLEIC ACIDS OR MICROORGANISMS; COMPOSITIONS OR TEST PAPERS THEREFOR; PROCESSES OF PREPARING SUCH COMPOSITIONS; CONDITION-RESPONSIVE CONTROL IN MICROBIOLOGICAL OR ENZYMOLOGICAL PROCESSES
- C12Q1/00—Measuring or testing processes involving enzymes, nucleic acids or microorganisms; Compositions therefor; Processes of preparing such compositions
- C12Q1/02—Measuring or testing processes involving enzymes, nucleic acids or microorganisms; Compositions therefor; Processes of preparing such compositions involving viable microorganisms
-
- G—PHYSICS
- G06—COMPUTING OR CALCULATING; COUNTING
- G06T—IMAGE DATA PROCESSING OR GENERATION, IN GENERAL
- G06T7/00—Image analysis
- G06T7/0002—Inspection of images, e.g. flaw detection
- G06T7/0012—Biomedical image inspection
-
- G—PHYSICS
- G06—COMPUTING OR CALCULATING; COUNTING
- G06T—IMAGE DATA PROCESSING OR GENERATION, IN GENERAL
- G06T7/00—Image analysis
- G06T7/10—Segmentation; Edge detection
- G06T7/143—Segmentation; Edge detection involving probabilistic approaches, e.g. Markov random field [MRF] modelling
-
- G—PHYSICS
- G06—COMPUTING OR CALCULATING; COUNTING
- G06T—IMAGE DATA PROCESSING OR GENERATION, IN GENERAL
- G06T2207/00—Indexing scheme for image analysis or image enhancement
- G06T2207/10—Image acquisition modality
- G06T2207/10056—Microscopic image
-
- G—PHYSICS
- G06—COMPUTING OR CALCULATING; COUNTING
- G06T—IMAGE DATA PROCESSING OR GENERATION, IN GENERAL
- G06T2207/00—Indexing scheme for image analysis or image enhancement
- G06T2207/20—Special algorithmic details
- G06T2207/20076—Probabilistic image processing
-
- G—PHYSICS
- G06—COMPUTING OR CALCULATING; COUNTING
- G06T—IMAGE DATA PROCESSING OR GENERATION, IN GENERAL
- G06T2207/00—Indexing scheme for image analysis or image enhancement
- G06T2207/20—Special algorithmic details
- G06T2207/20081—Training; Learning
-
- G—PHYSICS
- G06—COMPUTING OR CALCULATING; COUNTING
- G06T—IMAGE DATA PROCESSING OR GENERATION, IN GENERAL
- G06T2207/00—Indexing scheme for image analysis or image enhancement
- G06T2207/20—Special algorithmic details
- G06T2207/20084—Artificial neural networks [ANN]
-
- G—PHYSICS
- G06—COMPUTING OR CALCULATING; COUNTING
- G06T—IMAGE DATA PROCESSING OR GENERATION, IN GENERAL
- G06T2207/00—Indexing scheme for image analysis or image enhancement
- G06T2207/30—Subject of image; Context of image processing
- G06T2207/30004—Biomedical image processing
- G06T2207/30024—Cell structures in vitro; Tissue sections in vitro
Definitions
- This invention relates to a cell image analysis method, and more particularly to a cell analysis method for analyzing cells using a learned model.
- International Publication No. 2019/171546 discloses a cell image analysis method for analyzing a cell image captured by an imaging device. Specifically, International Publication No. 2019/171546 discloses a configuration for acquiring a cell image by photographing cells cultured in a culture plate with an imaging device such as a microscope. In addition, the cell image analysis method disclosed in International Publication No. 2019/171546 uses the analysis results of the trained model to classify whether the cells appearing in the cell image are normal cells or abnormal cells. . Further, International Publication No. 2019/171546 discloses a configuration for classifying cells by segmentation processing for determining which category each pixel belongs to for each pixel of a cell image.
- the present invention has been made to solve the above problems, and one object of the present invention is to provide a cell image analysis method capable of easily grasping the accuracy of classification of cells reflected in a cell image. is to provide
- a cell image analysis method comprises a step of acquiring a cell image showing cells, and a trained model trained to classify cells into two or more types and a step of inputting a cell image to the cell image, and based on the analysis result of each pixel of the cell image output by the trained model, the cell appearing in the cell image is any of two or more types of classification a step of acquiring an index value representing the accuracy; and a step of displaying the acquired index value.
- the cell image analysis method in the above one aspect based on the analysis result of each pixel of the cell image output by the trained model, the cell image is classified into any of two or more types. and a step of displaying the obtained index value. As a result, an index value representing the accuracy of which of the two or more types of classification the cell in the cell image belongs to is displayed. By checking the index value, the operator can It is possible to easily grasp the accuracy of classification of cells reflected in the cell image. As a result, it is possible to provide a cell image analysis method that makes it possible to easily grasp the accuracy of classification of cells appearing in a cell image.
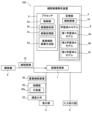
- FIG. 1 is a schematic diagram showing the overall configuration of a cell image analysis device according to one embodiment;
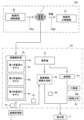
- FIG. It is a schematic diagram for explaining a cell image.
- FIG. 3 is a schematic diagram for explaining cells cultured in a culture vessel;
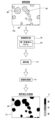
- FIG. 4 is a schematic diagram for explaining a method of learning a learning model and a method of analyzing a cell image using a learned model according to one embodiment;
- 7A to 7C are schematic diagrams for explaining differences in cell images due to different imaging conditions;
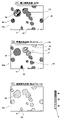
- FIG. FIG. 4 is a schematic diagram for explaining a configuration in which an image processing unit according to one embodiment generates a probability distribution image;
- 4A to 4C are schematic diagrams for explaining a superimposed cell image generated by a superimposed cell image generating unit according to one embodiment;
- FIG. 4 is a schematic diagram for explaining differences in numerical data of representative values of probability values due to differences in focus of cell images.
- FIG. 10 is a schematic diagram for explaining a configuration for displaying a frequency distribution of probability values when a cell image is in focus;
- FIG. 10 is a schematic diagram for explaining a configuration for displaying a frequency distribution of probability values when a cell image is out of focus;
- FIG. 4 is a schematic diagram for explaining a configuration in which a cell analysis device according to one embodiment displays a superimposed cell image, a representative value of probability values, and a frequency distribution.
- 4A and 4B are schematic diagrams for explaining differences in superimposed cell images due to differences in coating agents of culture vessels for culturing cells.
- FIG. 5 is a schematic diagram for explaining differences in numerical data of representative values of probability values due to differences in coating agents.
- 7A to 7D are schematic diagrams (A) to (D) for explaining differences in superimposed cell images due to differences in the number of days in which cells are cultured.
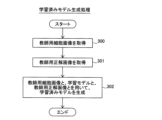
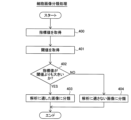
- FIG. FIG. 4 is a schematic diagram for explaining differences in numerical data of representative values of probability values due to differences in the number of days of cell culture. 4 is a flow chart for explaining a process of displaying an index value, a frequency distribution, and a superimposed cell image by a cell image analysis device according to one embodiment; 4 is a flow chart for explaining processing for generating a learned model by the cell image analysis device according to one embodiment. 4 is a flow chart for classifying cell images by the cell image analysis device according to one embodiment.
- the cell image analysis apparatus 100 includes an image acquisition unit 1, a processor 2, a storage unit 3, a display unit 4, and an input reception unit 5, as shown in FIG.
- the image acquisition unit 1 is configured to acquire a cell image 10.
- the cell image 10 is an image showing cells 90 (see FIG. 2).
- the cell image 10 is an image of cultured cells 90 cultured in a culture solution 81 (see FIG. 3) filled in a culture vessel 80 (see FIG. 3).
- the image acquisition unit 1 is configured to acquire the cell image 10 from a device for capturing the cell image 10, such as a microscope 8 to which an imaging device is attached.
- Image acquisition unit 1 includes, for example, an input/output interface.
- the processor 2 is configured to analyze the acquired cell image 10.
- the processor 2 includes a CPU (Central Processing Unit), a ROM (Read Only Memory), a RAM (Random Access Memory), a GPU (Graphics Processing Unit), or an FPGA (Field-Programmable Gate Array) configured for image processing. contains.
- the processor 2 including a CPU as hardware includes, as functional blocks of software (programs), a control unit 2a, an image analysis unit 2b, an image processing unit 2c, and a superimposed cell image generation unit 2d. .
- the processor 2 functions as a control unit 2a, an image analysis unit 2b, an image processing unit 2c, and a superimposed cell image generation unit 2d.
- the control unit 2a, the image analysis unit 2b, the image processing unit 2c, and the superimposed cell image generation unit 2d may be individually configured by hardware by providing a dedicated processor (processing circuit).
- the control unit 2a is configured to control the cell image analysis device 100.
- the control unit 2a is also configured to acquire an index value 20 representing the degree of certainty as to which of two or more types the cell 90 appearing in the cell image 10 belongs to.
- the control unit 2a is configured to obtain, as the index value 20, a representative value 20a of the probability values 21 obtained based on the probability values 21 (see FIG. 4) output by the trained model 6.
- the index value 20 is a real number representing the degree of certainty of which of two or more types the cell 90 captured in the cell image 10 belongs to.
- the index value 20 is a numerical value in the range of 0-100.
- the control unit 2a outputs one index value 20 for one cell image 10.
- control unit 2a determines whether the cell image 10 is in focus when photographed, whether the coating agent for the culture vessel 80 (see FIG. 3) is appropriate, and the number of days of culture. is appropriate or not, at least one of the index values 20 is acquired.
- the probability value 21 is an estimated value of the classification output by the trained model 6 as an analysis result.
- the learned model 6 outputs a probability value 21 for each pixel of the cell image 10 as an analysis result.
- control unit 2a is configured to perform control to display the superimposed cell image 50 on the display unit 4. Details of the configuration for the control unit 2a to acquire the index value 20 and the details of the superimposed cell image 50 will be described later.
- the image analysis unit 2b classifies the cells 90 (see FIG. 2) into two or more types. Specifically, it is configured to classify the cells 90 appearing in the cell image 10 into two or more types using the trained model 6 that has learned to classify the cells 90 into two or more types.
- the trained model 6 includes a first trained model 6a, a second trained model 6b, and a third trained model 6c that classify for each imaging condition and culture condition, which will be described later. The details of the normal cells, the abnormal cells, the first trained model 6a, the second trained model 6b, and the third trained model 6c will be described later.
- the image processing unit 2c is configured to generate a probability distribution image 12 (see FIG. 6), which will be described later.
- the image processing unit 2 c is also configured to acquire a cell region, which is the region of the cells 90 appearing in the cell image 10 , based on the probability distribution image 12 . Details of the configuration for generating the probability distribution image 12 and the configuration for acquiring the cell region by the image processing unit 2c will be described later.
- the superimposed cell image generation unit 2d is configured to generate a superimposed cell image 50 in which the distribution of the probability values 21 (see FIG. 4) is superimposed on the cell image 10.
- the details of the configuration for generating the superimposed cell image 50 by the superimposed cell image generation unit 2d will be described later.
- the storage unit 3 is configured to store the cell image 10, the first trained model 6a, the second trained model 6b, and the third trained model 6c. Further, the storage unit 3 is configured to store various programs executed by the processor 2 .
- the storage unit 3 includes, for example, a storage device such as an HDD (Hard Disk Drive) or an SSD (Solid State Drive).
- the display unit 4 is configured to display the superimposed cell image 50 generated by the superimposed cell image generation unit 2d, the index value 20, the frequency distribution 22, and the like.
- Display unit 4 includes, for example, a display device such as a liquid crystal monitor.
- the input reception unit 5 is configured to be able to receive operation input by the operator.
- Input reception unit 5 includes an input device such as a mouse and a keyboard.
- a cell image 10 is an image in which a cultured cell 90 is captured.
- the cell image 10 is a microscopic image captured by a microscope 8 to which an imaging device is attached.
- a cell image 10 is an image of a cell 90 having differentiation potential as a cultured cell 90 .
- the cells 90 include iPS cells (induced pluripotent stem cells), ES cells (embryonic stem cells), and the like.
- an undifferentiated cell is a cell which has differentiation ability.
- undifferentiated deviant cells are cells that have started to differentiate into specific cells and do not have differentiation potential. In this embodiment, undifferentiated cells are defined as normal cells. Also, undifferentiated deviant cells are defined as abnormal cells.
- cells 90 are cultured cells cultured in culture solution 81 filled in culture container 80 .
- the cell image 10 is an image including cultured cells 90 cultured in the culture container 80 .
- a coating agent for culturing the cells 90 is applied to the bottom surface 80 a of the culture vessel 80 .
- the coating agent contains proteins and the like necessary for the cells 90 to settle in the culture container 80 .
- the cell image analysis apparatus 100 analyzes the cell image 10 to classify the cells 90 appearing in the cell image 10 into two or more types.
- the cell image analysis apparatus 100 analyzes the cell image 10 using the learned model 6 (see FIG. 1) to determine whether the cell 90 in the cell image 10 is one of two or more types. Determine which category it is.
- the trained model 6 outputs a probability value 21 for each pixel of the cell image 10 by inputting the cell image 10 .
- the probability value 21 is an estimate of the classification.
- FIG. 4 is a block diagram showing the flow of image processing according to this embodiment.
- the cell image analysis method is broadly divided into an image analysis method 101 and a trained model 6 (see FIG. 1) generation method 102 .
- a method 102 for generating a trained model 6 generates a trained model 6 by having the learning model 7 learn using the cell image 10 .
- the trained model 6 is generated by learning so as to output a probability value 21 for each pixel of the cell image 10 as an analysis result.
- the method 102 for generating the trained model 6 includes a step 102a of inputting a teacher cell image 30 to the learning model 7 and causing the learning model 7 to output a correct teacher image 31. and Step 102b for learning.
- the trained model 6 is, for example, a convolutional neural network (CNN) shown in FIG. 4, or includes a convolutional neural network as part thereof.
- the learned model 6 generated by learning the learning model 7 is stored in the storage unit 3 ( FIG. 1 ) of the cell image analysis device 100 .
- the trained model 6 determines whether the cell image 10 is in focus, whether the coating agent for the culture vessel 80 is appropriate, and whether the number of days of culture is appropriate. It is created by learning to classify at least one of no.
- a method 102 for generating a trained model 6 includes labeling the teacher cell image 30, which is the cell image 10, and the cell image 10 with at least two types of imaging conditions corresponding to the classification, or A learned model 6 is generated using the correct teacher image 31 with label values associated with at least two corresponding culture conditions.
- the trained model 6 includes a first trained model 6a, a second trained model 6b, and a third trained model 6c.
- the first trained model 6a is based on the cell image 10, and the cells 90 appearing in the cell image 10 are photographed under two or more types of photographing conditions. It is a trained model that has learned to classify whether it is an image. That is, the teacher cell images 30 used to generate the first trained model 6a are the cell images 10 obtained under different imaging conditions.
- the teacher correct image 31 is an image to which each pixel is assigned a different label value depending on the difference in imaging conditions.
- the teacher correct image 31 is an image in which label values of two or more types of imaging conditions are attached to each pixel.
- the imaging condition is whether or not the cell image 10 (teacher cell image 30) is in focus. Therefore, the teacher correct image 31 is an image in which a focused label value and an out-of-focus label value when photographing the cell image 10 are attached to each pixel. That is, the teacher correct image 31 is an image divided into two classes, a focused class and an out-of-focus class.
- the first trained model 6a is generated by having the learning model 7 learn to classify each pixel of the input image into one of two or more types under the shooting conditions. do.
- the second trained model 6b and the third trained model 6c are images in which the cells 90 in the cell image 10 are cultured under two or more types of culture conditions based on the cell image 10. It is a trained model that has learned to classify Specifically, when generating the second trained model 6b and the third trained model 6c, cell images 10 with different culture conditions are used as teacher cell images 30.
- FIG. Also, as the teacher correct image 31, an image is used in which each pixel is labeled with a different label value depending on the culture condition. Specifically, the teacher correct image 31 is an image in which label values of two or more types of culture conditions are attached to each pixel.
- the culture conditions include differences in the coating agents of the culture vessels 80 (see FIG. 3) in which the cells 90 are cultured and differences in the number of days the cells 90 are cultured.
- the teacher correct image 31 to which at least two types of label values regarding the coating agent of the culture container 80 in which the cells 90 are cultured is attached.
- the label value indicating that the coating agent of the culture container 80 in which the cells 90 are cultured is the coating agent A and the label value that is not the coating agent A are assigned to each pixel.
- the correct image 31 for teacher is an image divided into two classes, a class of coating agent A and a class of coating agent B.
- the teacher correct image 31 to which at least two types of label values regarding the number of culture days of the cells 90 are attached is used.
- a label value indicating that the number of culture days of the cell 90 is a predetermined number of days and a label value not The attached image is used as the correct image 31 for teacher.
- the predetermined number of culture days is, for example, 5 days. That is, the teacher correct image 31 is an image divided into two classes, a class with 5 days of culture and a class with a number of days other than 5 days of culture.
- the trained model 6 is suitable for analyzing whether the cell 90 is a normal cell or an abnormal cell by performing two or more types of classification under imaging conditions or culture conditions. It is created by learning to classify whether or not there is. In addition, in the present embodiment, the trained model 6 is created by learning to classify whether cells 90 of the same type are suitable for analysis as to whether they are normal cells or abnormal cells. there is
- the image analysis method 101 classifies which of two or more types the cells 90 appearing in the cell image 10 acquired by the image acquisition unit 1 from the microscope 8 (see FIG. 1) are. It is an image analysis method.
- the image analysis method 101 according to the present embodiment includes the steps of acquiring a cell image 10 showing a cell 90 (see FIG. 2), inputting the cell image 10 to the trained model 6, and a step of acquiring an index value 20 representing the accuracy of which of two or more types the cell 90 shown in the cell image 10 belongs to, based on the analysis result of each pixel of the cell image 10; and displaying the index value 20 obtained. Detailed processing of each step of the image analysis method 101 will be described later.
- the step of acquiring the cell image 10 is performed by the image acquisition unit 1.
- the image acquisition unit 1 acquires a cell image 10 from an image capturing device such as a microscope 8 (see FIG. 1).
- the image acquisition unit 1 also outputs the acquired cell image 10 to the image analysis unit 2b.
- the image acquisition unit 1 also outputs the acquired cell image 10 to the superimposed cell image generation unit 2d.
- the step of analyzing the cell image 10 is performed by the image analysis unit 2b.
- the image analysis unit 2 b acquires the index value 20 by inputting the cell image 10 to the trained model 6 . Specifically, the image analysis unit 2b inputs the cell image 10 to any one of the first trained model 6a, the second trained model 6b, and the third trained model 6c, so that the index value 20 is get. Whether the image analysis unit 2b analyzes using the first trained model 6a, the second trained model 6b, or the third trained model 6c is determined by the control unit 2a.
- the image analysis unit 2b also outputs the acquired index value 20 to the control unit 2a and the superimposed cell image generation unit 2d. Specifically, the image analysis unit 2b outputs the probability value 21 as the index value 20 to the control unit 2a and the superimposed cell image generation unit 2d.
- the control unit 2a determines whether analysis is to be performed using the first trained model 6a, the second trained model 6b, or the third trained model 6c based on the operation input by the operator. judge. Specifically, the control unit 2a analyzes the cell image 10 using the first trained model 6a or the second trained model 6b based on an operation input indicating under which conditions the analysis is to be performed. It is determined whether to perform the analysis or to perform the analysis by the third trained model 6c.
- the control unit 2a acquires the representative value 20a of the probability value 21.
- the control unit 2a obtains one representative value 20a for one cell image 10 based on the probability value 21 obtained for each pixel of the cell image 10.
- FIG. in this embodiment, the control unit 2a is configured to acquire the average value of the probability values 21 as the representative value 20a.
- control unit 2a acquires the frequency distribution 22 of the probability value 21. Further, the control unit 2a causes the display unit 4 to display the acquired representative value 20a and the frequency distribution 22. FIG. The details of the configuration in which the control unit 2a acquires the representative value 20a and the frequency distribution 22 will be described later.
- the superimposed cell image generation unit 2d generates a superimposed cell image 50 based on the cell image 10 and the index value 20. Also, the superimposed cell image generation unit 2 d causes the display unit 4 to display the generated superimposed cell image 50 .
- differences in cell images 10 due to differences in imaging conditions will be described. In the present embodiment, whether the cell image 10 is in focus or not is the difference in the imaging conditions.
- the cell images 10a to 10c shown in FIGS. 5A to 5C were taken at the same location in the culture vessel 80 (see FIG. 3) with different focal positions.
- the cell image 10a shown in FIG. 5(A) is the cell image 10 in focus. That is, the cell image 10a is an image in which the contrast of the cells 90 is high. In other words, the cell image 10a is an image in which the outline of the cell 90 is clear. Note that an image in focus does not mean that all the cells 90 appearing in the cell image 10 are in focus, but means that the central portion of the cell image 10 is in focus. That is, the focus of the cells 90 captured in the cell image 10a is not uniform, and the degree of defocus increases as the distance from the center of the image increases. That is, there may be cells 90 out of focus in the cell image 10a.
- a cell image 10b shown in FIG. 5(B) is an out-of-focus cell image 10. That is, the cell image 10b shown in FIG. 5B is an image of the cells 90 with low contrast. In other words. The cell image 10b is an image in which the contours of the cells 90 are unclear. Further, the cell image 10b is an image in which the degree of out-of-focus (the degree of defocus) is smaller than that of the cell image 10c shown in FIG. 5(C). Note that “defocus ⁇ 1” marked in FIG. 5(B) indicates that the degree of defocus of the cell image 10b is smaller than that of the cell image 10c shown in FIG. 5(C). . Also, in the cell image 10b shown in FIG.
- the outline of the cell 90 is indicated by a dashed line to indicate that the focus has shifted. Also, in the cell image 10b shown in FIG. 5B, the focus of the cells 90 in the image is not uniform, and the degree of defocus increases as the distance from the center of the image increases.
- a cell image 10c shown in FIG. 5(C) is an out-of-focus cell image 10. That is, the cell image 10c shown in FIG. 5C is an image of the cells 90 with low contrast. In other words, the cell image 10c is an image in which the contours of the cells 90 are unclear. Further, the cell image 10c is an image in which the degree of out-of-focus (the degree of defocus) is larger than that of the cell image 10b. That is, the cell image 10c is an image in which the contours of the cells 90 are less clear. Note that "defocus -2" marked in FIG. 5(C) indicates that the degree of defocus of the cell image 10c is larger than that of the cell image 10b shown in FIG. 5(B).
- the outline of the cell 90 is not shown, indicating that the cell image 10c is out of focus as compared with the cell image 10b. Also, in the cell image 10b shown in FIG. 5B, the focus of the cells 90 in the image is not uniform, and the degree of defocus increases as the distance from the center of the image increases.
- the image analysis unit 2b uses the first trained model 6a to classify which of two or more types the cells 90 appearing in the cell images 10a to 10c belong to.
- the image analysis unit 2b inputs the cell images 10a to 10c to the first trained model 6a, and based on the probability value 21 output from the first trained model 6a, the probability A distribution image 12 is generated.
- the image analysis unit 2b acquires the probability value 21 by inputting the in-focus cell image 10a to the first trained model 6a. That is, in the example shown in FIG. 6, the image analysis unit 2b acquires the probability value 21 for each pixel of the cell image 10a. The image analysis unit 2b also outputs the acquired probability value 21 to the image processing unit 2c. In the example shown in FIG. 6, the image analysis unit 2b acquires, as the probability value 21, the estimated value of the class in which each pixel of the cell image 10 is in focus.
- the image processing unit 2c generates a probability distribution image 12, which is an image showing the distribution of probability values 21.
- the probability distribution image 12 is an image in which probability values 21, which are estimated values of classification, are distributed as pixel values.
- the probability distribution image 12 shown in FIG. 6 is an image representing the distribution of the probability values 21 that are estimated values of the class in which each pixel of the cell image 10 is in focus.
- the difference in the probability value 21 is represented by the difference in hatching.
- the probability value 21 increases in the order of black, dark hatching, and light hatching. Further, as shown in legend 8, one hatching does not indicate one probability value 21, but one hatching is attached to each probability value 21 within a predetermined range.
- the image analysis unit 2b inputs the cell image 10 to the first trained model 6a to obtain the probability value 21 which is the estimated value of the out-of-focus class.
- a probability distribution image 12 showing the distribution of is also obtained.
- the image processing unit 2c also processes the out-of-focus cell image 10b (see FIG. 5) and the cell image 10c (see FIG. 5) in the same manner as the probability distribution image 12 of the in-focus class and the focus obtain the probability distribution image 12 of the class that does not match.
- the superimposed cell image generator 2 d generates a superimposed cell image 50 based on the cell image 10 and the probability distribution image 12 . Specifically, the superimposed cell image generation unit 2d generates the superimposed cell image 50 using the cell image 10 and the probability distribution image 12 acquired for each of at least two types of label values.
- the superimposed cell image generation unit 2d generates a superimposed cell image 50 by superimposing on the cell image 10 labels that can identify differences in the probability values 21.
- the superimposed cell image generation unit 2d superimposes mutually identifiable labels on the probability values 21 of the label values of two or more types of classification.
- the superimposed cell image generation unit 2d superimposes mutually identifiable labels on the probability values 21 of the label values of two or more types of imaging conditions. More specifically, the superimposed cell image generating unit 2d creates labels that are mutually identifiable as the probability value 21 of the label value that is in focus and the probability value 21 of the label value that is out of focus.
- the superimposed cell image generator 2d superimposes a blue label 51 on the probability value 21 of the label value in focus. Also, the superimposed cell image generation unit 2d superimposes a red label 52 on the probability value 21 of the label value that is out of focus.
- blue markers 51 are represented by hatching with the smallest spacing.
- red markers 52 are indicated by hatching with the widest spacing.
- a superimposed cell image 50a shown in FIG. 7(A) is obtained by inputting the cell image 10a (see FIG. 5(A)) in focus to the first trained model 6a. It is an image in which the distribution of the probability value 21 is superimposed.
- a superimposed cell image 50b shown in FIG. 7B is obtained by inputting the out-of-focus cell image 10b (see FIG. 5B) into the first trained model 6a. It is an image in which the distribution of the obtained probability values 21 is superimposed.
- a superimposed cell image 50c shown in FIG. 7C is obtained by inputting the out-of-focus cell image 10c (see FIG. 5C) into the first trained model 6a. It is an image in which the distribution of the obtained probability values 21 is superimposed.
- FIG. 7C is obtained by inputting the out-of-focus cell image 10c (see FIG. 5C) into the first trained model 6a. It is an image in which the distribution of the obtained probability values 21 is superimposed.
- a blue marker 51 is superimposed on the probability value 21 of being in focus.
- a red marker 52 is superimposed on the out-of-focus probability value 21 . Therefore, in the example shown in FIG. 7, in a region where the probability value 21 of being in focus and the probability value 21 of being out of focus are mixed, the gradation mark 53 of blue and red is superimposed. Is displayed. In addition, in the example shown in FIG. 7, as shown in legend 9, the blue-red gradation mark 53 is indicated by hatching at medium intervals.
- the in-focus superimposed cell image 50a there are many regions where blue markers 51 are superimposed, indicating that the probability value of the in-focus is 21. Also, in the superimposed cell image 50c, which is most out of focus, there are many regions superimposed with red markers 52 indicating that the out-of-focus probability value 21 is high. In addition, in the superimposed cell image 50b with a smaller focus shift than in the superimposed cell image 50c, the area where the blue label 51 is superimposed is the largest, followed by the area where the gradation-like label 53 of blue and red is superimposed. many in Moreover, in the superimposed cell image 50b, there is also a region where the red marker 52 is superimposed.
- the control unit 2a is configured to acquire a representative value 20a of the probability values 21.
- the control unit 2 a is configured to acquire numerical data of the representative value 20 a of the probability values 21 . That is, in this embodiment, the control unit 2a is configured to acquire one representative value 20a from the probability values 21 acquired for each pixel of the cell image 10a. Further, in the present embodiment, the control unit 2a is configured to acquire the representative value 20a of the probability values 21 in the cell region as the representative value 20a of the probability values 21.
- control unit 2a acquires the representative value 20a based on the probability value 21 of the label value for one of the two or more types of imaging conditions. Specifically, the control unit 2a acquires the representative value 20a based on the probability value 21 of the label value in focus. That is, the control unit 2a acquires the representative value 20a based on the probability value 21 of the label value suitable for analyzing whether the cell is normal or abnormal.
- the control unit 2a acquires a graph collectively displaying numerical data of a plurality of representative values 20a, as shown in the graph 40a.
- the horizontal axis indicates the defocus for each cell image 10
- the vertical axis indicates the representative value 20a. That is, the horizontal axis "0" in the graph 40a represents the focused cell image 10a. Further, the horizontal axis "-1" in the graph 40a represents the out-of-focus cell image 10b. Further, the horizontal axis "-2" in the graph 40a represents the out-of-focus cell image 10c.
- the representative value 20a becomes smaller as the focus shifts.
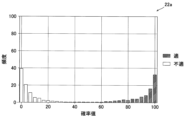
- a frequency distribution 22a shown in FIG. 9 is a frequency distribution obtained based on the probability value 21 of the focused cell image 10a.
- the frequency distribution 22a has the probability value 21 on the horizontal axis and the frequency on the vertical axis. That is, the frequency distribution 22a is a graph of the frequency of the probability values 21 in each pixel of the cell image 10a (see FIG. 5).
- the probability value 21 of the label value of the first type among the two or more types is hatched. That is, in the frequency distribution 22a, the probability values 21 of the focused class are hatched.
- the probability value 21 of the label value of the second type different from the first type among the two or more types is shown in white without hatching. That is, in the frequency distribution 22a, the probability value 21 of the out-of-focus class is shown in white.
- the frequency distribution 22a of the in-focus cell image 10a has a high frequency of pixels with a high probability value 21 in the in-focus class. will be distributed. Further, in the frequency distribution 22a of the in-focus cell image 10a, since the frequency of pixels with low probability values 21 in the out-of-focus class is also high, many pixels are distributed on the left side of the frequency distribution 22a. .
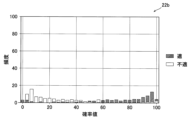
- a frequency distribution 22b shown in FIG. 10 is a frequency distribution acquired based on the probability values 21 of the out-of-focus cell image 10b.
- the frequency distribution 22b has the probability value 21 on the horizontal axis and the frequency on the vertical axis. That is, the frequency distribution 22b is a graph of the frequency of the probability values 21 in each pixel of the cell image 10b (see FIG. 5).
- the probability values 21 of the focused class are hatched, and the probability values 21 of the out-of-focus class are not hatched and are white. is illustrated.
- the frequency distribution 22b of the out-of-focus cell image 10b is compared to the frequency distribution 22a (see FIG. 9) of the in-focus cell image 10a for the in-focus class.
- the frequency of pixels with a high probability value 21 is low, and the frequency of pixels with a low probability value 21 in the in-focus class is high. It is not concentrated on the right side of the distribution 22a, but is distributed almost entirely.
- the frequency distribution 22a of the in-focus cell image 10a has a low frequency of pixels with low probability values 21 in the out-of-focus class, and a low frequency of pixels with low probability values 21 in the out-of-focus class. becomes higher, the frequency distribution 22a is not concentrated on the left side, but is distributed almost entirely. That is, by looking at the shape of the frequency distribution 22, it is possible to easily grasp which of two or more types the cells 90 appearing in the cell image 10 belong to under the imaging conditions. .
- the control unit 2a displays the numerical data of the representative value 20a (see FIG. 4) of the probability values 21 (see FIG. 4) on the display unit 4, and A superimposed cell image 50 in which the distribution of probability values 21 is superimposed on the cell image 10 is displayed.
- the control unit 2a displays the numerical data of the representative values 20a of the probability values 21, the superimposed cell image 50, and the frequency distribution 22 (see FIG. 4) of the probability values 21 on the display unit 4.
- the control unit 2a displays superimposed cell images 50a to 50c as the superimposed cell images 50.
- the control unit 2a displays a graph 40a as the numerical data of the representative value 20a.
- the control unit 2a displays a frequency distribution 22a as the frequency distribution 22.
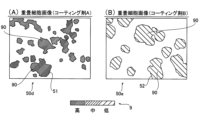
- a superimposed cell image 50d shown in FIG. 12A is generated based on the cell image 10 and the probability distribution image 12 generated based on the index value 20 obtained by analyzing the cell image 10 with the second trained model 6b. This is an image.
- the superimposed cell image 50d is an image generated based on the cell image 10 obtained by photographing the cells 90 cultured in the culture container 80 to which the coating agent A is applied on the bottom surface 80a of the culture container 80. is.
- the configuration for generating the superimposed cell image 50d uses the first trained model 6a to generate the superimposed cell image 50a to the superimposed cell image 50c, except that the second trained model 6b is used instead of the first trained model 6a. Since the configuration is the same as the configuration to be generated, detailed description is omitted.
- a superimposed cell image 50e shown in FIG. 12B is based on the probability distribution image 12 generated based on the index value 20 obtained by analyzing the cell image 10 with the second trained model 6b and the cell image 10. This is the generated image.
- the superimposed cell image 50e is an image generated based on the cell image 10 obtained by photographing the cells 90 cultured in the culture vessel 80 to which the coating agent B is applied on the bottom surface 80a of the culture vessel 80. is.
- the second trained model 6b is generated by learning that the probability that the coating agent applied to the bottom surface 80a of the culture container 80 is the coating agent A is output as the probability value 21. be done. Therefore, in the superimposed cell image 50d shown in FIG.
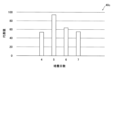
- the control unit 2a acquires a representative value 20a for each cell image 10 based on the probability values 21 output by the second trained model 6b. Further, the control unit 2a obtains a graph collectively displaying a plurality of representative values 20a, such as a graph 40b shown in FIG.
- a graph 40b is a graph showing the difference in the representative value 20a depending on the coating agent.
- the horizontal axis is the type of coating agent
- the vertical axis is the representative value 20a.
- the control unit 2a generates the graph 40b except that the probability value 21 output by the second trained model 6b is used instead of the probability value 21 output by the first trained model 6a. Since the configuration is the same as that for generating , detailed description is omitted.
- the representative value 20a of the cell image 10 taken of the cells 90 cultured in the culture vessel 80 coated with the coating agent A is cultured in the culture vessel 80 coated with the coating agent B. It can be seen that it is larger than the representative value 20a of the cell image 10 in which the cell 90 is captured.
- a superimposed cell image 50f shown in FIG. 14A is an image generated based on the cell image 10 obtained by photographing the cells 90 cultured for 5 days.
- the superimposed cell image 50f is an image generated based on the cell image 10 and the probability distribution image 12 generated based on the index value 20 obtained by analyzing the cell image 10a with the third trained model 6c. is.
- the configuration for generating the superimposed cell image 50f uses the first trained model 6a to generate the superimposed cell image 50a to the superimposed cell image 50c, except that the third trained model 6c is used instead of the first trained model 6a. Since the configuration is the same as the configuration to be generated, detailed description is omitted.
- a superimposed cell image 50g shown in FIG. 14(B) is an image generated based on the cell image 10 obtained by photographing the cells 90 cultured for 4 days.
- a superimposed cell image 50h shown in FIG. 14C is an image generated based on the cell image 10 obtained by photographing the cells 90 cultured for 6 days.
- a superimposed cell image 50i shown in FIG. 14(D) is an image generated based on the cell image 10 obtained by photographing the cells 90 cultured for 7 days.
- the third learned model 6c is generated by learning to output the probability value 21 of whether the number of culture days is 5 or not. Therefore, in the superimposed cell image 50f shown in FIG. 14(A), there are many regions where blue markers 51 are superimposed (regions hatched with the narrowest interval). In addition, in the superimposed cell image 50g shown in FIG. 14B, when compared with the superimposed cell image 50g shown in FIG. area) increases. In addition, as shown in FIGS. 14(C) and 14(D), as the number of culture days increases, an area image on which the red label 52 is superimposed is formed, and the gradation-like label 53 of blue and red is displayed. The overlapped area (medium-spaced hatched area) increases.
- the control unit 2a acquires the representative value 20a for each cell image 10 based on the probability value 21 output by the third trained model 6c. Further, the control unit 2a obtains a graph collectively displaying a plurality of representative values 20a, such as a graph 40c shown in FIG.
- a graph 40c is a graph showing the difference in the representative value 20a due to the difference in culture days.
- the horizontal axis is the culture days
- the vertical axis is the representative value 20a.
- the control unit 2a generates the graph 40c except that the probability value 21 output by the third trained model 6c is used instead of the probability value 21 output by the first trained model 6a. Since the configuration is the same as that for generating , detailed description is omitted.
- the representative value 20a of the cell image 10 obtained by photographing the cells 90 cultured for 5 days is the highest.
- the representative value 20a of the cell images 10 photographed for the cells 90 cultured for days other than 5 is smaller than the representative value 20a of the cell images 10 photographed for the cells 90 cultured for 5 days.
- the representative value 20a of the cell image 10 obtained by imaging the cell 90 cultured for 4 days and the representative value 20a of the cell image 10 obtained by imaging the cell 90 cultured for 6 days it is found that the number of culture days is 6. It can be seen that the representative value 20a of the cell image 10 obtained by photographing the day's cells 90 is higher.
- the display unit 4 displays a plurality of superimposed cell images 50, numerical data (graph) of representative values 20a, and a frequency distribution 22a. Therefore, based on the plurality of superimposed cell images 50 displayed on the display unit 4, the numerical data (graph) of the representative values 20a, and the frequency distribution 22a, the operator determines that the cells 90 appearing in the cell image 10 are 2 It is possible to determine which of the three or more types it belongs to. That is, the operator can analyze whether the cells 90 appearing in the cell image 10 are normal cells or abnormal cells under two or more types of imaging conditions or two or more types of culture conditions. A suitable classification can be determined.
- the operator can determine whether or not the cell image 10 is suitable for analyzing whether the cell 90 shown in the cell image 10 is a normal cell or an abnormal cell.
- a threshold is set as to whether or not the cell image 10 is suitable for analysis as to whether the cell 90 reflected in the cell image 10 is a normal cell or an abnormal cell. becomes possible. Therefore, in this embodiment, the control unit 2a is configured to determine whether the index value 20 is greater than the threshold. Specifically, the control unit 2a determines whether or not the representative value 20a of the probability values 21 is greater than the threshold set by the operator. It is determined whether the cells are suitable for analysis as to whether they are normal cells or abnormal cells.
- the control unit 2a determines that the cell image 10 is suitable for analyzing whether the cell 90 reflected in the cell image 10 is a normal cell or an abnormal cell. do. Further, for example, when the representative value 20a is less than 50%, the control unit 2a determines that the cell image 10 is not suitable for analyzing whether the cell 90 shown in the cell image 10 is a normal cell or an abnormal cell. judge.
- the image acquisition unit 1 acquires the cell image 10 in which the cell 90 is captured.
- step 201 the image analysis unit 2b inputs the cell image 10 to the trained model 6 that has learned to classify the cells 90 into two or more types.
- the image processing unit 2c acquires the cell area, which is the area of the cell 90 shown in the cell image 10.
- the image processing unit 2c acquires cell regions based on the probability distribution image 12 (see FIG. 6).
- step 203 the control unit 2a classifies the cell 90 appearing in the cell image 10 into any of two or more types based on the analysis result of each pixel of the cell image 10 output by the trained model 6.
- An index value 20 representing the accuracy of whether or not is acquired.
- the control unit 2 a obtains, as the index value 20 , the representative value 20 a of the probability values 21 obtained based on the probability values 21 output by the learned model 6 .
- the control unit 2a determines whether the cell image 10 is in focus, whether the coating agent for the culture container 80 is appropriate, and whether the number of culture days is appropriate. At least one of the index values 20 is acquired.
- the control unit 2a analyzes whether the cell image 10 is a normal cell or an abnormal cell based on the probability value 21. is obtained as the index value 20.
- the control unit 2a acquires the representative value 20a of the probability values 21 in the cell region as the representative value 20a of the probability values 21. Specifically, the control unit 2a acquires the average value of the probability values 21 as the representative value 20a.
- the control unit 2a acquires the frequency distribution 22. Specifically, the control unit 2a acquires the frequency distribution 22 based on the probability values 21 output by the trained model 6. FIG.
- the superimposed cell image generation unit 2d generates the superimposed cell image 50. Specifically, the superimposed cell image generator 2d generates a superimposed cell image 50 based on the cell image 10 and the probability distribution image 12 (see FIG. 6) obtained based on the probability value 21.
- the control unit 2a displays the obtained index value 20.
- the control unit 2a displays a superimposed cell image 50 in which the numerical data of the representative value 20a of the probability values 21 and the distribution of the probability values 21 are superimposed on the cell image 10.
- the control unit 2 a displays the frequency distribution 22 of the probability values 21 together with the numerical data of the representative values 20 a of the probability values 21 and the superimposed cell image 50 .
- step 204 may be performed first.
- the image acquisition unit 1 acquires the teacher cell image 30 .
- the teacher cell image 30 is the cell image 10 .
- the image acquisition unit 1 acquires the teacher correct image 31 .
- the correct teacher image 31 is a label value associated with at least two types of imaging conditions corresponding to the classification, or labeled values associated with at least two types of culture conditions corresponding to the classification with respect to the cell image 10. It is a label image.
- the cell images 10 labeled with at least two types of imaging conditions corresponding to the classification are converted into teacher correct images. 31.
- the label values related to the imaging conditions the cell images 10 to which the in-focus label values and the out-of-focus label values when the cell images 10 were photographed are attached to each pixel are used as the teacher. obtained as the correct image 31 for use.
- the out-of-focus label value includes a plurality of label values depending on the degree of the out-of-focus.
- the out-of-focus label values include two label values.
- the image acquisition unit 1 uses the cell images 10 labeled with at least two types of culture conditions corresponding to the classification as a teacher. obtained as the correct image 31 for use. Specifically, the image acquiring unit 1 acquires the cell images 10 to which at least two types of label values regarding the coating agent of the culture vessel 80 in which the cells 90 are cultured are added as the teacher correct image 31 . In this embodiment, the image acquisition unit 1 creates a correct teacher image in which two label values, that is, the label value of the coating agent A and the label value of the coating agent B, are attached to each pixel as label values related to the coating agents. 31 is obtained.
- the image acquisition unit 1 uses the cell images 10 labeled with at least two types of culture conditions corresponding to the classification as a teacher. obtained as the correct image 31 for use. Specifically, the image acquiring unit 1 acquires the cell images 10 to which at least two types of label values regarding the culture days of the cells 90 are attached as the teacher correct images 31 . In the present embodiment, the image acquisition unit 1 creates a correct teacher image in which a label value indicating the number of culture days is 5 and a label value indicating the number of culture days other than 5 are attached to each pixel as label values related to the number of culture days. 31 is obtained.
- step 302 the image processing unit 2c attaches label values relating to at least two imaging conditions corresponding to the classification to the teacher cell image 30, which is the cell image 10, and the cell image 10, or A learned model 6 is created using the teacher correct image 31 to which the label values for at least two corresponding culture conditions are attached.
- the image processing unit 2c attaches two types of label values indicating whether or not the cell image 10 is in focus as the label values relating to the imaging conditions, or Using the teacher correct image 31 with at least two types of label values associated with either the coating agent of the culture container 80 in which the cells 90 are cultured or the number of culture days as the label values regarding the culture conditions, the learned model 6 to create After that, the process ends.
- the control unit 2a acquires the index value 20.
- the control unit 2a acquires the index value 20 acquired by the image analysis unit 2b using the cell image 10 and the learned model 6. FIG.
- the control unit 2a acquires a threshold value. Specifically, the controller 2 a acquires a threshold value preset by the operator and stored in the storage unit 3 .
- the control unit 2a determines whether the index value 20 is greater than the threshold. That is, the control unit 2a determines whether the index value 20 is greater than the threshold for each cell image 10. FIG. If the index value 20 is greater than the threshold, the process proceeds to step 403; If the index value 20 is less than the threshold, processing proceeds to step 404 .
- control unit 2a classifies the cell images 10 into images suitable for analyzing whether the cells 90 are normal cells or abnormal cells. Further, the control unit 2a stores in the storage unit 3 the cell images 10 classified into images suitable for analyzing whether the cells 90 are normal cells or abnormal cells. After that, the process ends.
- step 404 the control unit 2a converts the cell image 10 to an image not suitable for analysis as to whether the cell 90 is a normal cell or an abnormal cell. Classify. In this case, the control unit 2a does not store the cell image 10 in the storage unit 3. FIG. After that, the process ends.
- the cell image analysis method includes the step of acquiring the cell image 10 showing the cell 90, and the trained model 6 trained to classify the cell 90 into two or more types. Based on the step of inputting the cell image 10 and the analysis result of each pixel of the cell image 10 output by the trained model 6, the cell 90 reflected in the cell image 10 is any of two or more types. and a step of displaying the obtained index value 20 .
- the index value 20 representing the accuracy of which of the two or more types of classification the cell 90 shown in the cell image 10 belongs to is displayed, so that the operator can confirm the index value 20.
- the accuracy of the classification of the cells 90 shown in the cell image 10 can be easily grasped.
- the trained model 6 is trained to output the probability value 21, which is the estimated value of the classification, as the analysis result, and in the step of acquiring the index value 20, A representative value 20 a of the probability values 21 obtained based on the probability values 21 output by the trained model 6 is obtained as the index value 20 .
- the accuracy of the classification of the cells 90 appearing in the cell image 10 can be easily determined for each cell image 10 by the representative value 20a of the probability value 21. can grasp.
- the cell image 10 is an image including the cultured cells 90 cultured in the culture container 80, and the trained model 6 is in focus when the cell image 10 is taken. whether the culture container 80 has an appropriate coating agent, and whether the number of culture days is appropriate, and is created by learning to classify at least one of them,
- the step of acquiring the index value 20 whether the cell image 10 is focused, whether the coating agent for the culture container 80 is appropriate, and whether the number of culture days is appropriate At least one of the index values 20 is obtained. Accordingly, by checking the index value 20, the operator can check whether the cell image 10 is in focus, whether the coating agent for the culture container 80 is appropriate, and whether the number of culture days is is appropriate or not.
- the trained model 6 is created by learning to classify whether the cell 90 is suitable for analysis as to whether it is a normal cell or an abnormal cell.
- the probability that the cell image 10 is suitable for analyzing whether the cell 90 reflected in the cell image 10 is a normal cell or an abnormal cell is determined based on the probability value 21.
- the represented value is obtained as the index value 20 .
- an index value 20 representing the degree of suitability of the cell image 10 for analyzing whether the cell 90 shown in the cell image 10 is a normal cell or an abnormal cell is displayed.
- the trained model 6 learns to classify whether the cells 90 of the same type are suitable for analysis as to whether they are normal cells or abnormal cells. It is created by As a result, by analyzing the cell image 10 using the trained model 6, it is possible to classify images suitable for analysis as to whether the cell 90 of the same type is a normal cell or an abnormal cell. .
- the present embodiment further includes the step of acquiring the cell area, which is the area of the cell 90 shown in the cell image 10, and in the step of acquiring the representative value 20a of the probability values 21, As the representative value 20a, the representative value 20a of the probability values 21 in the cell area is obtained.
- the representative value 20a As the representative value 20a, the representative value 20a of the probability values 21 in the cell area is obtained.
- the numerical data of the representative values 20a of the probability values 21 and the distribution of the probability values 21 are superimposed on the cell image 10.
- a superimposed cell image 50 is displayed.
- the representative value 20a of the probability values 21 is displayed, so that the accuracy of classification of the cells 90 appearing in the cell image 10 can be easily grasped for each cell image 10 from the numerical data of the representative value 20a of the probability values 21. be able to.
- the superimposed cell image 50 is displayed, the accuracy of classification of each of the cells 90 appearing in the cell image 10 can be grasped from the superimposed cell image 50 .
- the numerical data of the representative value 20a of the probability values 21 and the superimposed cell image 50 together with the frequency distribution of the probability values 21 22 is displayed. Accordingly, by confirming the frequency distribution 22 together with the numerical data of the representative value 20a of the probability values 21 and the superimposed cell image 50, the accuracy of the classification of the cells 90 reflected in the cell image 10 can be multifaceted for each cell image 10. can be grasped.
- the average value of the probability values 21 is acquired as the representative value 20a.
- the representative value 20a is the value of the first type of classification.
- the cell 90 appearing in the cell image 10 as a whole are the cell images 10 classified as the second type classification different from the first type classification, a part of the probability of the cell image 10 Due to the value 21, the cell 90 appearing in the cell image 10 is classified as being the first type of two or more types. Therefore, as described above, by obtaining the average value of the probability values 21 as the representative value 20a, when classifying the cell image 10 by classifying the cell 90 appearing in the cell image 10, a part of the cell image 10 Due to the probability value 21 of , it is possible to suppress the cell image 10 from being classified as the first type of two or more types. As a result, by classifying the cells 90 appearing in the cell image 10 , it is possible to suppress a decrease in classification accuracy when classifying the cell image 10 .
- the teacher cell image 30, which is the cell image 10, and the cell image 10 are labeled with at least two types of imaging conditions corresponding to the classification, or It further comprises a step of creating a trained model 6 using the correct teacher image 31 labeled with at least two types of culture conditions corresponding to the classification.
- the cell image 10 can be obtained by , it is possible to generate a trained model 6 that can be used to classify which one of two or more types of shooting conditions an image was shot under.
- the cell image 10 can be obtained by using the cell image 10 and the cells 90 shown in the cell image 10 in two or more types of culture conditions. It is possible to generate a trained model 6 that can be used to classify whether an image shows cells 90 cultured under any of the conditions.
- the step of creating the learned model 6 as label values relating to imaging conditions, two types of label values indicating whether or not the cell image 10 is in focus when photographed are used. or at least two types of label values for either the coating agent of the culture vessel 80 for culturing the cells 90 or the number of days of culture as the label values for the culture conditions. to create a trained model 6.
- a trained model 6 can be generated that can be used to classify images into one or more types of classifications.
- this embodiment further includes the step of determining whether the index value 20 is greater than the threshold.
- the cell image 10 with the index value 20 larger than the threshold can be classified as an image suitable for analyzing whether the cell 90 appearing in the cell image 10 is a normal cell or an abnormal cell.
- the cell image 10 with the index value 20 equal to or less than the threshold can be classified as an image that is not suitable for analysis as to whether the cell 90 reflected in the cell image 10 is a normal cell or an abnormal cell. Therefore, when analyzing whether the cell 90 reflected in the cell image 10 is a normal cell or an abnormal cell using a plurality of cell images 10, it is possible to determine whether the cell 90 reflected in the cell image 10 is a normal cell or an abnormal cell. Analysis can be performed using only the cell image 10 suitable for analysis of whether or not it is a cell. As a result, it is possible to prevent a decrease in accuracy in analyzing whether the cells 90 appearing in the cell image 10 are normal cells or abnormal cells.
- control unit 2a acquires the average value of the probability values 21 as the representative value 20a
- the control unit 2a may be configured to acquire one of the median, maximum, minimum, and mode values of the probability values 21 as the representative value 20a.
- the trained model 6 learns to classify whether or not it is in focus, whether the coating agent of the culture vessel 80 is appropriate, and whether the cell
- the trained model 6 may be created by learning based on shooting conditions other than whether or not the camera is in focus.
- the learned model 6 may be created by learning to classify whether or not the type of photographing device is appropriate as the photographing condition.
- the learned model 6 may be created by learning classification based on culture conditions other than whether the coating agent of the culture vessel 80 is appropriate or whether the number of days of culture is appropriate.
- the trained model 6 may be created by learning to classify whether the type of incubation device is appropriate. Any imaging conditions and culture conditions classified by the trained model 6 may be used.
- control unit 2a obtains the representative value 20a of the probability values 21 in the cell region
- control unit 2 a may be configured to obtain representative value 20 a based on probability values 21 of all pixels included in cell image 10 .
- the control unit 2a is preferably configured to acquire the representative value 20a of the probability values 21 in the cell area.
- control unit 2a displays the superimposed cell image 50, the numerical data of the representative values 20a, and the frequency distribution 22 on the display unit 4 was shown.
- the control unit 2a may be configured to display only the numerical data of the representative value 20a on the display unit 4.
- the control unit 2a may be configured to display the numerical data of the representative value 20a and the superimposed cell image 50 on the display unit 4.
- the control unit 2a when the control unit 2a displays the numerical data of the representative values 20a on the display unit 4, the graphs 40a, 40b and 40b collectively display the numerical data of the plurality of representative values 20a. 40c, but the present invention is not limited to this.
- the control unit 2a when displaying the numerical data of the representative value 20a, the control unit 2a may be configured to display the numerical value itself of the representative value 20a instead of displaying it in a graph.
- the cell image analysis device 100 may be configured to use a trained model 6 generated by an image analysis device or the like different from the cell image analysis device 100 .
- the superimposed cell image generation unit 2d superimposes the blue label 51 on the probability value 21 of the label value of the first type of classification among the two or more types
- An example of the configuration for generating the superimposed cell image 50 in which the red label 52 is superimposed on the probability value 21 of the label value of the second type classification different from the type has been shown, but the present invention is not limited to this.
- the superimposed cell image generation unit 2d superimposes labels of any color on the probability values 21 of each label value of two or more types of classification. good.
- the image processing unit 2c is configured to use the teacher correct image 31 with two types of label values indicating whether or not it is in focus when generating the first trained model 6a.
- the image processing unit 2c may be configured to train the learning model 7 using correct teacher images to which three or more types of label values are assigned depending on the degree of focus matching.
- the image processing unit 2c when the image processing unit 2c generates the second trained model 6b, the correct answer for teacher to which two types of label values indicating whether the type of the coating agent is the coating agent A or not is attached.
- the image processing unit 2c may be configured to make the learning model 7 learn using correct teacher images with label values of three types higher depending on the type of coating agent.
- the image processing unit 2c when the image processing unit 2c generates the third trained model 6c, the correct image 31 for teacher attached with two types of label values indicating whether or not the number of culture days is 5 days.
- the image processing unit 2c may be configured to make the learning model 7 learn using teacher correct images to which three or more types of label values are attached according to the number of culture days.
- the image processing unit 2 c may be configured to acquire the cell image 10 previously acquired by the image acquisition unit 1 and stored in the storage unit 3 .
- control unit 2a determines whether or not the index value 20 is greater than the threshold.
- the present invention is not limited to this.
- the control unit 2a does not have to perform the process of determining whether the index value 20 is greater than the threshold.
- (Item 1) a step of obtaining a cell image showing cells; inputting the cell image into a trained model trained to classify the cell into two or more types; An index value representing the accuracy of which of two or more types the cell appearing in the cell image belongs to, based on the analysis result of each pixel of the cell image output by the trained model. and obtaining and displaying the acquired index value.
- the trained model is trained to output a probability value that is an estimated value of the classification as the analysis result,
- the cell image analysis method according to item 1 wherein in the step of obtaining the index value, a representative value of the probability values obtained based on the probability values output by the trained model is obtained as the index value.
- the cell image is an image containing cultured cells cultured in a culture vessel
- the trained model determines whether the cell image is in focus, whether the coating agent for the culture vessel is appropriate, and whether the number of culture days is appropriate. It is created by learning to classify at least one, In the step of obtaining the index value, whether the cell image is in focus, whether the coating agent of the culture vessel is appropriate, and whether the number of days of culture is appropriate 3.
- the trained model is created by learning to classify whether the cell is suitable for analysis as to whether it is a normal cell or an abnormal cell, In the step of obtaining the index value, based on the probability value, the cell image represents the degree of suitability for analysis as to whether the cell appearing in the cell image is the normal cell or the abnormal cell. 4. The image analysis method according to item 2 or 3, wherein a value is obtained as the index value.
- the trained model is created by learning to classify whether the cells of the same type are suitable for analysis as to whether they are normal cells or abnormal cells.
- (Item 6) further comprising the step of obtaining a cell area that is the area of the cell appearing in the cell image; 6.
- Label values relating to at least two types of imaging conditions corresponding to the classification are attached to the teacher cell image, which is the cell image, and the cell image, or at least two types of culture conditions corresponding to the classification 10.
- the cell image analysis method according to any one of items 1 to 9, further comprising the step of creating the trained model using the labeled correct image for teacher.
Landscapes
- Engineering & Computer Science (AREA)
- Physics & Mathematics (AREA)
- Chemical & Material Sciences (AREA)
- Health & Medical Sciences (AREA)
- Life Sciences & Earth Sciences (AREA)
- Computer Vision & Pattern Recognition (AREA)
- General Physics & Mathematics (AREA)
- Theoretical Computer Science (AREA)
- Organic Chemistry (AREA)
- General Health & Medical Sciences (AREA)
- Bioinformatics & Cheminformatics (AREA)
- Wood Science & Technology (AREA)
- Zoology (AREA)
- Biotechnology (AREA)
- Nuclear Medicine, Radiotherapy & Molecular Imaging (AREA)
- Medical Informatics (AREA)
- Software Systems (AREA)
- Radiology & Medical Imaging (AREA)
- Quality & Reliability (AREA)
- Probability & Statistics with Applications (AREA)
- Proteomics, Peptides & Aminoacids (AREA)
- Genetics & Genomics (AREA)
- General Engineering & Computer Science (AREA)
- Analytical Chemistry (AREA)
- Biochemistry (AREA)
- Microbiology (AREA)
- Biomedical Technology (AREA)
- Sustainable Development (AREA)
- Biophysics (AREA)
- Medicinal Chemistry (AREA)
- Immunology (AREA)
- Molecular Biology (AREA)
- Apparatus Associated With Microorganisms And Enzymes (AREA)
- Image Processing (AREA)
- Image Analysis (AREA)
Priority Applications (3)
| Application Number | Priority Date | Filing Date | Title |
|---|---|---|---|
| CN202280047142.6A CN117597430A (zh) | 2021-07-29 | 2022-07-26 | 细胞图像分析方法 |
| JP2023538552A JP7736065B2 (ja) | 2021-07-29 | 2022-07-26 | 細胞画像解析方法 |
| US18/567,494 US20240370998A1 (en) | 2021-07-29 | 2022-07-26 | Cell image analysis method |
Applications Claiming Priority (2)
| Application Number | Priority Date | Filing Date | Title |
|---|---|---|---|
| JP2021124772 | 2021-07-29 | ||
| JP2021-124772 | 2021-07-29 |
Publications (1)
| Publication Number | Publication Date |
|---|---|
| WO2023008428A1 true WO2023008428A1 (ja) | 2023-02-02 |
Family
ID=85087711
Family Applications (1)
| Application Number | Title | Priority Date | Filing Date |
|---|---|---|---|
| PCT/JP2022/028777 Ceased WO2023008428A1 (ja) | 2021-07-29 | 2022-07-26 | 細胞画像解析方法 |
Country Status (4)
| Country | Link |
|---|---|
| US (1) | US20240370998A1 (https=) |
| JP (1) | JP7736065B2 (https=) |
| CN (1) | CN117597430A (https=) |
| WO (1) | WO2023008428A1 (https=) |
Cited By (1)
| Publication number | Priority date | Publication date | Assignee | Title |
|---|---|---|---|---|
| WO2025187109A1 (ja) * | 2024-03-08 | 2025-09-12 | 株式会社日立国際電気 | データ収集装置、及び映像システム |
Citations (7)
| Publication number | Priority date | Publication date | Assignee | Title |
|---|---|---|---|---|
| WO2019171546A1 (ja) * | 2018-03-08 | 2019-09-12 | 株式会社島津製作所 | 細胞画像解析方法、細胞画像解析装置、及び学習モデル作成方法 |
| WO2020031243A1 (ja) * | 2018-08-06 | 2020-02-13 | 株式会社島津製作所 | 教師ラベル画像修正方法、学習済みモデルの作成方法および画像解析装置 |
| JP2020531971A (ja) * | 2017-08-15 | 2020-11-05 | シーメンス ヘルスケア ゲゼルシヤフト ミツト ベシユレンクテル ハフツング | コンボリューショナル・ニューラルを用いた、ホログラフィック顕微鏡で取得した細胞画像の品質の識別方法 |
| WO2020241772A1 (ja) * | 2019-05-31 | 2020-12-03 | 国立大学法人京都大学 | 情報処理装置、スクリーニング装置、情報処理方法、スクリーニング方法、及びプログラム |
| WO2021009906A1 (ja) * | 2019-07-18 | 2021-01-21 | 株式会社島津製作所 | 細胞画像解析方法および細胞画像解析装置 |
| JP2021018459A (ja) * | 2019-07-17 | 2021-02-15 | オリンパス株式会社 | 評価支援方法、評価支援システム、プログラム |
| WO2021059572A1 (ja) * | 2019-09-27 | 2021-04-01 | 富士フイルム株式会社 | 情報処理装置、情報処理装置の作動方法、情報処理装置の作動プログラム |
-
2022
- 2022-07-26 WO PCT/JP2022/028777 patent/WO2023008428A1/ja not_active Ceased
- 2022-07-26 CN CN202280047142.6A patent/CN117597430A/zh active Pending
- 2022-07-26 JP JP2023538552A patent/JP7736065B2/ja active Active
- 2022-07-26 US US18/567,494 patent/US20240370998A1/en active Pending
Patent Citations (7)
| Publication number | Priority date | Publication date | Assignee | Title |
|---|---|---|---|---|
| JP2020531971A (ja) * | 2017-08-15 | 2020-11-05 | シーメンス ヘルスケア ゲゼルシヤフト ミツト ベシユレンクテル ハフツング | コンボリューショナル・ニューラルを用いた、ホログラフィック顕微鏡で取得した細胞画像の品質の識別方法 |
| WO2019171546A1 (ja) * | 2018-03-08 | 2019-09-12 | 株式会社島津製作所 | 細胞画像解析方法、細胞画像解析装置、及び学習モデル作成方法 |
| WO2020031243A1 (ja) * | 2018-08-06 | 2020-02-13 | 株式会社島津製作所 | 教師ラベル画像修正方法、学習済みモデルの作成方法および画像解析装置 |
| WO2020241772A1 (ja) * | 2019-05-31 | 2020-12-03 | 国立大学法人京都大学 | 情報処理装置、スクリーニング装置、情報処理方法、スクリーニング方法、及びプログラム |
| JP2021018459A (ja) * | 2019-07-17 | 2021-02-15 | オリンパス株式会社 | 評価支援方法、評価支援システム、プログラム |
| WO2021009906A1 (ja) * | 2019-07-18 | 2021-01-21 | 株式会社島津製作所 | 細胞画像解析方法および細胞画像解析装置 |
| WO2021059572A1 (ja) * | 2019-09-27 | 2021-04-01 | 富士フイルム株式会社 | 情報処理装置、情報処理装置の作動方法、情報処理装置の作動プログラム |
Cited By (1)
| Publication number | Priority date | Publication date | Assignee | Title |
|---|---|---|---|---|
| WO2025187109A1 (ja) * | 2024-03-08 | 2025-09-12 | 株式会社日立国際電気 | データ収集装置、及び映像システム |
Also Published As
| Publication number | Publication date |
|---|---|
| JPWO2023008428A1 (https=) | 2023-02-02 |
| JP7736065B2 (ja) | 2025-09-09 |
| CN117597430A (zh) | 2024-02-23 |
| US20240370998A1 (en) | 2024-11-07 |
Similar Documents
| Publication | Publication Date | Title |
|---|---|---|
| Quinn et al. | Automated blood smear analysis for mobile malaria diagnosis | |
| US7268939B1 (en) | Tracking of cells with a compact microscope imaging system with intelligent controls | |
| JP5481696B2 (ja) | 受精卵品質評価支援システム、受精卵品質評価支援装置および受精卵品質評価支援方法 | |
| US20190287244A1 (en) | Cell image evaluation device and cell image evaluation control program | |
| US20240418628A1 (en) | Method for generating data for particle analysis, non-transitory computer program for generating data for particle analysis, and device for generating data for particle analysis | |
| US10007834B2 (en) | Detection control device, detection system, non-transitory storage medium, and detection control method | |
| CN111051955A (zh) | 通过使用卷积神经网络来标识利用数字全息显微镜所获取的细胞图像的品质 | |
| WO2018101004A1 (ja) | 細胞画像評価装置および細胞画像評価制御プログラム | |
| CN117058752B (zh) | 一种基于改进YOLOv7的学生课堂行为检测方法 | |
| US20250078544A1 (en) | Cell counting or cell confluence with rescaled input images | |
| US20230105948A1 (en) | Training a machine-learned algorithm for cell counting or for cell confluence determination | |
| CN117635525A (zh) | 用于测试图像处理模型的敏感度的显微镜系统和方法 | |
| US20240169523A1 (en) | Cell counting method, machine learning model construction method and recording medium | |
| CN117635524A (zh) | 测试机器学习图像处理模型的质量的显微镜系统和方法 | |
| US11756190B2 (en) | Cell image evaluation device, method, and program | |
| Chalfoun et al. | Segmenting time‐lapse phase contrast images of adjacent NIH 3T3 cells | |
| WO2023008428A1 (ja) | 細胞画像解析方法 | |
| Liao et al. | A clinical consensus-compliant deep learning approach to quantitatively evaluate human in vitro fertilization early embryonic development with optical microscope images | |
| JP2018205860A (ja) | 分類器構築方法、分類器および分類器構築装置 | |
| US12437396B2 (en) | Machine-learned cell counting or cell confluence for a plurality of cell types | |
| GB2485209A (en) | Curve fitting to histogram data for identification of chromatin types in nuclei | |
| JP7687406B2 (ja) | 細胞画像解析方法 | |
| Foucart et al. | Finding the best channel for tissue segmentation in whole-slide images | |
| WO2023008525A1 (ja) | 細胞画像解析方法 | |
| US20250111684A1 (en) | Cell information acquisition method, cell manufacturing method, cell inspection method, cell abnormality detection method, cell information acquisition apparatus, and non-transitory recording medium |
Legal Events
| Date | Code | Title | Description |
|---|---|---|---|
| 121 | Ep: the epo has been informed by wipo that ep was designated in this application |
Ref document number: 22849489 Country of ref document: EP Kind code of ref document: A1 |
|
| WWE | Wipo information: entry into national phase |
Ref document number: 2023538552 Country of ref document: JP |
|
| WWE | Wipo information: entry into national phase |
Ref document number: 202280047142.6 Country of ref document: CN |
|
| NENP | Non-entry into the national phase |
Ref country code: DE |
|
| 122 | Ep: pct application non-entry in european phase |
Ref document number: 22849489 Country of ref document: EP Kind code of ref document: A1 |