WO2022249489A1 - 深さ計測装置、深さ計測システム及び深さ指標値算出方法 - Google Patents
深さ計測装置、深さ計測システム及び深さ指標値算出方法 Download PDFInfo
- Publication number
- WO2022249489A1 WO2022249489A1 PCT/JP2021/020550 JP2021020550W WO2022249489A1 WO 2022249489 A1 WO2022249489 A1 WO 2022249489A1 JP 2021020550 W JP2021020550 W JP 2021020550W WO 2022249489 A1 WO2022249489 A1 WO 2022249489A1
- Authority
- WO
- WIPO (PCT)
- Prior art keywords
- depth
- correction
- index value
- measurement
- correction coefficient
- Prior art date
- Legal status (The legal status is an assumption and is not a legal conclusion. Google has not performed a legal analysis and makes no representation as to the accuracy of the status listed.)
- Ceased
Links
Images






Classifications
-
- G—PHYSICS
- G01—MEASURING; TESTING
- G01B—MEASURING LENGTH, THICKNESS OR SIMILAR LINEAR DIMENSIONS; MEASURING ANGLES; MEASURING AREAS; MEASURING IRREGULARITIES OF SURFACES OR CONTOURS
- G01B15/00—Measuring arrangements characterised by the use of electromagnetic waves or particle radiation, e.g. by the use of microwaves, X-rays, gamma rays or electrons
-
- G—PHYSICS
- G01—MEASURING; TESTING
- G01B—MEASURING LENGTH, THICKNESS OR SIMILAR LINEAR DIMENSIONS; MEASURING ANGLES; MEASURING AREAS; MEASURING IRREGULARITIES OF SURFACES OR CONTOURS
- G01B15/00—Measuring arrangements characterised by the use of electromagnetic waves or particle radiation, e.g. by the use of microwaves, X-rays, gamma rays or electrons
- G01B15/04—Measuring arrangements characterised by the use of electromagnetic waves or particle radiation, e.g. by the use of microwaves, X-rays, gamma rays or electrons for measuring contours or curvatures
-
- G—PHYSICS
- G01—MEASURING; TESTING
- G01N—INVESTIGATING OR ANALYSING MATERIALS BY DETERMINING THEIR CHEMICAL OR PHYSICAL PROPERTIES
- G01N23/00—Investigating or analysing materials by the use of wave or particle radiation, e.g. X-rays or neutrons, not covered by groups G01N3/00 – G01N17/00, G01N21/00 or G01N22/00
- G01N23/22—Investigating or analysing materials by the use of wave or particle radiation, e.g. X-rays or neutrons, not covered by groups G01N3/00 – G01N17/00, G01N21/00 or G01N22/00 by measuring secondary emission from the material
- G01N23/225—Investigating or analysing materials by the use of wave or particle radiation, e.g. X-rays or neutrons, not covered by groups G01N3/00 – G01N17/00, G01N21/00 or G01N22/00 by measuring secondary emission from the material using electron or ion
- G01N23/2251—Investigating or analysing materials by the use of wave or particle radiation, e.g. X-rays or neutrons, not covered by groups G01N3/00 – G01N17/00, G01N21/00 or G01N22/00 by measuring secondary emission from the material using electron or ion using incident electron beams, e.g. scanning electron microscopy [SEM]
-
- H—ELECTRICITY
- H01—ELECTRIC ELEMENTS
- H01J—ELECTRIC DISCHARGE TUBES OR DISCHARGE LAMPS
- H01J37/00—Discharge tubes with provision for introducing objects or material to be exposed to the discharge, e.g. for the purpose of examination or processing thereof
- H01J37/26—Electron or ion microscopes; Electron or ion diffraction tubes
- H01J37/28—Electron or ion microscopes; Electron or ion diffraction tubes with scanning beams
-
- G—PHYSICS
- G01—MEASURING; TESTING
- G01N—INVESTIGATING OR ANALYSING MATERIALS BY DETERMINING THEIR CHEMICAL OR PHYSICAL PROPERTIES
- G01N2223/00—Investigating materials by wave or particle radiation
- G01N2223/30—Accessories, mechanical or electrical features
- G01N2223/303—Accessories, mechanical or electrical features calibrating, standardising
-
- G—PHYSICS
- G01—MEASURING; TESTING
- G01N—INVESTIGATING OR ANALYSING MATERIALS BY DETERMINING THEIR CHEMICAL OR PHYSICAL PROPERTIES
- G01N2223/00—Investigating materials by wave or particle radiation
- G01N2223/30—Accessories, mechanical or electrical features
- G01N2223/306—Accessories, mechanical or electrical features computer control
-
- G—PHYSICS
- G01—MEASURING; TESTING
- G01N—INVESTIGATING OR ANALYSING MATERIALS BY DETERMINING THEIR CHEMICAL OR PHYSICAL PROPERTIES
- G01N2223/00—Investigating materials by wave or particle radiation
- G01N2223/30—Accessories, mechanical or electrical features
- G01N2223/345—Accessories, mechanical or electrical features mathematical transformations on beams or signals, e.g. Fourier
-
- G—PHYSICS
- G01—MEASURING; TESTING
- G01N—INVESTIGATING OR ANALYSING MATERIALS BY DETERMINING THEIR CHEMICAL OR PHYSICAL PROPERTIES
- G01N2223/00—Investigating materials by wave or particle radiation
- G01N2223/40—Imaging
- G01N2223/418—Imaging electron microscope
-
- G—PHYSICS
- G01—MEASURING; TESTING
- G01N—INVESTIGATING OR ANALYSING MATERIALS BY DETERMINING THEIR CHEMICAL OR PHYSICAL PROPERTIES
- G01N2223/00—Investigating materials by wave or particle radiation
- G01N2223/60—Specific applications or type of materials
- G01N2223/611—Specific applications or type of materials patterned objects; electronic devices
- G01N2223/6116—Specific applications or type of materials patterned objects; electronic devices semiconductor wafer
Definitions
- the present disclosure relates to a depth measuring device, a depth measuring system, and a depth index value calculating method for measuring the depth of a pattern, particularly the depth of recesses such as holes and grooves.
- Patent Document 1 there is linearity between (groove width/groove bottom brightness) N in a groove structure and between (hole area/hole bottom brightness) N and the depth of a groove or hole in a hole structure. Finding this out, a method of measuring the depth of a concave portion such as a groove or a hole from the line width or area of the pattern and the luminance value (signal amount) inside (bottom) of the pattern is disclosed.
- an index value proportional to the depth (hereinafter referred to as a depth index value) is calculated from the line width or area of the pattern and the luminance value at the bottom of the pattern, and the pattern depth and the depth index value are measured in advance.
- the absolute value of the pattern depth is calculated using a database that stores the relationship between .
- the line width, area, and luminance value of the pattern for calculating the depth index value are measured by multiple depth measurement devices arranged in the manufacturing line.
- depth index values calculated from these measured values also differ between devices.
- the present disclosure relates to correction of instrumental differences in depth index values that occur between depth measuring devices.
- a depth measurement system includes a plurality of depth measurement devices, each of which calculates a depth index value indicating a relative depth of a pattern on a sample.
- a depth measurement system comprising: The depth measurement device consists of an electron optical system that irradiates the sample with an electron beam, a detection system that detects the emitted electrons emitted from the sample irradiated with the electron beam, and a predetermined pattern depth measurement on the measurement target.
- the depth measurement recipe which is an operation program for controlling the electron optical system and the detection system, the depth of a predetermined pattern is determined based on the measured value extracted from the electron image formed from the output from the detection system.
- the plurality of depth measurement devices are divided into one reference device and other correction target devices,
- the computer of the correction target device stores correction coefficients linked to the depth measurement recipe, and outputs depth index values of a predetermined pattern corrected using a mathematical model to which the correction coefficients are applied.
- FIG. 10 is a diagram showing a flow of instrumental error correction of depth index values
- FIG. 4 is a diagram showing a depth index value correction coefficient calculation flow (correction method 1); It is an example of a correction coefficient management screen. It is an example of a correction coefficient edit screen.
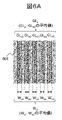
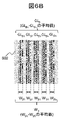
- FIG. 10 is a diagram showing a depth index value correction coefficient calculation flow (correction method 2); It is a figure for demonstrating the calculation example of a dimension value and a luminance value from a SEM image. It is a figure for demonstrating the calculation example of a dimension value and a luminance value from a SEM image.
- FIG. 10 is a diagram showing a depth index value correction coefficient calculation flow (correction method 3); It is an example of a correction coefficient management screen. It is an example of a correction coefficient edit screen. It is an example of a depth measurement system. It is a figure which shows the calculation of a correction coefficient in a depth measurement system, and an operation
- the present disclosure is applied to a scanning electron microscope (SEM) using an electron beam as a depth measurement device or depth measurement system.
- SEM scanning electron microscope
- this embodiment should not be construed to be limited, and instead of the scanning electron microscope, a transmission electron microscope (TEM), a projection electron microscope, a surface irradiation electron microscope, etc.
- TEM transmission electron microscope
- the present disclosure can also be applied to devices and systems using other microscopes.
- the present disclosure can also be applied to an apparatus or system configured by using a plurality of electron beams (multi-beams) for the electron microscope described above, or to a general observation system.
- the depth measurement apparatus of this embodiment calculates a depth index value indicating the relative depth of the pattern based on the two-dimensional pattern dimension value and the luminance value inside the pattern obtained using a scanning electron microscope. calculate.
- Fig. 1 is a schematic diagram of a depth measuring device that measures the depth of a pattern.
- the depth measurement device includes an imaging unit 101 , an overall control unit 102 , a signal processing unit 103 , an input/output unit 104 and a storage unit 105 .
- the imaging unit 101 includes an electron gun 106 , a focusing lens 108 that focuses the electron beam 107 emitted from the electron gun 106 , and a focusing lens 109 that further focuses the electron beam 107 that has passed through the focusing lens 108 .
- the imaging unit 101 further includes a deflector 110 that deflects the electron beam 107 and an objective lens 111 that controls the height at which the electron beam 107 is focused.
- a shutter 130 that partially restricts passage of the electron beam 107, a blanking deflector 131 that restricts the electron beam reaching the sample 112 by deflecting the electron beam 107 off the optical axis, and a blanking deflector.
- a blanking electrode 132 is provided to receive the electron beam 107 deflected by 131 .
- the electron beam 107 passed through the optical elements related to electron beam irradiation and scanning (these optical elements are collectively referred to as an electron optical system) provided in the scanning electron microscope as described above is placed on the stage 113.
- a sample 112 is irradiated.
- Emitted electrons 114 such as secondary electrons (SE) and backscattered electrons (BSE) emitted from the sample by the irradiation of the electron beam 107 are deflected by a deflector 115 (first two It is guided in a predetermined direction by a secondary electron aligner).
- the deflector 115 is a so-called Wien filter, which selectively deflects the emitted electrons 114 in a predetermined direction without deflecting the electron beam 107 .
- Emitted electrons 114 that have passed through a detection aperture 116 provided for angle discrimination of the emitted electrons 114 are guided to a detector 119 arranged off-axis by a deflector 123 (second secondary electron aligner).
- a detector 121 is also provided for detecting secondary electrons (tertiary electrons 120 ) generated by the collision of the emitted electrons 114 with the detection diaphragm 116 .
- An energy filter 122 is provided immediately before the detector 119, and by discriminating energy, a secondary light emitted vertically upward from the bottom of the semiconductor pattern formed on the sample 112 and having a passage trajectory near the optical axis is emitted. Electrons can be selectively detected.
- the optical elements related to the detection of the emitted electrons 114 as described above are collectively called a detection system.
- the signal processing unit 103 generates an SEM image based on the output from the detection system.
- the signal processing unit 103 generates image data by storing detection signals in a frame memory or the like in synchronization with scanning by a scanning deflector (not shown).
- a scanning deflector not shown.
- the electron optical system and detection system of the imaging unit 101 as described above are controlled by the overall control unit 102 .
- Overall control unit 102 , input/output unit 104 and storage unit 105 are implemented as computer 100 .
- the overall control unit 102 receives user instructions from the input/output unit 104, reads programs and data stored in the storage unit 105, and executes processing. By executing a program stored in the storage unit 105, control processing for acquiring an SEM image of the sample by the imaging unit 101, arithmetic processing for calculating a depth index value, and the like are executed.
- the depth measurement device in FIG. 1 captures an SEM image of a pattern including recesses.
- the pattern dimension value or pattern area of the recess and the luminance value inside the pattern are measured from the captured SEM image, and the depth index value is calculated.
- a depth index value is represented by (Formula 1).
- N is an arbitrary positive number, and is set to an appropriate value according to the shape of the pattern and the material of the sample.
- Depth index value (pattern dimension value or pattern area/pattern luminance value) N Whether the pattern dimension value or the pattern area is used in calculating the depth index value depends on the shape of the two-dimensional pattern of the recesses.
- the pattern dimension value is used.
- a pattern dimension value of trench width can be used.
- the pattern area is used.
- the pattern area is used for hole patterns and patterns having planar shapes such as ellipses, squares, and rectangles.
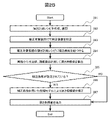
- FIG. 2B In a depth measurement system that uses a plurality of depth measurement devices shown in FIG. 1 and each calculates a depth index value, the procedure for correcting the instrumental difference between depth measurement devices is shown in the flowchart of FIG. 2B.
- a mass-produced wafer is to be measured, and it is assumed that the depth of a predetermined pattern formed on the mass-produced wafer is measured by a plurality of depth measuring devices arranged on a wafer manufacturing line.
- one of the plurality of depth measuring devices is used as a reference device 1001, and the other device ( Correction is performed so that the measured value of the device to be corrected 1002 is matched with the measured value of the reference device.
- An arbitrary one of a plurality of depth measuring devices is selected as the reference device 1001 .
- Both the reference device 1001 and the correction target device 1002 have the same device configuration as shown in FIG. .
- the flowchart of FIG. 2B will be described below.
- any one of the plurality of depth measurement devices (either a reference device or a device to be corrected)
- necessary information such as the layout of the wafer to be measured, the coordinates of the measurement pattern, and the measurement conditions is sent from the input/output unit 104.
- a measurement recipe operation program
- the created measurement recipe is expanded to another depth measurement device and stored (step 201).
- the device difference correction coefficient of the depth index value is input from the input/output unit 104 and stored in the storage unit 105 (step 202). Details of the method for determining the instrumental error correction coefficient will be described later, but the correction coefficient must be calculated and set in advance for each measurement sample, depth measurement condition, and correction target device.
- each of the correction target devices 1002 it is linked to the measurement recipe so that the set machine difference correction coefficient is applied to the depth measurement result (step 203).
- Each depth measurement device executes the depth measurement recipe, measures the dimension value and luminance value from the captured image, and calculates the depth index value (step 204).
- the depth index value is represented by (Equation 1), and an appropriate value of N is set in the depth measurement recipe.
- the depth measurement device creates a mathematical model for correcting the depth index value to which the correction coefficient is applied. is used to correct the depth index value (step 206).
- the corrected measurement result is output to the input/output unit 104 and stored in the storage unit 105 (step 207).
- the correction coefficient is not set (NO in step 205)
- the measurement result is output to the input/output unit 104 and stored in the storage unit 105 without being corrected (step 207).
- the correction coefficient is not set, when the depth measurement device is the reference device, the depth measurement device is the device to be corrected, but the correction coefficient is set to be small enough so that the instrumental error can be regarded as 0. Including cases where there were no cases.
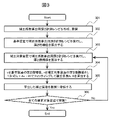
- FIG. 3 is a flow chart showing the procedure for calculating the correction coefficients A and B when correcting the machine difference by the correction method 1. As shown in FIG.
- the reference device 1001 executes the correction coefficient calculation depth measurement recipe, measures the pattern dimension value and the pattern luminance value, and calculates the depth index value from these values by (Equation 1) (step 302). .
- the correction target device 1002 executes the correction coefficient calculation depth measurement recipe for the same sample (measurement target), measures the pattern dimension value and the pattern luminance value, and uses these values (equation 1 ) to calculate the depth index value (step 303).
- the magnitude of the instrumental difference varies depending on the measurement conditions when measuring the depth and the sample to be measured. Therefore, in principle, it is necessary to define a correction coefficient for each depth measurement recipe (see step 201).
- the depth measurement recipe if there is a depth measurement recipe that has the same measurement conditions related to machine differences and the same measurement object (for example, a measurement recipe that differs only in measurement points) and the correction coefficient has already been calculated There is no problem in using the correction coefficient calculated for the existing depth measurement recipe as it is. In this case, calculation of the correction coefficient for the new depth measurement recipe can be omitted.
- the measurement conditions related to instrumental differences include optical conditions, imaging magnification, number of pixels, scanning method, and the like.
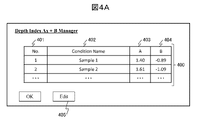
- FIG. 4A and B show GUI screens for the correction target device 1002 to register the correction coefficients A and B in step 305.
- FIG. 4A and B show GUI screens for the correction target device 1002 to register the correction coefficients A and B in step 305.
- Fig. 4A shows the correction coefficient management screen.
- the correction coefficients A and B registered in the correction target device 1002 can be collectively checked.
- Correction coefficients are managed by a management number 401, and a condition name 402 and correction coefficient values (A, B) 403 and 404 are registered for each management number.
- condition name 402 measurement conditions and measurement objects related to the above-described machine difference are registered.
- the user can determine whether to calculate the correction coefficient or apply the registered correction coefficient.
- the correction coefficient management table 400 can be edited from the edit button 405 . It is also possible to add a new record or select a management number 401 to edit a condition name 402 and correction coefficient values 403 and 404 .
- FIG. 4B shows the correction coefficient edit screen. When a management number is selected and the edit button 405 is pressed, the management number of the correction coefficient currently selected on the edit screen is displayed in the management number display column 410, and the correction coefficient registered with that management number is displayed in the correction coefficient. A numerical value display field 411 and a condition name are displayed in a condition name display field 412 . Enter the management number for storing the new correction coefficient in the management number input field 413, enter the correction coefficient obtained in the flowchart of FIG. . After that, by pressing the apply button 416, the correction coefficient management table 400 is updated.
- correction method 2 fixes correction coefficient A to 1 and sets only correction coefficient B in the mathematical model (equation 2) of correction method 1.
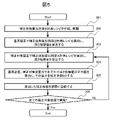
- FIG. A procedure for calculating the correction coefficient B is shown in the flow chart of FIG. Since steps 301 to 303, 305, and 306 are the same as those in the flowchart of FIG. 3, duplicate descriptions will be omitted.
- the correction method 2 the difference between the average values of the depth index values calculated for the reference device and the correction target device is obtained, and the difference is used as the correction coefficient B (step 504).
- the GUI screen for registering and managing correction coefficients is also the same as the screens shown in FIGS. 4A and 4B, and the correction coefficient A is fixed to 1, or the correction coefficient A is not displayed.
- correction coefficient is calculated by calculating the offset amount from the average value of the depth index values calculated by each device, so it is easier than correction method 1.
- Correction factor values can be determined.
- correction method 3 In correction method 3, the pattern dimension value or pattern area and the luminance value are each corrected by a suitable mathematical model, and the depth index value is calculated from the corrected values, thereby non-linearly correcting the depth index value. .
- An example of calculating the groove width and the brightness value from the SEM images of the same trench pattern captured by the depth inspection devices ⁇ and ⁇ shown in FIGS. 6A and 6B is shown.
- the trench patterns in the SEM images 601 and 602 differ in brightness and groove width due to differences in magnification and differences in the detection system for each apparatus.
- the groove width obtained from the SEM image 601 captured by the apparatus ⁇ (assumed as a reference apparatus) shown in FIG.
- the groove width determined from the SEM image 602 taken in ) is represented by W ⁇
- the luminance value of the trench bottom is represented by GL ⁇ . Note that the groove width and luminance value are calculated as average values of a plurality of trench patterns.
- correction method 3 the pattern dimension value and the luminance value inside the pattern are each corrected using a mathematical model. For example, when correction is performed using a linear mathematical model, correction coefficients A CD and B CD for pattern dimension values and correction coefficients A GL and B GL for luminance values are calculated in advance, and correction target device 1002 Register these correction coefficients in .
- the depth index value I ⁇ of the correction target device 1002 is obtained by using the groove width W ⁇ ' and the luminance value GL ⁇ ' corrected by a mathematical model using a correction coefficient, as shown in (Equation 4). corrected to the value I ⁇ '.
- the machine difference can be corrected for the depth index value of an open pattern such as a trench pattern.
- the hole diameter obtained from the SEM image 701 captured by the reference apparatus (apparatus ⁇ ) shown in FIG. 7A is represented by D ⁇
- the brightness value of the hole bottom is represented by GL ⁇
- the hole diameter determined from the SEM image 702 is represented by D ⁇
- the luminance value of the hole bottom is represented by GL ⁇ .
- the hole diameter and luminance value are preferably calculated as average values of a plurality of hole patterns.
- the depth index values I ⁇ and I ⁇ of the devices ⁇ and ⁇ are calculated by (Equation 5).
- S ⁇ ⁇ (D ⁇ /2) 2
- S ⁇ ⁇ (D ⁇ /2) 2
- I ⁇ (S ⁇ /GL ⁇ ) N
- I ⁇ ( S ⁇ / GL ⁇ ) N
- the depth index values I ⁇ and I ⁇ do not become the same value due to the instrumental difference.
- the depth index value I ⁇ of the correction target device 1002 is obtained by using the hole diameter DW ⁇ ' and the luminance value GL ⁇ ' corrected by a mathematical model using a correction coefficient, as shown in (Equation 6). corrected to the value I ⁇ '.
- Equation 6 it is possible to correct the instrumental difference in the depth index value of a closed pattern such as a hole pattern.
- the machine difference can be corrected in the same manner for closed patterns other than hole patterns.
- a method for calculating the area S according to the pattern shape may be applied.
- FIG. 8 is a flow chart showing the procedure for calculating the correction coefficients A CD , B CD , A GL , and B GL when the correction method 3 is used to correct the machine difference.
- any one of the plurality of depth measurement devices (either a reference device or a device to be corrected)
- necessary information such as the layout of the wafer to be measured, the coordinates of the measurement pattern, and the measurement conditions is sent from the input/output unit 104.
- a depth measurement recipe operation program
- the created measurement recipe is expanded to another depth measurement device and stored (step 801).
- the reference device 1001 executes the correction coefficient calculation depth measurement recipe, and measures the pattern dimension value and the pattern luminance value (step 802).
- the correction target device 1002 executes the correction coefficient calculation depth measurement recipe for the same sample, and measures the pattern dimension value and the pattern luminance value (step 803).
- the dimension value at each measurement point by the reference device 1001 is y and the dimension value at each measurement point by the correction target device is x
- the correction coefficient A CD , BCD are calculated (step 804).
- the luminance value at each measurement point by the reference device 1001 is y
- the luminance value at each measurement point by the correction target device is x.
- step 805 Calculate the coefficients A GL and B GL (step 805).
- the calculated correction coefficients A CD , B CD , A GL , and B GL are registered in the storage unit 105 of the correction target device 1002 (step 806). It is checked whether correction coefficients are registered in all the correction target devices 1002, and if there is an unregistered correction target device, steps 803 to 806 are executed for the correction target device.
- 9A and 9B show GUI screens for the device 1002 to be corrected to register the correction coefficients A CD , B CD , A GL and B GL in step 806 . Since it is the same as the GUI screen shown in FIGS. 4A and 4B, redundant description will be omitted.
- FIG. 9A shows the correction coefficient management screen.
- correction coefficient management table 900 correction coefficients registered in the correction target device 1002 can be collectively checked.
- correction coefficient values (A CD , B CD ) 901 for dimension values and correction coefficient values (A GL , B GL ) 902 for luminance values are registered as correction coefficient values.
- FIG. 9B shows the correction coefficient edit screen. Although it is the same as the correction coefficient editing screen shown in FIG.
- a correction coefficient value display column 911 for displaying the correction coefficient of the dimension value a correction coefficient value display column 912 for displaying the correction coefficient of the brightness value
- the Correction coefficient value input fields 913 and 914 are provided for inputting a correction coefficient for the dimension value and a correction coefficient for the luminance value, respectively.
- correction method 3 in order to create a mathematical model that corrects each of the dimension value and the brightness value, not only the depth index value but also the measurement using only the brightness value or the brightness value other than the depth index value is used.
- the calculated measurement value can also be corrected for machine differences.
- FIG. 10 shows another aspect of the depth measurement system of this embodiment, in which a management computer 1004 is further connected to the network 1003 .
- the management computer 1004 has a function of managing correction coefficients registered in each device.
- Correction is performed by inputting necessary information such as the layout of the wafer to be measured, the coordinates of the measurement pattern, and the measurement conditions from the input/output unit 104 in any one of the plurality of depth measurement devices of the depth measurement system.
- a depth measurement recipe (operation program) for coefficient calculation is created and stored in the storage unit 105 .
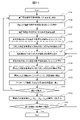
- the created measurement recipe is expanded to another depth measurement device and stored (step 1101).
- Each device of the depth measurement system executes the correction coefficient calculation depth measurement recipe, and measures the pattern dimension value and the pattern luminance value (step 1102).
- a selection screen shown in FIG. 12A is displayed on the management computer 1004 .
- a selection list 1200 is provided with a division 1201 of a reference device and a correction target device.
- the selection list 1200 has an apparatus name column 1202 , a measurement recipe column 1203 and a measurement data column 1204 .
- the user selects the device name to be the reference device from the device name column 1202 by pull-down (step 1103).
- the correction coefficient calculation depth measurement recipe held by the device can be selected. Therefore, the user selects the depth measurement recipe for correction coefficient calculation held by the reference device from the measurement recipe column 1203 by pull-down (step 1104).
- the correction coefficient calculation depth measurement recipe is selected, the measurement data acquired by the apparatus executing the correction coefficient calculation depth measurement recipe can be selected. Therefore, the user selects the measurement data held by the reference device from the measurement data column 1204 by pull-down (step 1105).
- the user selects the device name to be the correction target device from the device name column 1202 by pull-down (step 1106).
- the correction coefficient calculation depth measurement recipe held by the device can be selected. Therefore, the user selects a correction coefficient calculation depth measurement recipe held by the correction target device from the measurement recipe column 1203 by pull-down (step 1107).
- the correction coefficient calculation depth measurement recipe is selected, the measurement data acquired by the apparatus executing the correction coefficient calculation depth measurement recipe can be selected. Therefore, the user selects the measurement data held by the correction target device from the measurement data column 1204 by pull-down (step 1108).
- fitting is performed on the measurement results of the selected reference device and correction target device, and the correction coefficients (A CD , B CD , A GL , B GL ) are calculated.
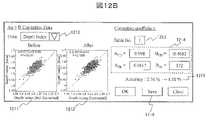
- Calculation is performed (step 1109), and the fitting result and the calculated correction coefficient are displayed on the calculation result display screen shown in FIG. 12B (step 1110).
- a calculation result display screen is displayed on the management computer 1004 .
- the calculation result display screen shown in FIG. 12B will be described.
- a measurement result 1211 before application of correction and a measurement result 1212 after application of correction based on the calculated correction coefficient are displayed.
- the vertical axis is the measurement result of the reference device
- the horizontal axis of the graph 1211 is the measurement result of the correction target device before correction
- the horizontal axis of the graph 1212 is the measurement result of the correction target device after correction.
- the data to be displayed as the measurement result can be selected in the data selection field 1210.
- an example of selecting the depth index value is shown, but it is possible to select the dimension value and the brightness value by pull-down.
- a correction coefficient calculated by fitting is displayed in a correction coefficient display portion 1214 , and an inter-apparatus difference index before and after correction is displayed in an inter-apparatus difference index display portion 1215 .
- the user compares the displayed graphs 1211 and 1212 and confirms the change in the inter-apparatus difference index displayed in the inter-apparatus difference index display section 1215, so that the correction with the correction coefficient sufficiently corrects the apparatus difference. (step 1111). For example, by comparing the graphs 1211 and 1212, the depth index value after correction of the device to be corrected is more consistent with the depth index value of the reference device than the depth index value before correction. can be seen. Further, here, the inter-apparatus difference index Acc is calculated by (Equation 7).
- Acc
- value x is the depth index value or measured value of the correction target device
- value y is the depth index of the reference device. value or measurement.
- the value is the depth index value or measurement value selected in the data selection field 1210 . The smaller the difference between the average value x and the average value y, the smaller the value of the index Acc.
- step 1111 If the correction coefficient is not appropriate (No in step 1111), review the measurement conditions of the depth measurement recipe for correction coefficient calculation, and perform again from step 1101. If the correction coefficient is appropriate (Yes in step 1111), set the management number in the management number input field 1213 on the calculation result display screen (FIG. 12B), and press the save button 1216 to save the calculated correction coefficient. It is registered as a device to be corrected (step 1112). At this time, it is preferable to automatically register the object to be measured and the measurement conditions as conditions to which the correction coefficient can be applied. As a result, it is displayed in the correction coefficient management table 900 (FIG. 9A). This is performed for all correction target devices (step 1113). As described above, the management computer 1004 can calculate and manage the correction coefficients of all correction target devices in the depth measurement system.
- each correction target device calculates and manages a correction coefficient to be applied to the device. That is, the device to be corrected in step 1106 is this device, and the display screens of FIGS. 12A and 12B are also displayed on the computer of this device.
- the user can easily calculate and register correction coefficients by selecting appropriate measurement data according to the program of the depth measurement system, thereby reducing instrumental differences in measurement values. Become.
Landscapes
- Physics & Mathematics (AREA)
- General Physics & Mathematics (AREA)
- Electromagnetism (AREA)
- Chemical & Material Sciences (AREA)
- Analytical Chemistry (AREA)
- Health & Medical Sciences (AREA)
- Life Sciences & Earth Sciences (AREA)
- Biochemistry (AREA)
- General Health & Medical Sciences (AREA)
- Immunology (AREA)
- Pathology (AREA)
- Testing Or Measuring Of Semiconductors Or The Like (AREA)
- Image Processing (AREA)
- Length-Measuring Devices Using Wave Or Particle Radiation (AREA)
Abstract
Description
深さ計測装置はそれぞれ、電子ビームを試料に照射する電子光学系と、電子ビームが照射された試料から放出された放出電子を検出する検出系と、計測対象における所定のパターンの深さを計測する動作プログラムである深さ計測レシピを実行することにより、電子光学系と検出系とを制御して検出系からの出力から形成した電子像から抽出された計測値に基づき、所定のパターンの深さ指標値を算出するコンピュータとを備え、
複数の深さ計測装置は、1台の基準装置とその他の補正対象装置とに区分され、
補正対象装置のコンピュータは、深さ計測レシピに紐づけられた補正係数を記憶しており、補正係数が適用された数理モデルを用いて補正された所定のパターンの深さ指標値を出力する。
(式1)
深さ指標値=(パターン寸法値またはパターン面積/パターン輝度値)N
深さ指標値の算出において、パターン寸法値またはパターン面積のいずれを使うかは凹部の2次元パターンの形状に依存する。凹部の2次元パターン形状が開いたパターンである場合には、パターン寸法値を用いる。例えば、トレンチパターンでは溝幅のパターン寸法値を用いることができる。一方、凹部の2次元パターン形状が閉じたパターンである場合には、パターン面積を用いる。例えば、ホールパターンや、楕円、正方形や長方形などの平面形状を有するパターンでは、パターン面積を用いる。
補正方法1は、深さ指標値を補正する数理モデルとして1次式を使用し、線形補正により深さ指標値を補正する方法である。補正後の深さ指標値Ic、補正対象装置1002がステップ204で(式1)にしたがって算出した深さ指標値Io、ステップ202で設定された補正係数をA,Bとすると、(式2)に示す線形補正式により深さ指標値を補正する。
(式2)
Ic=A・Io+B
補正方法1により機差補正を行う場合の、補正係数A,Bの算出手順を図3のフローチャートに示す。
深さ指標値の補正方法は上述のものに限られない。補正方法2は、補正方法1の数理モデル(式2)において、補正係数Aを1に固定し、補正係数Bのみを設定するものである。補正係数Bの算出手順を図5のフローチャートに示す。ステップ301~303、305、306は図3のフローチャートと同じであるので、重複する説明は省略する。補正方法2では、基準装置と補正対象装置でそれぞれ算出した深さ指標値の平均値との間の差分を求め、その差分を補正係数Bとする(ステップ504)。
補正方法3では、パターン寸法値またはパターン面積と、輝度値とをそれぞれ適した数理モデルにより補正し、補正後の値から深さ指標値を算出することにより、深さ指標値を非線形に補正する。図6A,Bに示す、深さ検査装置α,βによって撮像した同一のトレンチパターンのSEM像から溝幅と輝度値を算出する例を示す。SEM像601、602におけるトレンチパターンは、装置ごとの倍率機差や検出系の機差等により明るさや溝幅が異なる。図6Aに示す装置α(基準装置とする)で撮像したSEM像601から求めた溝幅をWα、トレンチ底部の輝度値をGLαで表し、図6Bに示す装置β(補正対象装置とする)で撮像したSEM像602から求めた溝幅をWβ、トレンチ底部の輝度値をGLβで表す。なお、溝幅、輝度値は複数のトレンチパターンの平均値として算出している。
(式3)
Iα=(Wα/GLα)N
Iβ=(Wβ/GLβ)N
機差補正していない状態では、機差により深さ指標値Iα、Iβは同じ値にはならない。
(式4)
Wβ’ =ACD・Wβ+BCD
GLβ’ =AGL・GLβ+BGL
Iβ’ =(Wβ’ /GLβ’ )N
(式4)を用いることによってトレンチパターンのような、閉じていないパターンの深さ指標値について、機差を補正することができる。
(式5)
Sα=π・(Dα/2)2
Sβ=π・(Dβ/2)2
Iα=(Sα/GLα)N
Iβ=(Sβ/GLβ)N
機差補正していない状態では、機差により深さ指標値Iα、Iβは同じ値にはならない。
(式6)
Dβ’ =ACD・Dβ+BCD
GLβ’ =AGL・GLβ+BGL
Sβ’ =π・(Dβ’ /2)2
Iβ’ =(Sβ’ /GLβ’ )N
(式6)を用いることによって、ホールパターンのような、閉じたパターンの深さ指標値について、機差を補正することができる。ホールパターン以外の閉じたパターンでも同様に機差を補正することができる。パターン形状に応じた面積Sの算出方法を適用すればよい。
基準装置1001による各計測点での寸法値をy、補正対象装置による各計測点での寸法値をxとして、1次式(y=ACDx+BCD)でフィッティングを実施し、補正係数ACD,BCDを算出する(ステップ804)。同様に、基準装置1001による各計測点での輝度値をy、補正対象装置による各計測点での輝度値をxとして、1次式(y=AGLx+BGL)でフィッティングを実施し、補正係数AGL,BGLを算出する(ステップ805)。算出した補正係数ACD,BCD,AGL,BGLを補正対象装置1002の記憶部105に登録する(ステップ806)。全ての補正対象装置1002で補正係数が登録されているかどうかを確認し、未登録の補正対象装置があれば、当該補正対象装置に対して、ステップ803~806を実施する。
(式7)
Acc=|値xの平均値-値yの平均値|/値yの平均値
ここで、値xは補正対象装置の深さ指標値または計測値であり、値yは基準装置の深さ指標値または計測値である。値はデータ選択欄1210で選択されている深さ指標値または計測値とする。値xの平均値と値yの平均値との差が小さくなるほど、指標Accの値は小さくなる。
Claims (18)
- 複数の深さ計測装置を備え、前記複数の深さ計測装置のそれぞれが試料上のパターンの相対的な深さを示す深さ指標値を算出する深さ計測システムであって、
前記深さ計測装置はそれぞれ、
電子ビームを試料に照射する電子光学系と、
前記電子ビームが照射された試料から放出された放出電子を検出する検出系と、
計測対象における所定のパターンの深さを計測する動作プログラムである深さ計測レシピを実行することにより、前記電子光学系と前記検出系とを制御して前記検出系からの出力から形成した電子像から抽出された計測値に基づき、前記所定のパターンの前記深さ指標値を算出するコンピュータとを備え、
前記複数の深さ計測装置は、1台の基準装置とその他の補正対象装置とに区分され、
前記補正対象装置の前記コンピュータは、前記深さ計測レシピに紐づけられた補正係数を記憶しており、前記補正係数が適用された数理モデルを用いて補正された前記所定のパターンの前記深さ指標値を出力する深さ計測システム。 - 請求項1において、
前記複数の深さ計測装置は、前記深さ計測レシピと計測条件の等しい補正係数算出用深さ計測レシピを実行することにより、前記電子光学系と前記検出系とを制御して前記検出系からの出力から形成した電子像から前記計測値を抽出し、または抽出された前記計測値に基づき、前記計測対象の前記所定のパターンの前記深さ指標値を算出し、
前記補正係数は、前記補正対象装置で前記補正係数算出用深さ計測レシピを実行して抽出された前記計測値を、前記数理モデルにしたがって前記基準装置で前記補正係数算出用深さ計測レシピを実行して抽出された前記計測値にフィッティングして求められた補正係数、または前記補正対象装置で前記補正係数算出用深さ計測レシピを実行して算出された前記深さ指標値を、前記数理モデルにしたがって前記基準装置で前記補正係数算出用深さ計測レシピを実行して算出された前記深さ指標値にフィッティングして求められた補正係数である深さ計測システム。 - 請求項1において、
前記数理モデルは、Ic=A・Io+Bとして表現され、
前記Icは補正後の前記深さ指標値であり、前記Ioは補正前の前記深さ指標値であり、前記A及び前記Bが前記補正係数である深さ計測システム。 - 請求項1において、
前記数理モデルは、Ic=Io+Bとして表現され、
前記Icは補正後の前記深さ指標値であり、前記Ioは補正前の前記深さ指標値であり、前記Bが前記補正係数である深さ計測システム。 - 請求項1において、
前記深さ指標値は、パターンの寸法値と当該パターンの内側の輝度値との関数として表現され、
前記数理モデルは、Wc=ACD・Wo+BCD及びGLc=AGL・GLo+BGLとして表現され、
前記Wcは補正後の前記パターンの寸法値であり、前記Woは補正前の前記パターンの寸法値であり、前記GLcは補正後の前記パターンの内側の輝度値であり、前記GLoは補正前の前記パターンの内側の輝度値であり、前記ACD,前記BCD,前記AGL,前記BGLが前記補正係数である深さ計測システム。 - 請求項1において、
前記補正対象装置の前記コンピュータは、前記補正係数が適用される条件を記憶し、
前記条件には、前記計測対象と前記電子像を取得する計測条件とを含む深さ計測システム。 - 請求項2において、
前記複数の深さ計測装置はネットワークで接続されており、
前記補正対象装置は、前記基準装置が前記補正係数算出用深さ計測レシピを実行して抽出された前記計測値または算出された前記深さ指標値を、前記ネットワークを介して取得し、前記補正係数を算出する深さ計測システム。 - 請求項7において、
前記補正対象装置の前記コンピュータは、前記基準装置による前記計測値と当該補正対象装置による補正前の前記計測値との対応関係と、前記基準装置による前記計測値と当該補正対象装置による補正後の前記計測値との対応関係とを比較可能に表示する、または前記基準装置による前記深さ指標値と当該補正対象装置による補正前の前記深さ指標値との対応関係と、前記基準装置による前記深さ指標値と当該補正対象装置による補正後の前記深さ指標値との対応関係とを比較可能に表示する深さ計測システム。 - 請求項8において、
前記補正対象装置の前記コンピュータは、前記基準装置による前記計測値または前記深さ指標値と当該補正対象装置による前記計測値または前記深さ指標値との差異を示す装置間差指標を算出し、補正前後における前記装置間差指標の変化を表示する深さ計測システム。 - 請求項2において、
管理コンピュータを備え、
前記複数の深さ計測装置及び前記管理コンピュータはネットワークで接続されており、
前記管理コンピュータは、前記基準装置が前記補正係数算出用深さ計測レシピを実行して抽出された前記計測値または算出された前記深さ指標値、及び前記補正対象装置が前記補正係数算出用深さ計測レシピを実行して抽出された前記計測値または算出された前記深さ指標値を、前記ネットワークを介して取得し、当該補正対象装置の前記補正係数を算出する深さ計測システム。 - 請求項10において、
前記管理コンピュータは、前記基準装置による前記計測値と当該補正対象装置による補正前の前記計測値との対応関係と、前記基準装置による前記計測値と当該補正対象装置による補正後の前記計測値との対応関係とを比較可能に表示する、または前記基準装置による前記深さ指標値と当該補正対象装置による補正前の前記深さ指標値との対応関係と、前記基準装置による前記深さ指標値と当該補正対象装置による補正後の前記深さ指標値との対応関係とを比較可能に表示する深さ計測システム。 - 請求項11において、
前記管理コンピュータは、前記基準装置による前記計測値または前記深さ指標値と当該補正対象装置による前記計測値または前記深さ指標値との差異を示す装置間差指標を算出し、補正前後における前記装置間差指標の変化を表示する深さ計測システム。 - 複数の深さ計測装置を備え、測定対象のパターンの相対的な深さを示す深さ指標値を算出する深さ計測システムにおける深さ指標値算出方法であって、
前記深さ計測装置はそれぞれ、電子ビームを試料に照射する電子光学系と、前記電子ビームが照射された試料から放出された放出電子を検出する検出系と、計測対象における所定のパターンの深さを計測する動作プログラムである深さ計測レシピを実行することにより、前記電子光学系と前記検出系とを制御して前記検出系からの出力から形成した電子像から抽出された計測値に基づき、前記所定のパターンの前記深さ指標値を算出するコンピュータとを備え、
前記複数の深さ計測装置は、1台の基準装置とその他の補正対象装置とに区分され、
前記補正対象装置の前記コンピュータは、前記深さ計測レシピに紐づけられた補正係数を記憶しており、
前記基準装置は、前記深さ計測レシピを実行して算出された前記深さ指標値を出力し、
前記補正対象装置は、前記深さ計測レシピを実行して算出された前記深さ指標値を、前記補正係数が適用された数理モデルを用いて補正して出力する深さ指標値算出方法。 - 請求項13において、
前記複数の深さ計測装置は、前記深さ計測レシピと計測条件の等しい補正係数算出用深さ計測レシピを実行することにより、前記電子光学系と前記検出系とを制御して前記検出系からの出力から形成した電子像から前記計測値を抽出し、または抽出された前記計測値に基づき、前記計測対象の前記所定のパターンの前記深さ指標値を算出し、
前記補正係数は、前記補正対象装置で前記補正係数算出用深さ計測レシピを実行して抽出された前記計測値を、前記数理モデルにしたがって前記基準装置で前記補正係数算出用深さ計測レシピを実行して抽出された前記計測値にフィッティングして求められた補正係数、または前記補正対象装置で前記補正係数算出用深さ計測レシピを実行して算出された前記深さ指標値を、前記数理モデルにしたがって前記基準装置で前記補正係数算出用深さ計測レシピを実行して算出された前記深さ指標値にフィッティングして求められた補正係数である深さ指標値算出方法。 - 請求項14において、
前記複数の深さ計測装置はネットワークで接続されており、
前記補正対象装置は、前記基準装置が前記補正係数算出用深さ計測レシピを実行して抽出された前記計測値または算出された前記深さ指標値を、前記ネットワークを介して取得し、前記補正係数を算出する深さ指標値算出方法。 - 請求項14において、
前記深さ計測システムは管理コンピュータを備え、前記複数の深さ計測装置及び前記管理コンピュータはネットワークで接続されており、
前記管理コンピュータは、前記基準装置が前記補正係数算出用深さ計測レシピを実行して抽出された前記計測値または算出された前記深さ指標値、及び前記補正対象装置が前記補正係数算出用深さ計測レシピを実行して抽出された前記計測値または算出された前記深さ指標値を、前記ネットワークを介して取得し、当該補正対象装置の前記補正係数を算出する深さ指標値算出方法。 - 試料上のパターンの相対的な深さを示す深さ指標値を算出する深さ計測装置であって、
電子ビームを試料に照射する電子光学系と、
前記電子ビームが照射された試料から放出された放出電子を検出する検出系と、
計測対象における所定のパターンの深さを計測する動作プログラムである深さ計測レシピを実行することにより、前記電子光学系と前記検出系とを制御して前記検出系からの出力から形成した電子像から抽出された計測値に基づき、前記所定のパターンの前記深さ指標値を算出するコンピュータとを備え、
複数台の前記深さ計測装置を備える深さ計測システムにおいて、基準装置と補正対象装置とに区分されており、
前記補正対象装置に区分された場合、前記コンピュータは、前記深さ計測レシピに紐づけられた補正係数を記憶し、前記補正係数が適用された数理モデルを用いて補正された前記所定のパターンの前記深さ指標値を出力する深さ計測装置。 - 請求項17において、
前記コンピュータは、前記深さ計測レシピと計測条件の等しい補正係数算出用深さ計測レシピを実行することにより、前記電子光学系と前記検出系とを制御して前記検出系からの出力から形成した電子像から前記計測値を抽出し、または抽出された前記計測値に基づき、前記計測対象の前記所定のパターンの前記深さ指標値を算出し、
前記補正係数は、前記補正対象装置に区分された深さ計測装置が前記補正係数算出用深さ計測レシピを実行して抽出された前記計測値を、前記数理モデルにしたがって前記基準装置に区分された深さ計測装置が前記補正係数算出用深さ計測レシピを実行して抽出された前記計測値にフィッティングして求められた補正係数、または前記補正対象装置に区分された深さ計測装置が前記補正係数算出用深さ計測レシピを実行して算出された前記深さ指標値を、前記数理モデルにしたがって前記基準装置に区分された深さ計測装置が前記補正係数算出用深さ計測レシピを実行して算出された前記深さ指標値にフィッティングして求められた補正係数である深さ計測装置。
Priority Applications (6)
| Application Number | Priority Date | Filing Date | Title |
|---|---|---|---|
| PCT/JP2021/020550 WO2022249489A1 (ja) | 2021-05-28 | 2021-05-28 | 深さ計測装置、深さ計測システム及び深さ指標値算出方法 |
| CN202180097688.8A CN117255932A (zh) | 2021-05-28 | 2021-05-28 | 深度测量装置、深度测量系统以及深度指标值计算方法 |
| US18/559,162 US20240240937A1 (en) | 2021-05-28 | 2021-05-28 | Depth Measurement Device, Depth Measurement System, and Depth Index Calculation Method |
| JP2023523941A JP7719865B2 (ja) | 2021-05-28 | 2021-05-28 | 深さ計測装置、深さ計測システム及び深さ指標値算出方法 |
| KR1020237038172A KR20230167095A (ko) | 2021-05-28 | 2021-05-28 | 깊이 계측 장치, 깊이 계측 시스템 및 깊이 지표값 산출 방법 |
| TW111119677A TWI850667B (zh) | 2021-05-28 | 2022-05-26 | 深度計測裝置、深度計測系統及深度指標值算出方法 |
Applications Claiming Priority (1)
| Application Number | Priority Date | Filing Date | Title |
|---|---|---|---|
| PCT/JP2021/020550 WO2022249489A1 (ja) | 2021-05-28 | 2021-05-28 | 深さ計測装置、深さ計測システム及び深さ指標値算出方法 |
Publications (1)
| Publication Number | Publication Date |
|---|---|
| WO2022249489A1 true WO2022249489A1 (ja) | 2022-12-01 |
Family
ID=84229602
Family Applications (1)
| Application Number | Title | Priority Date | Filing Date |
|---|---|---|---|
| PCT/JP2021/020550 Ceased WO2022249489A1 (ja) | 2021-05-28 | 2021-05-28 | 深さ計測装置、深さ計測システム及び深さ指標値算出方法 |
Country Status (6)
| Country | Link |
|---|---|
| US (1) | US20240240937A1 (ja) |
| JP (1) | JP7719865B2 (ja) |
| KR (1) | KR20230167095A (ja) |
| CN (1) | CN117255932A (ja) |
| TW (1) | TWI850667B (ja) |
| WO (1) | WO2022249489A1 (ja) |
Citations (2)
| Publication number | Priority date | Publication date | Assignee | Title |
|---|---|---|---|---|
| JP2006153837A (ja) * | 2004-10-29 | 2006-06-15 | Hitachi High-Technologies Corp | 走査型電子顕微鏡及びそれを用いたパターン計測方法並びに走査型電子顕微鏡の機差補正装置 |
| WO2020095346A1 (ja) * | 2018-11-05 | 2020-05-14 | 株式会社 日立ハイテクノロジーズ | パターン計測方法、計測システム、及びコンピュータ可読媒体 |
Family Cites Families (1)
| Publication number | Priority date | Publication date | Assignee | Title |
|---|---|---|---|---|
| JP6316578B2 (ja) * | 2013-12-02 | 2018-04-25 | 株式会社日立ハイテクノロジーズ | 走査電子顕微鏡システム及びそれを用いたパターン計測方法並びに走査電子顕微鏡 |
-
2021
- 2021-05-28 CN CN202180097688.8A patent/CN117255932A/zh active Pending
- 2021-05-28 JP JP2023523941A patent/JP7719865B2/ja active Active
- 2021-05-28 US US18/559,162 patent/US20240240937A1/en active Pending
- 2021-05-28 KR KR1020237038172A patent/KR20230167095A/ko active Pending
- 2021-05-28 WO PCT/JP2021/020550 patent/WO2022249489A1/ja not_active Ceased
-
2022
- 2022-05-26 TW TW111119677A patent/TWI850667B/zh active
Patent Citations (2)
| Publication number | Priority date | Publication date | Assignee | Title |
|---|---|---|---|---|
| JP2006153837A (ja) * | 2004-10-29 | 2006-06-15 | Hitachi High-Technologies Corp | 走査型電子顕微鏡及びそれを用いたパターン計測方法並びに走査型電子顕微鏡の機差補正装置 |
| WO2020095346A1 (ja) * | 2018-11-05 | 2020-05-14 | 株式会社 日立ハイテクノロジーズ | パターン計測方法、計測システム、及びコンピュータ可読媒体 |
Also Published As
| Publication number | Publication date |
|---|---|
| JPWO2022249489A1 (ja) | 2022-12-01 |
| CN117255932A (zh) | 2023-12-19 |
| KR20230167095A (ko) | 2023-12-07 |
| TW202247224A (zh) | 2022-12-01 |
| JP7719865B2 (ja) | 2025-08-06 |
| US20240240937A1 (en) | 2024-07-18 |
| TWI850667B (zh) | 2024-08-01 |
Similar Documents
| Publication | Publication Date | Title |
|---|---|---|
| US7888638B2 (en) | Method and apparatus for measuring dimension of circuit pattern formed on substrate by using scanning electron microscope | |
| JP5525421B2 (ja) | 画像撮像装置および画像撮像方法 | |
| US7732761B2 (en) | Method for measuring a pattern dimension using a scanning electron microscope | |
| JP5180428B2 (ja) | 走査型電子顕微鏡用撮像レシピ作成装置及びその方法並びに半導体パターンの形状評価装置 | |
| US8767038B2 (en) | Method and device for synthesizing panorama image using scanning charged-particle microscope | |
| JP6038053B2 (ja) | パターン評価方法およびパターン評価装置 | |
| US8003940B2 (en) | Tool-to-tool matching control method and its system for scanning electron microscope | |
| JP4220358B2 (ja) | 半導体パターン計測方法 | |
| US8311314B2 (en) | Pattern measuring method and pattern measuring device | |
| JP7305422B2 (ja) | パターン評価システム及びパターン評価方法 | |
| US20120290990A1 (en) | Pattern Measuring Condition Setting Device | |
| JP5164598B2 (ja) | レビュー方法、およびレビュー装置 | |
| US8214166B2 (en) | Method and its system for calibrating measured data between different measuring tools | |
| JP4500099B2 (ja) | 電子顕微鏡装置システム及び電子顕微鏡装置システムを用いた寸法計測方法 | |
| JP5069904B2 (ja) | 指定位置特定方法及び指定位置測定装置 | |
| JP2007187538A (ja) | 荷電粒子線装置及びそれを用いた画像取得方法 | |
| US20080073526A1 (en) | Charged particle beam apparatus | |
| TWI567789B (zh) | A pattern measuring condition setting means, and a pattern measuring means | |
| JP7719865B2 (ja) | 深さ計測装置、深さ計測システム及び深さ指標値算出方法 | |
| JP2011179819A (ja) | パターン測定方法及びコンピュータプログラム | |
| JP6207893B2 (ja) | 試料観察装置用のテンプレート作成装置 | |
| JP2004128197A (ja) | パターン接続精度検査方法 | |
| JP2008077897A (ja) | 電子顕微鏡の分解能評価用試料及び電子顕微鏡の分解能評価方法並びに電子顕微鏡 | |
| WO2025062546A1 (ja) | 検査計測モデルを有する走査型電子顕微鏡及び検査計測モデルの修正方法 | |
| TW202503930A (zh) | 計算機、程式、及方法 |
Legal Events
| Date | Code | Title | Description |
|---|---|---|---|
| 121 | Ep: the epo has been informed by wipo that ep was designated in this application |
Ref document number: 21943126 Country of ref document: EP Kind code of ref document: A1 |
|
| WWE | Wipo information: entry into national phase |
Ref document number: 202180097688.8 Country of ref document: CN |
|
| ENP | Entry into the national phase |
Ref document number: 20237038172 Country of ref document: KR Kind code of ref document: A |
|
| WWE | Wipo information: entry into national phase |
Ref document number: 18559162 Country of ref document: US Ref document number: 1020237038172 Country of ref document: KR |
|
| WWE | Wipo information: entry into national phase |
Ref document number: 2023523941 Country of ref document: JP |
|
| NENP | Non-entry into the national phase |
Ref country code: DE |
|
| 122 | Ep: pct application non-entry in european phase |
Ref document number: 21943126 Country of ref document: EP Kind code of ref document: A1 |