WO2022215134A1 - 通信設計支援装置、通信設計支援方法およびプログラム - Google Patents
通信設計支援装置、通信設計支援方法およびプログラム Download PDFInfo
- Publication number
- WO2022215134A1 WO2022215134A1 PCT/JP2021/014535 JP2021014535W WO2022215134A1 WO 2022215134 A1 WO2022215134 A1 WO 2022215134A1 JP 2021014535 W JP2021014535 W JP 2021014535W WO 2022215134 A1 WO2022215134 A1 WO 2022215134A1
- Authority
- WO
- WIPO (PCT)
- Prior art keywords
- data
- propagation
- unit
- design support
- communication design
- Prior art date
- Legal status (The legal status is an assumption and is not a legal conclusion. Google has not performed a legal analysis and makes no representation as to the accuracy of the status listed.)
- Ceased
Links
Images






Classifications
-
- H—ELECTRICITY
- H04—ELECTRIC COMMUNICATION TECHNIQUE
- H04L—TRANSMISSION OF DIGITAL INFORMATION, e.g. TELEGRAPHIC COMMUNICATION
- H04L5/00—Arrangements affording multiple use of the transmission path
- H04L5/0091—Signalling for the administration of the divided path, e.g. signalling of configuration information
- H04L5/0096—Indication of changes in allocation
- H04L5/0098—Signalling of the activation or deactivation of component carriers, subcarriers or frequency bands
-
- H—ELECTRICITY
- H04—ELECTRIC COMMUNICATION TECHNIQUE
- H04W—WIRELESS COMMUNICATION NETWORKS
- H04W16/00—Network planning, e.g. coverage or traffic planning tools; Network deployment, e.g. resource partitioning or cells structures
- H04W16/24—Cell structures
- H04W16/28—Cell structures using beam steering
-
- H—ELECTRICITY
- H04—ELECTRIC COMMUNICATION TECHNIQUE
- H04W—WIRELESS COMMUNICATION NETWORKS
- H04W24/00—Supervisory, monitoring or testing arrangements
- H04W24/06—Testing, supervising or monitoring using simulated traffic
-
- H—ELECTRICITY
- H04—ELECTRIC COMMUNICATION TECHNIQUE
- H04W—WIRELESS COMMUNICATION NETWORKS
- H04W56/00—Synchronisation arrangements
- H04W56/0055—Synchronisation arrangements determining timing error of reception due to propagation delay
- H04W56/006—Synchronisation arrangements determining timing error of reception due to propagation delay using known positions of transmitter and receiver
-
- Y—GENERAL TAGGING OF NEW TECHNOLOGICAL DEVELOPMENTS; GENERAL TAGGING OF CROSS-SECTIONAL TECHNOLOGIES SPANNING OVER SEVERAL SECTIONS OF THE IPC; TECHNICAL SUBJECTS COVERED BY FORMER USPC CROSS-REFERENCE ART COLLECTIONS [XRACs] AND DIGESTS
- Y02—TECHNOLOGIES OR APPLICATIONS FOR MITIGATION OR ADAPTATION AGAINST CLIMATE CHANGE
- Y02D—CLIMATE CHANGE MITIGATION TECHNOLOGIES IN INFORMATION AND COMMUNICATION TECHNOLOGIES [ICT], I.E. INFORMATION AND COMMUNICATION TECHNOLOGIES AIMING AT THE REDUCTION OF THEIR OWN ENERGY USE
- Y02D30/00—Reducing energy consumption in communication networks
- Y02D30/70—Reducing energy consumption in communication networks in wireless communication networks
Definitions
- the present invention relates to technology that supports wireless communication design according to the user's purpose of use.
- the quality of wireless communication changes from moment to moment depending on the situation, and the quality may not be stable due to the influence of the surrounding environment such as users and base stations. Therefore, in order to enable wireless communication to be used with optimal quality according to the user's purpose, there is a need for technology that supports the design of wireless communication.
- the disclosed technology aims to support the design of wireless communication according to the user's purpose of use.
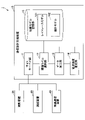
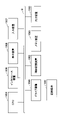
- FIG. 1 is a diagram showing an example of the overall configuration of a communication design support system and an example of a functional configuration of a communication design support device;
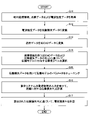
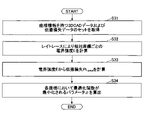
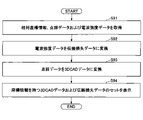
- FIG. 10 is a flow chart showing an example of the flow of communication design support processing; 4 is a flowchart showing an example of the flow of 3D CAD data generation processing; 9 is a flowchart showing an example of the flow of ray tracing model tuning processing;
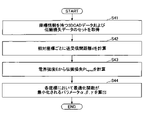
- FIG. 11 is a flowchart showing an example of the flow of statistical model tuning processing;
- FIG. FIG. 11 is a flowchart showing an example of the flow of environment label selection processing based on threshold determination;
- FIG. 10 is a flow chart showing an example of the flow of classifier learning processing.
- FIG. 10 is a flow chart showing an example of the flow of classifier learning processing.
- FIG. 11 is a flowchart showing an example of the flow of environment label selection processing based on classifier determination;
- FIG. 6 is a flowchart showing an example of the flow of frequency correction processing; It is a figure which shows the hardware configuration example of a computer.
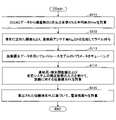
- 6 is a flow chart showing an example of the flow of communication design support processing according to the first embodiment;
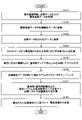
- 10 is a flow chart showing an example of the flow of communication design support processing according to the second embodiment;
- FIG. 11 is a flow chart showing an example of the flow of communication design support processing according to the third embodiment;
- FIG. FIG. 16 is a flow chart showing an example of the flow of communication design support processing according to the fourth embodiment;
- FIG. FIG. 16 is a flow chart showing an example of the flow of communication design support processing according to the fifth embodiment;
- FIG. FIG. 16 is a flow chart showing an example of the flow of communication design support processing according to the sixth embodiment;
- the communication design support system 1 is a system that supports communication design work in various processes such as introduction, investigation, and proposal of a wireless communication system.
- the communication design support device 10 includes a site survey unit 11, an environment label selection unit 12, a data processing unit 13, a radio wave intensity estimation unit 14, and a propagation model storage unit 15.
- the distance measuring device 30 is, for example, a sensor, LiDAR, etc., measures the distance between installed objects, inner walls, etc. in the communication usage environment, and transmits the measurement data to the communication design support device 10 .
- the wireless communication device 40 performs wireless communication in the communication usage environment, acquires information indicating the wireless communication specification such as received power, and transmits the information to the communication design support device 10 .
- the communication design support device 10 includes a site survey section 11 , an environment label selection section 12 , a data processing section 13 , a radio wave intensity estimation section 14 and a propagation model storage section 15 .
- the ray tracing model 101 is a kind of propagation model for estimating radio wave intensity by means of a technique called a ray tracing method, which simulates an image observed at a certain point by tracking radio waves.
- the site survey unit 11 acquires various types of information from the photographing device 20, the distance measuring device 30, the wireless communication device 40, etc., and data indicating the structure of the communication environment such as buildings and installations, such as 3D CAD (Three Dimensional Computer Aided Data). Design) data.
- 3D CAD Three Dimensional Computer Aided Data
- the environment label selection unit 12 assigns an environment label to the propagation model based on various information acquired from the photographing device 20, the distance measuring device 30, the wireless communication device 40, etc., the data indicating the structure generated by the site survey unit 11, and the like. to select.
- the environment label is data indicating the classification of the characteristics of the communication environment.
- the data processing unit 13 applies techniques such as machine learning to tune various propagation models stored in the propagation model storage unit 15 .
- the radio wave intensity estimation unit 14 estimates the radio wave intensity in the communication usage environment to be designed by applying various propagation models.
- the site survey unit 11 applies a technique such as SLAM (Simultaneous Localization and Mapping) to the image captured by the imaging device 20 or the measurement data measured by the distance measuring device 30 to determine the coordinates of the design target object, equipment, etc. is obtained as relative coordinate information.
- SLAM Simultaneous Localization and Mapping
- the site survey unit 11 may simply receive relative coordinate information to which techniques such as SLAM are applied.
- the site survey unit 11 also extracts radio wave intensity data from the measurement data received from the wireless communication device 40 .
- the site survey unit 11 converts the radio wave intensity data into propagation loss data (step S12). For example, the site survey unit 11 calculates the propagation loss PL using the following formula (1).
- Propagation loss PL Output Pt - Transmitting power loss Lt + Transmitting antenna gain Gt + Receiving antenna gain Gr - Receiving power loss Lr - Radio wave intensity Pr (1)
- step S13 the site survey unit 11 converts the point cloud data into 3D CAD data (step S13).
- 3D CAD data is data representing the shape of an object using a three-dimensional coordinate system. The processing from step S11 to step S13 may not be performed in this order. Details of these processes will be described later.
- the environment label selection unit 12 selects an environment label to be assigned to the propagation model based on the set of 3D CAD data with coordinate information and propagation loss data (step S14). Specifically, the environment label selection unit 12 extracts feature values (for example, structure density if the communication environment is a factory) from 3D CAD data with reference to past models, and determines the environment to be assigned by threshold determination. Select a label. Alternatively, the environment label selection unit 12 may select an environment label to be assigned using a classification machine learning device having an automatic propagation environment identification function. Details of these processes will be described later.
- feature values for example, structure density if the communication environment is a factory
- the propagation model can also be considered to be a different propagation model for each environmental label.
- the selection of the environment label to be given can also be said to be the selection of the propagation model.
- the data processing unit 13 tunes the parameters of the propagation model using the propagation loss data (step S15). Specifically, data processing unit 13 updates parameters of ray tracing model 101 and statistical model 102 . By tuning the propagation model according to the communication usage environment, it is possible to improve the estimation accuracy of the radio wave intensity. Details of the processing in step S15 will be described later.
- the radio wave intensity estimation unit 14 receives the input of the frequency band of the estimation system and calculates the propagation loss PL with respect to the distance (step S16).
- An estimation system is a communication usage environment system to be estimated. Specifically, the radio wave intensity estimating unit 14 inputs the frequency band to the propagation model (ray trace model 101 or statistical model 102) to which the environmental label is assigned, and performs simulation to calculate the propagation loss PL. Then, the radio wave intensity estimation unit 14 calculates the radio wave intensity Pr by the following equation (2) based on the calculated propagation loss PL (step S17).
- FIG. 3 is a flowchart showing an example of the flow of 3D CAD data generation processing.
- the 3D CAD data generation processing is the details of the processing from step S11 to step S13 described above.
- the site survey unit 11 collects measurement data from each device (step S21). Next, the site survey unit 11 executes the first to third processing flows in parallel. Note that the site survey unit 11 may process all or part of the first to third processing flows in an arbitrary order.
- the site survey unit 11 merges the point cloud data (step S221). Specifically, when the site survey unit 11 acquires point cloud data from a plurality of devices, the site survey unit 11 translates and rotates the coordinates from the positions of the three reference markers in order to match the respective coordinate systems. merge. Next, the site survey unit 11 separates layers of ceilings, floors, walls and other structures from the point cloud distribution (step S222). This is because the distribution of the amount of acquired point cloud data differs with respect to the surface area.
- the site survey unit 11 filters the point cloud data (step S223). Specifically, the site survey unit 11 performs filtering by downsampling using a "Voxel Grid Filter" or the like. When the collected measurement data is image data, the site survey unit 11 may model the pixels of the image as corresponding to the point cloud. Next, the site survey unit 11 divides the point group for each structure by the region growing method (step S224).
- the site survey unit 11 recognizes the object by CNN (Convolutional Neural Network) and adds typical material information of the recognized object (step S225). Subsequently, the site survey unit 11 executes plane detection by RANSAC (Random sample consensus) (step S234). In the process of step S234, the site survey unit 11 may subdivide the plane into plane elements by Delaunay triangulation after detecting the plane.
- This first processing flow generates 3D CAD data representing various structures including structures attached to the building such as ceilings, floors, walls, etc. and installations inside the building.
- the site survey unit 11 extracts coordinate data by SLAM (step S241).
- the site survey unit 11 integrates the results of the first to third processing flows and acquires a set of 3D CAD data with coordinate information and propagation loss data (step S25).
- CAD data such as buildings and structures are used to estimate propagation characteristics.
- an indoor environment such as a factory, there are cases where there is no data indicating the layout of the structure, and in such cases it is necessary to manually create a CAD of the environment.
- the site survey unit 11 includes an acquisition unit that acquires the point cloud data of the structure and the measurement data of the radio wave intensity, and an acquisition unit that performs object recognition and material determination of the point cloud data, and a structure that indicates the shape and material of the structure.
- a structure data generation unit that generates data
- a propagation loss calculation unit that calculates propagation loss based on measurement data of radio wave intensity in an environment including the structure, and data that associates the structure data with the propagation loss data.
- an output unit that outputs the .
- the structure data that indicates the shape and material of the structure contains information related to the quality of wireless communication, so it can be said that it is data suitable for wireless communication propagation simulation.
- the site survey unit 11 further includes an extraction unit that extracts coordinate data by SLAM.
- step S ⁇ b>15 the data processing unit 13 tunes the ray tracing model 101 or the statistical model 102 .
- FIG. 4 is a flowchart showing an example of the flow of ray tracing model tuning processing.
- the data processing unit 13 acquires a set of 3D CAD data having the coordinate information acquired by the process of step S26 of the 3D CAD data generation process described above and propagation loss data (step S31). Let the propagation loss data be (X, Y, Z, PL meas ). In addition, when the frequency band of the wireless standard to be measured and the frequency band of the wireless standard to be estimated are different, it is necessary to estimate the frequency characteristics in the data processing unit 13, and PL meas is propagation loss data of two or more different frequency bands. need to get
- the data processing unit 13 calculates the electric field intensity E for each relative coordinate by ray tracing based on the following formula (step S32).
- the data processing unit 13 calculates a parameter ⁇ that minimizes the optimization function at each coordinate (step S34).
- the optimization function is eg ⁇ (PL meas ⁇ PL pred ) 2 .
- PL measure uses propagation loss data of two or more different frequency bands.
- FIG. 5 is a flowchart showing an example of the flow of statistical model tuning processing.
- the data processing unit 13 acquires a set of 3D CAD data and propagation loss data having the coordinate information acquired by the process of step S26 of the 3D CAD data generation process described above (step S41). Let the propagation loss data be (X, Y, Z, PL meas ). In addition, when the frequency band of the wireless standard to be measured and the frequency band of the wireless standard to be estimated are different, it is necessary to estimate the frequency characteristics in the data processing unit 13, so PL measure is the propagation loss of two or more different frequency bands. Data.
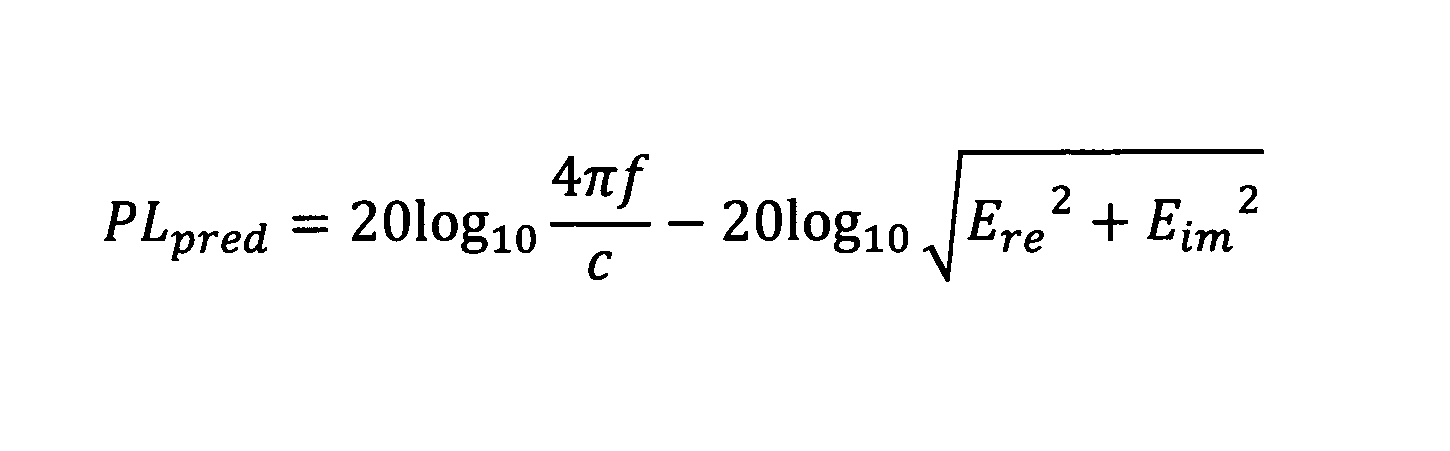
- the data processing unit 13 calculates the transmission/reception distance d for each relative coordinate (step S42). Then, the data processing unit 13 calculates the propagation loss PL pred from the electric field intensity E based on the following equation (step S43).
- the parameter ⁇ has frequency characteristics and is a correction coefficient that corrects the frequency characteristics.
- the data processing unit 13 calculates parameters ⁇ , ⁇ , ⁇ that minimize the optimization function at each coordinate (step S44).
- PL meas is propagation loss data for two or more different frequency bands.
- the rate is calculated based on the results of a simulation based on a set of relative coordinates, 3D CAD data, and propagation loss data obtained by a site survey, and the propagation loss data obtained in the usage environment.
- the race parameter (effective reflection coefficient) or each coefficient of the statistical model is optimized using the radio wave intensity estimation accuracy as an index, and the propagation model is tuned according to the usage environment. This allows the characterization of location-specific and different frequency bands to be evaluated.
- the data processing unit 13 includes an acquisition unit that acquires data in which the structure data including the coordinate data and the data indicating the propagation loss are associated with each other, and parameters that update the parameters of the propagation model based on the acquired data. It can also be said to include an update part. It can be said that the parameter updating unit reflects the frequency characteristics by applying the propagation model to calculate the electric field intensity and updating the parameter to minimize the propagation loss based on the calculated electric field intensity.
- FIG. 6 is a flowchart showing an example of the flow of environment label selection processing based on threshold determination.
- the environment label selection unit 12 acquires a set of 3D CAD data and propagation loss data having coordinate information acquired by the process of step S26 of the 3D CAD data generation process described above (step S51). Next, the environment label selection unit 12 calculates the two-dimensional occupation rate X (%) and average height (m) of the structure from the 3D CAD data (step S52). Next, the environment label selection unit 12 compares predetermined thresholds X 0 and X and base station antenna heights H BS and H, and assigns a label (step S53). Specifically, it is determined as follows.
- FIG. 8 is a flowchart showing an example of the flow of environment label selection processing based on classifier determination.
- the environment label selection unit 12 acquires a set of 3D CAD data with coordinate information and propagation loss data acquired at a place to be estimated (step S71). Next, the environment label selection unit 12 calculates the two-dimensional occupation rate X (%) and average height (m) of the structure from the 3D CAD data (step S72). Subsequently, the environment label selection unit 12 inputs a set of the propagation loss PL, the two-dimensional occupation rate X (%), and the average height H (m) to the classifier (step S73). Then, the environment label selection unit 12 determines in which label the data set of the place to be estimated belongs (step S74).
- the communication design support device 10 by assigning an environment label according to the usage environment, the same effect as selecting a propagation model according to the usage environment can be obtained.
- the environment label selection unit 12 includes an acquisition unit that acquires data in which structure data including coordinate data and data indicating propagation loss are associated with each other, and a structure shown in the structure data based on the acquired data. and a selection unit that selects data indicating the classification of the characteristics of the communication environment in the object.
- the acquisition unit further acquires information indicating the height of the antenna of the base station
- the selection unit calculates the occupancy rate of the structure and the statistical value of the height of the structure, determines the predetermined threshold value and the occupancy rate and the comparison result between the antenna height and the statistical value, the data indicating the classification of the characteristics of the communication environment is selected.
- the selection unit may calculate the occupancy rate of the structure and the statistic value of the height of the structure, input them to the classifier, and select data indicating the classification of the characteristics of the communication environment. .
- the environment label selection unit 12 further includes a learning unit that learns a classifier by classification-type machine learning.
- FIG. 9 is a flowchart showing an example of the flow of frequency correction processing.
- the radio wave intensity estimation unit 14 estimates the width, height, shape, position, etc. of each surface of objects (structures, buildings, etc.) in the target area. may be converted into two-dimensional mesh data. Since the mesh data has the format of image data, it has the feature that it can be read and processed at high speed using a GPU (Graphics Processing Unit).
- GPU Graphics Processing Unit
- the communication design support apparatus 10 includes a propagation model storage unit that stores a propagation model, an acquisition unit that acquires point cloud data of a structure and measurement data of radio wave intensity in multiple frequency bands, and a propagation model based on the acquired data. It can be said that a parameter updater that updates the parameters of the model and an estimator that estimates the propagation loss based on the propagation model are provided. This makes it possible to implement communication design that does not rely on the skill of the user.
- the communication design support apparatus 10 can be realized, for example, by causing a computer to execute a program describing the processing contents described in this embodiment.
- the above program can be recorded on a computer-readable recording medium (portable memory, etc.), saved, or distributed. It is also possible to provide the above program through a network such as the Internet or e-mail.
- FIG. 10 is a diagram showing a hardware configuration example of the computer.
- the computer of FIG. 10 has a drive device 1000, an auxiliary storage device 1002, a memory device 1003, a CPU 1004, an interface device 1005, a display device 1006, an input device 1007, an output device 1008, etc., which are connected to each other via a bus B, respectively.
- a program that implements the processing in the computer is provided by a recording medium 1001 such as a CD-ROM or memory card, for example.
- a recording medium 1001 such as a CD-ROM or memory card
- the program is installed from the recording medium 1001 to the auxiliary storage device 1002 via the drive device 1000 .
- the program does not necessarily need to be installed from the recording medium 1001, and may be downloaded from another computer via the network.
- the auxiliary storage device 1002 stores installed programs, as well as necessary files and data.
- Example 1 In Example 1, for the purpose of automating local survey work, the local person in charge uses a tablet terminal such as a smartphone to take pictures, acquire Lidar, and measure the radio standard radio wave intensity for measurement while moving around the site. do.
- the communication design support device 10 creates and displays 3D CAD data from the measurement results.
- FIG. 11 is a flowchart showing an example of the flow of communication design support processing according to the first embodiment.
- the site survey unit 11 acquires relative coordinate information, point cloud data, and radio wave intensity data based on the input information (step S91). Since the point cloud data, the radio wave intensity, and the coordinates are acquired by different modules, they are collated by time stamps. Subsequently, based on the wireless standard information, the site survey unit 11 refers to the reception power-reception antenna end power conversion table of the measuring device, transmission EIRP information, etc., and converts the radio wave intensity data into propagation loss data (step S92). ). Next, the site survey unit 11 converts the point cloud data into 3D CAD data (step S93).
- Local personnel or sales/SE personnel can refer to the created 3D CAD data and propagation loss data sets, or call them for use in design.
- Example 2 In the second embodiment, an example is shown in which a local person in charge simply estimates the propagation quality of a wireless standard different from that at the time of measurement based on the measurement result of the wireless standard for measurement, and utilizes it for estimating the scale of equipment and the like.
- the environment label selection unit 12 calculates the two-dimensional occupation rate X (%) and average height (m) of the structure from the 3D CAD data (step S101). Next, the environment label selection unit 12 compares predetermined thresholds X 0 and X and base station antenna heights H BS and H, and assigns a label (step S102).
- the radio wave intensity estimating unit 14 the statistical model and the ray trace model are significantly different in the characteristics of the calculation time and output propagation quality information.
- the raytrace model can estimate the path loss for each location, whereas the statistical model can only estimate the change of the path loss over distance. However, the ray trace model has the characteristic of requiring more computation time than the statistical model. Therefore, a statistical model is used when simply estimating the facility scale, etc.
- the data processing unit 13 tunes the parameters of the statistical model using the propagation loss data (step S103). Subsequently, the radio wave intensity estimation unit 14 receives the input of the base station-terminal distance and the frequency band of the estimation system, and calculates the propagation loss PL with respect to the distance (step S104). The radio wave intensity estimation unit 14 calculates the radio wave intensity Pr based on the calculated propagation loss PL (step S105).
- the local person in charge or the sales/SE person in charge can design or estimate based on the estimated radio field strength Pr.
- FIG. 13 is a flowchart showing an example of the flow of communication design support processing according to the third embodiment.
- the environment label selection unit 12 calculates the two-dimensional occupation ratio X (%) and the average height (m) of the structure from the 3D CAD data (step S111). Next, the environment label selection unit 12 compares predetermined thresholds X 0 and X and base station antenna heights H BS and H, and assigns a label (step S112).
- the radio wave intensity estimation unit 14 uses a ray trace model that can be estimated for each terminal station position, the data processing unit 13 tunes the parameters of the ray trace model using the propagation loss data (step S113). Subsequently, the radio wave intensity estimation unit 14 receives the input of the base station-terminal distance and the frequency band of the estimation system, and calculates the propagation loss PL with respect to the distance (step S114). The radio wave intensity estimation unit 14 calculates the radio wave intensity Pr based on the calculated propagation loss PL (step S115).
- Example 4 shows an example in which a local person in charge or a sales/SE person in charge determines in advance whether or not a system change is necessary in a wireless standard operation phase in an indoor local area.
- FIG. 14 is a flowchart showing an example of the flow of communication design support processing according to the fourth embodiment.
- the site survey unit 11 acquires relative coordinate information, point cloud data, and radio wave intensity data (step S121). Next, the site survey unit 11 converts the radio wave intensity data into propagation loss data (step S122). Subsequently, the site survey unit 11 converts the point cloud data into 3D CAD data (step S123). Next, the environment label selection unit 12 calculates the two-dimensional occupation ratio X (%) and average height (m) of the structure from the 3D CAD data (step S124). The environment label selection unit 12 compares predetermined thresholds X 0 and X and base station antenna heights H BS and H, and assigns a label (step S125).
- the data processing unit 13 uses the propagation loss data to tune the parameters of the statistical model (step S126). Subsequently, the radio wave intensity estimation unit 14 receives the input of the base station-terminal distance and the frequency band of the estimation system, and calculates the propagation loss PL with respect to the distance (step S127). The radio wave intensity estimation unit 14 calculates the radio wave intensity Pr based on the calculated propagation loss PL (step S128).
- the communication design support apparatus 10 may use 3D CAD data of the corresponding area manually edited by the user, instead of the processing from step S121 to step S123 described above.
- the site survey unit 11 may have a function of accepting editing of 3D CAD data by a user.
- the local person in charge or the sales/SE person in charge can judge whether it is necessary to change the design of the wireless standard in operation based on the estimated radio field strength Pr.
- a fifth embodiment shows an example of estimating the propagation quality of a new wireless standard when an indoor local area is newly established (factory, etc.).
- FIG. 15 is a flowchart showing an example of the flow of communication design support processing according to the fifth embodiment.
- a user such as a local person in charge or a sales/SE person in charge creates 3D CAD data from the layout data of the new environment and activates the environment label selection unit 12 .
- the environment label selection unit 12 calculates the two-dimensional occupation rate X (%) and the average height (m) of the structure from the 3D CAD data (step S131).
- the environment label selection unit 12 compares predetermined thresholds X 0 and X and base station antenna heights H BS and H, and assigns a label (step S132).
- the data processing unit 13 extracts the accumulated measurement data of the corresponding label (step S133).
- the data processing unit 13 tunes the parameters of the statistical model using the propagation loss data (step S134).
- the radio wave intensity estimation unit 14 receives the input of the base station-terminal distance and the frequency band of the estimation system, and calculates the propagation loss PL with respect to the distance (step S135).
- the radio wave intensity estimation unit 14 calculates the radio wave intensity Pr based on the calculated propagation loss PL (step S136).
- Example 6 is an example of estimating the propagation quality of the wireless standard and using it for estimating the size of the facility, etc. when there is no layout data and the wireless standard cannot be measured when a new indoor local area is established (factory, etc.). indicates
- FIG. 16 is a flow chart showing an example of the flow of communication design support processing according to the sixth embodiment.
- a local person in charge or a sales/SE person in charge manually creates a typical indoor local area environment as 3D CAD data and activates the environment label selection unit 12 .
- the environment label selection unit 12 calculates the two-dimensional occupation rate X (%) and average height (m) of the structure from the 3D CAD data (step S141).
- the environment label selection unit 12 compares predetermined thresholds X 0 and X and base station antenna heights H BS and H, and assigns a label (step S142).
- the radio wave intensity estimation unit 14 calculates the propagation loss PL using a ray trace model that can be estimated for each terminal station position (step S143).
- the data processing unit 13 tunes the parameters of the statistical model using the calculated propagation loss data (step S144).
- the radio wave intensity estimation unit 14 receives the input of the base station-terminal distance and the frequency band of the estimation system, and calculates the propagation loss PL with respect to the distance (step S145).
- the radio wave intensity estimation unit 14 calculates the radio wave intensity Pr based on the calculated propagation loss PL (step S146).
- This specification discloses at least a communication design support apparatus, a communication design support method, and a program according to the following items.
- (Section 1) a propagation model storage unit that stores a propagation model; an acquisition unit that acquires data in which structure data including coordinate data is associated with data indicating propagation loss in a plurality of frequency bands; an input reception unit that receives input of a frequency band for which radio wave intensity is to be estimated; an estimating unit that inputs the frequency band to the propagation model and estimates a propagation loss; Communication design support device.
- the propagation model is a statistical model, The parameter updating unit calculates the electric field intensity according to the distance between transmission and reception for each relative coordinate, The communication design support device according to item 3.
- the communication design support device according to item 3.
- (Section 7) A program for causing a computer to function as the communication design support device according to any one of items 1 to 5.
- Communication design support system 10
- Communication design support device 11
- Site survey unit 12
- Environmental label selection unit 13
- Data processing unit 14
- Radio wave intensity estimation unit 15
- Propagation model storage unit 20
- Imaging device 30
- Distance measuring device 40
- Wireless communication device 101
- Ray trace model 102
- Statistics Model 1000 Drive device 1001
- Recording medium 1002
- Auxiliary storage device 1003
- Memory device 1004
- CPU 1005 interface device 1006 display device 1007 input device 1008 output device
Landscapes
- Engineering & Computer Science (AREA)
- Signal Processing (AREA)
- Computer Networks & Wireless Communication (AREA)
- Mobile Radio Communication Systems (AREA)
- Monitoring And Testing Of Transmission In General (AREA)
Abstract
Description
図1は、通信設計支援システムの全体構成例および通信設計支援装置の機能構成例を示す図である。通信設計支援システム1は、通信設計支援装置10と、撮影装置20と、測距装置30と、無線通信装置40と、を備える。
通信設計支援装置10は、サイトサーベイ部11と、環境ラベル選択部12と、データ加工部13と、電波強度推定部14と、伝搬モデル記憶部15と、を備える。

(2)X0>X、HBS>Hのとき、低密度・低クラッタモデル
(3)X0<X、HBS<Hのとき、高密度・高クラッタモデル
(4)X0<X、HBS>Hのとき、高密度・低クラッタモデル
本実施形態に係る通信設計支援装置10は、例えば、コンピュータに、本実施形態で説明する処理内容を記述したプログラムを実行させることにより実現することができる。
実施例1では、現地サーベイ業務の自動化を目的とし、現地の担当者が、現地を移動しながら、スマートフォン等のタブレット端末を用いて写真撮影、Lidar取得および測定用の無線規格の電波強度を測定する。通信設計支援装置10は、測定結果から3DCADデータを作成および表示する。
実施例2では、現地担当者が測定用の無線規格の測定結果に基づいて、測定時とは異なる無線規格の伝搬品質を簡易推定し、設備規模等の見積もりに利用する例を示す。
実施例3では、無線設備の運用設計担当者が測定用の無線規格の測定結果に基づいて、測定時とは異なる無線規格の伝搬品質を指定された端末局位置ごとに推定し、無線パラメータを設計する例を示す。
実施例4では、屋内ローカルエリアでの無線規格運用フェーズにおいて、現地担当者または営業/SE担当者が、システム変更要否を未然に判定する例を示す。
実施例5では、屋内ローカルエリアの新設時(工場など)において、新設する無線規格の伝搬品質を推定する例を示す。
実施例6では、屋内ローカルエリアの新設時(工場など)において、レイアウトデータが無く、無線規格の測定が出来ない場合において、無線規格の伝搬品質を推定し、設備規模等の見積もりに利用する例を示す。
本実施形態に係る技術によれば、実施例1から実施例6までのようなさまざまなユーザの利用目的に応じて無線通信の設計を支援することが可能となる。なお、通信設計支援装置10の各機能部(サイトサーベイ部11、環境ラベル選択部12、データ加工部13および電波強度推定部14)は、実施例1から実施例6までの各実施例に示されるように、ユーザの操作に応じて適宜選択された機能を実行する。
本明細書には、少なくとも下記各項の通信設計支援装置、通信設計支援方法およびプログラムが開示されている。
(第1項)
伝搬モデルを記憶する伝搬モデル記憶部と、
座標データを含む構造物データと複数周波数帯の伝搬損失を示すデータとを対応付けたデータを取得する取得部と、
電波強度の推定の対象となる周波数帯の入力を受け付ける入力受付部と、
前記伝搬モデルに、前記周波数帯を入力して伝搬損失を推定する推定部と、を備える、
通信設計支援装置。
(第2項)
複数周波数帯で取得されたデータに基づいて、前記伝搬モデルのパラメータを更新するパラメータ更新部をさらに備え、
前記推定部は、更新された前記パラメータの前記伝搬モデルに、前記周波数帯を入力して前記伝搬損失を推定する、
第1項に記載の通信設計支援装置。
(第3項)
前記パラメータ更新部は、前記伝搬モデルを適用して複数周波数帯の電界強度を算出し、算出された電界強度に基づく複数周波数帯の伝搬損失が最小化されるパラメータに更新することで、周波数特性を反映する、
第2項に記載の通信設計支援装置。
(第4項)
前記伝搬モデルはレイトレースモデルであって、
前記パラメータ更新部は、レイトレースにより相対座標ごとの前記電界強度を算出する、
第3項に記載の通信設計支援装置。
(第5項)
前記伝搬モデルは統計モデルであって、
前記パラメータ更新部は、相対座標ごとに送受信間距離に応じた前記電界強度を算出する、
第3項に記載の通信設計支援装置。
(第6項)
伝搬モデルを記憶するコンピュータが実行する通信設計支援方法であって、
座標データを含む構造物データと伝搬損失を示すデータとを対応付けたデータを取得するステップと、
取得されたデータに基づいて、前記伝搬モデルのパラメータを更新するステップと、を備える、
通信設計支援方法。
(第7項)
コンピュータを、第1項から第5項のいずれか1項に記載の通信設計支援装置として機能させるためのプログラム。
10 通信設計支援装置
11 サイトサーベイ部
12 環境ラベル選択部
13 データ加工部
14 電波強度推定部
15 伝搬モデル記憶部
20 撮影装置
30 測距装置
40 無線通信装置
101 レイトレースモデル
102 統計モデル
1000 ドライブ装置
1001 記録媒体
1002 補助記憶装置
1003 メモリ装置
1004 CPU
1005 インタフェース装置
1006 表示装置
1007 入力装置
1008 出力装置
Claims (7)
- 伝搬モデルを記憶する伝搬モデル記憶部と、
座標データを含む構造物データと複数周波数帯の伝搬損失を示すデータとを対応付けたデータを取得する取得部と、
電波強度の推定の対象となる周波数帯の入力を受け付ける入力受付部と、
前記伝搬モデルに、前記周波数帯を入力して伝搬損失を推定する推定部と、を備える、
通信設計支援装置。 - 複数周波数帯で取得されたデータに基づいて、前記伝搬モデルのパラメータを更新するパラメータ更新部をさらに備え、
前記推定部は、更新された前記パラメータの前記伝搬モデルに、前記周波数帯を入力して前記伝搬損失を推定する、
請求項1に記載の通信設計支援装置。 - 前記パラメータ更新部は、前記伝搬モデルを適用して複数周波数帯の電界強度を算出し、算出された電界強度に基づく複数周波数帯の伝搬損失が最小化されるパラメータに更新することで、周波数特性を反映する、
請求項2に記載の通信設計支援装置。 - 前記伝搬モデルはレイトレースモデルであって、
前記パラメータ更新部は、レイトレースにより相対座標ごとの前記電界強度を算出する、
請求項3に記載の通信設計支援装置。 - 前記伝搬モデルは統計モデルであって、
前記パラメータ更新部は、相対座標ごとに送受信間距離に応じた前記電界強度を算出する、
請求項3に記載の通信設計支援装置。 - 伝搬モデルを記憶するコンピュータが実行する通信設計支援方法であって、
座標データを含む構造物データと複数周波数帯の伝搬損失を示すデータとを対応付けたデータを取得するステップと、
取得されたデータに基づいて、前記伝搬モデルのパラメータを更新するステップと、を備える、
通信設計支援方法。 - コンピュータを、請求項1から5のいずれか1項に記載の通信設計支援装置として機能させるためのプログラム。
Priority Applications (3)
| Application Number | Priority Date | Filing Date | Title |
|---|---|---|---|
| PCT/JP2021/014535 WO2022215134A1 (ja) | 2021-04-05 | 2021-04-05 | 通信設計支援装置、通信設計支援方法およびプログラム |
| JP2023512524A JP7574917B2 (ja) | 2021-04-05 | 2021-04-05 | 通信設計支援装置、通信設計支援方法およびプログラム |
| US18/547,945 US20250016707A1 (en) | 2021-04-05 | 2021-04-05 | Communication design support apparatus, communication design support method and program |
Applications Claiming Priority (1)
| Application Number | Priority Date | Filing Date | Title |
|---|---|---|---|
| PCT/JP2021/014535 WO2022215134A1 (ja) | 2021-04-05 | 2021-04-05 | 通信設計支援装置、通信設計支援方法およびプログラム |
Publications (1)
| Publication Number | Publication Date |
|---|---|
| WO2022215134A1 true WO2022215134A1 (ja) | 2022-10-13 |
Family
ID=83545242
Family Applications (1)
| Application Number | Title | Priority Date | Filing Date |
|---|---|---|---|
| PCT/JP2021/014535 Ceased WO2022215134A1 (ja) | 2021-04-05 | 2021-04-05 | 通信設計支援装置、通信設計支援方法およびプログラム |
Country Status (3)
| Country | Link |
|---|---|
| US (1) | US20250016707A1 (ja) |
| JP (1) | JP7574917B2 (ja) |
| WO (1) | WO2022215134A1 (ja) |
Citations (4)
| Publication number | Priority date | Publication date | Assignee | Title |
|---|---|---|---|---|
| WO2012011147A1 (ja) * | 2010-07-21 | 2012-01-26 | ソフトバンクBb株式会社 | 通信特性解析システム、通信特性解析方法、及び通信特性解析プログラム |
| JP2014082579A (ja) * | 2012-10-15 | 2014-05-08 | Kddi Corp | エリア設計支援システム、エリア設計支援装置、エリア設計支援方法およびエリア設計支援プログラム |
| WO2020016765A1 (en) * | 2018-07-17 | 2020-01-23 | Reliance Jio Infocomm Limited | System and method for 3d propagation modelling for planning of a radio network |
| US20210036792A1 (en) * | 2018-04-16 | 2021-02-04 | Commscope Technologies Llc | Real-time propagation analysis for communications systems |
Family Cites Families (28)
| Publication number | Priority date | Publication date | Assignee | Title |
|---|---|---|---|---|
| US5796620A (en) * | 1995-02-03 | 1998-08-18 | Cleveland Advanced Manufacturing Program | Computerized system for lost foam casting process using rapid tooling set-up |
| US6697647B2 (en) * | 1996-06-10 | 2004-02-24 | Hitachi, Ltd. | Cellular mobile telephone apparatus and an alarm device therefor |
| JPH10126388A (ja) * | 1996-10-14 | 1998-05-15 | Matsushita Electric Ind Co Ltd | 無線通信網におけるエラー訂正方法 |
| JP4068512B2 (ja) * | 2003-06-10 | 2008-03-26 | 株式会社東芝 | 通信装置、携帯端末装置、通信システム、通信制御プログラム及び通信制御方法 |
| JP5740084B2 (ja) * | 2008-12-09 | 2015-06-24 | 株式会社東芝 | タービン発電機におけるステータコイルの接続組立の3次元形状測定方法及び3次元形状測定装置用冶具 |
| JP5469161B2 (ja) * | 2009-04-02 | 2014-04-09 | ホーチキ株式会社 | 無線防災ノード及び無線防災システム |
| JP2011211619A (ja) * | 2010-03-30 | 2011-10-20 | Sony Corp | 通信制御装置、端末装置、無線通信システム、無線通信方法およびプログラム |
| US20120230260A1 (en) * | 2011-03-08 | 2012-09-13 | Elena Virtej | Apparatus and Method for Allocating Communication Resources in a Communication System |
| CN103702338B (zh) * | 2013-12-24 | 2017-04-12 | 英国Ranplan无线网络设计公司 | 一种快速建立室内无线信号指纹数据库的方法 |
| EP3179800B1 (en) * | 2014-08-08 | 2021-03-10 | KYOCERA Corporation | User terminal |
| JP6467879B2 (ja) * | 2014-11-11 | 2019-02-13 | 富士通株式会社 | 引出線配置位置決定プログラム、引出線配置位置決定方法および引出線配置位置決定装置 |
| US9928410B2 (en) * | 2014-11-24 | 2018-03-27 | Samsung Electronics Co., Ltd. | Method and apparatus for recognizing object, and method and apparatus for training recognizer |
| KR101526506B1 (ko) * | 2015-03-26 | 2015-06-09 | 김상환 | 청각적 정보 보안시스템 |
| JP6680086B2 (ja) * | 2016-05-31 | 2020-04-15 | 富士通株式会社 | 選択制御方法、選択制御装置および選択制御プログラム |
| JP6680085B2 (ja) * | 2016-05-31 | 2020-04-15 | 富士通株式会社 | 表示制御方法、表示制御装置および表示制御プログラム |
| EP3515126B1 (en) * | 2016-09-29 | 2021-11-10 | Huawei Technologies Co., Ltd. | Data transmission method and terminal device therefor |
| JP6889574B2 (ja) * | 2017-03-03 | 2021-06-18 | 株式会社キーエンス | ロボット設定装置、ロボット設定方法、ロボット設定プログラム及びコンピュータで読み取り可能な記録媒体並びに記録した機器 |
| US11157771B2 (en) * | 2017-05-12 | 2021-10-26 | Aselsan Elektronik Sanayi Ve Ticaret Anonim Sirketi | Method for correlation filter based visual tracking |
| CN108965690B (zh) * | 2017-05-17 | 2021-02-26 | 欧姆龙株式会社 | 图像处理系统、图像处理装置及计算机可读存储介质 |
| JP6970551B2 (ja) * | 2017-07-31 | 2021-11-24 | 株式会社キーエンス | 形状測定装置及び形状測定方法 |
| EP3656166B1 (en) * | 2017-08-10 | 2024-07-17 | Sony Group Corporation | Wireless communications system, communications device and wireless network infrastructure |
| CN107633218B (zh) * | 2017-09-08 | 2021-06-08 | 百度在线网络技术(北京)有限公司 | 用于生成图像的方法和装置 |
| JP6430079B1 (ja) * | 2017-10-05 | 2018-11-28 | 三菱電機株式会社 | 監視システムおよび監視方法 |
| JP6633604B2 (ja) * | 2017-12-21 | 2020-01-22 | アンリツ株式会社 | アンテナ測定システム及びアンテナ測定方法 |
| US11329780B2 (en) * | 2019-01-16 | 2022-05-10 | Qualcomm Incorporated | Physical layer non-line-of-sight (LOS) path discrimination using multiple frequency carriers |
| JP7140071B2 (ja) * | 2019-07-24 | 2022-09-21 | トヨタ自動車株式会社 | 車両監視システム及び車両監視方法 |
| JP7538595B2 (ja) * | 2019-12-12 | 2024-08-22 | 株式会社キーエンス | 測定装置 |
| JP7040809B2 (ja) * | 2020-03-19 | 2022-03-23 | Totalmasters株式会社 | 建設現場管理装置 |
-
2021
- 2021-04-05 US US18/547,945 patent/US20250016707A1/en active Pending
- 2021-04-05 WO PCT/JP2021/014535 patent/WO2022215134A1/ja not_active Ceased
- 2021-04-05 JP JP2023512524A patent/JP7574917B2/ja active Active
Patent Citations (4)
| Publication number | Priority date | Publication date | Assignee | Title |
|---|---|---|---|---|
| WO2012011147A1 (ja) * | 2010-07-21 | 2012-01-26 | ソフトバンクBb株式会社 | 通信特性解析システム、通信特性解析方法、及び通信特性解析プログラム |
| JP2014082579A (ja) * | 2012-10-15 | 2014-05-08 | Kddi Corp | エリア設計支援システム、エリア設計支援装置、エリア設計支援方法およびエリア設計支援プログラム |
| US20210036792A1 (en) * | 2018-04-16 | 2021-02-04 | Commscope Technologies Llc | Real-time propagation analysis for communications systems |
| WO2020016765A1 (en) * | 2018-07-17 | 2020-01-23 | Reliance Jio Infocomm Limited | System and method for 3d propagation modelling for planning of a radio network |
Also Published As
| Publication number | Publication date |
|---|---|
| US20250016707A1 (en) | 2025-01-09 |
| JPWO2022215134A1 (ja) | 2022-10-13 |
| JP7574917B2 (ja) | 2024-10-29 |
Similar Documents
| Publication | Publication Date | Title |
|---|---|---|
| CN109275093B (zh) | 基于uwb定位与激光地图匹配的定位方法和移动终端 | |
| CN104574386B (zh) | 一种基于三维环境模型匹配的室内定位方法 | |
| JP6456141B2 (ja) | 地図データの生成 | |
| US11894880B2 (en) | Automatic fine-grained radio map construction and adaption | |
| CN107517446A (zh) | 基于Wi‑Fi热点的室内定位方法及装置 | |
| JP6093792B2 (ja) | 測位装置、測位方法、測位プログラム、および、測位システム | |
| CN111709988A (zh) | 一种物体的特征信息的确定方法、装置、电子设备及存储介质 | |
| CN103354909A (zh) | 位置确定装置、位置确定方法、位置确定系统以及程序 | |
| CN112305559A (zh) | 基于地面定点激光雷达扫描的输电线距离测量方法、装置、系统和电子设备 | |
| WO2017121168A1 (zh) | 簇式磁场定位的方法、装置和系统 | |
| CN115457202B (zh) | 一种三维模型更新的方法、装置及存储介质 | |
| KR20120112293A (ko) | 이동체의 위치 판단 장치 및 위치 판단 방법 | |
| CN115808170A (zh) | 一种融合蓝牙与视频分析的室内实时定位方法 | |
| JP7687387B2 (ja) | 通信設計支援装置、通信設計支援方法およびプログラム | |
| JP7673796B2 (ja) | 通信設計支援装置、通信設計支援方法およびプログラム | |
| CN119881794A (zh) | 一种基于粒子滤波和pdr的多源融合室内定位方法及设备 | |
| JP7574915B2 (ja) | 通信設計支援装置、通信設計支援方法およびプログラム | |
| CN116939815A (zh) | 一种基于激光点云地图的uwb定位基站选择方法 | |
| KR20150060456A (ko) | 전파지문지도 생성 장치 및 방법 | |
| JP7574916B2 (ja) | 通信設計支援装置、通信設計支援方法およびプログラム | |
| JP7574917B2 (ja) | 通信設計支援装置、通信設計支援方法およびプログラム | |
| JP7673795B2 (ja) | 通信設計支援装置、通信設計支援方法およびプログラム | |
| CN109212464B (zh) | 估计终端间距及位置规划的方法、设备 | |
| CN116664809A (zh) | 三维信息获取方法、装置、计算机设备、存储介质和产品 | |
| JP6582976B2 (ja) | 推定装置、推定方法、および推定プログラム |
Legal Events
| Date | Code | Title | Description |
|---|---|---|---|
| 121 | Ep: the epo has been informed by wipo that ep was designated in this application |
Ref document number: 21935942 Country of ref document: EP Kind code of ref document: A1 |
|
| WWE | Wipo information: entry into national phase |
Ref document number: 18547945 Country of ref document: US |
|
| WWE | Wipo information: entry into national phase |
Ref document number: 2023512524 Country of ref document: JP |
|
| NENP | Non-entry into the national phase |
Ref country code: DE |
|
| 122 | Ep: pct application non-entry in european phase |
Ref document number: 21935942 Country of ref document: EP Kind code of ref document: A1 |