WO2022185643A1 - 画像処理装置、画像処理装置の作動方法、画像処理装置の作動プログラム - Google Patents
画像処理装置、画像処理装置の作動方法、画像処理装置の作動プログラム Download PDFInfo
- Publication number
- WO2022185643A1 WO2022185643A1 PCT/JP2021/045208 JP2021045208W WO2022185643A1 WO 2022185643 A1 WO2022185643 A1 WO 2022185643A1 JP 2021045208 W JP2021045208 W JP 2021045208W WO 2022185643 A1 WO2022185643 A1 WO 2022185643A1
- Authority
- WO
- WIPO (PCT)
- Prior art keywords
- image
- position display
- marker
- marker position
- output
- Prior art date
- Legal status (The legal status is an assumption and is not a legal conclusion. Google has not performed a legal analysis and makes no representation as to the accuracy of the status listed.)
- Ceased
Links
Images


Classifications
-
- G—PHYSICS
- G06—COMPUTING OR CALCULATING; COUNTING
- G06T—IMAGE DATA PROCESSING OR GENERATION, IN GENERAL
- G06T7/00—Image analysis
- G06T7/0002—Inspection of images, e.g. flaw detection
- G06T7/0012—Biomedical image inspection
-
- A—HUMAN NECESSITIES
- A61—MEDICAL OR VETERINARY SCIENCE; HYGIENE
- A61B—DIAGNOSIS; SURGERY; IDENTIFICATION
- A61B6/00—Apparatus or devices for radiation diagnosis; Apparatus or devices for radiation diagnosis combined with radiation therapy equipment
- A61B6/02—Arrangements for diagnosis sequentially in different planes; Stereoscopic radiation diagnosis
- A61B6/03—Computed tomography [CT]
- A61B6/032—Transmission computed tomography [CT]
-
- A—HUMAN NECESSITIES
- A61—MEDICAL OR VETERINARY SCIENCE; HYGIENE
- A61B—DIAGNOSIS; SURGERY; IDENTIFICATION
- A61B6/00—Apparatus or devices for radiation diagnosis; Apparatus or devices for radiation diagnosis combined with radiation therapy equipment
- A61B6/50—Apparatus or devices for radiation diagnosis; Apparatus or devices for radiation diagnosis combined with radiation therapy equipment specially adapted for specific body parts; specially adapted for specific clinical applications
- A61B6/505—Apparatus or devices for radiation diagnosis; Apparatus or devices for radiation diagnosis combined with radiation therapy equipment specially adapted for specific body parts; specially adapted for specific clinical applications for diagnosis of bone
-
- G—PHYSICS
- G06—COMPUTING OR CALCULATING; COUNTING
- G06T—IMAGE DATA PROCESSING OR GENERATION, IN GENERAL
- G06T7/00—Image analysis
- G06T7/10—Segmentation; Edge detection
- G06T7/11—Region-based segmentation
-
- G—PHYSICS
- G06—COMPUTING OR CALCULATING; COUNTING
- G06T—IMAGE DATA PROCESSING OR GENERATION, IN GENERAL
- G06T7/00—Image analysis
- G06T7/70—Determining position or orientation of objects or cameras
-
- G—PHYSICS
- G06—COMPUTING OR CALCULATING; COUNTING
- G06V—IMAGE OR VIDEO RECOGNITION OR UNDERSTANDING
- G06V10/00—Arrangements for image or video recognition or understanding
- G06V10/20—Image preprocessing
- G06V10/25—Determination of region of interest [ROI] or a volume of interest [VOI]
-
- G—PHYSICS
- G06—COMPUTING OR CALCULATING; COUNTING
- G06V—IMAGE OR VIDEO RECOGNITION OR UNDERSTANDING
- G06V20/00—Scenes; Scene-specific elements
- G06V20/60—Type of objects
- G06V20/64—Three-dimensional [3D] objects
- G06V20/653—Three-dimensional [3D] objects by matching three-dimensional models, e.g. conformal mapping of Riemann surfaces
-
- G—PHYSICS
- G16—INFORMATION AND COMMUNICATION TECHNOLOGY [ICT] SPECIALLY ADAPTED FOR SPECIFIC APPLICATION FIELDS
- G16H—HEALTHCARE INFORMATICS, i.e. INFORMATION AND COMMUNICATION TECHNOLOGY [ICT] SPECIALLY ADAPTED FOR THE HANDLING OR PROCESSING OF MEDICAL OR HEALTHCARE DATA
- G16H30/00—ICT specially adapted for the handling or processing of medical images
- G16H30/20—ICT specially adapted for the handling or processing of medical images for handling medical images, e.g. DICOM, HL7 or PACS
-
- G—PHYSICS
- G16—INFORMATION AND COMMUNICATION TECHNOLOGY [ICT] SPECIALLY ADAPTED FOR SPECIFIC APPLICATION FIELDS
- G16H—HEALTHCARE INFORMATICS, i.e. INFORMATION AND COMMUNICATION TECHNOLOGY [ICT] SPECIALLY ADAPTED FOR THE HANDLING OR PROCESSING OF MEDICAL OR HEALTHCARE DATA
- G16H30/00—ICT specially adapted for the handling or processing of medical images
- G16H30/40—ICT specially adapted for the handling or processing of medical images for processing medical images, e.g. editing
-
- G—PHYSICS
- G16—INFORMATION AND COMMUNICATION TECHNOLOGY [ICT] SPECIALLY ADAPTED FOR SPECIFIC APPLICATION FIELDS
- G16H—HEALTHCARE INFORMATICS, i.e. INFORMATION AND COMMUNICATION TECHNOLOGY [ICT] SPECIALLY ADAPTED FOR THE HANDLING OR PROCESSING OF MEDICAL OR HEALTHCARE DATA
- G16H40/00—ICT specially adapted for the management or administration of healthcare resources or facilities; ICT specially adapted for the management or operation of medical equipment or devices
- G16H40/60—ICT specially adapted for the management or administration of healthcare resources or facilities; ICT specially adapted for the management or operation of medical equipment or devices for the operation of medical equipment or devices
- G16H40/63—ICT specially adapted for the management or administration of healthcare resources or facilities; ICT specially adapted for the management or operation of medical equipment or devices for the operation of medical equipment or devices for local operation
-
- G—PHYSICS
- G16—INFORMATION AND COMMUNICATION TECHNOLOGY [ICT] SPECIALLY ADAPTED FOR SPECIFIC APPLICATION FIELDS
- G16H—HEALTHCARE INFORMATICS, i.e. INFORMATION AND COMMUNICATION TECHNOLOGY [ICT] SPECIALLY ADAPTED FOR THE HANDLING OR PROCESSING OF MEDICAL OR HEALTHCARE DATA
- G16H50/00—ICT specially adapted for medical diagnosis, medical simulation or medical data mining; ICT specially adapted for detecting, monitoring or modelling epidemics or pandemics
- G16H50/20—ICT specially adapted for medical diagnosis, medical simulation or medical data mining; ICT specially adapted for detecting, monitoring or modelling epidemics or pandemics for computer-aided diagnosis, e.g. based on medical expert systems
-
- G—PHYSICS
- G06—COMPUTING OR CALCULATING; COUNTING
- G06T—IMAGE DATA PROCESSING OR GENERATION, IN GENERAL
- G06T2207/00—Indexing scheme for image analysis or image enhancement
- G06T2207/10—Image acquisition modality
- G06T2207/10072—Tomographic images
- G06T2207/10081—Computed x-ray tomography [CT]
-
- G—PHYSICS
- G06—COMPUTING OR CALCULATING; COUNTING
- G06T—IMAGE DATA PROCESSING OR GENERATION, IN GENERAL
- G06T2207/00—Indexing scheme for image analysis or image enhancement
- G06T2207/20—Special algorithmic details
- G06T2207/20081—Training; Learning
-
- G—PHYSICS
- G06—COMPUTING OR CALCULATING; COUNTING
- G06T—IMAGE DATA PROCESSING OR GENERATION, IN GENERAL
- G06T2207/00—Indexing scheme for image analysis or image enhancement
- G06T2207/30—Subject of image; Context of image processing
- G06T2207/30004—Biomedical image processing
- G06T2207/30008—Bone
- G06T2207/30012—Spine; Backbone
-
- G—PHYSICS
- G06—COMPUTING OR CALCULATING; COUNTING
- G06T—IMAGE DATA PROCESSING OR GENERATION, IN GENERAL
- G06T2207/00—Indexing scheme for image analysis or image enhancement
- G06T2207/30—Subject of image; Context of image processing
- G06T2207/30204—Marker
Definitions
- the technology of the present disclosure relates to an image processing device, an image processing device operating method, and an image processing device operating program.
- a convolutional neural network (hereinafter abbreviated as a CNN (convolutional neural network)) that performs semantic segmentation for identifying an object appearing in an analysis target image on a pixel-by-pixel basis has attracted attention.
- a convolutional neural network hereinafter abbreviated as a CNN (convolutional neural network)
- JP Application Laid-Open No. 2020-025730 describes that a radiographic image obtained by irradiating a patient with radiation is used as an image to be analyzed, and a plurality of objects appearing in the radiographic image are identified using CNN.
- objects include lung fields, the spine (backbone), and other regions, and separate identification of the thoracic and lumbar vertebrae of the spine is also described.
- Japanese Patent Application Laid-Open No. 2020-025730 describes identifying the spine using CNN as described above.
- CNN does not have very good accuracy in identifying multiple consecutive objects of the same type, such as each of the multiple vertebrae that make up the spine. For this reason, identification often fails, such as erroneously identifying a plurality of adjacent vertebrae as one vertebrae.
- One embodiment of the technology of the present disclosure provides an image processing device, an image processing device operation method, and an image processing device operation program that can improve the accuracy of identifying a plurality of consecutively arranged objects of the same type. offer.
- the image processing device of the present disclosure includes a processor and a memory connected to or built into the processor, the processor acquires an analysis target image in which a plurality of consecutively arranged objects of the same type are captured, and obtains an analysis target image Receive input of markers indicating the positions of objects in the target image, generate a marker position display map that indicates the positions of the markers in the analysis target image, input the analysis target image and the marker position display map to the semantic segmentation model, and input the target object is identified from the semantic segmentation model.
- the processor generates a marker position display map of markers corresponding to one object among a plurality of consecutively arranged similar objects, and outputs an output image in which one object is identified from the semantic segmentation model. It is preferable to let
- the processor generates a marker position display map of markers corresponding to objects arranged opposite to each other with at least one object in between among a plurality of consecutively arranged objects of the same type, and identifies at least one object.
- the semantic segmentation model outputs an output image in which objects placed opposite each other are identified.
- the processor generates a marker position display map of markers corresponding to all of the plurality of consecutively arranged objects of the same type, and when generating the marker position display map, the plurality of consecutively arranged objects of the same type is generated.
- a first label is attached to the first object and a second label different from the first label is attached to the second object;
- the semantic segmentation model outputs an output image in which the first object is identified as a first class corresponding to the first label and the second object is identified as a second class corresponding to the second label.
- the processor preferably combines the image to be analyzed and the marker position indication map in the channel direction in the semantic segmentation model.
- the semantic segmentation model receives a learning analysis target image and a learning marker position display map as input, outputs a learning output image according to the learning analysis target image and the learning marker position display map, and outputs a learning output image according to the learning analysis target image and the learning marker position display map.
- Learning is preferably performed based on a comparison between the output image and an annotation image generated based on the learning analysis target image, in which an object with a marker is annotated.
- the image to be analyzed is a medical image of the inside of the patient's body, and the object is the structure of the body.
- the medical image is an image of the patient's spine, and the structure is preferably the vertebrae that make up the spine.
- a method of operating an image processing apparatus includes acquiring an analysis target image in which a plurality of consecutively arranged objects of the same type are captured, receiving an input of a marker indicating the position of the target object in the analysis target image, Generating a marker position display map representing positions of markers in the image to be analyzed, inputting the image to be analyzed and the marker position display map into a semantic segmentation model, and outputting an output image in which the object is identified from the semantic segmentation model including outputting.
- the operation program of the image processing apparatus of the present disclosure acquires an analysis target image in which a plurality of consecutively arranged objects of the same type are captured, receives an input of a marker indicating the position of the target object in the analysis target image, Generating a marker position display map representing positions of markers in the image to be analyzed, inputting the image to be analyzed and the marker position display map into a semantic segmentation model, and outputting an output image in which the object is identified from the semantic segmentation model causing a computer to execute a process including outputting;
- an image processing device an image processing device operating method, and an image processing device operating program capable of increasing the accuracy of identifying a plurality of consecutively arranged objects of the same type. can.
- FIG. 1 is a block diagram showing a computer that constitutes a diagnosis support device;
- FIG. It is a block diagram which shows the processing part of CPU of a diagnostic assistance apparatus. It is a figure which shows a 1st screen. It is a figure which shows a 2nd screen. It is a figure which shows a marker position display map.
- FIG. 3 illustrates a semantic segmentation model for object identification;
- FIG. 4 is an explanatory diagram of convolution processing performed on a tomographic image and a marker position display map;
- FIG. 4 is an explanatory diagram of convolution processing performed on target data; It is a figure which shows the structure of calculation data.
- FIG. 10 is an explanatory diagram of pooling processing;
- FIG. 10 is an explanatory diagram of pooling processing;
- FIG. 10 is a diagram showing an output image
- FIG. 4 is a diagram showing an outline of processing in a learning phase of a semantic segmentation model for object identification; It is a figure which shows a labeling result. It is a figure which shows a 3rd screen. 4 is a flow chart showing a processing procedure of the diagnostic support device
- FIG. 10 is a diagram showing another example of a marker position display map
- 18 is a diagram showing an output image output based on the marker position display map shown in FIG. 17;
- FIG. 10 is a diagram showing how a marker position display map of markers corresponding to one vertebra of a plurality of vertebrae arranged in succession is generated;
- a tomographic image and a marker position display map of a marker corresponding to one vertebra are input to a semantic segmentation model for object identification, and an output image in which one vertebra is identified is output from the semantic segmentation model for object identification.
- FIG. 4 is a diagram showing;
- FIG. 10 is a diagram showing how an output image in which each vertebra is identified is generated from an output image in which one vertebra is identified;
- FIG. 4 is a diagram showing how a marker position display map of markers corresponding to vertebrae arranged opposite to each other with one vertebra interposed therebetween among a plurality of vertebrae arranged continuously is generated.
- FIG. 10 is a diagram showing how a semantic segmentation model for identifying an object is output from an output image.
- FIG. 10 is a diagram showing how an output image in which each vertebra is identified is generated from an output image in which vertebrae arranged opposite to each other with one vertebra interposed therebetween are identified; It is a block diagram which shows the process part of CPU of 4th Embodiment. It is a figure which shows an extraction part. It is a figure which shows a probability distribution map.
- FIG. 10 illustrates a semantic segmentation model for point extraction
- FIG. 10 is a diagram showing an output part of a semantic segmentation model for point extraction
- FIG. 4 is a diagram showing an outline of processing in the learning phase of the semantic segmentation model for point extraction
- FIG. 11 illustrates non-maximum suppression processing
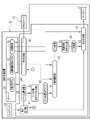
- the medical system 2 includes a CT (Computed Tomography) device 10 , a PACS (Picture Archiving and Communication System) server 11 , and a diagnosis support device 12 .
- CT apparatus 10 Computed Tomography
- PACS Physical Archiving and Communication System
- diagnosis support apparatus 12 are connected to a LAN (Local Area Network) 13 laid in the medical facility, and can communicate with each other via the LAN 13 .
- LAN Local Area Network
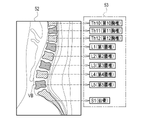
- the CT apparatus 10 radiographs the patient P at different projection angles to obtain a plurality of pieces of projection data, and reconstructs the obtained plurality of pieces of projection data to create a tomographic image 15 of the patient P. Output.
- the tomographic image 15 is voxel data representing the three-dimensional shape of the patient's P internal structure.
- the tomographic image 15 is an image of the patient P's upper body.
- FIG. 1 shows a tomographic image 15S of a sagittal section.
- a tomographic image 15 shows a spine SP composed of a plurality of vertebrae VB.
- CT apparatus 10 transmits tomographic image 15 to PACS server 11 .
- the PACS server 11 stores and manages the tomographic images 15 from the CT apparatus 10 .
- the tomographic image 15 is an example of an “analysis target image” and a “medical image” according to the technology of the present disclosure.
- Vertebra VB is also an example of the "object” and "structure” of this disclosure. Note that reconstruction of projection data may be performed by the diagnostic support device 12 or the like instead of the CT device 10 .
- the diagnosis support device 12 is, for example, a desktop personal computer, and is an example of an "image processing device" according to the technology of the present disclosure.
- the diagnosis support device 12 has a display 17 and an input device 18 .
- the input device 18 is a keyboard, mouse, touch panel, microphone, or the like.
- the doctor operates the input device 18 to transmit a distribution request for the tomographic image 15 of the patient P to the PACS server 11 .
- the PACS server 11 retrieves the tomographic image 15 of the patient P whose delivery has been requested and delivers it to the diagnosis support apparatus 12 .
- the diagnosis support device 12 displays the tomographic image 15 delivered from the PACS server 11 on the display 17 .
- the doctor observes the vertebrae VB of the patient P shown in the tomographic image 15 and diagnoses fractures, bone metastasis of cancer, and the like.
- CT device 10 and one diagnostic support device 12 are illustrated in FIG. 1, a plurality of CT devices 10 and multiple diagnostic support devices 12 may be provided.
- the computer constituting the diagnostic support device 12 includes a storage 20, a memory 21, a CPU (Central Processing Unit) 22, and a communication section 23 in addition to the display 17 and the input device 18 described above. I have. These are interconnected via bus lines 24 .
- the CPU 22 is an example of a “processor” according to the technology of the present disclosure.
- the storage 20 is a hard disk drive built into the computer constituting the diagnosis support device 12 or connected via a cable or network.
- the storage 20 is a disk array in which a plurality of hard disk drives are connected.
- the storage 20 stores a control program such as an operating system, various application programs, various data associated with these programs, and the like.
- a solid state drive may be used instead of the hard disk drive.
- the memory 21 is a work memory for the CPU 22 to execute processing.
- the CPU 22 loads the program stored in the storage 20 into the memory 21 and executes processing according to the program. Thereby, the CPU 22 comprehensively controls each part of the computer.
- the communication unit 23 controls transmission of various information with an external device such as the PACS server 11 . Note that the memory 21 may be built in the CPU 22 .
- the operating program 30 is stored in the storage 20 of the diagnostic support device 12 .
- the operating program 30 is an application program for causing a computer that configures the diagnosis support device 12 to function as an "image processing device” according to the technology of the present disclosure. That is, the operation program 30 is an example of the "image processing apparatus operation program” according to the technology of the present disclosure.
- the storage 20 also stores a tomographic image 15 and a semantic segmentation (hereinafter abbreviated as SS) model 33 for object identification.
- the object identification SS model 33 is an example of a “semantic segmentation model” according to the technology of the present disclosure.
- the storage 20 also stores the doctor's findings on the vertebrae VB shown in the tomographic image 15, various screen data to be displayed on the display 17, and the like.
- the CPU 22 of the computer that constitutes the diagnostic support device 12 cooperates with the memory 21 and the like to operate a read/write (hereinafter abbreviated as RW (Read Write)) control unit 40 and an instruction reception unit. 41 , a marker position display map generation unit 42 , an object identification unit 43 , an anatomical naming unit 44 , and a display control unit 45 .
- RW Read Write
- the RW control unit 40 controls storage of various data in the storage 20 and reading of various data in the storage 20 .
- the RW control unit 40 receives the tomographic image 15 from the PACS server 11 and stores the received tomographic image 15 in the storage 20 .
- the RW control unit 40 receives the tomographic image 15 from the PACS server 11 and stores the received tomographic image 15 in the storage 20 .
- a plurality of tomographic images 15 may be stored in the storage 20 .
- the RW control unit 40 reads the tomographic image 15 of the patient P designated by the doctor for diagnosis from the storage 20 and outputs the read tomographic image 15 to the object identification unit 43 and the display control unit 45 .
- the RW control unit 40 acquires the tomographic image 15 by reading the tomographic image 15 from the storage 20 .
- the RW control unit 40 also reads the object identification SS model 33 from the storage 20 and outputs the read object identification SS model 33 to the object identification unit 43 .
- the instruction reception unit 41 receives various instructions from the doctor through the input device 18.
- the instructions received by the instruction receiving unit 41 include, for example, an instruction to analyze the tomographic image 15, an instruction to input a marker MK (see FIG. 5) indicating the position of the vertebrae VB in the tomographic image 15, and a finding of the vertebrae VB in the storage 20.
- the instruction receiving unit 41 When the instruction receiving unit 41 receives an analysis instruction, it outputs that fact to the display control unit 45 . Further, when receiving an input instruction for the marker MK, the instruction receiving unit 41 generates marker position information 50 representing the position of the marker MK in the tomographic image 15, and sends the generated marker position information 50 to the marker position display map generating unit 42. output to Furthermore, when receiving a finding storage instruction, the instruction accepting unit 41 outputs that fact to the RW control unit 40 together with the finding.
- the marker position display map generation unit 42 generates a marker position display map 51 representing the positions of the markers MK in the tomographic image 15 based on the marker position information 50 from the instruction reception unit 41 .
- the marker position display map generator 42 outputs the marker position display map 51 to the object identification unit 43 .
- the object identification unit 43 identifies each vertebra VB based on the tomographic image 15 and the marker position display map 51 . More specifically, the object identification unit 43 inputs the tomographic image 15 and the marker position display map 51 to the object identification SS model 33, and outputs an output image 52 in which each vertebra VB is identified (see also FIG. 12). ) is output from the SS model 33 for object identification. The object identifying section 43 outputs the output image 52 to the anatomical naming section 44 .
- the anatomical name assigning unit 44 assigns an anatomical name to each vertebra VB identified in the output image 52 .
- the anatomical naming unit 44 outputs to the display control unit 45 an assignment result 53 that is the result of assigning an anatomical name to the vertebrae VB.
- the display control unit 45 controls the display of various screens on the display 17.
- the various screens include a first screen 60 (see FIG. 4) for instructing analysis of the tomographic image 15 by the marker position display map generation unit 42, the object identification unit 43, and the anatomical name assignment unit 44, a marker MK and a third screen 115 (see FIG. 15) for displaying the grant result 53, and the like.
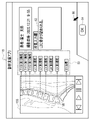
- FIG. 4 shows an example of the first screen 60 for instructing the analysis of the tomographic image 15.
- a tomographic image 15S of a sagittal section of a patient P whose spine SP is to be diagnosed is displayed on the first screen 60.
- a button group 61 for switching the display is provided below the tomographic image 15S.
- the tomographic image 15 of the axial section and the coronal section may be displayed.
- a finding input field 62 On the first screen 60, a finding input field 62, a message 63, an OK button 64, and an analysis button 65 are displayed.
- the doctor inputs the finding of the vertebra VB.
- the doctor moves the cursor 66 to the OK button 64 and selects it.
- the instruction receiving unit 41 receives the finding storage instruction.
- the RW control unit 40 associates the tomographic image 15 with the finding input in the finding input field 62 and stores them in the storage 20 .
- the message 63 prompts the user to select the analysis button 65. If the doctor wishes to analyze the tomographic image 15 prior to inputting his findings, he moves the cursor 66 to the analysis button 65 and selects it. Accordingly, the instruction receiving unit 41 receives the instruction to analyze the tomographic image 15 and outputs the instruction to the display control unit 45 .
- the display control unit 45 causes the screen to transition from the first screen 60 to the second screen 70 shown in FIG. 5 as an example.
- a message 71 and an input completion button 72 are displayed on the second screen 70 .
- the message 71 prompts selection of the input completion button 72 after the marker MK is attached to each vertebra VB.
- the marker MK is a point corresponding to one pixel 86 (see FIG. 8) of the tomographic image 15 in this example.
- the instruction accepting unit 41 accepts an input instruction for the marker MK.
- the marker position information 50 generated by the instruction receiving unit 41 is the XYZ coordinates of each marker MK.
- the X-axis is parallel to the horizontal direction
- the Y-axis is parallel to the front-rear direction
- the Z-axis is parallel to the vertical direction.
- each marker MK since the marker MK is attached to the tomographic image 15S of the sagittal section, each marker MK has the same value of the X coordinate among the XYZ coordinates of each marker MK.
- the Y-coordinate and Z-coordinate values are different for each marker MK.
- each marker MK is organized by assigning a number (No.) in ascending order of the Z coordinate.
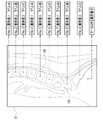
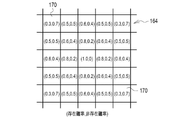
- the marker position display map 51 has elements 87 (see FIG. 8) corresponding to the pixels 86 of the tomographic image 15 on a one-to-one basis. This is data having an element value of 1 or 2, and an element value of 0 for an element 87 corresponding to a pixel 86 other than the marker MK. That is, the marker position display map 51 is data representing the position of the marker MK with an element value of 1 or 2.
- FIG. 6 the vertebrae VB and the like are indicated by dashed lines to aid understanding, but the actual marker position display map 51 does not show the vertebrae VB and the like.
- the marker position display map generation unit 42 assigns a label A to two adjacent vertebrae VB with an element value of 1 for one vertebrae VB, and a label B with an element value of 2 for the other vertebrae VB.
- the element value of vertebra VB of No. 1 is set to 1 and labeled A.
- the element value of the vertebra VB of 2 is set to 2 and labeled B.
- the element value of vertebra VB of No. 7 is set to 1 and labeled A.
- the element value of 8 vertebrae VB is set to 2 and labeled B.
- the marker position display map generator 42 assigns the labels A and B in this way, and as a result, No.
- the 1st, 3rd, 5th, 7th, and 9th vertebrae VB are examples of the "first object” according to the technology of the present disclosure.
- the 2nd, 4th, 6th, and 8th vertebrae VB are examples of a "second object” according to the techniques of this disclosure.
- Label A is an example of a "first label” according to the technology of the present disclosure
- label B is an example of a "second label” according to the technology of the present disclosure.
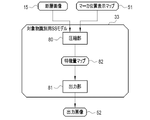
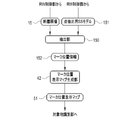
- the object identification SS model 33 has a compression unit 80 and an output unit 81, as shown in FIG.
- the tomographic image 15 and the marker position display map 51 are input to the compression unit 80 .
- the tomographic image 15 input to the compression unit 80 is, for example, the tomographic image 15S of the sagittal section from which the marker position display map 51 is generated.
- the compression unit 80 converts the tomographic image 15 and the marker position display map 51 into a feature quantity map 82 .
- the compression unit 80 passes the feature quantity map 82 to the output unit 81 .
- the output unit 81 outputs the output image 52 based on the feature quantity map 82 .
- the compression unit 80 combines the tomographic image 15 and the marker position display map 51 in the channel direction by performing a convolution operation as shown in FIG. 8 as an example.
- the compression unit 80 has a convolution layer 85 to which the tomographic image 15 and the marker position display map 51 are input.
- the convolution layer 85 applies, for example, a 3 ⁇ 3 filter F1 to the tomographic image 15 having a plurality of pixels 86 arranged two-dimensionally.
- the convolution layer 85 applies, for example, a 3 ⁇ 3 filter F2 to the marker position display map 51 having a plurality of elements 87 arranged two-dimensionally.
- the pixel value e1 of one target pixel 86I of the pixels 86 the pixel values a1, b1, c1, d1, f1, g1, h1, and i1 of eight pixels 86S adjacent to the target pixel 86I, and , which is one of the elements 87 and corresponds to the target pixel 86I, and the element values a2, b2, c2, d2, and f2 of the eight elements 87S adjacent to the target pixel 87I. , g2, h2, and i2.
- the convolution layer 85 sequentially performs a convolution operation while shifting the target pixel 86I and the target element 87I one by one, and outputs the element value of the element 89 of the operation data 88 .
- operation data 88 having a plurality of elements 89 arranged two-dimensionally is obtained.
- the tomographic image 15 and the marker position display map 51 are combined in the channel direction.
- the coefficients of filter F1 be r1, s1, t1, u1, v1, w1, x1, y1, and z1.
- the coefficients of filter F2 be r2, s2, t2, u2, v2, w2, x2, y2, and z2.
- the element value k of the element 89I of the operation data 88 which is the result of the convolution operation on the target pixel 86I and the target element 87I, is obtained by calculating the following equation (1), for example.
- the compression unit 80 further has a plurality of convolution layers 95 in addition to the convolution layers 85 .
- a convolution layer 95 applies, for example, a 3 ⁇ 3 filter F to target data 97 having a plurality of elements 96 arranged two-dimensionally. Then, the element value e of one target element 96I of the elements 96 and the element values a, b, c, d, f, g, h, and i of eight elements 96S adjacent to the target element 96I are convoluted. .
- the convolution layer 95 sequentially performs a convolution operation on each element 96 of the target data 97 while shifting the target element 96I by one element, and outputs the element value of the element 99 of the operation data 100 .
- operation data 100 having a plurality of elements 99 arranged two-dimensionally is obtained.
- the target data 97 input to the convolution layer 95 is, for example, the operation data 88 shown in FIG. 8, or reduction operation data 100S (see FIG. 11), which will be described later.
- One piece of calculation data 100 is output for one filter F.
- operation data 100 is output for each filter F.
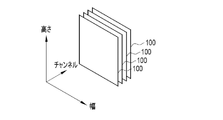
- FIG. 10 That is, as shown in FIG. 10 as an example, the calculation data 100 are generated for the number of filters F applied to the target data 97 .
- the calculation data 100 has a plurality of elements 99 arranged two-dimensionally, it has width and height.
- the number of calculation data 100 is called the number of channels.
- FIG. 10 illustrates four channels of operation data 100 output by applying four filters F to one target data 97 .
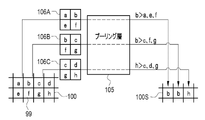
- the compression unit 80 has a pooling layer 105 in addition to the convolution layers 85 and 95 .
- the pooling layer 105 obtains the local statistic of the element value of the element 99 of the operation data 100, and generates reduced operation data 100S having the obtained statistic as the element value.
- the pooling layer 105 performs maximum value pooling processing for obtaining the maximum value of the element values within the block 106 of 2 ⁇ 2 elements as a local statistic. By performing the processing while shifting the block 106 by one element in the width direction and the height direction, the reduced calculation data 100S is reduced to half the size of the original calculation data 100 .
- the compression unit 80 repeats the convolution processing by the convolution layers 85 and 95 and the pooling processing by the pooling layer 105 multiple times, thereby outputting the final operation data 100 .
- This final calculation data 100 is the feature quantity map 82 .
- the compression unit 80 also performs skip layer processing and the like for transferring the calculation data 100 to the output unit 81 .
- the output unit 81 performs upsampling processing to enlarge the size of the feature quantity map 82 to obtain an enlarged feature quantity map.
- the output unit 81 also performs convolution processing at the same time as the upsampling processing.
- the output unit 81 also performs a merge process of combining the enlarged feature quantity map and the calculation data 100 passed from the compression unit 80 in skip layer processing.
- the output unit 81 further performs convolution processing after the merge processing. Through such various processes, the output unit 81 outputs the output image 52 from the feature quantity map 82 .
- the SS model 33 for object identification is constructed by CNN.
- Examples of CNN include U-Net and ResNet (Residual Network).
- the output image 52 is an image in which each vertebra VB is labeled with a class. More specifically, the output image 52 is No. Vertebrae VB of 1, 3, 5, 7, and 9 are identified as Class A corresponding to label A; 2, 4, 6, and 8 vertebrae VB are images identified as class B corresponding to label B; Class A is an example of the "first class” according to the technology of the present disclosure, and class B is an example of the "second class” according to the technology of the present disclosure.
- the SS model 33 for object identification is learned by being given learning data (also called teacher data) 110 in the learning phase.
- the learning data 110 includes a learning tomographic image 15L, a learning marker position display map 51L corresponding to the learning tomographic image 15L, and an annotation image 111 corresponding to the learning tomographic image 15L and the learning marker position display map 51L. It is a group.
- markers MK are attached to the vertebrae VB appearing in the learning tomographic image 15L, and labels A and B are alternately attached.
- the annotation image 111 is an image obtained by labeling each vertebra VB appearing in the learning tomographic image 15L with a class corresponding to the label given in the learning marker position display map 51L.
- the learning tomographic image 15L and the learning marker position display map 51L are input to the object identification SS model 33.
- the object identification SS model 33 outputs a learning output image 52L for the learning tomographic image 15L and the learning marker position display map 51L.
- the loss calculation of the object identification SS model 33 is performed.
- Various coefficients (such as the coefficients of the filter F) of the object identification SS model 33 are updated according to the result of the loss calculation, and the object identification SS model 33 is updated according to the update settings.
- the learning tomographic image 15L and the learning marker position display map 51L are input to the object identification SS model 33, and the learning output from the object identification SS model 33.
- the series of processes of outputting the image 52L, calculating the loss, setting the update, and updating the SS model 33 for object identification are repeated while the learning data 110 are exchanged.
- Repetition of the above series of processes ends when the prediction accuracy of the learning output image 52L with respect to the annotation image 111 reaches a predetermined set level.
- the object identification SS model 33 whose prediction accuracy reaches the set level in this manner is stored in the storage 20 and used in the object identification unit 43 . Regardless of the prediction accuracy of the learning output image 52L with respect to the annotation image 111, learning may be terminated when the series of processes described above is repeated a set number of times.
- the assigned result 53 is the anatomical name of each vertebra VB such as Th10 (10th thoracic vertebra), L1 (1st lumbar vertebrae), and S1 (sacrum).
- FIG. 15 shows an example of the third screen 115 displaying the grant result 53.
- the display control unit 45 causes the screen to transition from the second screen 70 shown in FIG. 5 to the third screen 115 .
- the application result 53 is displayed next to the tomographic image 15S.
- a finding input field 62 and an OK button 64 are displayed, like the first screen 60 of FIG.
- the doctor moves the cursor 66 to the OK button 64 and selects it.
- the instruction receiving unit 41 receives the finding storage instruction, as in the case of FIG.
- the RW control unit 40 associates the tomographic image 15 with the finding input in the finding input field 62 and stores them in the storage 20 .
- the operation program 30 when the operation program 30 is activated in the diagnosis support device 12, as shown in FIG. It functions as an object identifying section 43 , an anatomical naming section 44 and a display control section 45 .
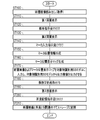
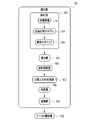
- the RW control unit 40 reads from the storage 20 the tomographic image 15 of the patient P whose spine SP is to be diagnosed (step ST100). A tomographic image 15 is thus obtained. The tomographic image 15 is output from the RW controller 40 to the display controller 45 . Then, under the control of the display control section 45, the first screen 60 shown in FIG. 4 is displayed on the display 17 (step ST110).
- the instruction receiving unit 41 receives an instruction to analyze the tomographic image 15 (step ST120). Under the control of the display control section 45, the first screen 60 is changed to the second screen 70 shown in FIG. 5 (step ST130).
- the doctor selects the input completion button 72 after the marker MK is attached to each vertebra VB.
- the input instruction for the marker MK is accepted by the instruction accepting unit 41 (step ST140).
- the instruction receiving unit 41 generates the marker position information 50 representing the position of the marker MK (step ST150).
- the marker position information 50 is output from the instruction receiving portion 41 to the marker position display map generating portion 42 .
- the marker position display map generator 42 generates the marker position display map 51 shown in FIG. 6 based on the marker position information 50 (step ST160).
- the marker position display map 51 is output from the marker position display map generation section 42 to the object identification section 43 .
- the tomographic image 15 and the SS model 33 for object identification are input from the RW control unit 40 to the object identification unit 43 .
- the object identification unit 43 the tomographic image 15 and the marker position display map 51 are input to the object identification SS model 33 as shown in FIG. 7 .
- the tomographic image 15 and the marker position display map 51 are combined in the channel direction.
- the output image 52 is output from the object identification SS model 33 (step ST170).
- the output image 52 is output from the object identifying section 43 to the anatomical naming section 44 .
- the anatomical name assignment unit 44 assigns an anatomical name to each vertebra VB identified in the output image 52 (step ST180).
- the assignment result 53 is output from the anatomical name assignment unit 44 to the display control unit 45 .
- the third screen 115 shown in FIG. 15 is displayed on the display 17 (step ST190).
- the doctor moves the cursor 66 to the OK button 64 and selects it.
- the finding storage instruction is accepted by the instruction accepting section 41 (step ST200).
- the tomographic image 15 and the finding entered in the finding input field 62 are associated and stored in the storage 20 (step ST210).
- the CPU 22 of the diagnosis support device 12 includes the RW control unit 40, the instruction reception unit 41, the marker position display map generation unit 42, and the object identification unit 43.
- the RW control unit 40 acquires the tomographic images 15 showing the vertebrae VB, which are a plurality of consecutively arranged objects of the same type, by reading from the storage 20 .
- the instruction receiving unit 41 receives input of a marker MK indicating the position of the vertebra VB in the tomographic image 15 .
- the marker position display map generation unit 42 generates a marker position display map 51 representing the positions of the markers MK within the tomographic image 15 .
- the object identification unit 43 inputs the tomographic image 15 and the marker position display map 51 to the object identification SS model 33, and causes the object identification SS model 33 to output an output image 52 in which each vertebra VB is identified. Therefore, compared to the case where the vertebrae VB are identified without any clues, it is possible to improve the identification accuracy of the vertebrae VB by the amount of the clues of the markers MK.
- the marker position display map generation unit 42 generates a marker position display map 51 of the markers MK corresponding to all of the vertebrae VB arranged in succession. At this time, the marker position display map generation unit 42 assigns a label A to one vertebra VB and a Label B.
- the object identification unit 43 outputs an output image 52 in which one vertebrae VB is identified as class A corresponding to label A and the other vertebrae VB is identified as class B corresponding to label B, to the object identification SS model 33. output from Therefore, all vertebrae VB can be identified at once, and processing time can be shortened.
- the object identification unit 43 combines the tomographic image 15 and the marker position display map 51 in the channel direction in the object identification SS model 33 . Processing time can be shortened compared to the case where the tomographic image 15 and the marker position display map 51 are input to separate compression units.
- the object identification SS model 33 receives the learning tomographic image 15L and the learning marker position display map 51L as inputs, and generates a learning output image according to the learning tomographic image 15L and the learning marker position display map 51L. 52L is output.
- the object identification SS model 33 is an annotation image 111 generated based on the learning output image 52L and the learning tomographic image 15L, and is an annotation image in which the vertebrae VB with the marker MK is annotated. It is learned based on comparison with 111. Therefore, it is possible to obtain the object identification SS model 33 that outputs a corresponding output image 52 in response to the input of the tomographic image 15 and the marker position display map 51 .
- the vertebra VB which constitutes the spine SP
- various identification methods have been proposed in the past, making it an urgent issue to improve identification accuracy. Therefore, in this example, in which the tomographic image 15 of the spine SP of the patient P is used as a medical image, and the vertebrae VB constituting the spine SP is used as a structure, the configuration matches the urgent problem of increasing the accuracy of identifying the vertebrae VB. You can say that.
- the tomographic image 15 input to the compression unit 80 is not limited to the tomographic image 15S of the sagittal section from which the marker position display map 51 was generated.
- several tomographic images of the sagittal section before and after the tomographic image 15S of the sagittal section from which the marker position display map 51 is generated. 15S may be input to the compression unit 80 .
- the identification result of the vertebrae VB for one sagittal cross-sectional tomographic image 15S may be applied to several front and rear tomographic images 15S of the sagittal cross-section.
- the marker MK is not limited to a point corresponding to one pixel 86 of the tomographic image 15 .
- a circular area composed of several to several tens of pixels 86 centered on the point clicked by the cursor 66 may be used.
- the marker MK may be an amorphous region composed of a plurality of pixels 86 that is roughly painted by the doctor within the vertebrae VB.
- the marker position display map 51 sets the element values of the elements 87 corresponding to the plurality of pixels 86 in the region filled out by the doctor to, for example, 1 or 2, and the element values 87 corresponding to the pixels 86 other than the region filled out by the doctor. becomes data whose element value is 0.
- the position where the marker MK is attached is not limited to the point that seems to be the center of the vertebral body of vertebra VB. It may be a point that seems to be the tip of the spinous process of the vertebral arch. Alternatively, it may be a point that seems to be the center of the vertebral foramen, which is the hole through which the spinal cord passes.
- the element value of label A is 1 and the element value of label B is 2, but it is not limited to this. It is sufficient if the element values of label A and label B are different from each other.
- the element value of label A may be 1 and the element value of label B may be -1.
- the types of labels are not limited to the two types of labels A and B. Three or more labels may be attached.
- the element values of No. 1, 4, and 7 vertebrae VB are assigned a label A
- the element values of No. 2, 5, and 8 vertebrae VB are assigned a label B of 2
- the No. 3, 6, and 9 vertebrae VB may be labeled C with a component value of 3.
- the output image 52 is No. 1, 4, and 7 vertebrae VB are identified as class A corresponding to label A
- 2, 5, and 8 vertebrae VB are identified as class B corresponding to label B
- Vertebrae VB of 3, 6, and 9 are images identified as class C corresponding to label C.
- each vertebra VB is identified, but this is not the only option.
- the vertebrae VB may be identified as preprocessing for CAD (Computer-Aided Diagnosis) for extracting lesion candidates such as bone fractures and bone metastasis of cancer.
- CAD Computer-Aided Diagnosis
- the marker position display map 51 of the markers MK corresponding to all of the plurality of vertebrae VB arranged in succession is generated, but the present invention is not limited to this.
- the second embodiment shown in FIGS. 19 to 21 may also be used.
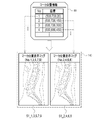
- the marker position display map generator 42 generates a marker position display map group 130 based on the marker position information 50.
- FIG. The marker position display map group 130 includes No. 1, a marker position display map 51_1 representing the position of the marker MK attached to the vertebra VB of No. 1; 2, a marker position display map 51_2 representing the position of the marker MK attached to the vertebra VB of No. 2; A marker position display map 51_3, No. 3, representing the position of the marker MK attached to the vertebra VB of No. 3. . . showing the positions of the markers MK attached to the 4 vertebrae VB. That is, in the present embodiment, the marker position display map generation unit 42 generates the marker position display map 51 of the marker MK corresponding to one vertebra VB among the plurality of vertebrae VB arranged continuously.
- the tomographic image 15 and one of the marker position display maps 51 constituting the marker position display map group 130 are input to the object identification SS model 133 of the present embodiment. be done.
- the object identifying SS model 133 outputs an output image 52 in which one vertebra VB attached with a marker MK whose position is indicated in the marker position display map 51 is identified.
- No. A marker position display map 51_1 representing the position of the marker MK attached to the vertebra VB of No. 1 is input to the object identifying SS model 133 together with the tomographic image 15. 1 illustrates how an output image 52_1 in which one vertebra VB is identified is output from the SS model 133 for object identification.
- the learning tomographic image 15L and the learning marker position display map 51L of the marker MK corresponding to one vertebra VB are input to the object identification SS model 133. Loss calculation is then performed based on the learning output image 52L output from the object identification SS model 133 and the annotation image in which one vertebra VB with the marker MK is annotated.
- an output image group 135 shown in FIG. 21 is obtained as an example.
- the output image group 135 includes No. 1 vertebrae VB identified, output image 52_1, no. 2 vertebrae VB identified, output image 52_2, no.
- the output image 52_3, No. 3, with the vertebra VB of No. 3 identified. contains an output image 52_4, .
- the object identification unit 43 generates an output image 52, in which each vertebrae VB is identified, to be finally output from the plurality of output images 52_1, 52_2, . . .
- the marker position display map generation unit 42 generates the marker position display map 51 of the marker MK corresponding to one vertebra VB out of the plurality of vertebrae VB arranged continuously.
- the object identification unit 43 causes the SS model for object identification 133 to output an output image 52 in which one vertebra VB is identified. Therefore, although the processing time is longer than that of the first embodiment, each vertebra VB can be identified with higher accuracy.
- all the vertebrae VB shown in the tomographic image 15 may be marked with the markers MK at once, or one vertebrae VB may be marked with the marker MK. Identifying may be repeated.
- the marker position display map generator 42 generates a marker position display map group 140 based on the marker position information 50.
- FIG. The marker position display map group 140 includes No. Marker position display maps 51_1, 3, 5, 7, and 9 representing the positions of markers MK attached to vertebrae VB of 1, 3, 5, 7, and 9; and marker position display maps 51_2, 4, 6, and 8 representing the positions of the markers MK attached to the 2nd, 4th, 6th, and 8th vertebrae VB. That is, in the present embodiment, the marker position display map generation unit 42 calculates the marker positions of the markers MK corresponding to the vertebrae VB arranged opposite to each other across one vertebrae VB among the plurality of vertebrae VB arranged in succession. A display map 51 is generated.
- the tomographic image 15 and one of the two marker position display maps 51 constituting the marker position display map group 140 are input to the object identification SS model 143 of the present embodiment. be done. Further, the object identification SS model 143 produces an output image 52 in which the vertebrae VB arranged opposite to each other across one vertebrae VB are identified to which the markers MK whose positions are indicated in the marker position display map 51 are attached. Output.
- No. Marker position display maps 51_1, 3, 5, 7, and 9 representing the positions of the markers MK attached to the vertebrae VB of 1, 3, 5, 7, and 9 are input to the SS model 143 for object identification together with the tomographic image 15. and No. Output images 52_1, 3, 5, 7, and 9 in which vertebrae VB of 1, 3, 5, 7, and 9 are identified are output from the SS model 143 for object identification.
- the learning tomographic image 15L and the learning marker position display map 51L of the markers MK corresponding to the vertebrae VB arranged opposite to each other across one vertebrae VB are input to the object identification SS model 143. be.
- the learning output image 52L output from the object identification SS model 143 and the vertebrae VB to which the marker MK is attached are annotated.
- a loss operation is performed based on the annotation image.
- the object identification SS model 143 includes the learning tomographic image 15L and the learning marker position of the marker MK corresponding to one vertebra VB, as in the object identification SS model 133 of the second embodiment.
- a display map 51L is input. Loss calculation is then performed based on the learning output image 52L output from the object identification SS model 143 and the annotation image in which one vertebra VB with the marker MK is annotated.
- the output image group 145 includes No. Output images 52_1, 3, 5, 7, 9 in which vertebrae VB of 1, 3, 5, 7, and 9 have been identified, and no. 2, 4, 6, and 8 vertebrae VB identified output images 52_2, 4, 6, 8; From these two output images 52_1, 3, 5, 7, 9 and 52_2, 4, 6, 8, the object identification unit 43 generates the final output image 52 in which each vertebra VB is identified. .
- the marker position display map generation unit 42 creates markers MK corresponding to the vertebrae VB arranged opposite to each other across one vertebrae VB among the plurality of vertebrae VB arranged continuously.
- a marker position display map 51 is generated.
- the object identification unit 43 causes the SS model for object identification 143 to output an output image 52 in which the vertebrae VB arranged opposite to each other across one vertebrae VB are identified. Therefore, each vertebra VB can be identified with high accuracy in a shorter processing time than in the second embodiment.
- all the vertebrae VB appearing in the tomographic image 15 may be marked with markers MK at once. attaching markers MK to the vertebrae VB of 1, 3, 5, 7 and 9 to identify these vertebrae VB;
- the 2nd, 4th, 6th, and 8th vertebrae VB may be marked with markers MK to identify these vertebrae VB separately.
- No. 1, 3, 5, 7, and 9 and no Although alternate cases such as 2, 4, 6, and 8 have been exemplified, the present invention is not limited to this. No. 1, 4, and 7, no. 2, 5 and 8 and no. It can be every two, such as 3, 6, and 9. Also, every three or four may be used. However, as a matter of course, the processing time is longer than in the case of every other one.
- an extraction unit 150 is constructed in the CPU of the diagnosis support device of this embodiment.
- the tomographic image 15 and the point extraction SS model 151 are input from the RW control unit 40 to the extraction unit 150 .
- the point extraction SS model 151 is stored in the storage 20 .
- the extraction unit 150 uses the point extraction SS model 151 to extract a point in each vertebra VB appearing on the tomographic image 15 as a marker MK.
- the center point CP (see FIG. 30) of the vertebral body is extracted as a point within the vertebra VB.
- the extraction unit 150 generates marker position information 152 representing the position of the center point CP of the vertebral body as the marker MK.
- the extractor 150 outputs the marker position information 152 to the marker position display map generator 42 .
- the marker position display map generation section 42 generates a marker position display map 51 based on the marker position information 152 and outputs the marker position display map 51 to the object identification section 43 . Since subsequent processing is the same as that of each of the above embodiments, description thereof is omitted.
- the extraction unit 150 has an analysis unit 160, a selection unit 161, a non-maximum suppression processing unit 162, and a conversion unit 163.
- the analysis unit 160 inputs the tomographic image 15 to the SS model for point extraction 151 and causes the SS model for point extraction 151 to output a probability distribution map 164 indicating the existence probability of the central point CP of the vertebral body.
- the analysis unit 160 outputs the probability distribution map 164 to the selection unit 161 .
- the probability distribution map 164 has elements 170 corresponding to the pixels 86 of the tomographic image 15 on a one-to-one basis. and non-existence probability are registered data.
- element values (1.0, 0) represent that the existence probability of the central point CP of the vertebral body is 100% and the non-existence probability is 0%.
- the selection unit 161 selects the elements 170 having the presence probability of the center point CP of the vertebral body equal to or greater than a threshold value (for example, 0.9) in the probability distribution map 164 as candidates 200 ( (see FIG. 31).
- the selection unit 161 generates a point candidate image 165 (see also FIG. 31) representing the selected candidate 200 and outputs the generated point candidate image 165 to the non-maximum suppression processing unit 162 .
- the point candidate image 165 is, for example, an image in which the pixel value of the pixel corresponding to the candidate 200 is 1 and the pixel value of the other pixels is 0.
- the non-maximum suppression processing unit 162 performs non-maximum suppression processing on each candidate 200 of the point candidate image 165, and as a result, generates a point image 166 (see also FIG. 31) representing the center point CP of the vertebral body.
- the point image 166 is, for example, an image in which the pixel value of the pixel corresponding to the center point CP of the vertebral body is 1, and the pixel value of the other pixels is 0. In other words, the point image 166 is nothing but an image representing the marker MK indicating the position of the vertebra VB in the tomographic image 15 .
- the non-maximum suppression processing unit 162 outputs the point image 166 to the conversion unit 163 .
- the conversion unit 163 accepts the input of the marker MK.
- the conversion unit 163 converts the point image 166 into marker position information 152 .
- the SS model 151 for point extraction has a compression unit 180 and an output unit 181, like the SS model 33 for object identification.
- a tomographic image 15 is input to the compression unit 180 .
- the compression unit 180 performs convolution processing, pooling processing, and the like on the tomographic image 15 to convert the tomographic image 15 into a feature amount map 182 .
- the compression unit 180 passes the feature quantity map 182 to the output unit 181 .
- the output unit 181 outputs the probability distribution map 164 based on the feature quantity map 182 .
- the output unit 181 has a decoder unit 190 and a probability distribution map generation unit 191.
- the decoder unit 190 performs upsampling processing, convolution processing, merging processing, etc. on the feature amount map 182 in the same manner as the output unit 81 of the object identification SS model 33 to generate a final feature amount map 192 .
- the final feature quantity map 192 is also called logits, and has elements in one-to-one correspondence with the pixels 86 of the tomographic image 15 .
- Each element of the final feature map 192 has an element value associated with the center point CP of the vertebral body being extracted. For example, the element value of the element where the center point CP of the vertebral body seems to be is higher than the element values of the other elements.
- the decoder section 190 outputs the final feature quantity map 192 to the probability distribution map generation section 191 .
- the probability distribution map generation unit 191 generates the probability distribution map 164 from the final feature quantity map 192 using a well-known activation function.
- the probability distribution map generator 191 applies, for example, a softmax function to calculate e 2 /(e 2 +e 1.5 ) and e 1.5 /(e 2 +e 1.5 ). Then, the probability that the central point CP of the vertebral body exists in the element, that is, the existence probability of 0.62 ( ⁇ e 2 /(e 2 +e 1.5 )) is derived, and the central point CP of the vertebral body is derived in the element. 0.38 ( ⁇ e 1.5 /(e 2 +e 1.5 )) is derived as the probability that does not exist (hereinafter referred to as non-existence probability).
- a sigmoid function may be used instead of the softmax function.
- the point extraction SS model 151 is learned by being given learning data 195 in the learning phase.
- the learning data 195 is a set of a learning tomographic image 15L and an annotation image 196 corresponding to the learning tomographic image 15L.
- the annotation image 196 is an image in which the center point CP of the vertebral body of each vertebra VB appearing in the learning tomographic image 15L is annotated.
- the annotation image 196 is an image in which the pixel value of the pixel 197A corresponding to the center point CP of the vertebral body is 1, and the pixel value of the other pixels 197B is 0.
- the learning tomographic image 15L is input to the point extraction SS model 151.
- the point extraction SS model 151 outputs a learning probability distribution map 164L for the learning tomographic image 15L. Based on this learning probability distribution map 164L and the annotation image 196, the loss calculation of the point extraction SS model 151 is performed. Various coefficients of the point extraction SS model 151 are updated according to the result of the loss calculation, and the point extraction SS model 151 is updated according to the update settings.
- a weighted cross entropy function is used in the loss calculation of the SS model 151 for point extraction.
- the cross entropy function compares when the existence probability of the center point CP of the vertebral body among the element values of the element 170 of the learning probability distribution map 164L and the pixel value of the annotation image 196 are relatively close values. take a relatively low value. In other words, in this case, the loss is estimated to be small.
- the cross entropy function is a value in which the existence probability of the center point CP of the vertebral body among the element values of the element 170 of the learning probability distribution map 164L and the pixel value of the annotation image 196 are relatively deviated. takes a relatively high value. In other words, in this case, the loss is estimated to be large.
- the weight of the cross entropy function is set to 10, for example, for the pixel 197A corresponding to the central point CP of the vertebral body annotated in the annotation image 196, and 1, for example, to the other pixels 197B. Since the central point CP of the vertebral body is very small, it will be buried if no measures are taken, making it difficult to learn. However, since the pixel 197A corresponding to the center point CP of the vertebral body is assigned a greater weight than the other pixels 197B, learning can be performed intensively on the center point CP of the vertebral body.
- the input of the learning tomographic image 15L to the point extraction SS model 151, the output of the learning probability distribution map 164L from the point extraction SS model 151, the loss calculation, and the update setting. , and updating of the point extraction SS model 151 are repeated while the learning data 195 are exchanged.
- Repetition of the above series of processes ends when the prediction accuracy of the learning probability distribution map 164L for the annotation image 196 reaches a predetermined set level.
- the point extraction SS model 151 whose prediction accuracy reaches the set level in this manner is stored in the storage 20 and used in the extraction unit 150 . Regardless of the prediction accuracy of the learning probability distribution map 164L for the annotation image 196, learning may be terminated when the series of processes described above is repeated a set number of times.
- FIG. 31 shows an example of non-maximum suppression processing by the non-maximum suppression processing unit 162.
- FIG. A point candidate image 165 is obtained by simply selecting, as candidates 200, elements 170 whose existence probability in the probability distribution map 164 is equal to or greater than the threshold. Therefore, not all candidates 200 are truly vertebral body center points CP. Therefore, by performing non-maximum suppression processing, the true center point CP of the vertebral body is narrowed down from among the plurality of candidates 200 .
- the non-maximum suppression processing unit 162 first assigns a rectangular frame 201 to each candidate 200 of the point candidate image 165 .
- the rectangular frame 201 has a preset size corresponding to the vertebrae VB, for example, a size one size larger than one vertebrae VB.
- the center of rectangular frame 201 coincides with candidate 200 .
- the non-maximum suppression processing unit 162 calculates the IoU (Intersection over Union) of the rectangular frame 201 assigned to each candidate 200 .
- the IoU is a value obtained by dividing the overlapping area (Area of Overlap) of the two rectangular frames 201 by the area (Area of Union) where the two rectangular frames 201 are integrated.
- the non-maximum suppression processing unit 162 leaves one representative rectangular frame 201 and deletes the other one rectangular frame 201 for each candidate 200 for two rectangular frames 201 whose IoU is equal to or greater than a threshold value (for example, 0.3).
- a threshold value for example, 0.3
- points within the vertebrae VB are automatically extracted, and the extracted points are accepted as markers MK. Therefore, the doctor can save the trouble of inputting the marker MK. It is not necessary to display the second screen 70 shown in FIG. The doctor only has to select the analysis button 65 on the first screen 60 .
- the annotation image 196 is not limited to an image annotated with one pixel 197A indicating the center point CP of the vertebral body.
- An image in which a circular region composed of several to several tens of pixels around the central point CP of the vertebral body is annotated may be used.
- the point to be extracted is not limited to the central point CP of the vertebral body. It may be the tip of the spinous process of the vertebral arch or the center of the vertebral foramen.
- the RW control unit 40 the instruction reception unit 41, the marker position display map generation unit 42, the target object identification unit 43, the anatomical name assignment unit 44, the display control unit 45, the extraction unit 150, the analysis
- the processing unit processing unit
- the following various processors are used.
- Various processors include, as described above, in addition to the CPU 22 which is a general-purpose processor that executes software (operation program 30) and functions as various processing units, FPGAs (Field Programmable Gate Arrays), etc.
- Programmable Logic Device which is a processor whose circuit configuration can be changed, ASIC (Application Specific Integrated Circuit), etc. It includes electrical circuits and the like.
- One processing unit may be configured with one of these various processors, or a combination of two or more processors of the same or different type (for example, a combination of a plurality of FPGAs and/or a CPU and combination with FPGA). Also, a plurality of processing units may be configured by one processor.
- a single processor is configured by combining one or more CPUs and software.
- a processor functions as multiple processing units.
- SoC System On Chip
- a processor that realizes the functions of the entire system including multiple processing units with a single IC (Integrated Circuit) chip. be.
- the various processing units are configured using one or more of the above various processors as a hardware structure.
- an electric circuit combining circuit elements such as semiconductor elements can be used.
- the image to be analyzed is not limited to the tomographic image 15 obtained from the CT device 10.
- it may be a tomographic image obtained from an MRI (Magnetic Resonance Imaging) device.
- the image to be analyzed is not limited to a three-dimensional image such as a tomographic image.
- it may be a two-dimensional image such as a simple radiographic image.
- the structure is not limited to vertebrae VB.
- a finger bone or the like may be used.
- images to be analyzed are not limited to medical images.
- the object is not limited to the structure of the body.
- an image of the street may be used as the image to be analyzed, and the target object may be the face of a person.
- the technology of the present disclosure can also appropriately combine various embodiments and/or various modifications described above. Moreover, it is needless to say that various configurations can be employed without departing from the scope of the present invention without being limited to the above embodiments. Furthermore, the technology of the present disclosure extends to storage media that non-temporarily store programs in addition to programs.
- a and/or B is synonymous with “at least one of A and B.” That is, “A and/or B” means that only A, only B, or a combination of A and B may be used.
- a and/or B means that only A, only B, or a combination of A and B may be used.
Landscapes
- Engineering & Computer Science (AREA)
- Health & Medical Sciences (AREA)
- Medical Informatics (AREA)
- Public Health (AREA)
- General Health & Medical Sciences (AREA)
- Biomedical Technology (AREA)
- Physics & Mathematics (AREA)
- Life Sciences & Earth Sciences (AREA)
- Theoretical Computer Science (AREA)
- Nuclear Medicine, Radiotherapy & Molecular Imaging (AREA)
- Radiology & Medical Imaging (AREA)
- Epidemiology (AREA)
- Primary Health Care (AREA)
- General Physics & Mathematics (AREA)
- Pathology (AREA)
- Optics & Photonics (AREA)
- Computer Vision & Pattern Recognition (AREA)
- High Energy & Nuclear Physics (AREA)
- Multimedia (AREA)
- Heart & Thoracic Surgery (AREA)
- Molecular Biology (AREA)
- Surgery (AREA)
- Animal Behavior & Ethology (AREA)
- Veterinary Medicine (AREA)
- Biophysics (AREA)
- Databases & Information Systems (AREA)
- Data Mining & Analysis (AREA)
- Business, Economics & Management (AREA)
- Orthopedic Medicine & Surgery (AREA)
- Dentistry (AREA)
- Oral & Maxillofacial Surgery (AREA)
- General Business, Economics & Management (AREA)
- Software Systems (AREA)
- Pulmonology (AREA)
- Quality & Reliability (AREA)
- Image Analysis (AREA)
- Apparatus For Radiation Diagnosis (AREA)
Priority Applications (2)
| Application Number | Priority Date | Filing Date | Title |
|---|---|---|---|
| JP2023503385A JPWO2022185643A1 (https=) | 2021-03-03 | 2021-12-08 | |
| US18/453,320 US20230394661A1 (en) | 2021-03-03 | 2023-08-22 | Image processing apparatus, method for operating image processing apparatus, and program for operating image processing apparatus |
Applications Claiming Priority (2)
| Application Number | Priority Date | Filing Date | Title |
|---|---|---|---|
| JP2021033847 | 2021-03-03 | ||
| JP2021-033847 | 2021-03-03 |
Related Child Applications (1)
| Application Number | Title | Priority Date | Filing Date |
|---|---|---|---|
| US18/453,320 Continuation US20230394661A1 (en) | 2021-03-03 | 2023-08-22 | Image processing apparatus, method for operating image processing apparatus, and program for operating image processing apparatus |
Publications (1)
| Publication Number | Publication Date |
|---|---|
| WO2022185643A1 true WO2022185643A1 (ja) | 2022-09-09 |
Family
ID=83154231
Family Applications (1)
| Application Number | Title | Priority Date | Filing Date |
|---|---|---|---|
| PCT/JP2021/045208 Ceased WO2022185643A1 (ja) | 2021-03-03 | 2021-12-08 | 画像処理装置、画像処理装置の作動方法、画像処理装置の作動プログラム |
Country Status (3)
| Country | Link |
|---|---|
| US (1) | US20230394661A1 (https=) |
| JP (1) | JPWO2022185643A1 (https=) |
| WO (1) | WO2022185643A1 (https=) |
Families Citing this family (1)
| Publication number | Priority date | Publication date | Assignee | Title |
|---|---|---|---|---|
| CN120407482B (zh) * | 2025-07-04 | 2025-09-12 | 苏州元脑智能科技有限公司 | 型号确定系统、方法、电子设备、存储介质及产品 |
Citations (5)
| Publication number | Priority date | Publication date | Assignee | Title |
|---|---|---|---|---|
| JP2007088831A (ja) * | 2005-09-22 | 2007-04-05 | Fujifilm Corp | 画像補正方法および装置並びにプログラム |
| JP2009163661A (ja) * | 2008-01-10 | 2009-07-23 | Seiko Epson Corp | 印刷制御装置、印刷制御方法および印刷制御プログラム |
| WO2013015381A1 (ja) * | 2011-07-27 | 2013-01-31 | 国立大学法人 東京大学 | 画像処理装置 |
| US20200129243A1 (en) * | 2018-04-27 | 2020-04-30 | Medtronic Navigation, Inc. | System And Method For A Tracked Procedure |
| JP2021033573A (ja) * | 2019-08-22 | 2021-03-01 | ソニー株式会社 | 情報処理装置、情報処理方法、およびプログラム |
Family Cites Families (12)
| Publication number | Priority date | Publication date | Assignee | Title |
|---|---|---|---|---|
| US8724865B2 (en) * | 2001-11-07 | 2014-05-13 | Medical Metrics, Inc. | Method, computer software, and system for tracking, stabilizing, and reporting motion between vertebrae |
| US9064307B2 (en) * | 2013-06-28 | 2015-06-23 | General Electric Company | Methods and apparatus to generate three-dimensional spinal renderings |
| US9401020B1 (en) * | 2015-05-01 | 2016-07-26 | London Health Science Centre Research Inc | Multi-modality vertebra recognition |
| GB201720059D0 (en) * | 2017-12-01 | 2018-01-17 | Ucb Biopharma Sprl | Three-dimensional medical image analysis method and system for identification of vertebral fractures |
| US10915792B2 (en) * | 2018-09-06 | 2021-02-09 | Nec Corporation | Domain adaptation for instance detection and segmentation |
| WO2020209383A1 (ja) * | 2019-04-11 | 2020-10-15 | 富士フイルム株式会社 | 構造物分離装置、方法およびプログラム、学習装置、方法およびプログラム、並びに学習済みモデル |
| JP7342120B2 (ja) * | 2019-06-27 | 2023-09-11 | 富士フイルム株式会社 | 学習装置、方法およびプログラム、クラス分類装置、方法およびプログラム、並びに学習済みモデル |
| CN112825619B (zh) * | 2019-09-20 | 2025-03-07 | 博医来股份公司 | 使用数字重建放射影像训练机器学习算法的方法及系统 |
| TWI733487B (zh) * | 2020-06-09 | 2021-07-11 | 廣達電腦股份有限公司 | 脊椎壓迫性骨折偵測方法與系統 |
| US11704798B2 (en) * | 2020-12-02 | 2023-07-18 | Ping An Technology (Shenzhen) Co., Ltd. | Method and device for vertebra localization and identification |
| US11568625B2 (en) * | 2021-01-07 | 2023-01-31 | Nvidia Corporation | Targeted object detection in image processing applications |
| US12161421B2 (en) * | 2021-07-30 | 2024-12-10 | Medos International Sarl | Imaging during a medical procedure |
-
2021
- 2021-12-08 JP JP2023503385A patent/JPWO2022185643A1/ja active Pending
- 2021-12-08 WO PCT/JP2021/045208 patent/WO2022185643A1/ja not_active Ceased
-
2023
- 2023-08-22 US US18/453,320 patent/US20230394661A1/en active Pending
Patent Citations (5)
| Publication number | Priority date | Publication date | Assignee | Title |
|---|---|---|---|---|
| JP2007088831A (ja) * | 2005-09-22 | 2007-04-05 | Fujifilm Corp | 画像補正方法および装置並びにプログラム |
| JP2009163661A (ja) * | 2008-01-10 | 2009-07-23 | Seiko Epson Corp | 印刷制御装置、印刷制御方法および印刷制御プログラム |
| WO2013015381A1 (ja) * | 2011-07-27 | 2013-01-31 | 国立大学法人 東京大学 | 画像処理装置 |
| US20200129243A1 (en) * | 2018-04-27 | 2020-04-30 | Medtronic Navigation, Inc. | System And Method For A Tracked Procedure |
| JP2021033573A (ja) * | 2019-08-22 | 2021-03-01 | ソニー株式会社 | 情報処理装置、情報処理方法、およびプログラム |
Also Published As
| Publication number | Publication date |
|---|---|
| US20230394661A1 (en) | 2023-12-07 |
| JPWO2022185643A1 (https=) | 2022-09-09 |
Similar Documents
| Publication | Publication Date | Title |
|---|---|---|
| US9020235B2 (en) | Systems and methods for viewing and analyzing anatomical structures | |
| US7518619B2 (en) | Method and apparatus for integrating three-dimensional and two-dimensional monitors with medical diagnostic imaging workstations | |
| EP3020022B1 (en) | Generation of a patient-specific anatomical atlas | |
| JP6768862B2 (ja) | 医用画像処理方法、医用画像処理装置、医用画像処理システム及び医用画像処理プログラム | |
| JP2020025786A (ja) | 画像処理装置、方法及びプログラム | |
| US8494242B2 (en) | Medical image management apparatus and method, and recording medium | |
| EA027016B1 (ru) | Система и способ компьютерного моделирования медицинской процедуры | |
| US11669974B2 (en) | Constrained object correction for a segmented image | |
| US20190343418A1 (en) | System and method for next-generation mri spine evaluation | |
| EP3248172A1 (en) | Atlas-based determination of tumour growth direction | |
| US20260073526A1 (en) | Image processing apparatus, operation method of image processing apparatus, operation program of image processing apparatus, and learning method | |
| JP3989896B2 (ja) | 医用画像処理装置、関心領域抽出方法、ならびに、プログラム | |
| Smit et al. | RegistrationShop: An Interactive 3D Medical Volume Registration System. | |
| US20230394661A1 (en) | Image processing apparatus, method for operating image processing apparatus, and program for operating image processing apparatus | |
| US8933926B2 (en) | Image processing apparatus, method, and program | |
| CN102272799B (zh) | 解剖学定义的自动cpr生成 | |
| WO2022209501A1 (ja) | 情報処理装置、情報処理装置の作動方法、情報処理装置の作動プログラム | |
| US10102347B2 (en) | Patient specific anatiomical sketches for medical reports | |
| JPWO2020129979A1 (ja) | 画像処理装置、方法及びプログラム | |
| WO2021256096A1 (ja) | 領域修正装置、方法およびプログラム | |
| US10832423B1 (en) | Optimizing an atlas | |
| WO2020209383A1 (ja) | 構造物分離装置、方法およびプログラム、学習装置、方法およびプログラム、並びに学習済みモデル | |
| US20090128304A1 (en) | Method and apparatus for tactile interface for reviewing radiological images | |
| Moon et al. | Standardizing 3D medical imaging | |
| TW202302046A (zh) | 用於處理黑骨mri資料的系統及方法 |
Legal Events
| Date | Code | Title | Description |
|---|---|---|---|
| 121 | Ep: the epo has been informed by wipo that ep was designated in this application |
Ref document number: 21929201 Country of ref document: EP Kind code of ref document: A1 |
|
| WWE | Wipo information: entry into national phase |
Ref document number: 2023503385 Country of ref document: JP |
|
| NENP | Non-entry into the national phase |
Ref country code: DE |
|
| 122 | Ep: pct application non-entry in european phase |
Ref document number: 21929201 Country of ref document: EP Kind code of ref document: A1 |