WO2022085249A1 - 遅れ時間の算出装置、算出方法、及びコンピュータプログラム - Google Patents
遅れ時間の算出装置、算出方法、及びコンピュータプログラム Download PDFInfo
- Publication number
- WO2022085249A1 WO2022085249A1 PCT/JP2021/025485 JP2021025485W WO2022085249A1 WO 2022085249 A1 WO2022085249 A1 WO 2022085249A1 JP 2021025485 W JP2021025485 W JP 2021025485W WO 2022085249 A1 WO2022085249 A1 WO 2022085249A1
- Authority
- WO
- WIPO (PCT)
- Prior art keywords
- section
- sections
- delay time
- signal
- calculating
- Prior art date
- Legal status (The legal status is an assumption and is not a legal conclusion. Google has not performed a legal analysis and makes no representation as to the accuracy of the status listed.)
- Ceased
Links
Images







Classifications
-
- G—PHYSICS
- G08—SIGNALLING
- G08G—TRAFFIC CONTROL SYSTEMS
- G08G1/00—Traffic control systems for road vehicles
- G08G1/01—Detecting movement of traffic to be counted or controlled
- G08G1/052—Detecting movement of traffic to be counted or controlled with provision for determining speed or overspeed
-
- G—PHYSICS
- G08—SIGNALLING
- G08G—TRAFFIC CONTROL SYSTEMS
- G08G1/00—Traffic control systems for road vehicles
- G08G1/01—Detecting movement of traffic to be counted or controlled
- G08G1/0104—Measuring and analyzing of parameters relative to traffic conditions
- G08G1/0108—Measuring and analyzing of parameters relative to traffic conditions based on the source of data
- G08G1/0112—Measuring and analyzing of parameters relative to traffic conditions based on the source of data from the vehicle, e.g. floating car data [FCD]
-
- G—PHYSICS
- G08—SIGNALLING
- G08G—TRAFFIC CONTROL SYSTEMS
- G08G1/00—Traffic control systems for road vehicles
- G08G1/01—Detecting movement of traffic to be counted or controlled
- G08G1/0104—Measuring and analyzing of parameters relative to traffic conditions
- G08G1/0125—Traffic data processing
- G08G1/0133—Traffic data processing for classifying traffic situation
-
- G—PHYSICS
- G08—SIGNALLING
- G08G—TRAFFIC CONTROL SYSTEMS
- G08G1/00—Traffic control systems for road vehicles
- G08G1/01—Detecting movement of traffic to be counted or controlled
- G08G1/0104—Measuring and analyzing of parameters relative to traffic conditions
- G08G1/0137—Measuring and analyzing of parameters relative to traffic conditions for specific applications
- G08G1/0141—Measuring and analyzing of parameters relative to traffic conditions for specific applications for traffic information dissemination
-
- G—PHYSICS
- G08—SIGNALLING
- G08G—TRAFFIC CONTROL SYSTEMS
- G08G1/00—Traffic control systems for road vehicles
- G08G1/065—Traffic control systems for road vehicles by counting the vehicles in a section of the road or in a parking area, i.e. comparing incoming count with outgoing count
Definitions
- the present disclosure relates to a delay time calculation device, a calculation method, and a computer program.
- This application claims priority based on Japanese Application No. 2020-175372 filed on October 19, 2020, and incorporates all the contents described in the Japanese application.
- the traffic variable of the inflow route is described by using the first calculation unit for calculating the normalized data representing the traffic variable of the inflow route at the target intersection as a ratio to the saturated traffic flow rate, and the calculated normalized data.
- a traffic index calculation device including a second calculation unit for calculating a traffic index defined by an equation in which is included in the molecule and the saturated traffic flow rate is included in the denominator is described.
- the delay time per vehicle due to waiting for a signal in the inflow path is calculated from the average travel time of the probe vehicle, and the above normalized data is calculated based on the calculated delay time.
- the device includes an acquisition unit for acquiring probe information of a probe vehicle passing through an inflow path to an intersection, and one vehicle per vehicle waiting for a signal in the inflow path using the probe information as original data.
- a plurality of information processing units that execute a delay time calculation process are provided, and the calculation process includes a plurality of vehicle average speeds for each section formed by dividing the inflow path based on the probe information.
- the second process of calculating the total number of sections included in the signal waiting section in the inflow path based on the plurality of section speeds, and the second process of calculating the total number of sections.
- the third process of calculating the average travel time of the signal waiting section and the fourth process of calculating the delay time based on the total number of sections and the average travel time of the signal waiting section are included.
- the method includes a step of acquiring probe information of a probe vehicle passing through an inflow path to an intersection, and a delay per vehicle due to waiting for a signal in the inflow path using the probe information as original data.
- the calculation process includes a step of executing a time calculation process, and the calculation process includes a plurality of section speeds, which is an average speed of a vehicle for each of a plurality of sections obtained by dividing the inflow path, based on the probe information.
- the first process to be calculated, the second process to calculate the total number of sections which is the total number of the sections included in the signal waiting section in the inflow path based on the plurality of section velocities, and the second process based on the total number of sections.
- the third process of calculating the average travel time of the signal waiting section and the fourth process of calculating the delay time based on the total number of the sections and the average travel time of the signal waiting section are included.
- the computer program includes an acquisition unit that acquires probe information of a probe vehicle passing through an inflow path to an intersection, and one vehicle that waits for a signal in the inflow path using the probe information as original data. It is a computer program for operating a computer as an information processing unit that executes a calculation process of a hit delay time, and in the calculation process, a plurality of inflow paths are divided based on the probe information. Based on the first process of calculating the speed of a plurality of sections, which is the average speed of the vehicle for each section, and the total number of sections, which is the total number of the sections included in the signal waiting section in the inflow path, is calculated based on the speeds of the plurality of sections. The second process is to calculate the average travel time of the signal waiting section based on the total number of sections, and the delay time is calculated based on the total number of sections and the average travel time of the signal waiting section. The fourth process is included.
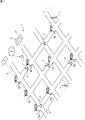
- FIG. 1 is an overall configuration diagram of a traffic signal control system.
- FIG. 2 is a block diagram of an information processing device, an in-vehicle device of a probe vehicle, and a central device included in a traffic signal control system.
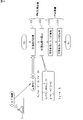
- FIG. 3 is a flowchart showing an outline of remote control according to a comparative example.
- FIG. 4 is a flowchart showing an outline of the remote control of the present embodiment.
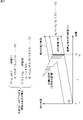
- FIG. 5 is an explanatory diagram showing an example of a method of calculating normalized data when the target intersection of remote control is a single intersection.
- FIG. 6 is an explanatory diagram showing a traffic condition at an intersection at the time of non-saturation and a relational expression necessary for deriving the traffic volume Vin normalized by Sf.
- FIG. 1 is an overall configuration diagram of a traffic signal control system.
- FIG. 2 is a block diagram of an information processing device, an in-vehicle device of a probe vehicle, and a central device included in a traffic signal control
- FIG. 7 is an explanatory diagram showing an example of traffic conditions at an intersection at the time of supersaturation.
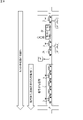
- FIG. 8 is an explanatory diagram showing an example of a stop event that affects the accuracy of the delay time per vehicle due to waiting for a signal.
- FIG. 9 is an explanatory diagram showing an example of the definition of variables used for calculating the average travel time of the signal waiting section.
- FIG. 10 is a flowchart showing an example of the calculation process of the delay time per vehicle due to waiting for a signal.
- FIG. 11 is a flowchart showing an example of the calculation process of the total number of sections in the signal waiting section.
- FIG. 12 is an explanatory diagram showing an actual calculation example of the total number of sections.
- FIG. 13 is an explanatory diagram showing an example of a method of calculating the delay time when the link between the intersections has a plurality of lanes.
- FIG. 14 is an explanatory diagram showing an example of a method of calculating the delay time when the link between the intersections has a plurality of lanes.
- the link travel time from the intersection on the upstream side to the target intersection is adopted as the average travel time of the probe vehicle. Therefore, if a stop event other than waiting for a signal has occurred in the probe vehicle, the delay time may be longer than it actually is. In view of the conventional problems, it is an object of the present disclosure to improve the accuracy of calculating the delay time per vehicle due to waiting for a signal.
- the calculation device of the present embodiment has an acquisition unit for acquiring probe information of a probe vehicle passing through an inflow path to an intersection, and one vehicle per vehicle waiting for a signal in the inflow path using the probe information as original data.
- the information processing unit is provided with an information processing unit that executes the calculation process of the delay time, and the calculation process includes a plurality of average speeds of vehicles for each of a plurality of sections obtained by dividing the inflow path based on the probe information.
- the first process of calculating the section speed of the above the second process of calculating the total number of sections including the total number of the sections included in the signal waiting section in the inflow path based on the plurality of section speeds, and the total number of the sections. Based on this, a third process of calculating the average travel time of the signal waiting section and a fourth process of calculating the delay time based on the total number of sections and the average travel time of the signal waiting section are included.
- the average travel time of the signal waiting section is calculated based on the total number of sections included in the signal waiting section in the inflow path, and the average travel time of the total number of sections and the signal waiting section is calculated. Since the above delay time is calculated based on the time, it is possible to accurately calculate the delay time per vehicle due to waiting for a signal in the inflow path regardless of the presence or absence of a stop event other than waiting for a signal.
- sections that satisfy the speed condition in which the section speed is equal to or less than the speed threshold value may be searched in order from the downstream side of the inflow path, and the speed condition may be determined.
- a search process for counting the satisfied section as a section included in the signal waiting section may be included. The reason is that the section satisfying the above speed condition is presumed to be a section in which the speed of the probe vehicle is reduced or stopped due to waiting for a signal.
- the search is performed.
- a process for continuing the process may be included. The reason is considered to be the result of the probe vehicle repeatedly stopping and traveling inside the signal waiting section when the length of the section that does not satisfy the speed condition is short, and the section under search is not necessarily upstream of the signal waiting section. This is because it cannot be said that it has reached the side.
- the above-mentioned A process may be included in which the count value up to the most upstream section satisfying the speed condition is set as the total number of the sections. The reason is that if the length of the section that does not satisfy the speed condition is long, it is considered that the section under search has reached the upstream side of the signal waiting section, and the most upstream side that satisfies the speed condition in the search so far. This is because the section can be estimated to be the end of the signal waiting section.
- the section length of each of the plurality of sections may be smaller than the installation interval (for example, 200 m) of the vehicle detector for measuring the vehicle speed.
- the measurement particle size of the average speed of the vehicle becomes finer than that of the case where the average speed of the vehicle is measured by the vehicle detector. Therefore, the signal waiting section determined according to the total number of sections can be calculated in more detail, and the accuracy of calculating the delay time can be improved.
- the third process may be a process of calculating the average travel time of the signal waiting section by the following equation (16).
- the average travel time of the signal waiting section can be accurately calculated by the following equation (16).
- Ttt Average travel time (seconds) for the signal waiting section
- Li Length of section i (m)
- Vi Average speed of section i (km / hour)
- I Total number of sections in the signal waiting section
- i Identification number of the section assigned in order from the downstream side
- the fourth process may be a process of calculating the delay time by the following formula (17).
- the delay time per vehicle due to waiting for a signal can be accurately calculated by the following equation (17).
- dav Delay time per vehicle due to waiting for a signal (average value) (seconds)
- Ttt Average travel time (seconds) for signal waiting sections
- Li Length of section i (m)
- Ve Assumed speed (for example, regulated speed) (km / hour)
- I Total number of sections in the signal waiting section i: Identification number of the section assigned in order from the downstream side
- the information processing unit is used for each of the plurality of lanes.
- the second process may be executed, or the third process and the fourth process may be executed based on the maximum total number of sections among the total number of sections calculated by the second process.
- the delay time of the lane having a large degree of unresolved remaining is calculated. Therefore, it is possible to accurately calculate the traffic index of the intersection according to the actual traffic situation, and it is possible to improve the calculation accuracy of the signal control parameter.
- the calculation method of the present embodiment is a calculation method executed by the above-mentioned calculation devices (1) to (8). Therefore, the calculation method of the present embodiment has the same effect as the above-mentioned calculation devices (1) to (8).
- the computer program of the present embodiment is a computer program for making a computer function as the calculation device of the above-mentioned (1) to (8). Therefore, the computer program of the present embodiment has the same operation and effect as the above-mentioned calculation devices (1) to (8).
- Vehicle Refers to all vehicles traveling on the road. Therefore, in addition to automobiles, light vehicles and trolley buses, motorcycles also fall under the category of vehicles.
- vehicle includes both a probe vehicle having an in-vehicle device capable of transmitting probe information and a normal vehicle having no in-vehicle device.
- Probe information Refers to various information related to the vehicle sensed by the probe vehicle traveling on the road.
- the probe information is also referred to as probe data or floating car data.
- the probe information can include various vehicle data such as probe vehicle identification information, vehicle position, vehicle speed, vehicle orientation and time of occurrence thereof.
- vehicle data such as probe vehicle identification information, vehicle position, vehicle speed, vehicle orientation and time of occurrence thereof.
- information such as position and acceleration acquired by a smartphone, tablet, or the like in the vehicle may be used.
- Probe vehicle A vehicle that senses probe information and sends it to the outside. Vehicles traveling on the road include both probe vehicles and non-probe vehicles. However, even if it is a normal vehicle that does not have an in-vehicle device that can transmit probe information, a vehicle that has a smartphone, tablet PC, etc. as described above that can transmit probe information such as vehicle position information to the outside is Include in probe vehicle.
- Signal control parameter The cycle length, split and offset, which are the time elements of the signal display, are collectively referred to as a signal control parameter or a signal control constant.
- Cycle length The time of one cycle from the blue (or red) start time of the traffic signal to the next blue (or red) start time. In Japan, it is stipulated by law that the green signal light color is called blue.
- “Representation” A signal representation that shows the relationship between the display status of each lamp included in a traffic signal. The indication indicates the right of way for each inflow route given to vehicles, pedestrians, etc. at the intersection, and the time zone in which the right of way is given.
- “Split” The ratio of the length of time allotted to each manifestation to the cycle length. Generally expressed as a percentage or percentage. Strictly speaking, it is the value obtained by dividing the effective blue time by the cycle length.
- “Offset” In system control or regional control, a time point of signal display, for example, a deviation from a reference time point common to the relevant signal group at the start time of the main road green light, or a deviation of the same display start point between adjacent intersections. It means that. The former is called an absolute offset and the latter is called a relative offset, and is expressed as a percentage of time (seconds) or period.
- Blue time The time zone when the vehicle has the right of way at the intersection.
- the end point of the blue time may be set to the time when the blue lamp is turned off at the earliest and the time when the yellow lamp is turned off at the latest. In the case of an intersection with an arrow lamp, it may be at the end of the right turn arrow.
- Red time The time zone when the vehicle does not have the right of way at the intersection.
- the start time of the red time may be set to the time when the blue lamp is turned off at the earliest and the time when the yellow lamp is turned off at the latest. In the case of an intersection with an arrow lamp, it may be at the end of the right turn arrow.
- “Queue” A queue of vehicles that are stopped before an intersection due to waiting for a traffic light due to a red light.
- “Link” A road section that connects nodes such as intersections and has an up or down direction. A link in the direction of inflow toward the intersection when viewed from a certain intersection is called an inflow link, and a link in the direction of outflow from the intersection when viewed from a certain intersection is called an outflow link.
- Travel time The time required for a vehicle to travel a certain section. Travel time may include stoppage times and delay times along the way.
- Link travel time Travel time when the road section of the calculation unit of travel time is "link”, that is, the travel time required for a vehicle to travel from the beginning to the end of one link. ..
- Traffic capacity The traffic capacity of a road is a one-way road or one lane within a certain period of time under the road conditions such as the shape, width, and slope of the road and the traffic conditions such as vehicle type composition and speed limit. The maximum number of vehicles that can pass through a section without difficulty. However, on a two-lane or three-lane road, both traffic volumes are taken.
- Traffic volume The number of vehicles passing through within a unit time. Unless otherwise specified, it is expressed as the number of vehicles passing by for one hour, but for control and evaluation, a short-time traffic volume such as a second unit, a five-minute unit, or a 15-minute unit may be used. Generally, the traffic volume increases according to the traffic demand, but decreases when the traffic demand exceeds the traffic capacity.
- Load factor In the supersaturated state, it is necessary to consider the "load traffic volume” as the control target variable, which is the sum of the traffic volume passing through the stop line and the number of remaining queues. The ratio of the load traffic volume (traffic flow factor) per unit time to the saturated traffic flow factor is called the load factor. When the number of units left unfinished due to supersaturation is small, the load factor is equivalent to the demand factor.
- Traffic demand The traffic volume or traffic flow rate that arrives at the stop line of the inflow route within a certain period of time for each intersection or inflow route, or for each traffic direction is called traffic demand.
- Traffic flow rate The value obtained by converting the number of vehicles passing through a certain cross section of a lane or a roadway in a certain time (usually less than one hour) per unit time (usually one hour) is called a traffic flow rate. For example, when the traffic volume for 15 minutes is 90 vehicles, the traffic flow rate for 15 minutes is 360 (vehicles / hour) or 6 (vehicles / minute). The traffic flow rate is the reciprocal of the average head time of vehicles that have passed during a given period of time.
- Saturated traffic flow rate is the maximum number of vehicles that can pass the stop line per unit time (for example, 1 second) and per lane at the inflow part of an intersection when there is sufficient traffic demand. That is. If there are different traffic flow lanes, such as when there is a right turn lane or a left turn lane in addition to the straight lane, the value of the saturated traffic flow rate will be different. The value of the saturated traffic flow rate also differs depending on the road or traffic conditions such as the lane width and the mixing rate of large vehicles.
- Point control Traffic signal control can be classified into three categories: point control, system control, and surface control, based on the number of intersections and spatial configuration. Of these, point control is a method of controlling signalized intersections independently.
- System control A method of controlling a series of adjacent intersections in conjunction with each other. The feature of this method is that a common cycle length (common cycle length of the system) and an offset are determined for a plurality of signals to be system-controlled.
- Surface control A method of collectively controlling a large number of traffic lights installed in a road network that spreads over a plane. It is an expanded version of route system control.
- Constant cycle control When traffic signal control is classified according to a signal control parameter setting method, it can be classified into three categories: fixed cycle control, traffic sensitive control, and traffic adaptation control. Of these, the constant cycle control is a method in which signal control parameters are set in advance according to the time zone. It is carried out by selecting one from a combination of signal control parameters (called a program) set in advance according to the time zone and the day of the week (weekdays, Saturdays, Sundays and holidays).
- Traffic-sensitive control Of the traffic signal control using a vehicle detector, this method is executed for each signal controller. Also called terminal sensitive control. In traffic sensitivity control, the start and end points of the blue display are determined in response to changes in traffic demand for a short period of time, and as a result, the blue time length and cycle length are changed.
- Traffic adaptation control The central device of the traffic control center changes the signal control parameters for the traffic signal controller at an important intersection or the traffic signal controller at multiple intersections that are system-controlled or surface-controlled. It is a control method. Since the central device remotely controls one or more traffic signal controllers, it is also referred to as “remote control” in this embodiment. Since traffic adaptation control is capable of advanced system control corresponding to fluctuations in traffic flow, it is applied to roads where high traffic volume and time fluctuations are large and high traffic processing efficiency is required.
- Traffic adaptation control is classified into two types, "program selection control” and "program formation control".
- the program selection control is a method of selecting a combination (program) suitable for the current traffic condition from information of a vehicle detector or the like from a plurality of combinations (programs) prepared in advance.
- the program formation control is a method in which a combination of a finite number of signal control parameters is not prepared, and the signal control parameter or the signal light color switching timing is immediately determined based on the information of the vehicle detector or the like.
- MODERATO Management by Origin-DEstination Related Adaptation for Traffic Optimization: The name of program formation control in UTMS (Universal Traffic Management System) in Japan.
- SCOOT Split Cycle Offset Optimisation Technique
- SCATS Sand Coordinated Adaptive Traffic System: A program selection control method developed in Australia. It is used at about 42,000 intersections in more than 1800 cities in approximately 40 countries. SCATS finds the best signal control parameters (cycle length, split and offset) for current traffic by selecting automated planning from the library in response to data obtained from road detectors and the like. It is a system.
- FIG. 1 is an overall configuration diagram of a traffic signal control system 1 according to the present embodiment.
- FIG. 2 is a block diagram of an information processing device 2 included in the traffic signal control system 1, an in-vehicle device 4 of a probe vehicle 3, and a central device 5.
- the traffic signal control system 1 includes an information processing device 2 installed in a data center or the like, an in-vehicle device 4 mounted on a probe vehicle 3, and a central device 5 installed in a traffic control center. , And a traffic signal controller 6 installed at each intersection.
- the information processing device 2 collects probe information including the vehicle position and its passing time from the probe vehicle 3, and acquires signal information at an intersection from the central device 5, so that the probe information It is a system that calculates traffic indicators such as the load factor required to generate signal control parameters at intersections using signal information.
- the information processing device 2 of the present embodiment functions as a "traffic index calculation device” necessary for generating signal control parameters. Further, the information processing device 2 of the present embodiment also functions as a "delay time calculation device” for each vehicle due to waiting for a signal in the inflow path, which is the original data of a traffic index such as a load factor.
- the operating entity of the information processing apparatus 2 is not particularly limited.
- the operating entity of the information processing apparatus 2 may be a manufacturer of the vehicle 3, an IT company engaged in various information providing businesses, or a public operator responsible for traffic control operating the central apparatus 5.
- the operation format of the server of the information processing apparatus 2 may be either an on-premises server or a cloud server.
- the in-vehicle device 4 of the probe vehicle 3 is capable of wireless communication with radio base stations 7 (for example, mobile base stations) in various places.
- the radio base station 7 can communicate with the information processing device 2 via a public communication network 8 such as the Internet. Therefore, the in-vehicle device 4 can wirelessly transmit the uplink information S1 addressed to the information processing device 2 to the radio base station 7. Further, the information processing device 2 can transmit the downlink information S2 addressed to the specific in-vehicle device 4 to the public communication network 8.
- the information processing apparatus 2 includes a server computer 10 including a workstation and various databases 21 to 24 connected to the server computer 10.
- the server computer 10 includes an information processing unit 11, a storage unit 12, and a communication unit 13.
- the storage unit 12 stores a storage including at least one non-volatile memory (recording medium) of an HDD (Hard Disk Drive) and an SSD (Solid State Drive), and a volatile memory (recording medium) including a random access memory or the like. It is a device.
- the non-volatile memory may be removable.
- the information processing unit (hereinafter, also referred to as “processing unit”) 11 includes a CPU (Central Processing Unit) that reads out a computer program 14 stored in the non-volatile memory of the storage unit 12 and performs information processing according to the program 14. It consists of an arithmetic processing unit.
- the computer program 14 of the information processing apparatus 2 causes the CPU of the processing unit 11 to execute a predetermined traffic index calculation process such as calculation of a delay time due to waiting for a signal of the probe vehicle 3 and calculation of a load factor based on the delay time. Programs etc. are included.
- the communication unit 13 includes a communication interface that communicates with the central device 5 and the radio base station 7 via the public communication network 8.
- the communication unit 13 can receive the uplink information S1 transmitted by the radio base station 7 to its own device, and can transmit the downlink information S2 generated by its own device to the radio base station 7.
- the uplink information S1 includes probe information from which the vehicle-mounted device 4 is a transmission source.
- the downlink information S2 includes the link travel time calculated by the processing unit 11.
- the communication unit 13 can receive the signal information of the intersection included in the traffic control area transmitted by the central device 5 to the own device.
- the signal information of the intersection includes at least the cycle length and the red time length of the intersection.
- the communication unit 13 may be connected to the central device 5 of the traffic control center via a dedicated communication line 9 instead of the public communication network 8.
- the various databases 21 to 24 consist of large-capacity storage including HDDs, SSDs, and the like. These databases 21 to 24 are connected to the server computer 10 so as to be able to transfer data.
- the databases 21 to 24 include a map database 21, a probe database 22, a member database 23, and a signal information database 24.
- Road map data 25 covering the whole country is recorded in the map database 21.
- the road map data 25 includes "intersection data” and "link data".
- the "intersection data” is data in which the intersection ID given to the intersection in Japan and the position information of the intersection are associated with each other.
- the "link data” is composed of data in which the following information 1) to 4) are associated with the link ID of the specific link given corresponding to the domestic road.
- the road map data 25 constitutes a network corresponding to the actual road alignment and the traveling direction of the road. Therefore, the road map data 25 is a network in which the road sections between the nodes n representing the intersections are connected by a directed link l (lowercase el). Specifically, the road map data 25 consists of a directed graph in which nodes n are set for each intersection and each node n is connected by a pair of directed links l in opposite directions. Therefore, in the case of a one-way road, the node n is connected only to the directed link l in one direction.
- the road map data 25 includes road type information indicating whether the specific directed link l corresponding to each road on the map is a general road or a toll road, and a tollhouse included in the directed link l. Alternatively, facility information indicating the type of facility such as a parking area is also included.
- probe information received from the probe vehicle 3 registered in advance in the information processing apparatus 2 is stored for each identification information of the vehicle 3.
- the accumulated probe information includes at least the vehicle position and the passing time thereof.
- the probe information may include vehicle data such as vehicle speed, vehicle orientation, and vehicle state information (stop / running event).
- the sensing cycle of the probe information is a particle size that can accurately identify the traveling history of the probe vehicle 3, and is, for example, 0.5 to 1.0 second.
- the member database 23 personal information such as the address and name of the owner (registered member) of the probe vehicle 3, the vehicle identification number (VIN), and the identification information of the in-vehicle device 4 (for example, MAC address, e-mail address and telephone number) are stored. At least one of) is recorded.
- signal information database 24 signal information including the cycle length and the red time length of the inflow path of each intersection is accumulated for each intersection ID and link ID.
- the traffic signal controller 6 installed at each intersection of the traffic control area includes the following two types of traffic signal controllers, the first controller 6A and the second controller 6B.
- 1st controller 6A Traffic signal controller 2nd controller that performs point control (fixed cycle control, etc.) that independently determines the signal light color, not the target of remote control (system control, surface control, etc.) by the central device 5.
- 6B Traffic signal controller that is the target of remote control (system control, surface control, etc.) by the central device 5.
- the central device 5 transmits the signal information of the first controller 6A to the information processing device 2 only when the operation is changed.
- the processing unit 11 updates the signal information of the first controller 6A included in the signal information database 24 with the received signal information.
- the central device 5 transmits the signal information of the second controller 6B to the information processing device 2 at predetermined control cycles (for example, 1.0 to 2.5 minutes).
- the processing unit 11 updates the signal information of the second controller 6B included in the signal information database 24 with the received signal information.
- the in-vehicle device 4 includes a computer device including a processing unit 31, a storage unit 32, a communication unit 33, and the like.
- the processing unit 31 comprises an arithmetic processing unit including a CPU that reads out a computer program 34 stored in the non-volatile memory of the storage unit 32 and performs various information processing according to the program 34.
- the storage unit 32 is a storage device including at least one non-volatile memory (recording medium) of the HDD and SSD, and a volatile memory (recording medium) including a random access memory and the like.
- the computer program 34 of the in-vehicle device 4 is a program for causing the CPU of the processing unit 31 to execute sensing and generation of probe information, route search processing of the probe vehicle 3, image processing for displaying the search result on the display of the navigation device, and the like. And so on.
- the communication unit 33 comprises a wireless communication device permanently mounted on the probe vehicle 3 or a data communication terminal (for example, a smartphone, a tablet computer, a node-type personal computer, etc.) temporarily mounted on the probe vehicle 3. ..
- the communication unit 33 has, for example, a GPS (Global Positioning System) receiver.
- the processing unit 31 monitors the current position of the own vehicle in near real time based on the GPS position information received by the communication unit 33. For positioning, it is preferable to use a global navigation satellite system such as GPS, but other methods may be used.
- the processing unit 31 measures vehicle data such as the vehicle position, vehicle speed, vehicle direction, and CAN information of the own vehicle at predetermined sensing cycles (for example, 0.5 to 1.0 second), and stores the measurement time together with the measurement unit. Record at 32.
- vehicle data such as the vehicle position, vehicle speed, vehicle direction, and CAN information of the own vehicle at predetermined sensing cycles (for example, 0.5 to 1.0 second)
- the communication unit 33 When the vehicle data is accumulated in the storage unit 32 for a predetermined recording time (for example, 1 minute), the communication unit 33 generates and generates probe information including the accumulated vehicle data and the identification information of the own vehicle.
- the probe information is uplink-transmitted to the information processing apparatus 2.
- the in-vehicle device 4 includes an input interface (not shown) that accepts the driver's operation input.
- the input interface includes, for example, an input device attached to a navigation device, an input device of a data communication terminal mounted on the probe vehicle 3, and the like.
- the central device 5 comprises a server computer that collectively controls traffic signal controllers 6 at a plurality of intersections included in a traffic control area.
- the central device 5 includes a processing unit 51, a storage unit 52, a communication unit 53, and the like.
- the traffic signal controller 6 in the traffic control area includes a point control type first controller 6A that operates independently (stand-alone) and a second control that is a control target of remote control (traffic adaptation control) by the central device 5.
- Machine 6B is included.
- the processing unit 51 comprises an arithmetic processing unit including a CPU that reads out a computer program 54 stored in the non-volatile memory of the storage unit 52 and performs various information processing according to the program 54.
- the storage unit 52 is a storage device including at least one non-volatile memory (recording medium) of the HDD and SSD, and a volatile memory (recording medium) including a random access memory and the like.
- the computer program 54 of the central device 5 includes a program for performing remote control (traffic adaptation control) of at least one of MODERATO, SCOOT and SCATS.
- the processing unit 51 When the signal control parameter is generated by remote control, the processing unit 51 generates a signal control command to be executed by the second controller 6B, which is the control target of remote control.
- the signal control command is information regarding the light color switching timing of the signal lamp corresponding to the newly generated signal control parameter, and is generated every control cycle of remote control (for example, 1.0 to 2.5 minutes).
- the communication unit 53 includes a communication interface that communicates with the information processing device 2 via the public communication network 8 and communicates with the second controller 6B via the dedicated communication line 9.
- the communication unit 53 may be connected to the information processing device 2 via a dedicated communication line 9.
- the communication unit 53 transmits a signal control command generated by the processing unit 51 for each control cycle of the signal control parameter to the second controller 6B, which is the target of remote control.
- the communication unit 53 transmits signal information including the cycle length and the red time length in operation by the first and second controllers 6A and 6B to the information processing apparatus 2.
- the signal information of the second controller 6B is transmitted to the information processing apparatus 2 every control cycle of remote control (for example, 1.0 to 2.5 minutes).
- FIG. 3 is a flowchart showing an outline of remote control (traffic adaptation control) according to a comparative example.
- “measurement of traffic flow” step S1
- “calculation of traffic index” step S2
- “calculation of signal control parameters” step S3
- “Reflecting signal control parameters” step S4
- the processing unit 51 of the central device 5 repeatedly executes each of the processes of steps S1 to S4 at predetermined control cycles (for example, 1.0 to 2.5 minutes).
- the traffic flow measurement (step S1) is a process of measuring the traffic flow for each inflow path at the target intersection.
- Conventional traffic flow measurement is a process of calculating actual measurement data based on a detection signal (pulse signal or the like) of a vehicle detector.
- the measured data includes the measured values of the traffic volume Vin, the number of queues Qin, and the saturated traffic flow rate Sf. Note that Sf may be a set value based on the road structure.
- the calculation of the traffic index is a process of calculating the traffic index for each inflow route required for the calculation of the signal control parameter by using the measurement result of step S1.
- the traffic index used in MODERATO is the load factor Lr.
- the load factor Lr is the ratio of traffic demand to the maximum traffic volume that can be processed in one cycle.
- the traffic index used in SCOOT and SCATS is the indicated saturation Ds.
- the indicated saturation Ds is the ratio of the arriving traffic to the maximum traffic that can be processed during the blue hours.
- the calculation formula of the load factor Lr is as shown in the following formula (1).
- the formula for calculating the indicated saturation degree Ds is as shown in the following formula (2).
- Lr (Vin + k ⁇ Qin) / Sf -> (1)
- Vin Inflow traffic volume to the intersection (vehicles / second)
- k Weight coefficient (for example, 1.0 is used)
- Qin Traffic volume conversion value of the number of queues (units / second)
- Sf Saturated traffic flow rate (units / second)
- C Cycle length (seconds)
- the calculation formula of the load factor Lr includes the inflow traffic volume Vin and the number of queues Qin as the traffic variables of the inflow route.
- the calculation formula of the indicated saturation degree Ds includes the inflow traffic volume Vin as the traffic variable of the inflow route.
- the processing unit 51 of the central device 5 substitutes the measured values of Vin, Qin, and Sf obtained in step S1 into the equation (1) or (2), and at least one of the load factor Lr and the indicated saturation degree Ds. Calculate two traffic indicators.
- the calculation of the signal control parameter is a process of calculating the signal control parameter such as the split and the cycle length of the intersection to be controlled by using the traffic index calculated in step S2.
- the central device 5 adopts MODERATO and calculates the split and cycle length of the crossroads intersection including only two indications.
- the load factor of each inflow path j of the present i is "Lij"
- the traffic volume in the inflow path j is "Vij”
- the number of queues in the inflow path j is "Qij”
- the saturated traffic flow rate in the inflow path j is "Sij”.
- the processing unit 51 of the central device 5 calculates the load factor Lri of the present i by the following equation (4), and calculates the load factor Lrt of the entire intersection by the following equation (5).
- “maxj” means the maximum value among the j load factor Lij included in the display i.
- Lri maxj (Lij) & (4)
- Lrt Lr1 + Lr2 together (5)
- the processing unit 51 of the central device 5 calculates the split ⁇ i and the cycle length C of the present i by the following equations (6) and (7).
- K represents the loss time
- a1 to a3 are coefficients.
- Reflecting the signal control parameters is a process of causing the second controller 6B at the target intersection to execute the signal control parameters calculated in step S3. Specifically, the processing unit 51 of the central device 5 calculates a signal control command including the light color switching timing from the new signal control parameter, and transmits the calculated signal control command to the second controller 6B. In the case of the second controller 6B capable of calculating the light color switching timing from the signal control parameter, the signal control parameter may be transmitted to the second controller 6B as it is.
- the measured values of Vin, Qin, and Sf obtained from the detection signal of the vehicle detector are used in the definition formula (formula (1) or (2)) of the traffic index Lr, Ds.
- the traffic indicators Lr and Ds are calculated. Therefore, in the remote control according to the comparative example, there is a problem that the control target is limited to the traffic signal controller 6 at the intersection where the vehicle detector is installed.
- the numerator includes Vin and Qin
- the denominator includes the saturated traffic flow factor Sf in the definition formulas of the load factor Lr and the indicated saturation degree Ds. Therefore, if the traffic volume Vin and the number of queues Qin input in the equations (1) and (2) are defined as variables representing the ratio to the saturated traffic flow factor Sf, the true values of Vin, Qin and Sf are unknown. However, the load factor Lr and the indicated saturation degree Ds can be calculated.
- the general term for "normalized traffic volume” and “number of normalized queues” is referred to as "normalized data”.
- the saturated traffic flow rate Sf here can take any value.
- the signal control parameter is calculated from the load factor Lr and the indicated saturation degree Ds even without the vehicle detector. be able to.
- the traffic index used for calculating the signal control parameter is calculated using the normalized data obtained from the probe information and the like, remote control can be executed even if the vehicle detector is not installed.
- the outline of the remote control of the present embodiment will be described with reference to FIG.
- FIG. 4 is a flowchart showing an outline of remote control (traffic adaptation control) of the present embodiment.
- "measurement of traffic flow” step S11
- “calculation of traffic index” step S12
- “calculation of signal control parameters” step S13
- “Reflecting signal control parameters” step S14
- the processing unit 11 of the information processing apparatus 2 repeatedly executes each of the processes of steps S11 to S12 every predetermined control cycle (for example, 1.0 to 2.5 minutes).
- the processing unit 51 of the central device 5 repeatedly executes each processing of steps S13 to S14 every same control cycle (for example, 1.0 to 2.5 minutes).
- the traffic flow measurement (step S11) is a process of measuring the traffic flow for each inflow route at the target intersection.
- the measurement of the traffic flow of the present embodiment is a process of calculating the normalized data using the probe information as the original data.
- the calculation of the traffic index is a process of calculating the traffic index for each inflow route required for the calculation of the signal control parameter by using the measurement result of step S11.
- the calculation formula of the load factor Lr is as in the above-mentioned formula (1).
- the formula for calculating the indicated saturation degree Ds is as described in the above formula (2).
- Sf is canceled by the numerator / denominator on the right side, so even if the values of Vin, Qin and Sf themselves are unknown, the load factor Lr and The indicated saturation degree Ds can be calculated.
- the processing unit 11 of the information processing apparatus 2 transmits the calculation result of the load factor Lr or the indicated saturation degree Ds obtained in step S13 to the central apparatus 5.
- the processing unit 51 of the central device 5 receives the calculation result of the load factor Lr or the indicated saturation degree Ds from the information processing device 2
- the processing unit 51 of the central device 5 executes the calculation process of steps S13 and S14 using the received calculation result.
- the calculation of the signal control parameter is a process of calculating the signal control parameter such as the split and the cycle length of the controlled object by using the traffic index received from the information processing apparatus 2.
- the processing content of step 13 is the same as that of step S3 of FIG.
- Reflecting the signal control parameter is a process of causing the second controller 6B at the target intersection to execute the signal control parameter calculated in step S13.
- the processing content of step 14 is the same as that of step S4 of FIG.
- FIG. 5 is an explanatory diagram showing an example of a method of calculating normalized data when the target intersection of remote control is a single intersection.
- the meanings of the variables and the like included in FIG. 5 are as follows.
- the "single intersection" is a remote-controlled intersection that is independently controlled independently of other intersections.
- the processing unit 11 of the information processing apparatus 2 has the following equation (10) or equation (11) depending on the saturated state (unsaturated / supersaturated) of the intersection. ) Is used to calculate the normalized traffic volume Vin and the normalized queue number Qin. In the equations (10) and (11), "R" is the red time (seconds).
- the lower graph of FIG. 5 is a graph showing a traveling locus when a plurality of vehicles pass through a link between intersections J1 and J2.
- the horizontal axis of the graph is the distance from the intersection J1, and the vertical axis of the graph is the travel time.
- the delay time dav per vehicle due to waiting for a signal is the total delay time (triangle area) of all vehicles passing through intersection J2 after waiting for a signal. Is divided by the number of vehicles. It can be considered that the average travel time Tt of the plurality of probe vehicles 3 includes the delay time dav per vehicle described above.
- the processing unit 11 of the information processing apparatus 2 has passed the link between the intersections J1 and J2 in the current control cycle (for example, 1.0 to 2.5 minutes) from the position and time of the probe information included in the probe database 22. Extract probe information of a plurality of probe vehicles 3. Then, the processing unit 11 calculates the average travel time Tt of the link by the probe vehicle 3 based on the position and time (the speed may be used) of the extracted plurality of probe information, and formulates the calculated Tt. Substitute in 12) to obtain the delay time dav.
- FIG. 6 is an explanatory diagram showing the traffic condition of the intersection J2 at the time of non-saturation and the relational expression necessary for deriving the traffic volume Vin normalized by Sf.
- D is the total delay time (seconds) in one cycle
- Gc is the time (seconds) with the blue start time as the origin, and the last vehicle crosses the stop line at the intersection J2. Represents the time of passage.
- FIG. 7 is an explanatory diagram showing an example of the traffic condition at the intersection J2 at the time of supersaturation.
- a model representing a supersaturated state including a vehicle waiting for two or more traffic lights a simple model of only running and stopping is assumed.
- the stop time per stop is equal to the red time R.
- Pattern 1 in FIG. 7 shows a traffic condition when the queue is cleared in this cycle (waiting for 0 cycle), that is, when the intersection J2 is just saturated.
- Pattern 2 in FIG. 7 shows the traffic situation when the queue is cleared in the next cycle (waiting for one cycle), and pattern 3 in FIG. 7 shows the traffic situation when the queue is cleared in the next cycle (waiting for two cycles). Shows the traffic conditions of.
- FIG. 8 is an explanatory diagram showing an example of a stop event that affects the accuracy of the delay time dav per vehicle due to waiting for a signal.
- stop events that can occur when the probe vehicle 3 passes through the link from intersection J1 to intersection J2, in addition to waiting for a signal at intersection J2, for example, the following events E1 and E2 are included.
- Event E2 Stopped due to being a trailing vehicle of another vehicle 3Y entering and exiting the parking lot
- the link travel time between the intersections J1 and J2 is adopted as the average travel time Tt obtained from the probe information. Therefore, when the above-mentioned events E1 and E2 have occurred in the probe vehicle 3, the average travel time Tt includes the stop time of the events E1 and E2, and the delay time based on the equation (12). The dav becomes excessive than it actually is.
- the normalized traffic volume Vin and the normalized queue Qin using the delay time dav as the original data become inaccurate, and the load factor Lr and the display using the normalized traffic volume Vin and the normalized queue Qin as the original data become inaccurate.
- the saturation Ds also becomes inaccurate. Therefore, the accuracy of the signal control parameters calculated from the load factor Lr and the indicated saturation Ds may decrease.
- the average travel time Ttt of the signal waiting section does not include or is very unlikely to include the stop time of events E1 and E2 other than the signal waiting. Therefore, if the above calculation method is adopted, the delay time dav per vehicle due to waiting for a signal in the inflow path flowing into the intersection J2 can be obtained regardless of the presence or absence of a stop event other than waiting for a signal such as events E1 and E2. It can be calculated accurately.
- FIG. 9 is an explanatory diagram showing an example of the definition of variables used for calculating the average travel time Ttt of the signal waiting section.
- the section i is composed of a plurality of subsections when the link between the intersections J1 and J2 is divided by a predetermined number of divisions N.
- the length of the section i (hereinafter, also referred to as “section length”) Li is a calculated value or a set value determined to be a sufficiently shorter value than the link length L between the intersections J1 and J2. ..
- the processing unit 11 of the information processing apparatus 2 executes the following processes a1 and a2 as preprocessing of the delay time dav calculation process (see FIG. 10).
- Process a2: The identification numbers (i 1, 2, ... N) of the section i are assigned in order from the downstream side to the upstream side of the link. Specifically, the identification number on the most downstream side is set to "1", the identification number is incremented toward the upstream side, and the last identification number is set to "N".
- the processing unit 11 of the information processing apparatus 2 may execute the following processes b1 and b2 as preprocessing of the delay time dav calculation process (see FIG. 10).
- the length (section length) Li of each of the plurality of sections i is a value smaller than the installation interval (for example, 200 m) of the vehicle detector actually installed on the road for measuring the vehicle speed. It may be set to. By doing so, the measurement particle size of the average speed of the vehicle becomes finer than that of the case where the average speed of the vehicle is measured by the vehicle detector. Therefore, the signal waiting section determined according to the total number of sections I can be calculated in more detail, and the calculation accuracy of the delay time dav can be improved.
- the average speed of the probe vehicle 3 in the section i (hereinafter, also referred to as “section speed”) Vi is the average speed of the probe vehicle 3 calculated from the positions and times of a plurality of probe information. The method of calculating the average velocity Vi of each section i will be described later.
- FIG. 10 is a flowchart showing an example of the calculation process of the delay time dav per vehicle due to waiting for a signal, which is executed by the processing unit 11 of the information processing apparatus 2.
- the processing unit 11 of the information processing apparatus 2 first controls this time from the position and time of the probe information included in the probe database 22 as a data collection process necessary for calculating the delay time dav.
- the probe information of the plurality of probe vehicles 3 that have passed the link between the intersections J1 and J2 in the cycle (for example, 1.0 to 2.5 minutes) is extracted (step ST10).
- the processing unit 11 calculates the total number of sections I in the signal waiting section in the inflow path of the intersection J2 to be controlled as the second process of the calculation process of the delay time dav (step ST12).
- the total number of sections I corresponds to the identification number of the section i located at the uppermost stream of the signal waiting section in the inflow path of the intersection J2 to be controlled. The details of the calculation process of the total number of sections I (see FIG. 11) will be described later.
- the third process of step ST13 and the fourth process of step 14 are configured by substituting the equation (16) into the Ttt on the right side of the equation (17). It may be executed by a mathematical formula.
- FIG. 11 is a flowchart showing an example of the calculation process of the total number of sections I in the signal waiting section executed by the processing unit 11 of the information processing apparatus 2.
- ML is a variable representing a section length in which the section speed Vi exceeds the speed threshold value TS.
- TS is a speed threshold and
- TL is a distance threshold.
- the speed threshold TS is an estimated value of the average speed of the vehicle when the vehicle stops before the intersection J2 due to waiting for a signal.
- the distance threshold TL is an estimated value of the cruising distance when a vehicle traveling at an average speed exceeding the speed threshold TS continues traveling without the intention of stopping.
- step ST24 determines whether or not i ⁇ N is satisfied. If the determination result in step ST24 is affirmative, the processing unit 11 ends the processing. If the determination result in step ST24 is negative, the processing unit 11 returns the processing to before step ST21.
- the section i satisfying the speed condition in which the section speed Vi is equal to or less than the speed threshold TS is searched in order from the downstream side of the inflow path, and the section satisfying the speed condition is included in the signal waiting section.
- the search process counting as i is executed.
- step ST21 When the determination result in step ST21 is negative (when the section speed Vi of the section i being determined exceeds the speed threshold TS), the processing unit 11 adds the section length Li of the section i being determined to the variable ML. After that (step ST25), it is determined whether or not ML ⁇ TL is satisfied (step ST26).
- step ST26 When the determination result in step ST26 is negative (when the variable ML is less than the distance threshold value TL), the processing unit 11 resets the variable ML to 0 on condition that Vi + 1 ⁇ TS is satisfied (step ST27). ), The process is returned to before step ST23. Therefore, when Vi + 1> TS, the value of the variable ML is maintained without being reset, and the process is returned before step ST23.
- step ST26 the processing unit 11 sets the number value of the last section i satisfying Vi ⁇ TS as the total number of sections I in the signal waiting section. (Step ST28), and the process is terminated.
- FIG. 12 is an explanatory diagram showing an actual calculation example of the total number of sections I.
- the numerical values “u1” to “u5” are actual measurement values of the section speed Vi obtained from the probe information of the plurality of probe vehicles 3, and are assumed to be the following numerical values, respectively. Further, it is assumed that the number of divisions N of the link is 15, the section length Li of each section i is 50 m, the TS is 25 km / hour, and the TL is 100 m.
- u1 numerical value of 10 km / h or less
- u2 numerical value of 15 km / h or less
- u3 numerical value of 20 km / h or less
- u4 numerical value of 25 km / h or less
- u5 numerical value exceeding 25 km / h
- FIGS. 13 and 14 are explanatory views showing an example of a method of calculating the delay time dav when the link between the intersections J1 and J2 has a plurality of lanes.
- the inflow path from the intersection J1 to the intersection J2 includes a plurality of lanes R1 to R3, in which the lane R1 is for turning left and going straight, and the lane R2 is for going straight. It is assumed that the lane and the lane R3 are lanes dedicated to turning right.
- the processing unit 11 of the information processing apparatus 2 has the total number of sections for each of the plurality of lanes R1 and R2.
- the calculation process of I (FIG. 11) is executed, and the delay time dav of the inflow path of the intersection J2 is calculated based on the maximum total number of sections I of the calculated total number of sections I.
- the delay time dav of the lane R2 having a large degree of unresolved residue is calculated. Therefore, it is possible to accurately calculate the traffic index (Vin and Qin) of the intersection J2 according to the actual traffic situation, and it is possible to improve the calculation accuracy of the signal control parameter.
- the processing unit 11 of the information processing apparatus 2 calculates the total number of sections I only for the lane R3 (FIG. 14). 11) is executed, and the delay time dav of the lane R3 is adopted as data for calculating the signal control parameter.
- the calculation process of the total number of sections I (FIG. 11) is executed for each of the plurality of lanes R3 and R4, and the total number of sections I is calculated.
- the delay time dav of the inflow path at the intersection J2 may be calculated based on the total number of sections I of the larger lane R3 (or R4).
- the information processing device 2 executes the measurement of the traffic flow (step S11 in FIG. 4), and the central device 5 performs the processing after the calculation of the traffic index (steps S12 to S14 in FIG. 4). You may do it.
- the central device 5 is capable of collecting and analyzing probe information, the central device 5 performs all processes from measurement of traffic flow to reflection of signal control parameters (steps S11 to S14 in FIG. 4). You may decide.
- Traffic signal control system Information processing device (delay time calculation device) 3 Probe vehicle 3X Bus 3Y Other vehicle 4 In-vehicle device 5 Central device (delay time calculation device) 6 Traffic signal controller 6A 1st controller 6B 2nd controller 7 Radio base station 8 Public communication network 9 Communication line 10 Server computer 11 Information processing unit 12 Storage unit 13 Communication unit (acquisition unit) 14 Computer program 21 Map database 22 Probe database 23 Member database 24 Signal information database 25 Road map data 31 Processing unit 32 Storage unit 33 Communication unit 34 Computer program 51 Processing unit 52 Storage unit 53 Communication unit 54 Computer program
Landscapes
- Physics & Mathematics (AREA)
- General Physics & Mathematics (AREA)
- Chemical & Material Sciences (AREA)
- Analytical Chemistry (AREA)
- Traffic Control Systems (AREA)
Abstract
Description
本出願は、2020年10月19日出願の日本出願第2020-175372号に基づく優先権を主張し、前記日本出願に記載された全ての記載内容を援用するものである。
従来の算出装置では、プローブ車両の平均旅行時間として、上流側の交差点から対象交差点までのリンク旅行時間を採用する。従って、プローブ車両に信号待ち以外の停止イベントが発生していた場合には、遅れ時間が実際よりも過大になる可能性がある。
本開示は、かかる従来の問題点に鑑み、信号待ちによる車両1台当たりの遅れ時間の算出精度を向上することを目的とする。
本開示によれば、信号待ちによる車両1台当たりの遅れ時間の算出精度を向上することができる。
以下、本発明の実施形態の概要を列記して説明する。
(1) 本実施形態の算出装置は、交差点への流入路を通行するプローブ車両のプローブ情報を取得する取得部と、前記プローブ情報を元データとして、前記流入路における信号待ちによる車両1台当たりの遅れ時間の算出処理を実行する情報処理部と、を備え、前記算出処理には、前記プローブ情報に基づいて、前記流入路を分割してなる複数の区間ごとの車両の平均速度である複数の区間速度を算出する第1処理と、前記複数の区間速度に基づいて、前記流入路における信号待ち区間に含まれる前記区間の総数である区間総数を算出する第2処理と、前記区間総数に基づいて、前記信号待ち区間の平均旅行時間を算出する第3処理と、前記区間総数と前記信号待ち区間の平均旅行時間に基づいて、前記遅れ時間を算出する第4処理と、が含まれる。
その理由は、上記の速度条件を満たす区間は、信号待ちによるプローブ車両の速度低下又は停止が発生した区間と推定されるからである。
その理由は、速度条件を満たさない区間の長さが短い場合は、信号待ち区間の内部においてプローブ車両が停止と進行を繰り返した結果と考えられ、探索中の区間が必ずしも信号待ち区間よりも上流側に達したとは言えないからである。
その理由は、速度条件を満たさない区間の長さが長い場合は、探索中の区間が信号待ち区間よりも上流側に達したと考えられ、これまでの探索で速度条件を満たす最も上流側の区間が、信号待ち区間の末尾と推定できるからである。
このようにすれば、車両感知器により車両の平均速度を計測する場合に比べて、車両の平均速度の計測粒度が細かくなる。このため、区間総数に応じて定まる信号待ち区間をより細かく算出でき、遅れ時間の算出精度を向上することができる。

ただし、Ttt:信号待ち区間の平均旅行時間(秒)
Li :区間iの長さ(m)
Vi :区間iの平均速度(km/時)
I :信号待ち区間内の区間総数
i :下流側から順に割り当てられた区間の識別番号

ただし、dav:信号待ちによる車両1台当たりの遅れ時間(平均値)(秒)
Ttt:信号待ち区間の平均旅行時間(秒)
Li :区間iの長さ(m)
Ve :想定速度(例えば規制速度)(km/時)
I :信号待ち区間内の区間総数
i :下流側から順に割り当てられた区間の識別番号
この場合、同じ現示で処理される複数の車線のうち、捌け残りの度合いが大きい車線の遅れ時間が算出される。このため、実際の交通状況に即した交差点の交通指標を正確に算出することができ、信号制御パラメータの算出精度を向上することができる。
以下、図面を参照して、本発明の実施形態の詳細を説明する。なお、以下に記載する実施形態の少なくとも一部を任意に組み合わせてもよい。
本実施形態の詳細を説明するに当たり、まず、本明細書で用いる用語の定義を行う。
「車両」:道路を通行する車両全般のことをいう。従って、自動車、軽車両及びトロリーバスのほか、自動二輪車も車両に該当する。
本実施形態では、単に「車両」というときは、プローブ情報を送信可能な車載装置を有するプローブ車両と、その車載装置を有しない通常の車両の双方を含む。
「サイクル長」:交通信号機の青(又は赤)開始時刻から次の青(又は赤)開始時刻までの1サイクルの時間のことをいう。なお、日本では、緑色の信号灯色を青と呼ぶことが法令で定められている。
「スプリット」:各現示に割り当てられる時間の長さのサイクル長に対する割合のことをいう。一般に、百分率あるいは割合で表す。厳密には、有効青時間をサイクル長で割った値である。
「オフセット」:系統制御又は地域制御において、信号表示のある時点、例えば、主道路青信号の開始時点の当該信号機群に共通な基準時点からのずれ、或いは、隣接交差点間の同一表示開始点のずれのことをいう。前者を絶対オフセット、後者を相対オフセットといい、時間(秒)又は周期の百分率で表す。
「赤時間」:交差点において車両に通行権がない時間帯のことをいう。赤時間の開始時点は、最も早い場合で青灯器の消灯時点、最も遅い場合で黄灯器の消灯時点に設定すればよい。矢印灯器のある交差点の場合は、右折矢印の終了時点であってもよい。
このため、Rが含まれる算出式(例えば、後述の式(10)及び式(11)など)については、Rの代わりに(C-G)を用いてもよい。すなわち、本実施形態の赤時間Rは、サイクル長Cと青時間Gから間接的に算出した値であってもよい。
「リンク」:交差点などのノード間を繋ぐ、上り又は下りの方向を有する道路区間のことをいう。ある交差点から見て、当該交差点に向かって流入する方向のリンクのことを流入リンクといい、ある交差点から見て、当該交差点から流出する方向のリンクのことを流出リンクという。
「リンク旅行時間」:旅行時間の算出単位の道路区間が「リンク」である場合の旅行時間、すなわち、車両が1つのリンクの始端から終端までを通行するのに必要な旅行時間のことをいう。
単位時間当たりの負荷交通量(交通流率)の飽和交通流率に対する比率を、負荷率という。過飽和状態による捌け残り台数が少ないときには、負荷率は需要率と等価である。
「交通需要」:ある交差点又は流入路ごと、或いは交通の方路別を対象として、一定時間内に流入路の停止線へ到着する交通量又は交通流率を交通需要という。
例えば、15分間の交通量が90台の場合、この15分間の交通流率は360(台/時間)又は6(台/分)となる。交通流率は、対象としたある期間に通過した車両の平均車頭時間の逆数である。
逆に、交通需要が交通容量以下の状態で、青表示終了時には信号待ち行列が解消する状態を「非飽和状態」という。過飽和ではないが、需要率が高い状態(例えば0.85以上の状態)を近飽和という。なお、需要率は1未満である。
直進車線の他に右折専用車線又は左折専用車線がある場合など、交通流の動線が異なると飽和交通流率の値は異なる。飽和交通流率の値は、車線幅員や大型車混入率など道路又は交通条件によっても異なる。
「面制御」:面的に広がる道路網に設置された多数の信号機を一括して制御する方式である。路線系統制御を面的に拡大したものである。
このうち、定周期制御は、時間帯に応じて予め信号制御パラメータが設定される方式である。時間帯や曜日(平日、土曜日、日曜日及び祝日)などに応じて予め設定された信号制御パラメータの組み合せ(プログラムと呼ぶ。)の中から1つを選んで実施される。
交通感応制御では、短時間の交通需要の変化に対応して青表示の開始や終了時点を決定し、その結果、青時間長及びサイクル長を変化させる。
交通順応制御は、交通流の変動に対応した高度な系統制御が可能であるため、交通量やその時間変動が大きく、高い交通処理効率が要求される道路に適用される。
プログラム形成制御は、有限個の信号制御パラメータの組み合せを用意せず、車両感知器の情報などに基づいて、即時に信号制御パラメータ又は信号灯色の切り替えタイミングを決定する方式である。
MODERATOは、交差点の流入路ごとの負荷率(=(流入交通量+待ち行列台数)/飽和交通流率)から信号制御パラメータを自動生成するシステムである。
SCOOTは、道路に設置した車両感知器からのデータを使用して、現時点の交通状況にほぼリアルタイムに適応するように、交通信号機の信号灯色を自動的に調整するシステムである。
SCATSは、道路に設置したループ検出器などから得られたデータに応答して、ライブラリから自動計画を選択することにより、現状のトラフィックに最良の信号制御パラメータ(サイクル長、スプリット及びオフセット)を見いだすシステムである。
図1は、本実施形態に係る交通信号制御システム1の全体構成図である。
図2は、交通信号制御システム1に含まれる情報処理装置2、プローブ車両3の車載装置4、及び中央装置5のブロック図である。
図1及び図2に示すように、交通信号制御システム1は、データセンタなどに設置された情報処理装置2、プローブ車両3に搭載された車載装置4、交通管制センターに設置された中央装置5、及び、各交差点に設置された交通信号制御機6などを備える。
情報処理装置2のサーバの運用形式は、オンプレミスサーバ及びクラウドサーバのいずれであってもよい。
従って、車載装置4は、情報処理装置2宛てのアップリンク情報S1を無線基地局7に無線送信することができる。また、情報処理装置2は、特定の車載装置4宛てのダウンリンク情報S2を公衆通信網8に送信することができる。
図2に示すように、情報処理装置2は、ワークステーションよりなるサーバコンピュータ10と、サーバコンピュータ10に繋がる各種のデータベース21~24とを備える。サーバコンピュータ10は、情報処理部11、記憶部12及び通信部13を備える。
記憶部12は、HDD(Hard Disk Drive)及びSSD(Solid State Drive)のうちの少なくとも1つの不揮発性メモリ(記録媒体)と、ランダムアクセスメモリ等よりなる揮発性メモリ(記録媒体)とを含む記憶装置である。不揮発性メモリは、リムーバブルであってもよい。
情報処理装置2のコンピュータプログラム14には、プローブ車両3の信号待ちによる遅れ時間の算出、及び遅れ時間に基づく負荷率の算出など、所定の交通指標の算出処理を処理部11のCPUに実行させるプログラムなどが含まれる。
通信部13は、無線基地局7が自装置に送信したアップリンク情報S1を受信可能であり、自装置で生成されたダウンリンク情報S2を無線基地局7に送信可能である。アップリンク情報S1には、車載装置4が送信元のプローブ情報が含まれる。ダウンリンク情報S2には、処理部11が算出したリンク旅行時間などが含まれる。
なお、通信部13は、公衆通信網8ではなく、専用の通信回線9を介して交通管制センターの中央装置5と接続されていてもよい。
データベース21~24には、地図データベース21、プローブデータベース22、会員データベース23、及び信号情報データベース24が含まれる。
「交差点データ」は、国内の交差点に付与された交差点IDと、交差点の位置情報とを対応付けたデータである。「リンクデータ」は、国内の道路に対応して付与された特定リンクのリンクIDに対して、次の情報1)~4)を対応付けたデータよりなる。
情報2)特定リンクの始点に接続するリンクID
情報3)特定リンクの終点に接続するリンクID
情報4)特定リンクのリンクコスト
具体的には、道路地図データ25は、交差点ごとにノードnが設定され、各ノードn間が逆向きの一対の有向リンクlで繋がった有向グラフよりなる。従って、一方通行の道路の場合は、一方向の有向リンクlのみノードnが接続される。
蓄積されるプローブ情報には、少なくとも車両位置とその通過時刻が含まれる。プローブ情報には、車両速度、車両方位、車両の状態情報(停止/走行イベント)などの車両データが含まれていてもよい。プローブ情報のセンシング周期は、プローブ車両3の走行履歴を正確に特定可能な粒度であり、例えば0.5~1.0秒である。
信号情報データベース24には、各交差点の流入路のサイクル長及び赤時間長を含む信号情報が、交差点ID及びリンクIDごとに蓄積される。
第1制御機6A:中央装置5による遠隔制御(系統制御及び面制御など)の対象ではなく、単独で信号灯色を決定する地点制御(定周期制御など)を行う交通信号制御機
第2制御機6B:中央装置5による遠隔制御(系統制御及び面制御など)の対象である交通信号制御機
中央装置5は、第2制御機6Bの信号情報については、所定の制御周期(例えば1.0~2.5分)ごとに情報処理装置2に送信する。処理部11は、信号情報データベース24に含まれる第2制御機6Bの信号情報を、受信した信号情報に更新する。
図2に示すように、車載装置4は、処理部31、記憶部32及び通信部33などを備えるコンピュータ装置よりなる。
処理部31は、記憶部32の不揮発性メモリに格納されたコンピュータプログラム34を読み出し、当該プログラム34に従って各種の情報処理を行うCPUを含む演算処理装置よりなる。
車載装置4のコンピュータプログラム34には、プローブ情報のセンシング及び生成、プローブ車両3の経路探索処理、ナビゲーション装置のディスプレイに探索結果を表示するための画像処理などを処理部31のCPUに実行させるプログラムなどが含まれる。
通信部33は、例えばGPS(Global Positioning System )受信機を有する。処理部31は、通信部33が受信するGPSの位置情報に基づいて、自車両の現在位置をほぼリアルタイムにモニタリングしている。測位は、GPSのような全地球航法衛星システムを利用するのが好ましいが、他の方法であってもよい。
記憶部32に所定の記録時間(例えば1分)の分だけ車両データが蓄積されると、通信部33は、蓄積された車両データと自車両の識別情報を含むプローブ情報を生成し、生成したプローブ情報を情報処理装置2宛てにアップリンク送信する。
図2に示すように、中央装置5は、交通管制エリアに含まれる複数の交差点の交通信号制御機6を統括的に制御するサーバコンピュータよりなる。中央装置5は、処理部51、記憶部52及び通信部53などを備える。
処理部51は、記憶部52の不揮発性メモリに格納されたコンピュータプログラム54を読み出し、当該プログラム54に従って各種の情報処理を行うCPUを含む演算処理装置よりなる。
中央装置5のコンピュータプログラム54には、MODERATO、SCOOT及びSCATSのうちの少なくとも1つの遠隔制御(交通順応制御)を行うためのプログラムが含まれる。
信号制御指令は、新たに生成した信号制御パラメータに対応する信号灯器の灯色切り替えタイミングに関する情報であり、遠隔制御の制御周期(例えば1.0~2.5分)ごとに生成される。
通信部53は、第1及び第2制御機6A,6Bで運用中のサイクル長及び赤時間長を含む信号情報を、情報処理装置2に送信する。第2制御機6Bの信号情報については、遠隔制御の制御周期(例えば1.0~2.5分)ごとに情報処理装置2に送信される。
図3は、比較例に係る遠隔制御(交通順応制御)の概要を示すフローチャートである。
図3に示すように、比較例に係る遠隔制御には、「交通流の計測」(ステップS1)、「交通指標の算出」(ステップS2)、「信号制御パラメータの算出」(ステップS3)、及び「信号制御パラメータの反映」(ステップS4)が含まれる。
交通流の計測(ステップS1)は、対象交差点の流入路ごとの交通流を計測する処理である。従来の交通流の計測は、車両感知器の感知信号(パルス信号など)に基づいて実測データを算出する処理である。実測データには、交通量Vin、待ち行列台数Qin及び飽和交通流率Sfの実測値が含まれる。なお、Sfは道路構造に基づく設定値でもよい。
MODERATOで用いる交通指標は、負荷率Lrである。負荷率Lrは、1サイクル中に処理できる最大交通量に対する交通需要の比である。SCOOT及びSCATSで用いる交通指標は、現示飽和度Dsである。現示飽和度Dsは、青時間中に処理できる最大交通量に対する到着交通量の比である。
Lr=(Vin+k×Qin)/Sf ……(1)
Ds=Vin×C/(Sf×G) ……(2)
ただし、Vin:交差点への流入交通量(台/秒)
k :重み係数(例えば1.0を用いる)
Qin:待ち行列台数の交通量換算値(台/秒)
Sf :飽和交通流率(台/秒)
G :有効青時間(秒)
C :サイクル長(秒)
中央装置5の処理部51は、ステップS1で得られたVin,Qin,Sfの実測値を式(1)又は(2)に代入し、負荷率Lr及び現示飽和度Dsのうちの少なくとも1つの交通指標を算出する。
ここでは、中央装置5がMODERATOを採用し、2つの現示のみを含む十字路交差点のスプリット及びサイクル長を算出する場合を想定する。また、現示の番号を「i」(i=1,2)で表し、各現示iの流入路の方向を「j」(j=1,2)で表す。
Lij=(Vij+Qij)/Sij ……(3)
Lri=maxj(Lij) ……(4)
Lrt=Lr1+Lr2 ……(5)
λi=Lri/Lrt ……(6)
C=(a1×K+a2)/(1-a3×Lrt) ……(7)
具体的には、中央装置5の処理部51は、新たな信号制御パラメータから灯色切り替えタイミングを含む信号制御指令を算出し、算出した信号制御指令を第2制御機6Bに送信する。なお、信号制御パラメータから灯色切り替えタイミングを演算可能な第2制御機6Bの場合には、信号制御パラメータをそのまま第2制御機6Bに送信してもよい。
従って、比較例に係る遠隔制御では、制御対象が、車両感知器が設置された交差点の交通信号制御機6に限られるという問題点がある。また、MODERATOの負荷率や、SCOOT及びSCATSの現示飽和度を用いる限り、遠隔制御には車両感知器が必要であるとの固定観念があった。
従って、式(1)及び(2)に入力する交通量Vin及び待ち行列台数Qinを、飽和交通流率Sfに対する比率を表す変数として定義すれば、Vin,Qin及びSfの真値が不明であっても、負荷率Lr及び現示飽和度Dsを算出可能となる。
Sfで正規化した交通量Vin(=α×Sf)と、Sfで正規化した待ち行列台数Qin(=β×Sf)を採用すれば、Vin,Qin及びSfのそのものの値を決定しなくても、負荷率Lr及び現示飽和度Dsを算出できる。
=(α×Sf+k×β×Sf)/Sf
=α+k×β ……(8)
Ds=Vin×C/(Sf×G)
=α×Sf×C/(Sf×G)
=α×C/G ……(9)
一方、後述の通り、プローブ情報の算出結果を用いれば、上述のαやβを定めることができるので、車両感知器がなくても負荷率Lr及び現示飽和度Dsから信号制御パラメータを算出することができる。
このように、プローブ情報等から求まる正規化データを用いて、信号制御パラメータの算出に用いる交通指標を算出すれば、車両感知器が未設置であっても遠隔制御を実行可能となる。以下、図4を参照して、本実施形態の遠隔制御の概要を説明する。
図4は、本実施形態の遠隔制御(交通順応制御)の概要を示すフローチャートである。
図4に示すように、本実施形態の遠隔制御には、「交通流の計測」(ステップS11)、「交通指標の算出」(ステップS12)、「信号制御パラメータの算出」(ステップS13)、及び「信号制御パラメータの反映」(ステップS14)が含まれる。
中央装置5の処理部51は、ステップS13~S14の各処理を、同じ制御周期(例えば1.0~2.5分)ごとに繰り返し実行する。
正規化データには、Sfに対する比率を表す正規化交通量Vin(=α×Sf)と、Sfに対する比率を表す正規化待ち行列台数Qin(=β×Sf)が含まれる。
負荷率Lrの計算式は、前述の式(1)の通りである。現示飽和度Dsの計算式は、前述の式(2)の通りである。
この場合、前述の式(8)及び(9)から明らかな通り、右辺の分子/分母でSfが相殺されるので、Vin,Qin及びSfの値そのものが不明であっても、負荷率Lr及び現示飽和度Dsを算出可能となる。
中央装置5の処理部51は、情報処理装置2から負荷率Lr又は現示飽和度Dsの算出結果を受信すると、受信した算出結果を用いてステップS13,S14の算出処理を実行する。
信号制御パラメータの反映(ステップS14)は、ステップS13で算出した信号制御パラメータを対象交差点の第2制御機6Bに実行させる処理である。ステップ14の処理内容は、図3のステップS4と同様である。
図5は、遠隔制御の対象交差点が単独交差点である場合の、正規化データの算出方法の一例を示す説明図である。図5に含まれる変数等の意味は、次の通りである。
なお、「単独交差点」とは、遠隔制御の対象交差点であって、他の交差点とは独立して単独で制御対象とされる交差点のことである。
L :交差点間のリンク長(m)
Tt :プローブ車両の平均旅行時間(=J1,J2間のリンク旅行時間)(秒)
Ve :想定速度(例えば規制速度)(km/時)
J1 :対象交差点の上流側の交差点
J2 :遠隔制御の対象交差点(単独交差点)
Vin={1-R2/(2×dav×C)}×Sf ……(10)
If R/2<dav (過飽和の場合)
Vin=(1-R/C)×Sf
Qin={(dav-R/2)/R}×(1-R/C)×Sf ……(11)
以下、図5~図7を参照しつつ、式(10)及び式(11)の成立根拠を説明する。
図5下段のグラフは、複数の車両が交差点J1,J2間のリンクを通行した場合の走行軌跡を表すグラフである。グラフの横軸は交差点J1からの距離であり、グラフの縦軸は旅行時間である。
複数のプローブ車両3の平均旅行時間Ttには、上記の車両1台当たりの遅れ時間davが含まれると見なすことができる。
dav=Tt-{L/(Ve/3.6)} ……(12)
そして、処理部11は、抽出した複数のプローブ情報の位置及び時刻(速度を用いてもよい。)に基づいて、プローブ車両3によるリンクの平均旅行時間Ttを算出し、算出したTtを式(12)に代入して遅れ時間davを求める。
図6は、非飽和時における交差点J2の交通状況と、Sfで正規化された交通量Vinの導出に必要な関係式を示す説明図である。
図6の例では、交差点J2手前の停止車両は、停止線の直前の同じ位置に重なって停止すると仮定する(垂直車列イメージ)。また、図6において、「D」は1サイクル中の総遅れ時間(秒)、「Gc」は、青開始時点を原点とする時刻(秒)であり、最後尾車両が交差点J2の停止線を通過する時刻を表す。
Gc=Vin×R/(Sf-Vin) ……(13)
D=0.5×{(R+Gc)×R×Vin} ……(14)
dav=D/(C×Vin)=0.5×{(R+Gc)×R}/C ……(15)
式(13)のGcを式(15)に代入してVinについて解けば、交差点J2が非飽和である場合の、正規化交通量Vinの算出式は、前述の式(10)となる。
図7は、過飽和時における交差点J2の交通状況の一例を示す説明図である。
図7に示すように、信号2回待ち以上の車両が含まれる過飽和状態を表すモデルとして、走行と停止のみの単純なモデルを想定する。この場合、2回目以降の信号待ち停止において、1回当たりの停止時間は赤時間Rと等しくなる。
図7のパターン2は、次回のサイクルで待ち行列が捌けた場合(1サイクル待ち)の交通状況を示し、図7のパターン3は、次々回のサイクルで待ち行列が捌けた場合(2サイクル待ち)の交通状況を示す。
パターン2では、dav=1.5R、Qin=(1-R/C)×Sfとなる。
パターン3では、dav=2.5R、Qin=2×(1-R/C)×Sfとなる。
従って、交差点J2が過飽和である場合の、正規化交通量Vin及び正規化待ち行列Qinの算出式は、前述の式(11)となる。
図8は、信号待ちによる車両1台当たりの遅れ時間davの精度に影響する停止イベントの一例を示す説明図である。
図8に示すように、プローブ車両3が交差点J1から交差点J2までのリンクを通行する際に発生し得る停止イベントとしては、交差点J2における信号待ちの他に、例えば、次のイベントE1,E2が考えられる。
イベントE1:バス停留所に停車したバス3Xの後続車両となったことによる停止
イベントE2:駐車場に出入りする他車両3Yの後続車両となったことによる停止
このため、プローブ車両3に上記のイベントE1,E2が発生していた場合には、平均旅行時間Ttに当該イベントE1,E2の停止時間が含まれることになり、式(12)に基づく遅れ時間davが実際よりも過大となる。
従って、負荷率Lr及び現示飽和度Dsから算出される信号制御パラメータの精度が低下する可能性がある。
本実施形態では、上記の問題点を解決すべく、信号待ち以外のイベントE1,E2の停止時間が含まれ得る「リンクの平均旅行時間Tt」ではなく、交差点J2の流入路における「信号待ち区間の平均旅行時間Ttt」を算出するとともに(式(16)参照)、当該平均旅行時間Tttを用いて、交差点J2の流入路における信号待ちによる車両1台当たりの遅れ時間davを算出する(式(17)参照)。
このため、上記の算出方法を採用すれば、イベントE1,E2などの信号待ち以外の停止イベントの有無に関係なく、交差点J2に流入する流入路における信号待ちによる車両1台当たりの遅れ時間davを正確に算出することができる。
区間iは、交差点J1,J2間のリンクを所定の分割数Nで分割する場合の複数の小区間よりなる。区間iの長さ(以下、「区間長」ともいう。)Liは、交差点J1,J2間のリンク長Lに比べて、十分に短い値となるように決定される算出値又は設定値である。
処理a1:リンク長Lを分割数Nで除した値(=L/N)を区間長Liとする。
処理a2:リンクの下流側から上流側に向かって順に、区間iの識別番号(i=1,2……N)を割り当てる。具体的には、最も下流側の識別番号を「1」とし、上流側に向かって識別番号をインクリメントし、最後の識別番号を「N」とする。
処理b1:リンク長Lを所定の距離Loで除した商Mに1を加えた値(=M+1)を、リンクの分割数Nとし、余りの距離値を最後の区間Nの区間長LNとする。
処理b2:リンクの下流側から上流側に向かって順に、区間iの識別番号(i=1,2……N)を割り当てる。具体的には、処理b2は処理a2と同様である。
また、リンクに含まれる各区間i(i=1,2……N)の区間長Liは、すべて一定の距離でなくてもよく、リンクの下流側部分は短くしかつ上流側部分は長くするなど、1つのリンクに含まれる区間長Liを変化させてもよい。
このようにすれば、車両感知器により車両の平均速度を計測する場合に比べて、車両の平均速度の計測粒度が細かくなる。従って、区間総数Iに応じて定まる信号待ち区間をより細かく算出でき、遅れ時間davの算出精度を向上することができる。
図10は、情報処理装置2の処理部11が実行する、信号待ちによる車両1台当たりの遅れ時間davの算出処理の一例を示すフローチャートである。
図10に示すように、情報処理装置2の処理部11は、まず、遅れ時間davの算出に必要なデータの収集処理として、プローブデータベース22に含まれるプローブ情報の位置及び時刻から、今回の制御周期(例えば1.0~2.5分)に交差点J1,J2間のリンクを通過した複数のプローブ車両3のプローブ情報を抽出する(ステップST10)。
具体的には、処理部11は、リンクを通過した各プローブ車両3について、プローブ情報に含まれる位置及び時刻(速度を用いてもよい。)に基づいて、区間iの通行速度を算出する。次に、処理部11は、各プローブ車両3についての区間iの通行速度の合計値をプローブ車両3の台数で除した値を、区間iの平均速度Viとする。
区間総数Iは、制御対象の交差点J2の流入路における、信号待ち区間の最上流に位置する区間iの識別番号に相当する。なお、区間総数Iの算出処理(図11参照)の詳細については、後述する。
式(16)に示す通り、信号待ち区間の平均旅行時間Tttは、区間1から区間総数Iまでの区間iについて、各区間iのプローブ車両3の平均旅行時間(=Li/(Vi/3.6))を合計した時間である。

式(17)に示す通り、信号待ち区間の遅れ時間davは、信号待ち区間の平均旅行時間Tttから、信号待ちなしで信号待ち区間(区間1から区間I)を想定速度Veで走行した場合の旅行時間(=Σ(Li/(Ve/3.6))を減算した時間である。

図11は、情報処理装置2の処理部11が実行する、信号待ち区間内の区間総数Iの算出処理の一例を示すフローチャートである。
図11において、「ML」は、区間速度Viが速度閾値TSを超える区間長を表す変数である。「TS」は速度閾値であり、「TL」は距離閾値である。
距離閾値TLは、速度閾値TSを超える平均速度で走行する車両が、停止する意図がなく走行を継続する場合の航続距離の推定値である。距離閾値TSは、速度閾値TSの多寡などに応じて決定される設定値であり、ここではTL=100mであるとする。
ステップST21の判定結果が肯定的である場合(判定中の区間iの区間速度Viが速度閾値TS以下の場合)は、処理部11は、I=iに設定してから(ステップST22)、区間iをインクリメントする(ステップST23)。
ステップST24の判定結果が肯定的である場合は、処理部11は、処理を終了する。
ステップST24の判定結果が否定的である場合は、処理部11は、処理をステップST21の前に戻す。
ステップST21~ST24を含むループにより、区間速度Viが速度閾値TS以下である速度条件を満たす区間iが流入路の下流側から順に探索され、速度条件を満たす区間を、信号待ち区間に含まれる区間iとしてカウントする探索処理が実行される。
従って、Vi+1>TSの場合には、変数MLの値はリセットされずに維持され、処理がステップST23の前に戻される。
ステップST26の判定結果が肯定的である場合(変数MLが距離閾値TL以上の場合)は、処理部11は、Vi≦TSを満たす最後の区間iの番号値を信号待ち区間内の区間総数Iと決定し(ステップST28)、処理を終了する。
図12は、区間総数Iの実際の算出例を示す説明図である。
図12において、「u1」から「u5」の数値は、複数のプローブ車両3のプローブ情報から求めた区間速度Viの実測値であり、それぞれ以下の数値であるとする。また、リンクの分割数Nは15であり、各区間iの区間長Liはすべて50mであり、TSは25km/時であり、TLは100mであるとする。
u2=時速15km以下の数値
u3=時速20km以下の数値
u4=時速25km以下の数値
u5=時速25kmを超える数値
区間速度V5(=u5)は速度閾値TSを超えるので(図11のステップST21でNo)、図11のステップST21~ST24のループを抜け、変数ML=L5となる(図11のステップST25)。
区間速度V8(=u5)は速度閾値TSを超えるので(図11のステップST21でNo)、図11のステップST21~ST24のループを抜け、変数ML=L8となる(図11のステップST25)。
この場合、最後の区間i(=7)の最上流端が信号待ち区間の末尾と見なさる。これより、区間7よりも上流側の区間8~15の速度Vi及び区間長Liは、平均旅行時間Tttを算出するためのデータから除外される。
図13及び図14は、交差点J1,J2間のリンクが複数車線である場合の遅れ時間davの算出方法の一例を示す説明図である。
図13及び図14に示すように、交差点J1から交差点J2に至る流入路には、複数の車線R1~R3が含まれており、車線R1が左折及び直進用の車線、車線R2が直進用の車線、及び車線R3が右折専用の車線であるとする。
この場合、図13に示すように、同じ現示φ1で処理される車線R1,R2が複数存在する場合には、情報処理装置2の処理部11は、複数の車線R1,R2ごとに区間総数Iの算出処理(図11)を実行し、算出した区間総数Iのうちの最大の区間総数Iに基づいて、交差点J2の流入路の遅れ時間davを算出する。
また、処理部11は、算出した車線R2の遅れ時間davを式(10)又は式(11)に適用して正規化交通量Vin及び正規化待ち行列台数Qinを算出し、これらの交通指標に基づいて負荷率Lr又は現示飽和度Dsを算出する。
従って、実際の交通状況に即した交差点J2の交通指標(Vin及びQin)を正確に算出することができ、信号制御パラメータの算出精度を向上することができる。
また、処理部11は、算出した車線R3の遅れ時間davを式(10)又は式(11)に適用して正規化交通量Vin及び正規化待ち行列台数Qinを算出し、これらの交通指標に基づいて負荷率Lr又は現示飽和度Dsを算出する。
上述の実施形態(変形例を含む。)は、すべての点で例示であって制限的なものではない。本発明の権利範囲は、請求の範囲に記載された構成と均等の範囲内でのすべての変更が含まれる。
また、中央装置5がプローブ情報の収集及び解析を実行可能である場合は、交通流の計測から信号制御パラメータの反映までのすべての処理(図4のステップS11~S14)を中央装置5が行うことにしてもよい。
2 情報処理装置(遅れ時間の算出装置)
3 プローブ車両
3X バス
3Y 他車両
4 車載装置
5 中央装置(遅れ時間の算出装置)
6 交通信号制御機
6A 第1制御機
6B 第2制御機
7 無線基地局
8 公衆通信網
9 通信回線
10 サーバコンピュータ
11 情報処理部
12 記憶部
13 通信部(取得部)
14 コンピュータプログラム
21 地図データベース
22 プローブデータベース
23 会員データベース
24 信号情報データベース
25 道路地図データ
31 処理部
32 記憶部
33 通信部
34 コンピュータプログラム
51 処理部
52 記憶部
53 通信部
54 コンピュータプログラム
Claims (10)
- 交差点への流入路を通行するプローブ車両のプローブ情報を取得する取得部と、
前記プローブ情報を元データとして、前記流入路における信号待ちによる車両1台当たりの遅れ時間の算出処理を実行する情報処理部と、を備え、
前記算出処理には、
前記プローブ情報に基づいて、前記流入路を分割してなる複数の区間ごとの車両の平均速度である複数の区間速度を算出する第1処理と、
前記複数の区間速度に基づいて、前記流入路における信号待ち区間に含まれる前記区間の総数である区間総数を算出する第2処理と、
前記区間総数に基づいて、前記信号待ち区間の平均旅行時間を算出する第3処理と、
前記区間総数と前記信号待ち区間の平均旅行時間に基づいて、前記遅れ時間を算出する第4処理と、が含まれる遅れ時間の算出装置。 - 前記第2処理には、
区間速度が速度閾値以下である速度条件を満たす区間を前記流入路の下流側から順に探索し、前記速度条件を満たす区間を、前記信号待ち区間に含まれる区間としてカウントする探索処理が含まれる請求項1に記載の遅れ時間の算出装置。 - 前記第2処理には、
前記速度条件を満たさない1又は複数の区間のそれぞれの区間長を加算した長さが距離閾値未満である場合に、前記探索処理を継続する処理が含まれる請求項2に記載の遅れ時間の算出装置。 - 前記第2処理には、
前記速度条件を満たさない1又は複数の区間のそれぞれの区間長を加算した長さが距離閾値以上である場合に、前記速度条件を満たす最も上流側の区間のカウント値を、前記区間総数とする処理が含まれる請求項2又は請求項3に記載の遅れ時間の算出装置。 - 前記複数の区間のそれぞれの区間長は、
車両速度を計測するための車両感知器の設置間隔よりも小さい値である請求項3又は請求項4に記載の遅れ時間の算出装置。 - 前記第3処理は、
次の式(16)により前記信号待ち区間の平均旅行時間を算出する処理である請求項1から請求項5のいずれか1項に記載の遅れ時間の算出装置。

ただし、Ttt:信号待ち区間の平均旅行時間(秒)
Li :区間iの長さ(m)
Vi :区間iの平均速度(km/時)
I :信号待ち区間内の区間総数
i :下流側から順に割り当てられた区間の識別番号 - 前記第4処理は、
次の式(17)により前記遅れ時間を算出する処理である請求項1から請求項6のいずれか1項に記載の遅れ時間の算出装置。

ただし、dav:信号待ちによる車両1台当たりの遅れ時間(平均値)(秒)
Ttt:信号待ち区間の平均旅行時間(秒)
Li :区間iの長さ(m)
Ve :想定速度(例えば規制速度)(km/時)
I :信号待ち区間内の区間総数
i :下流側から順に割り当てられた区間の識別番号 - 前記流入路は、
同じ現示で複数の車線の通行権が定義される流入路であり、
前記情報処理部は、
前記複数の車線ごとに前記第2処理を実行し、前記第2処理により算出される複数の区間総数のうちの最大の区間総数に基づいて、前記第3処理及び前記第4処理を実行する請求項1から請求項7のいずれか1項に記載の遅れ時間の算出装置。 - 交差点への流入路を通行するプローブ車両のプローブ情報を取得するステップと、
前記プローブ情報を元データとして、前記流入路における信号待ちによる車両1台当たりの遅れ時間の算出処理を実行するステップと、を含み、
前記算出処理には、
前記プローブ情報に基づいて、前記流入路を分割してなる複数の区間ごとの車両の平均速度である複数の区間速度を算出する第1処理と、
前記複数の区間速度に基づいて、前記流入路における信号待ち区間に含まれる前記区間の総数である区間総数を算出する第2処理と、
前記区間総数に基づいて、前記信号待ち区間の平均旅行時間を算出する第3処理と、
前記区間総数と前記信号待ち区間の平均旅行時間に基づいて、前記遅れ時間を算出する第4処理と、が含まれる遅れ時間の算出方法。 - 交差点への流入路を通行するプローブ車両のプローブ情報を取得する取得部、及び、
前記プローブ情報を元データとして、前記流入路における信号待ちによる車両1台当たりの遅れ時間の算出処理を実行する情報処理部、としてコンピュータを機能させるためのコンピュータプログラムであって、
前記算出処理には、
前記プローブ情報に基づいて、前記流入路を分割してなる複数の区間ごとの車両の平均速度である複数の区間速度を算出する第1処理と、
前記複数の区間速度に基づいて、前記流入路における信号待ち区間に含まれる前記区間の総数である区間総数を算出する第2処理と、
前記区間総数に基づいて、前記信号待ち区間の平均旅行時間を算出する第3処理と、
前記区間総数と前記信号待ち区間の平均旅行時間に基づいて、前記遅れ時間を算出する第4処理と、が含まれるコンピュータプログラム。
Priority Applications (4)
| Application Number | Priority Date | Filing Date | Title |
|---|---|---|---|
| JP2022556405A JP7563469B2 (ja) | 2020-10-19 | 2021-07-06 | 遅れ時間の算出装置、算出方法、及びコンピュータプログラム |
| US18/023,951 US12236782B2 (en) | 2020-10-19 | 2021-07-06 | Apparatus, method, and computer program for calculating delay time |
| JP2024134091A JP2024152856A (ja) | 2020-10-19 | 2024-08-09 | 遅れ時間の算出装置、算出方法、及びコンピュータプログラム |
| US19/029,449 US20250166503A1 (en) | 2020-10-19 | 2025-01-17 | Apparatus, method, and computer program for calculating delay time |
Applications Claiming Priority (2)
| Application Number | Priority Date | Filing Date | Title |
|---|---|---|---|
| JP2020-175372 | 2020-10-19 | ||
| JP2020175372 | 2020-10-19 |
Related Child Applications (2)
| Application Number | Title | Priority Date | Filing Date |
|---|---|---|---|
| US18/023,951 A-371-Of-International US12236782B2 (en) | 2020-10-19 | 2021-07-06 | Apparatus, method, and computer program for calculating delay time |
| US19/029,449 Continuation US20250166503A1 (en) | 2020-10-19 | 2025-01-17 | Apparatus, method, and computer program for calculating delay time |
Publications (1)
| Publication Number | Publication Date |
|---|---|
| WO2022085249A1 true WO2022085249A1 (ja) | 2022-04-28 |
Family
ID=81290386
Family Applications (1)
| Application Number | Title | Priority Date | Filing Date |
|---|---|---|---|
| PCT/JP2021/025485 Ceased WO2022085249A1 (ja) | 2020-10-19 | 2021-07-06 | 遅れ時間の算出装置、算出方法、及びコンピュータプログラム |
Country Status (3)
| Country | Link |
|---|---|
| US (2) | US12236782B2 (ja) |
| JP (2) | JP7563469B2 (ja) |
| WO (1) | WO2022085249A1 (ja) |
Cited By (2)
| Publication number | Priority date | Publication date | Assignee | Title |
|---|---|---|---|---|
| CN119723896A (zh) * | 2025-02-28 | 2025-03-28 | 武汉市规划研究院(武汉市交通发展战略研究院) | 一种公交车站干扰下的路段通行能力计算方法及系统 |
| WO2026034400A1 (ja) * | 2024-08-06 | 2026-02-12 | 住友電気工業株式会社 | 遅れ時間の算出装置、算出方法、及びコンピュータプログラム |
Families Citing this family (3)
| Publication number | Priority date | Publication date | Assignee | Title |
|---|---|---|---|---|
| WO2023188666A1 (ja) * | 2022-03-28 | 2023-10-05 | 住友電気工業株式会社 | 情報処理装置、制御端末、情報処理方法、及びコンピュータプログラム |
| CN116390110B (zh) * | 2023-04-26 | 2025-07-15 | 中国通信建设第四工程局有限公司 | 一种5g天馈线系统的优化方法、系统及存储介质 |
| JP7838515B2 (ja) * | 2023-05-09 | 2026-04-01 | トヨタ自動車株式会社 | 情報処理装置 |
Citations (3)
| Publication number | Priority date | Publication date | Assignee | Title |
|---|---|---|---|---|
| JP2009140292A (ja) * | 2007-12-07 | 2009-06-25 | Sumitomo Electric Ind Ltd | 交通情報算出装置、交通情報算出プログラム及び交通情報算出方法 |
| JP2013167943A (ja) * | 2012-02-14 | 2013-08-29 | Sumitomo Electric System Solutions Co Ltd | 渋滞判定装置、コンピュータプログラム及び渋滞判定方法 |
| JP2013232160A (ja) * | 2012-05-01 | 2013-11-14 | Sumitomo Electric Ind Ltd | 交通情報取得装置及びコンピュータプログラム |
Family Cites Families (4)
| Publication number | Priority date | Publication date | Assignee | Title |
|---|---|---|---|---|
| JP2006031421A (ja) * | 2004-07-16 | 2006-02-02 | Matsushita Electric Ind Co Ltd | 情報収集装置及び情報収集方法 |
| JP5256924B2 (ja) * | 2008-08-11 | 2013-08-07 | 住友電気工業株式会社 | 渋滞情報生成装置、コンピュータプログラム及び渋滞情報生成方法 |
| US10559201B1 (en) * | 2018-02-27 | 2020-02-11 | Traffic Technology Services, Inc. | Using connected vehicle data to optimize traffic signal timing plans |
| CN112740292A (zh) | 2018-10-05 | 2021-04-30 | 住友电工系统解决株式会社 | 交通指标计算装置、计算方法、交通信号控制系统和计算机程序 |
-
2021
- 2021-07-06 US US18/023,951 patent/US12236782B2/en active Active
- 2021-07-06 WO PCT/JP2021/025485 patent/WO2022085249A1/ja not_active Ceased
- 2021-07-06 JP JP2022556405A patent/JP7563469B2/ja active Active
-
2024
- 2024-08-09 JP JP2024134091A patent/JP2024152856A/ja active Pending
-
2025
- 2025-01-17 US US19/029,449 patent/US20250166503A1/en active Pending
Patent Citations (3)
| Publication number | Priority date | Publication date | Assignee | Title |
|---|---|---|---|---|
| JP2009140292A (ja) * | 2007-12-07 | 2009-06-25 | Sumitomo Electric Ind Ltd | 交通情報算出装置、交通情報算出プログラム及び交通情報算出方法 |
| JP2013167943A (ja) * | 2012-02-14 | 2013-08-29 | Sumitomo Electric System Solutions Co Ltd | 渋滞判定装置、コンピュータプログラム及び渋滞判定方法 |
| JP2013232160A (ja) * | 2012-05-01 | 2013-11-14 | Sumitomo Electric Ind Ltd | 交通情報取得装置及びコンピュータプログラム |
Cited By (2)
| Publication number | Priority date | Publication date | Assignee | Title |
|---|---|---|---|---|
| WO2026034400A1 (ja) * | 2024-08-06 | 2026-02-12 | 住友電気工業株式会社 | 遅れ時間の算出装置、算出方法、及びコンピュータプログラム |
| CN119723896A (zh) * | 2025-02-28 | 2025-03-28 | 武汉市规划研究院(武汉市交通发展战略研究院) | 一种公交车站干扰下的路段通行能力计算方法及系统 |
Also Published As
| Publication number | Publication date |
|---|---|
| US12236782B2 (en) | 2025-02-25 |
| JP7563469B2 (ja) | 2024-10-08 |
| JPWO2022085249A1 (ja) | 2022-04-28 |
| JP2024152856A (ja) | 2024-10-25 |
| US20250166503A1 (en) | 2025-05-22 |
| US20230316905A1 (en) | 2023-10-05 |
Similar Documents
| Publication | Publication Date | Title |
|---|---|---|
| JP7563469B2 (ja) | 遅れ時間の算出装置、算出方法、及びコンピュータプログラム | |
| JP7276964B2 (ja) | 交通指標の算出装置、算出方法、交通信号制御システム、及びコンピュータプログラム | |
| JP7396169B2 (ja) | 待ち行列台数の算出装置及び算出方法 | |
| JP5482827B2 (ja) | 交通指標算出装置、方法及びコンピュータプログラム | |
| KR102646880B1 (ko) | 교통량 증대를 위한 신호교차로 노면조건 및 교통패턴 분석 결과에 따른 신호등 운영 시스템 | |
| JP2005259116A (ja) | 交通情報算出装置、交通情報算出方法、交通情報表示方法および交通情報表示装置 | |
| JP2013088888A (ja) | 情報処理装置、交通指標推定装置及びコンピュータプログラム | |
| JP2011039704A (ja) | プローブ情報の処理装置、コンピュータプログラム及び路車間通信システム | |
| CN104750963A (zh) | 交叉口延误时长估计方法及装置 | |
| JP4998504B2 (ja) | プローブ情報生成装置及び方法 | |
| JP5381808B2 (ja) | 交通情報処理装置とこれを用いた渋滞情報の検出方法 | |
| JP5110125B2 (ja) | 情報処理装置及びコンピュータプログラム | |
| JP5716312B2 (ja) | 情報処理装置及びコンピュータプログラム | |
| DE10018562C1 (de) | Verfahren zur Gewinnung von Verkehrsdaten für ein Verkehrsnetz mit verkehrsgeregelten Netzknoten durch Meldefahrzeuge | |
| JP5104916B2 (ja) | 情報処理装置及びコンピュータプログラム | |
| JP7838585B2 (ja) | 情報処理装置、情報処理方法、及びコンピュータプログラム | |
| JP5348104B2 (ja) | プローブ情報の処理装置、コンピュータプログラム、情報処理システム及びリンク端の通過時刻算出方法 | |
| Tišljarić et al. | Analysis of intersection queue lengths and level of service using GPS data | |
| CN116740948B (zh) | 车辆行程速度的预测估值方法、装置、介质及应用 | |
| CN120340294A (zh) | 基于群体智能的城市服务优化系统 | |
| WO2026034400A1 (ja) | 遅れ時間の算出装置、算出方法、及びコンピュータプログラム | |
| WO2023188666A1 (ja) | 情報処理装置、制御端末、情報処理方法、及びコンピュータプログラム | |
| CN100472579C (zh) | 交通信息计算装置、交通信息计算方法、交通信息显示方法及交通信息显示装置 | |
| CN115798192B (zh) | 一种基于多截面电警数据的道路排队分布估计方法 | |
| Mak et al. | Online travel time estimation in urban areas using the occupancy of long loop detectors |
Legal Events
| Date | Code | Title | Description |
|---|---|---|---|
| 121 | Ep: the epo has been informed by wipo that ep was designated in this application |
Ref document number: 21882392 Country of ref document: EP Kind code of ref document: A1 |
|
| ENP | Entry into the national phase |
Ref document number: 2022556405 Country of ref document: JP Kind code of ref document: A |
|
| NENP | Non-entry into the national phase |
Ref country code: DE |
|
| 122 | Ep: pct application non-entry in european phase |
Ref document number: 21882392 Country of ref document: EP Kind code of ref document: A1 |
|
| WWG | Wipo information: grant in national office |
Ref document number: 18023951 Country of ref document: US |