WO2022070943A1 - ガス可視化画像処理装置、ガス可視化画像処理方法、および、プログラム - Google Patents
ガス可視化画像処理装置、ガス可視化画像処理方法、および、プログラム Download PDFInfo
- Publication number
- WO2022070943A1 WO2022070943A1 PCT/JP2021/034061 JP2021034061W WO2022070943A1 WO 2022070943 A1 WO2022070943 A1 WO 2022070943A1 JP 2021034061 W JP2021034061 W JP 2021034061W WO 2022070943 A1 WO2022070943 A1 WO 2022070943A1
- Authority
- WO
- WIPO (PCT)
- Prior art keywords
- image
- gas
- gas cloud
- visible
- cloud
- Prior art date
- Legal status (The legal status is an assumption and is not a legal conclusion. Google has not performed a legal analysis and makes no representation as to the accuracy of the status listed.)
- Ceased
Links
Images









Classifications
-
- G—PHYSICS
- G01—MEASURING; TESTING
- G01M—TESTING STATIC OR DYNAMIC BALANCE OF MACHINES OR STRUCTURES; TESTING OF STRUCTURES OR APPARATUS, NOT OTHERWISE PROVIDED FOR
- G01M3/00—Investigating fluid-tightness of structures
- G01M3/02—Investigating fluid-tightness of structures by using fluid or vacuum
-
- G—PHYSICS
- G06—COMPUTING OR CALCULATING; COUNTING
- G06T—IMAGE DATA PROCESSING OR GENERATION, IN GENERAL
- G06T7/00—Image analysis
-
- G—PHYSICS
- G06—COMPUTING OR CALCULATING; COUNTING
- G06T—IMAGE DATA PROCESSING OR GENERATION, IN GENERAL
- G06T7/00—Image analysis
- G06T7/90—Determination of colour characteristics
Definitions
- the present disclosure relates to a gas visualization image processing device, a gas visualization image processing method, and a program that detect a gas leak and visualize the existence region of gas existing in the space by an image.
- Gas equipment Equipment that uses gas, such as production facilities that produce natural gas and petroleum, production plants that produce chemical products using gas, gas transmission equipment, petrochemical plants and thermal power plants, steel-related facilities, etc. (hereinafter referred to as "" (Sometimes referred to as "gas equipment”), the danger of gas leakage is recognized due to aging of the facility and operational mistakes, and a gas detection device is installed to minimize gas leakage.
- Patent Document an optical gas leak detection method for detecting a gas leak from an inspection target by taking an infrared moving image using the infrared absorption characteristic of the gas.
- Patent Document an optical gas leak detection method for detecting a gas leak from an inspection target by taking an infrared moving image using the infrared absorption characteristic of the gas.
- Patent Document 2 A synthesis method for eliminating poor visibility has been proposed (Patent Document 2).
- the present disclosure shows whether the gas cloud image and the visible image of the background are leaking from the presence or absence of gas even when the gas concentration is low or the gas presence range in the infrared image is large. It is an object of the present invention to provide a gas visualization image processing apparatus, a gas visualization image processing method, and a program that can be displayed for easy judgment.
- the gas visualization image processing apparatus includes a visible image in which a space including an inspection target is captured by a visible camera and an inspection image in which the space is captured in parallel with the visible image by an infrared camera.
- the background is an image of the inspection target superimposed on the gas cloud image
- the image synthesizing unit sets the channels of R, G, and B constituting the visible image in a predetermined color space.
- the gas cloud superimposed image may be generated by converting to the channel shown and superimposing the gas cloud image on the obtained channel showing the brightness.
- the image synthesizing unit superimposes the visible image and the gas cloud image so that the larger the superposition ratio of the gas cloud image with respect to the visible image, the lower the saturation of the gas cloud superimposing image. May be.
- the gas cloud image and the background are obtained even when the gas concentration is low or the gas presence range in the image is large. It is possible to display the visible image of the above so that it is easy to determine the presence or absence of gas and where it is leaking. This makes it easy to determine whether or not there is a gas leak and where in the gas facility the gas is leaking.
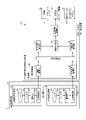
- FIG. It is a schematic block diagram of the gas visualization image processing system 1 which concerns on Embodiment 1.
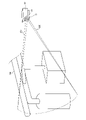
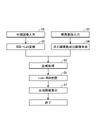
- FIG. It is a schematic diagram which shows the relationship between the inspection target 300 and the image acquisition means 20. It is a figure which shows the flow of the image processing which shows the outline of the processing in the gas visualization image processing apparatus 10 which concerns on Embodiment 1.
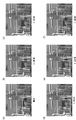
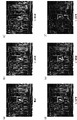
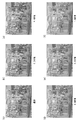
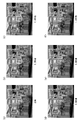
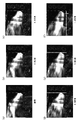
- FIG. (A) to (d) are examples of the display image by the gas visualization image processing apparatus 10, (a) is a gas frequency component image, (b) (c) (d) is a superposition ratio r of 30%. It is an example of the display image when it is set to 50% and 70%.
- (A) to (d) are examples of a display image by a negative / positive inverted image by the gas visualization image processing apparatus 10,
- (a) is a gas frequency component inverted image
- (b) (c) (d) are superposition ratios.
- This is an example of a display image when r is 30%, 50%, and 70%.
- It is a figure which shows the flow of the image processing which shows the outline of the conventional gas visualization image processing.
- (A) to (c) are examples of display images by conventional gas visualization image processing, (a) is a visible image, (b) is a gas frequency component image, and (c) is an example of a display image.
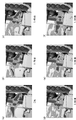
- (A) to (f) are examples of moving images of gas frequency component images by the gas visualization image processing device 10.
- (A) to (f) are display images by the gas visualization image processing apparatus 10, and gas cloud superimposition on which the gas frequency component images shown in FIGS. 8 (a) to 8 (f) are superimposed on the visible images, respectively.
- (A) to (f) are display images by the conventional gas visualization image processing device based on the same image as FIGS. 9 (a) to 9 (f), and the image information of the visible image corresponds to the gas cloud image.
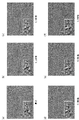
- (A) to (f) are another example of the moving image of the gas frequency component image by the gas visualization image processing apparatus 10.
- (A) to (f) are display images by the gas visualization image processing apparatus 10, and gas cloud superimposition in which the gas frequency component images shown in FIGS. 11 (a) to 11 (f) are superimposed on the visible images, respectively.
- (A) to (f) are display images by a conventional gas visualization image processing device based on the same image as FIGS. 11 (a) to 11 (f), and the image information of the visible image corresponds to the gas cloud image.
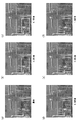
- (A) to (f) are another example of the enlarged moving image of the gas frequency component image by the gas visualization image processing device 10.
- FIGS. 14 (a) to 14 (f) are display images by the gas visualization image processing apparatus 10, and gas cloud superimposition in which the gas frequency component images shown in FIGS. 14 (a) to 14 (f) are superimposed on the visible images, respectively.
- (A) to (f) are display images by a conventional gas visualization image processing device based on the same image as FIGS. 14 (a) to 14 (f), and the image information of the visible image corresponds to the gas cloud image.
- the enlarged display image based on the replacement image replaced with the color information to be used It is a figure which shows the flow of the image processing which shows the outline of the processing in the gas visualization image processing apparatus which concerns on modification 1.
- FIG. 1 shows the flow of the image processing which shows the outline of the processing in the gas visualization image processing apparatus which concerns on modification 1.
- (A) to (d) are examples of the display image by the gas visualization image processing apparatus according to the modification 1
- (a) is a time difference image of an inspection image
- (b) (c) (d) are superposition ratios.
- This is an example of a display image when r is 30%, 50%, and 70%.
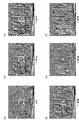
- (A) to (f) are examples of moving images of gas frequency component images by the image processing apparatus according to the first modification.
- (A) to (f) are display images by the image processing apparatus according to the first modification, and the gas in which the gas frequency component images shown in FIGS. 19 (a) to 19 (f) are superimposed on the visible images, respectively.
- (A) to (f) are another example of the moving image of the gas frequency component image by the image processing apparatus according to the modified example 1.
- (A) to (f) are display images by the image processing apparatus according to the first modification, and the gas in which the gas frequency component images shown in FIGS. 21 (a) to 21 (f) are superimposed on the visible images, respectively. This is another example of a display image based on a cloud superimposed image.
- (A) to (f) are another example of the enlarged moving image of the gas frequency component image by the image processing apparatus according to the modified example 1.
- (A) to (f) are display images by the image processing apparatus according to the first modification, and the gas on which the gas frequency component images shown in FIGS.
- FIG. 23 (a) and 23 (f) are superimposed on the visible images, respectively.
- This is another example of an enlarged display image based on a cloud superimposed image.
- FIG. It is a schematic block diagram of the gas visualization image processing system 1A which concerns on Embodiment 2.
- FIG. It is a figure which shows the flow of the image processing which shows the outline of the processing in the gas visualization image processing apparatus 10A which concerns on Embodiment 2.
- FIG. (A) to (b) are examples of the display image by the gas visualization image processing apparatus 10A, (a) is a gas frequency component image, and (b) is a display image when the superposition ratio r is 50%. This is just an example.
- (A) to (d) are examples of a display image by a negative / positive inverted image by the gas visualization image processing apparatus 10A, (a) is a gas frequency component inverted image, and (b) is a superposition ratio r of 50%. This is an example of the display image when the image is displayed.
- (A) is an example of the time difference image of the inspection image generated in step S4B.
- (B) (c) is an example of a display image when the time difference image of the inspection image and the visible image are superimposed at 30% and 50%.
- Embodiment 1 the gas visualization image processing apparatus 10 according to the first embodiment will be described with reference to the drawings.
- FIG. 1 is a functional block diagram of the gas visualization image processing system 1 according to the first embodiment.
- the gas visualization image processing system 1 includes an image acquisition means 20 for capturing an image of an inspection target and a gas visualization image processing device 10 (hereinafter referred to as a gas visualization image processing device 10) that detects gas based on an image acquired by the image acquisition means 20. , "Image processing device 10"), an operation input unit 30, a display unit 40, and a storage unit 50.
- the image acquisition means 20, the operation input unit 30, the display unit 40, and the storage unit 50 are each configured to be connectable to the image processing device 10.
- the image acquisition means 20 is an apparatus or system that captures an image of an inspection target and provides an image to the gas visualization image processing apparatus 10.
- the image acquisition means 20 is a camera including an inspection image generation unit 21 and a visible image generation unit 22.
- the inspection image generation unit 21 is a so-called infrared camera that detects and images infrared light having a wavelength of 3.2 to 3.4 ⁇ m, and can detect hydrocarbon gases such as methane, ethane, ethylene, and propylene. Is.
- the inspection image generation unit 21 includes an optical lens 211, a filter 212 that selectively transmits light in the infrared wavelength range, an image pickup device 213 that captures transmitted light, and a signal processing unit 214 that processes the acquired image signal.
- the image captured by the inspection image generation unit 21 is used as an inspection image used for detecting gas in the gas visualization image processing device 10.
- the visible image generation unit 22 is a so-called general visible camera that detects visible light and forms an image.
- the visible image generation unit 22 includes an optical lens 221, a filter 222 that selectively transmits light in the wavelength range of visible light, an image pickup element 223 that captures transmitted light, and a signal processing unit 224 that processes the acquired image signal.
- the image captured by the visible image generation unit 22 is useful for managing the inspection target, such as specifically specifying the gas detection location in the gas visualization image processing device 10 by comparing it with the inspection target, or is convenient for the inspector. It is used as a visible image to improve.
- the inspection image generation unit 21 and the visible image generation unit 22 have the inspection target 300 in both the visual field range 310 of the inspection image generation unit 21 and the visual field range 320 of the visible image generation unit 22. Installed to be included. It is preferable that the visual field range 310 and the visual field range 320 are substantially the same.
- the inspection image generation unit 21 and the visible image generation unit 22 are incorporated in one housing, and the image acquisition means 20 is realized as one dual wavelength camera.
- the inspection image generation unit 21 and the visible image generation unit 22 take images in parallel for the visual field range 310 and the visual field range 320, respectively, and output the captured images as video signals to the gas visualization image processing device 10.
- the video signal is, for example, a signal for transmitting an image of 30 frames per second.
- the gas visualization image processing device 10 is a device that acquires an image obtained by capturing an image of an inspection target from the image acquisition means 20, detects a gas region based on the image, and notifies the user of the gas detection through the display unit 40.
- the image processing device 10 is, for example, from a control unit CT realized as a computer including a general CPU (Central Processing Unit), RAM (Random Access Memory), and a program executed by these. It is composed.
- the control unit CT realizes each function of the image processing device 10 by reading out and executing the gas visualization image processing program from the storage unit 50 based on the instruction from the inspector received via the operation input unit 30. ..
- control unit CT constituting the image processing device 10 includes an image acquisition unit IN, an image holding unit 13, a gas region extraction unit 14, a visible image conversion unit 12, an image composition unit 16, and a display image conversion unit. It has 17 functional blocks.
- the image acquisition unit IN includes an inspection image acquisition unit 11 and a visible image acquisition unit 12.
- the inspection image acquisition unit 11 acquires an inspection image of the inspection target from the image acquisition means 20.
- an input device such as an image capture board for capturing image data into a processing device such as a computer can be utilized.
- the inspection image may be a moving image including time series data of a plurality of frames.
- the inspection image acquisition unit 11 acquires a video signal from the inspection image generation unit 21, restores the video signal to an image, and outputs the video signal to the image holding unit 13 as a moving image composed of a plurality of frames.
- the inspection image is an infrared image obtained by capturing an image of an inspection target, and has the intensity of infrared rays as a pixel value.
- the visible image acquisition unit 12 acquires a visible image of the inspection target from the image acquisition means 20.
- the visible image acquisition unit 12 acquires a video signal from the visible image generation unit 22, restores the video signal to an image, and outputs the video signal to the image holding unit 13 as a moving image composed of a plurality of frames.
- the image holding unit 13 is a storage medium that holds an inspection image as a moving image output by the inspection image acquisition unit 11, and is realized by, for example, a hard disk drive, a solid state drive, a semiconductor memory, or the like.
- the image holding unit 13 also holds a visible image as a moving image output by the visible image acquisition unit 12, which will be described later.
- the gas region extraction unit 14 acquires a plurality of inspection images from the image holding unit 13, extracts a gas existence range determined to be gas in the infrared image from the inspection image, and outputs the gas cloud image to the image synthesis unit 16. ..
- the gas region extraction unit 14 detects a gas leak to be inspected from an inspection image by, for example, executing a known optical gas leak detection method described in Japanese Patent Application Laid-Open No. 2017/073430. Specifically, when the infrared image of the inspection target has a region in which the frequency component due to the hydrocarbon gas is absorbed, the region is converted into, for example, the amount of gas into identification information, and the identification information is mapped. By doing so, a gas cloud image is generated and output.
- a gas frequency image obtained by extracting gas frequency component data indicating a temperature change due to leaked gas is used as a gas cloud image for a moving image of an infrared image of an inspection target taken at a plurality of times. Specifically, processing is performed to remove background frequency component data indicating a temperature change in the background of the inspection target, which has a lower frequency than the gas frequency component, from the image data showing the infrared image obtained by capturing the inspection target. In this way, it is possible to extract the time-frequency component of the image of the gas cloud existing in the space from the moving image of the inspection image to generate a gas cloud image with higher accuracy.
- the visible image conversion unit converts the visible image acquired from the image holding unit 13 into L *, a *, b corresponding to the CIE (L *, a *, b *) color space (CIELAB) from the RGB signal format. * Converted to a signal format and output to the image compositing unit 16.
- the conversion from the RGB signal to L * a * b is performed by first converting the RGB value into an XYZ value by a known conversion formula and then converting the XYZ value into L * a * b by using a known conversion formula. ..
- the image synthesis unit 16 generates a gas cloud superimposed image in which information on the gas region extracted by the gas region extraction unit 14 is superimposed on the visible image acquired from the visible image conversion unit.
- the information in the gas region is shown, for example, by converting the amount of gas into color information and mapping the color information to the position where the gas is detected.
- the channels constituting the visible image are R, G, B
- the channels corresponding to CIELAB in the visible image are L *, a *, b *
- gas is used as identification information based on the amount of gas extracted from the infrared image.
- Equation 1 the pixel value S of the gas cloud image and the L * value representing the brightness of the CIELAB are weighted and added by multiplying the superposition ratio r and (1-r) for each pixel. Combine to generate L *'of the combined signal.
- the a * and b * values of the visible image are multiplied by (1-r) to generate synthetic signals a *'and b *'that have a relationship of decreasing as the superposition ratio r increases. That is, the image synthesizing unit adopts a configuration in which the visible image and the gas cloud image are superimposed so that the larger the superposition ratio r of the gas cloud image with respect to the visible image, the lower the saturation of the gas cloud superimposition image.
- the visible image is converted into a channel showing the color space, and the saturation of the visible image is lowered when the superposition ratio r of the gas cloud image is increased, so that the visible image is visible even when the gas concentration is low.
- the gas cloud image can be displayed more easily.
- the saturation of the visible image when the superposition ratio r of the gas cloud image is decreased the visible image can be displayed more easily on the gas cloud image when the gas presence range in the infrared image is large. ..
- L * ′, a * ′, b * ′ may be calculated from Equations 1 to 3 by inverting and using the inverted pixel value S ′ instead of S.
- the image composition unit 16 outputs the generated gas cloud superimposed image to the display image conversion unit 17.
- the display image conversion unit 17 converts the gas cloud superimposed image acquired from the image composition unit 16 from the signal format of L *', a *', b *'to the RGB signal format of the display image, and the display unit 40. Output to and display. From this, the gas cloud superimposed image can be converted into R, G, and B channels to generate a display image.
- the L *, u *, v * signal format corresponding to the CIE (L *, u *, v *) color space (CIELUV) is used. It may be configured to be converted.
- the display unit 40 is, for example, a display device (monitor) such as a liquid crystal display or an organic EL display. It may be an alarm.
- a display device such as a liquid crystal display or an organic EL display. It may be an alarm.
- the operation input unit 30 is, for example, an input device such as a keyboard, a mouse, and a trackball.
- the display unit 40 and the operation input unit 30 may be realized as one device having both a display device and an input device, such as a touch panel and a tablet.
- the operator can input the superposition ratio r when superimposing the gas cloud image on the visible image. From this, the inspector increases or decreases the concentration of the gas cloud image extracted from the inspection image to adapt it to the mode of the gas cloud image and the visible image, and displays it so that it is easy to determine the presence or absence of gas and where it is leaking. It becomes possible.
- the storage unit 50 stores a gas visualization image processing program and the like necessary for the image processing device 10 to operate, and also has a function as a temporary storage area for temporarily storing the calculation result of the control unit CT.
- the storage unit 50 includes a volatile memory such as a DRAM and a non-volatile memory such as a hard disk.
- FIG. 3 is a diagram showing a flow of image processing showing an outline of processing in the image processing device 10.
- the image processing device 10 first acquires a visible image obtained by capturing an inspection target via the visible image acquisition unit 12 (step S1), and stores the visible image in the image holding unit 13. Then, the visible image conversion unit converts the visible image from the RGB signal format to the L *, a *, b * signal format (step S2).
- the image processing device 10 acquires an inspection image obtained by capturing an image of the inspection target via the inspection image acquisition unit 11 (step S3), and stores the acquired visible image in the image holding unit 13. Then, the gas region extraction unit 14 generates a gas frequency component image in which a gas frequency component showing a temperature change due to gas is extracted from a moving image of an infrared image of an inspection target as a gas cloud image showing a gas existence range (). Step S4). As a result, the gas existence range determined to be gas in the infrared image is extracted from the inspection image.
- the image synthesizing unit 16 generates a gas cloud superimposed image in which the information of the extracted gas existence region is superimposed on the visible image (step S5).
- the combined signals L *', a *', and b *'in the gas cloud superimposed image are calculated by the formulas 1 to 3 as described above.
- the display image conversion unit 17 converts the gas cloud superimposed image from the signal format of L *', a *', b *'to the RGB signal format in the display image (step S6), and displays the display image. Displayed by the display unit 40 (step S7), the process ends.
- FIG. 4A is an example of a gas frequency component image generated in step S4. If the background color of the visible image is bright, the inspection image may be inverted and then combined.
- FIG. 5A is an example of a gas frequency component inversion image obtained by negatively and positively inversion of the gas frequency component image. It can be seen that the gas existence range judged to be gas is extracted from the inspection image.
- FIGS. 4 (b), 4 (c) and 4 (d) are display images based on a gas cloud superimposed image generated by superimposing a gas frequency component image and a visible image at superposition ratios of 30%, 50% and 70%. This is an example. Further, FIGS. 5 (b), 5 (c) and 5 (d) are based on a gas cloud superimposed image generated by superimposing a gas frequency component inverted image and a visible image at superposition ratios of 30%, 50% and 70%. , Is an example of a display image.
- the gas cloud can be displayed in an easy-to-understand manner by selecting the gas frequency component image and the inverted image according to the background of the visible image. Further, the superposition ratio may be changed depending on the concentration of the gas cloud or the like.
- the viewer can grasp the absolute position of the gas cloud image showing the gas existence range from the display image having a high superposition ratio. For example, even when the absolute value of the pixel value S of the gas cloud image is small, the position of the gas cloud image can be grasped by increasing the superposition ratio r.
- the pixel value S of the gas cloud image is smaller and the concentration of the gas cloud is higher in the gas presence region than in the conventional example shown in FIG. 7 (c) described later. It can be seen that a small, so-called highlight part is displayed, and a gas presence area where the concentration of the gas cloud is low is displayed.
- the viewer uses a display image with a low superposition ratio to increase the saturation (density) in the visible image of the background and identify the relative position of the gas cloud image in the gas equipment displayed in the background image. can do. This allows the viewer to easily locate the source of the gas leak.
- FIG. 6 is a diagram showing a flow of image processing showing an outline of conventional gas visualization image processing.
- the same processes as in FIG. 3 are numbered the same.
- a visible image of an inspection target is acquired (step S1)
- an inspection image of an inspection target is acquired (step S3)
- a gas frequency component image extracted from a moving image of the inspection image is obtained.
- Generated as a gas cloud image showing the gas existence range step S4.
- a replacement process is performed in which the image information of the pixel corresponding to the position of the gas existence region of the gas cloud image in the visible image is replaced with the color information corresponding to the pixel value S of the gas cloud image (step S5X), and the replacement is performed.
- the image is displayed as a display image (step S7X).
- the color to be replaced with the gas cloud image is selected according to the size of the pixel value S of the gas cloud image, and is composed of RGBCMY, that is, a so-called pure color is selected.
- a gas cloud image having a pixel value S of 50 (max 255) or more may be displayed as a gas cloud.
- the colors associated with each pixel value are used so as to continuously change to blue, light blue, green, yellow, and red (B, C, G, Y, R, M) as the pixel value increases. It may be displayed.
- FIGS. 7 (a) to 7 (c) are examples of display images obtained by conventional gas visualization image processing
- FIGS. 7 (a) and 7 (c) are examples of visible images.
- (B) is a gas frequency component image, and it can be seen that the gas existence range is extracted.
- (C) is an example of the display image, and it can be seen that the gas existence region in the visible image is replaced with a pure color (frame line display in black and white).
- FIGS. 4 (d) and 5 (d) the portion determined to be gas (inside the broken line frame) is shown as a thin gas in FIG. 7 (c). Since the part is not displayed, it cannot be determined from this image whether it is gas or not.
- the so-called highlight portion in which the pixel value S of the gas cloud image is small and the concentration of the gas cloud is small, is not displayed from the gas presence region and falls out of the gas presence region. You can see that it is.
- a moving image may be used as the inspection image.
- 8 (a) to 8 (f) are examples of moving images of gas frequency component images by the gas visualization image processing device 10. As shown in the broken line frame, it can be seen that the position of the extracted gas existence range changes.
- FIGS. 8 (a) to 8 (f) are display images by the gas visualization image processing apparatus 10, and the gas in which the gas frequency component images shown in FIGS. 8 (a) to 8 (f) are superimposed on the visible images, respectively.
- This is an example of a display image based on a cloud superimposed image.
- On the background image of the gas equipment it can be seen that the position of the extracted gas existence range changes. In this way, by using a moving image for the gas cloud superimposed image, the movement of the gas can be confirmed in the image, so that it is easier to confirm where the gas is coming out of the equipment than in the still image.
- the concentration of the gas cloud in the gas presence region is higher than that of the conventional example shown in FIGS. 10 (a) to 10 (f) described later. It can be seen that the position change of the low gas presence area is displayed.
- FIGS. 10 (a) to 10 (f) are display images by a conventional gas visualization image processing device based on the same image as FIGS. 9 (a) to 9 (f), and the image information of the visible image is a gas cloud image.
- This is an example of a display image based on a replacement image replaced with the color information corresponding to.
- the portion (inside the broken line frame) that can be determined to be gas in FIGS. 9 (a) to 9 (f) is similarly formed even in the moving image. Since the thin gas portion is not displayed in FIGS. 10A to 10F, it cannot be determined from this image whether the gas is gas or not. From this, it can be seen that in the conventional gas visualization image processing, the highlight portion where the concentration of the gas cloud is small is not displayed and is missing from the gas existence region.
- [Image example 3] 11 (a) to 11 (f) are another example of the moving image of the gas frequency component image by the gas visualization image processing device 10, and noise and vegetation due to vibration of the image acquisition means 20 (infrared camera, visible camera). This is an example when there is noise due to the shaking of the camera. As shown in the broken line frame, it can be seen that the position of the extracted gas existence range changes.
- FIGS. 12 (a) to 12 (f) are display images by the gas visualization image processing apparatus 10, and the gas in which the gas frequency component images shown in FIGS. 11 (a) to 11 (f) are superimposed on the visible images, respectively.
- This is another example of a display image based on a cloud superimposed image.
- the position of the extracted gas existence range changes.
- vibration noise, noise due to shaking of plants, etc. are compared with the conventional examples shown in FIGS. 13 (a) to 13 (f) described later.
- FIGS. 13 (a) to 13 (f) are display images by a conventional gas visualization image processing device based on the same image as FIGS. 12 (a) to 12 (f), and the image information of the visible image is a gas cloud image. It is another example of the display image based on the replacement image replaced with the color information corresponding to.
- the gas cloud from the gas existence region is compared with FIGS. 12 (a) to 12 (f). It can be seen that the highlight part with low density is not displayed and is missing, and it is difficult to distinguish the gas cloud from the background noise, and the existence of the gas cloud is not well understood.
- [Image example 4] 14 (a) to 14 (f) are another example of the enlarged moving image of the gas frequency component image by the gas visualization image processing device 10. As shown in the broken line frame, it can be seen that the position of the extracted gas existence range changes.
- 15 (a) to 15 (f) are display images by the gas visualization image processing device 10, and the gas in which the gas frequency component images shown in FIGS. 14 (a) and 14 (f) are superimposed on the visible images, respectively.
- This is another example of an enlarged display image based on a cloud superimposed image.
- the position of the extracted gas existence range changes.
- the concentration of the gas cloud in the gas presence region is higher than that of the conventional example shown in FIGS. 16 (a) to 16 (f) described later.
- 16 (a) to 16 (f) are display images by a conventional gas visualization image processing device based on the same image as FIGS. 15 (a) to 15 (f), and the image information of the visible image is a gas cloud image.
- the enlarged display image based on the replacement image replaced with the color information corresponding to.
- a gas cloud may appear in half of the image.
- the highlight portion having a small gas cloud concentration is missing from the gas existence region without being displayed.
- the background part that overlaps with the gas existence area is hidden, the shape of the hidden gas equipment cannot be recognized, and it is difficult to grasp which gas device is leaking from where.
- the field of view in which the space including the inspection target is substantially the same as the visible image captured by the visible camera and the space is substantially the same as the visible image by the infrared camera.
- An image acquisition unit IN that acquires inspection images captured in parallel for a range
- a gas region extraction unit 14 that extracts an image of a gas cloud existing in space from the inspection image, and generates a gas cloud image.
- An image compositing unit 16 that superimposes a visible image and a gas cloud image to generate a gas cloud superimposing image
- a gas visualization image processing device 10 provided. It is characterized by superimposing the target image and the gas cloud image so that it can be recognized from the gas cloud superimposed image.
- a gas frequency component image obtained by extracting a gas frequency component indicating a temperature change due to gas from a moving image of an infrared image taken of an inspection target is used as a gas cloud image showing a gas existence range. It was configured to be generated (step S4 in FIG. 3).
- the processing method for extracting the gas existence range determined to be gas from the inspection image by the gas region extraction unit 14 is different from the processing method of the first embodiment.
- FIG. 17 is a diagram showing a flow of image processing showing an outline of processing in the image processing device 10.
- FIG. 6 the same processes as in FIG. 3 are numbered the same.
- step S4A a time difference image separated by a predetermined number of frames from the moving image of the infrared image of the inspection target is displayed as a gas indicating a gas existence range.
- the gas existence range judged to be gas in the infrared image is extracted from the inspection image. Since the processing other than step S4A is the same processing as the image processing apparatus 10 shown in FIG. 3, the description thereof will be omitted.
- FIG. 18A is an example of a time difference image of the inspection image generated in step S4A. As shown in the broken line frame, it can be seen that the gas existence range judged to be gas is extracted from the inspection image.
- the viewer can grasp the absolute position of the gas cloud image showing the gas existence range from the display image having a high superposition ratio.
- FIG. 18D a so-called highlight portion in which the pixel value S of the gas cloud image is small and the concentration of the gas cloud is small in the gas presence region is displayed, and the gas presence region in which the concentration of the gas cloud is low is displayed. Can be seen that is displayed.
- the viewer uses a display image with a low superposition ratio to increase the saturation (density) in the visible image of the background and identify the relative position of the gas cloud image in the gas equipment displayed in the background image. can do.
- the image of the gas cloud existing in the space is extracted from the time difference processing of the moving image of the inspection image to generate a more accurate gas cloud image. can do.
- [Image examples 6, 7, 8] 19 (a) to 19 (f) are examples of time-difference images of inspection images by the image processing apparatus according to the first modification. It is an image in which the time difference is taken in 0.2 seconds, and there is noise at the edge of the pipe (the boundary of the subject) due to the influence of vibration.
- 20 (a) to 20 (f) are display images, and are display images based on gas cloud superimposed images in which the gas frequency component images shown in FIGS. 19 (a) and 19 (f) are superimposed on the visible images, respectively. This is an example.
- 21 (a) to 21 (f) are examples of time-difference images of inspection images by the image processing device according to the first modification, and are noise and vegetation due to vibration of the image acquisition means 20 (infrared camera, visible camera). This is an example when there is noise due to shaking.
- 22 (a) to 22 (f) are another example of the display image based on the gas cloud superimposed image in which the gas frequency component images shown in FIGS. 21 (a) to 21 (f) are superimposed on the visible image, respectively. ..
- FIGS. 23 (a) to 23 (f) are examples of time-difference images of inspection images by the image processing apparatus according to the first modification.
- 24 (a) to 24 (f) are another example of an enlarged display image based on the gas cloud superimposed image in which the gas frequency component images shown in FIGS. 23 (a) and 23 (f) are superimposed on the visible image, respectively. Is.
- FIGS. 20 (a) to 20 (f) it can be seen that the position of the extracted gas existence range changes on the background image of the gas facility. It can be seen that the change in the position of the gas existing region where the concentration of the gas cloud in the existing region is low is displayed, and the shape of the gas equipment in the background portion overlapping the gas existing region is visible. Therefore, as shown in FIGS. 19 (a) to 19 (f), even if there is noise at the edge portion of the pipe (boundary portion of the subject) due to the influence of vibration, it just overlaps with the visible edge portion, and thus the combined diagram. In 20 (a) to (f), only the gas cloud can be visually recognized, and the gas existence region can be easily determined.
- the gas cloud can be distinguished from the background noise and the existence of the gas cloud can be recognized.
- Embodiment 2 In the image processing apparatus 10 according to the first embodiment, the visible image is converted from the RGB signal format to the L *, a *, b * signal format, and the image synthesizing unit 16 is placed on the converted visible image.
- the configuration is such that a gas cloud superimposed image in which information in the gas region is superimposed is generated.
- the image processing apparatus is different from the first embodiment in that it generates a gas cloud superimposed image in which information of a gas region is superimposed on a visible image composed of RGB signals.
- FIG. 25 is a schematic configuration diagram of the gas visualization image processing system 1A according to the second embodiment).
- the control unit CT constituting the image processing device 10A includes an inspection image acquisition unit 11, a visible image acquisition unit 12, an image holding unit 13, a gas region extraction unit 14, and an image composition unit 16A.
- the configurations other than the image synthesizing unit 16A are the same as those of the image processing apparatus 10 shown in FIG. 1, so the same numbers are assigned and the description thereof will be omitted.
- the image processing device 10A does not have the visible image conversion unit and the display image conversion unit 17 according to the first embodiment.
- the image synthesis unit 16A generates a gas cloud superimposed image in which information on the gas region extracted by the gas region extraction unit 14 is superimposed on a visible image composed of RGB signals acquired from the visible image conversion unit 12.
- the information in the gas region is shown, for example, by converting the amount of gas into color information and mapping the color information to the position where the gas is detected.
- the signal value of the visible image is used
- the combined signals R', G', and B' are calculated by equations 5 to 7.
- the pixel value S of the gas cloud image may be inverted by the equation 4, and the combined signals R', G', and B'may be calculated from the equations 5 to 7 using the inverted pixel value S'.
- the image synthesizing unit 16 outputs the generated gas cloud superimposed image to the display unit 40 and displays it.
- Equations 5 to 7 may be selectively used to process some channels of RGB.
- FIG. 26 is a diagram showing a flow of image processing showing an outline of processing in the image processing device 10A.
- the same processes as in FIG. 3 are numbered the same.
- a gas frequency component image obtained by extracting a gas frequency component indicating a temperature change due to gas from a moving image of an infrared image of an inspection target is obtained by displaying a gas existence range.
- Infrared image from inspection image by generating as a gas cloud image to show, or by generating a time difference image separated by a predetermined number of frames and generating the time difference image as a gas cloud image showing the gas existence range.
- Either processing is performed to extract the gas existence range determined to be gas in the above.
- step S5B the image synthesizing unit 16A superimposes the information of the gas existence region extracted on the visible image by the formulas 5 to 7 to generate the signals R', G', and B'of the gas cloud superimposed image.
- the display image composed of the gas cloud superimposed image is displayed by the display unit 40 (step S7), and the process is terminated. Since the processing other than steps S4B and S5B is the same processing as the image processing apparatus 10 shown in FIG. 3, the description thereof will be omitted.
- FIG. 27A is an example of a gas frequency component image generated in step S4B.
- FIG. 28A is an example of a gas frequency component inversion image obtained by negatively and positively inversion of the gas frequency component image. As shown in the broken line frame, it can be seen that the gas existence range judged to be gas is extracted from the inspection image.
- FIG. 27B is an example of a display image based on a gas cloud superimposition image generated by superimposing a gas frequency component image and a visible image at a superimposition ratio of 50%.
- FIG. 28B is an example of a display image based on a gas cloud superimposition image generated by superimposing a gas frequency component inverted image and a visible image at a superimposition ratio of 50%.
- the so-called highlight portion where the pixel value S of the gas cloud image is small and the concentration of the gas cloud is small in the gas existence region is displayed, and the gas existence region where the gas cloud concentration is low is displayed. You can see that it is displayed.
- FIG. 29A is an example of a time difference image of the inspection image generated in step S4B. As shown in the broken line frame, it can be seen that the gas existence range judged to be gas is extracted from the inspection image.
- FIGS. 29 (b) and 29 (c) are examples of display images when the time difference image of the inspection image and the visible image are superimposed at 30% and 50%. As shown in the broken line frame, it can be seen that the density of the gas presence range increases and the saturation (density in black and white) in the visible image of the background decreases as the superposition ratio increases.
- the viewer can grasp the absolute position of the gas cloud image showing the gas existence range from the display image having a high superposition ratio.
- the superposition ratio is high, the saturation (density) in the visible image of the background is displayed low, and the position of the gas cloud image can be easily grasped.
- the viewer uses a display image with a low superposition ratio to increase the saturation (density) in the visible image of the background and identify the relative position of the gas cloud image in the gas equipment displayed in the background image. can do.
- the image synthesizing unit is a channel of R, G, B constituting the visible image, or a part of channels of R, G, B. It is characterized in that the gas cloud superimposed image is generated by superimposing the gas cloud image on the surface.
- the gas cloud image and the visible image of the background leak from the presence or absence of gas or where. It can be displayed so that it can be easily determined.
- the inspection image is described as an infrared image captured by an infrared camera as an example, but an image of a gas cloud existing in the space is extracted from a visible image to generate a gas cloud image. It may be configured to be used.
- a gas such as water vapor that looks white can be extracted.
- the concentration of colored gas such as water vapor is low or the presence range of water vapor etc. in the visible image is large, the gas cloud image such as water vapor and the visible image of the background leak from where there is water vapor etc. It is possible to realize a processing method that can be displayed so that it can be easily determined.
- the background image is a visible image, but the visible image may be a gray image instead of a color image.
- a gas plant is illustrated as a gas facility as an example of an inspection image.
- the present disclosure is not limited to this, and may be applied to the generation of display images in equipment, devices, laboratories, laboratories, factories, and business establishments that use gas.
- the present invention is a computer system including a microprocessor and a memory, and the memory may store the computer program, and the microprocessor may operate according to the computer program.
- the present invention may be a computer system that has a computer program for processing in the system of the present disclosure or a component thereof, and operates according to this program (or instructs each connected part to operate).
- the present invention also includes a case where all or part of the processing in the above system or its constituent elements is configured by a computer system composed of a microprocessor, a recording medium such as a ROM, a RAM, a hard disk unit, and the like.
- the RAM or the hard disk unit stores a computer program that achieves the same operation as each of the above devices.
- each device achieves its function.
- a system LSI is a super-multifunctional LSI manufactured by integrating a plurality of components on one chip, and specifically, is a computer system including a microprocessor, ROM, RAM, and the like. .. These may be individually integrated into one chip, or may be integrated into one chip so as to include a part or all of them.
- a computer program that achieves the same operation as each of the above devices is stored in the RAM.
- the microprocessor operates according to the computer program, the system LSI achieves its function.
- the present invention also includes a case where a process in a system or a component thereof is stored as an LSI program, and the LSI is inserted into a computer to execute a predetermined program.
- the method of making an integrated circuit is not limited to LSI, and may be realized by a dedicated circuit or a general-purpose processor.
- An FPGA Field Programmable Gate Array
- a reconfigurable processor that can reconfigure the connection and settings of circuit cells inside the LSI may be used.
- a part or all of the functions of the system or its components according to each embodiment may be realized by executing a program by a processor such as a CPU. It may be a non-temporary computer-readable recording medium on which a program that performs the operation of the system or its components is recorded. By recording a program or signal on a recording medium and transferring it, the program may be executed by another independent computer system. Needless to say, the above program can be distributed via a transmission medium such as the Internet.
- system or each component thereof may have a configuration realized by a programmable device such as a CPU, a GPU (Graphics Processing Unit) or a processor, and software.
- a programmable device such as a CPU, a GPU (Graphics Processing Unit) or a processor, and software.
- These components can be a single circuit component or an aggregate of a plurality of circuit components. Further, a plurality of components can be combined into one circuit component, or an aggregate of a plurality of circuit components can be formed.
- Division of functional blocks is an example, and even if multiple functional blocks are realized as one functional block, one functional block is divided into multiple, or some functions are transferred to other functional blocks. good. Further, the functions of a plurality of functional blocks having similar functions may be processed by a single hardware or software in parallel or in a time division manner.
- the order in which the above steps are executed is for exemplifying in order to specifically explain the present invention, and may be an order other than the above. Further, a part of the above steps may be executed simultaneously with other steps (parallel).
- the space including the inspection target is captured by the visible camera, and the space is captured by the infrared camera in parallel with the visible image.
- An image acquisition unit for acquiring an image a gas region extraction unit for extracting an image of a gas cloud existing in the space from the inspection image to generate a gas cloud image, and the visible image and the gas cloud image.
- the target image and the gas cloud image are superimposed so as to be possible.
- the background may be configured to be an image of the inspection target superimposed on the gas cloud image.
- the image synthesizing unit is obtained by converting the channels of R, G, and B constituting the visible image into channels showing a predetermined color space.
- the gas cloud superimposed image may be generated by superimposing the gas cloud image on the channel indicating the brightness.
- the image synthesizing unit reduces the saturation of the gas cloud superimposed image as the superposition ratio of the gas cloud image with respect to the visible image increases.
- the visible image and the gas cloud image may be superimposed.
- the visible image is converted into a channel showing a color space, and when the superposition ratio r of the gas cloud image is increased, the saturation of the visible image is reduced, so that the visible image is visible even when the gas concentration is low.
- the gas cloud image can be displayed more easily than the image.
- the channel indicating the predetermined color space converted from the visible image is L *, a *, b *, and the pixel value indicating the density in the gas cloud image.
- the superposition ratio is r, and when the channels showing the predetermined color space in the gas cloud superimposition image are L *', a *', b *', the gas cloud superimposition image is
- the gas cloud superimposed image can be converted into R, G, and B channels to generate a display image.
- the image synthesizing unit has the gas cloud in the R, G, B channels constituting the visible image, or a part of the R, G, B channels.
- the gas cloud superimposed image may be generated by superimposing the images.
- the signals of the R, G, and B channels that make up the visible image are used to display the gas cloud image and the visible image of the background so that it is easy to determine the presence or absence of gas and where it is leaking. Can be done.
- the image synthesizing unit may be configured to perform a conversion process of inverting the black and white of the gas cloud image and then superimpose it on the visible image.
- the inspection image is selectively inverted and then combined to match the gas presence range judged to be gas from the inspection image to the visible image. It can be displayed so that it is easy to determine the presence or absence of gas and where it is leaking.
- a configuration may further include an operation input unit that accepts an operation input as to whether or not to invert the black and white of the gas image.
- the inspector can selectively invert the inspection image and then synthesize it according to the brightness of the background color of the visible image.
- a configuration may be provided in which an operation input unit for receiving the operation input of the superposition ratio is further provided.
- the operator can input the superposition ratio r when superimposing the gas cloud image on the visible image by using the operation input unit. From this, the inspector increases or decreases the concentration of the gas cloud image extracted from the inspection image to adapt it to the mode of the gas cloud image and the visible image, and displays it so that it is easy to determine the presence or absence of gas and where it is leaking. be able to.
- the inspection image is a moving image composed of a plurality of frames
- the gas cloud image is a process of extracting a predetermined time frequency component from the inspection image. It may be configured as a performed image.
- the inspection image is a moving image composed of a plurality of frames
- the gas cloud image is an image obtained by performing a predetermined time difference process from the inspection image. It may be a certain configuration.
- an image acquisition unit that acquires a visible image of the space including the inspection target captured by a visible camera, and an image of a gas cloud existing in the space from the visible image.
- a gas visualization image processing device including a gas region extraction unit that generates a gas cloud image by extracting a gas cloud image and a gas cloud superimposed image unit that superimposes the visible image and the gas cloud image to generate a gas cloud superimposed image.
- the gas cloud superimposed image unit may be configured to superimpose the target image and the gas cloud image so that the viewer can recognize the background of the gas cloud image from the gas cloud superimposed image.
- the gas cloud image such as water vapor and the visible image of the background can be displayed depending on the presence or absence of water vapor etc. It is possible to realize a processing method that can be displayed so that it can be easily determined whether or not it is leaking.
- a visible image in which the space including the inspection target is captured by a visible camera and an inspection image in which the space is captured in parallel with the visible image by an infrared camera are used.
- To generate a gas cloud image by extracting an image of a gas cloud existing in the space from the inspection image, and superimposing the visible image and the gas cloud image to generate a gas cloud superimposed image.
- the target image and the gas cloud image are used so that the viewer can recognize the background of the gas cloud image from the gas cloud superimposed image. It is characterized by superimposing and.
- a visible image in which the space including the inspection target is captured by a visible camera is acquired, and an image of a gas cloud existing in the space is extracted from the visible image.
- It is a gas visualization image processing method that generates a gas cloud image and superimposes the visible image and the gas cloud image to generate a gas cloud superimposition image.
- the gas The target image and the gas cloud image may be superimposed so that the viewer can recognize the background of the cloud image from the gas cloud superimposed image.
- the program according to the present embodiment is a program for causing a computer to perform gas visualization image processing
- the gas visualization image processing includes a visible image in which a space including an inspection target is captured by a visible camera and the space. Acquires an inspection image captured in parallel with the visible image by an infrared camera, extracts an image of a gas cloud existing in the space from the visible image, and generates a gas cloud image to generate the visible image.
- the gas visualization image processing method for generating a gas cloud superimposed image by superimposing the gas cloud image and the gas cloud image in the process of generating the gas cloud superimposed image, a viewer looks at the background of the gas cloud image. It is characterized in that the target image and the gas cloud image are superimposed so that they can be recognized from the cloud superimposed image.
- the program according to the present embodiment is a program for causing a computer to perform gas visualization image processing, and the gas visualization image processing acquires a visible image in which a space including an inspection target is captured by a visible camera.
- a gas visualization image processing method that extracts an image of a gas cloud existing in the space from the visible image to generate a gas cloud image, and superimposes the visible image and the gas cloud image to generate a gas cloud superimposed image.
- the target image and the gas cloud image are superimposed so that the viewer can recognize the background of the gas cloud image from the gas cloud superimposed image. May be good.
- the order in which the above method is executed is for exemplifying for concretely explaining the present invention, and may be an order other than the above. Moreover, a part of the above-mentioned method may be executed at the same time (parallel) with another method.
- the gas visualization image processing apparatus, gas visualization image processing method, and program according to the present disclosure can be widely applied to a system that uses a gas leak in a gas facility for inspection.
- Gas detection system 10
- Gas visualization image processing device 11
- Inspection image acquisition unit 12
- Visual image acquisition unit 13
- Image retention unit 14
- Gas area extraction unit 15
- Image synthesis unit 16
- Display control unit 20
- Image acquisition means 21
- Inspection image generation unit (infrared camera)
- Visible image generator visible camera
- Operation input unit 40
- Display unit 300 Inspection target IN image acquisition unit CT control unit
Landscapes
- Engineering & Computer Science (AREA)
- Physics & Mathematics (AREA)
- General Physics & Mathematics (AREA)
- Computer Vision & Pattern Recognition (AREA)
- Theoretical Computer Science (AREA)
- Investigating Or Analysing Materials By Optical Means (AREA)
Abstract
ガスの濃度が薄い場合や、赤外線画像におけるガス存在範囲が大きい場合にも、ガス雲画像と背景の可視画像とを、ガスの有無やどこから漏れているか判断しやすいように表示する。 検査対象を含む空間が可視カメラにより撮像された可視画像と、空間が赤外線カメラによリ可視画像と並行して撮像された検査画像とを、それぞれ取得する画像取得部(IN)と、検査画像から空間に存在するガス雲の像を抽出してガス雲画像を生成するガス領域抽出部(14)と、可視画像とガス雲画像とを重ねて合わせてガス雲重畳画像を生成する画像合成部(16)と、備えるガス可視化画像処理装置(10)であって、画像合成部は、ガス雲画像の背景を看者がガス雲重畳画像から認識できるように、対象画像とガス雲画像とを重ね合わせることを特徴とする。
Description
本開示は、ガス漏れを検出して映像により空間に存在するガスの存在領域を可視化するガス可視化画像処理装置、ガス可視化画像処理方法、および、プログラムに関する。
天然ガスや石油を生産する生産施設、ガスを使用して化学製品を生産する生産プラント、ガス送管設備、石油化学プラントや火力発電所、製鉄関連施設等といった、ガスを使用する設備(以下「ガス設備」と記す場合もある)では、施設の経年劣化や運転ミスにより、ガス漏洩の危険性が認識されており、ガス漏洩を最小限にとどめるためにガス検知装置が備え付けられている。
このガス検知において、近年では、ガスの赤外線吸光特性を利用して赤外線動画を撮影することにより、検査対象からのガス漏れを検出する光学的ガス漏れ検出方法が提案されている(例えば、特許文献1)。抽出したガス像を表示する際に、ガスの存在する範囲を着色により可視化し、ガス設備を撮像した可視画像を併せて表示すると、看者はガスの流れ等の放出状態や、漏れ位置を認識でき、ガス漏れかどうかやガス設備のどこからガスが漏れているかを判断することができる。
一方、赤外画像(熱画像)と可視光画像とを重畳すると視認性が極端に悪くなるために、可視光画像と熱画像をラインごとに交互、または特定のパターンで入れ違いに表示させることで、視認性の悪さを解消する合成方法が提案されている(特許文献2)。
ところが、従来の装置のように、赤外線画像においてガスと判断されたガス存在範囲を着色したガス雲画像を、背景となる可視画像の対応する画像部分に置き換えて表示する構成では、1)ガスの濃度が薄いとガス雲画像として表示されない、2)赤外線画像におけるガス存在範囲の占める割合が多いと、背景の可視画像が隠れてしまい、何が映っているかわからない場合があるという不具合があり、撮影状況によってはガス漏れの有無やガス設備のどこからガスが漏れているか否かの判断が難しいという課題があった。
また、特許文献2の方法では、赤外線画像に表示されているラインもしくはパターンによりガス雲を認識しても、その部分の可視画像が表示されないため、どこから漏れているか把握できないといった問題や、あるいは、逆に実際の漏洩源が可視画像のラインもしくはパターンに存在すると、ガス雲の端のみ赤外線画像で表示されるために、可視画像上では漏洩源部分のガスが確認できないといった問題があった。
本開示の態様は、上記課題に鑑み、ガスの濃度が薄い場合や、赤外線画像におけるガス存在範囲が大きい場合にも、ガス雲画像と背景の可視画像とを、ガスの有無やどこから漏れているか判断しやすいように表示できるガス可視化画像処理装置、ガス可視化画像処理方法、および、プログラムを提供することを目的とする。
本開示の一態様に係るガス可視化画像処理装置は、検査対象を含む空間が可視カメラにより撮像された可視画像と、前記空間が赤外線カメラにより前記可視画像と並行して撮像された検査画像とを、それぞれ取得する画像取得部と、前記検査画像から前記空間に存在するガス雲の像を抽出してガス雲画像を生成するガス領域抽出部と、前記可視画像と前記ガス雲画像とを重ねて合わせてガス雲重畳画像を生成する画像合成部とを備えるガス可視化画像処理装置であって、前記画像合成部は、前記ガス雲画像の背景を看者が前記ガス雲重畳画像から認識できるように、前記対象画像と前記ガス雲画像とを重ね合わせることを特徴とする。
ここで、前記背景は、前記ガス雲画像と重ね合わせられた前記検査対象の像であり、前記画像合成部は、前記可視画像を構成するR、G、Bのチャネルを、所定の色空間を示すチャネルに変換し、得られた明度を示すチャネルに前記ガス雲画像を重ね合わせることにより、前記ガス雲重畳画像を生成する構成としてもよい。また、前記画像合成部は、前記可視画像に対する前記ガス雲画像との重畳割合が大きいほど、前記ガス雲重畳画像の彩度が低くなるように、前記可視画像と前記ガス雲画像を重ね合わせる構成としてもよい。
本開示の一態様に係るガス可視化画像処理装置、ガス可視化画像処理方法、および、プログラムによれば、ガスの濃度が薄い場合や、画像におけるガス存在範囲が大きい場合にも、ガス雲画像と背景の可視画像とを、ガスの有無やどこから漏れているか判断しやすいように表示できる。これにより、ガス漏れの有無やガス設備のどこからガスが漏れているか否かの判断が容易になる。
≪実施の形態1≫
以下、実施の形態1に係るガス可視化画像処理装置10について、図面を参照しながら説明する。
以下、実施の形態1に係るガス可視化画像処理装置10について、図面を参照しながら説明する。
図1は、実施の形態1に係るガス可視化画像処理システム1の機能ブロック図である。図1に示すように、ガス可視化画像処理システム1は、検査対象を撮像するための画像取得手段20と、画像取得手段20が取得した画像に基づきガスを検知するガス可視化画像処理装置10(以後、「画像処理装置10」とする場合がある)、操作入力部30、表示部40、及び記憶部50を有する。画像取得手段20、操作入力部30、表示部40、及び記憶部50は、それぞれ、画像処理装置10に接続可能に構成されている。
<画像取得手段20>
画像取得手段20は、検査対象を撮像してガス可視化画像処理装置10に画像を提供する装置またはシステムである。実施の形態において、画像取得手段20は、検査画像生成部21と可視画像生成部22とを備えるカメラである。
画像取得手段20は、検査対象を撮像してガス可視化画像処理装置10に画像を提供する装置またはシステムである。実施の形態において、画像取得手段20は、検査画像生成部21と可視画像生成部22とを備えるカメラである。
検査画像生成部21は、例えば、波長3.2~3.4μmの赤外光を検知して画像化する、いわゆる赤外線カメラであり、メタン、エタン、エチレン、プロピレンなど炭化水素系ガスを検知可能である。検査画像生成部21は、光学レンズ211、赤外線の波長範囲の光を選択的に透過させるフィルタ212、透過光を撮像する撮像素子213、取得した画像信号を処理する信号処理部214を備える。検査画像生成部21が撮像した画像は、ガス可視化画像処理装置10において、ガスを検知するために用いる検査画像として用いられる。
可視画像生成部22は、可視光を検知して画像化する、いわゆる一般的な可視カメラである。可視画像生成部22は、光学レンズ221、可視光の波長範囲の光を選択的に透過させるフィルタ222、透過光を撮像する撮像素子223、取得した画像信号を処理する信号処理部224を備える。可視画像生成部22が撮像した画像は、ガス可視化画像処理装置10において、ガス検知場所を検査対象と照らして具体的に特定するなど、検査対象の管理上有用な、または、検査者の利便性を向上ための可視画像として用いられる。
検査画像生成部21と可視画像生成部22は、図2の模式図に示すように、検査画像生成部21の視野範囲310と可視画像生成部22の視野範囲320のいずれにも検査対象300が含まれるように設置される。なお、視野範囲310と視野範囲320はほぼ一致していることが好ましい。実施の形態では、検査画像生成部21と可視画像生成部22は1つの筐体に組み込まれて画像取得手段20が1台の2波長カメラとして実現される。
検査画像生成部21と可視画像生成部22は、それぞれ、視野範囲310と視野範囲320について並行して撮像を行い、撮像した画像を映像信号としてガス可視化画像処理装置10に出力する。映像信号としては、例えば、秒間30フレームの画像を伝送するための信号である。
<ガス可視化画像処理装置10の構成>
ガス可視化画像処理装置10は、画像取得手段20から検査対象を撮像した画像を取得し、画像に基づいてガス領域の検出を行い、表示部40を通じてユーザにガス検知を通知する装置である。画像処理装置10は、図1に示すように、例えば、一般的なCPU(Central Processing Unit)とRAM(Random Access Memory)と、これらで実行されるプログラムを備えるコンピュータとして実現される制御部CTから構成される。
ガス可視化画像処理装置10は、画像取得手段20から検査対象を撮像した画像を取得し、画像に基づいてガス領域の検出を行い、表示部40を通じてユーザにガス検知を通知する装置である。画像処理装置10は、図1に示すように、例えば、一般的なCPU(Central Processing Unit)とRAM(Random Access Memory)と、これらで実行されるプログラムを備えるコンピュータとして実現される制御部CTから構成される。
制御部CTは、操作入力部30を介して受け付けた検査者からの指示に基づき、記憶部50からガス可視化画像処理プログラムを読みだして実行することにより、画像処理装置10の各機能を実現する。
画像処理装置10を構成する制御部CTは、図1に示すように、画像取得部IN、画像保持部13、ガス領域抽出部14、可視画像変換部12、画像合成部16、表示画像変換部17の機能ブロックを有する。
画像取得部INは、検査画像取得部11と可視画像取得部12からなる。
検査画像取得部11は、検査対象を撮像した検査画像を画像取得手段20から取得する。例えば、画像キャプチャーボード等、画像データをコンピュータ等の処理装置に取り込むための入力装置を活用できる。検査画像は、複数フレームの時系列データを含む動画像としてもよい。実施の形態では、検査画像取得部11は、検査画像生成部21から映像信号を取得し、映像信号を画像に復元して、複数のフレームからなる動画として画像保持部13に出力する。検査画像は検査対象を撮像した赤外線画像であり、画素値として赤外線の強度を有する。
可視画像取得部12は、検査対象を撮像した可視画像を画像取得手段20から取得する。実施の形態では、可視画像取得部12は、可視画像生成部22から映像信号を取得し、映像信号を画像に復元して、複数のフレームからなる動画として画像保持部13に出力する。
画像保持部13は、検査画像取得部11が出力する動画としての検査画像を保持する記憶媒体であり、例えば、ハードディスクドライブ、ソリッドステートドライブや、半導体メモリなどで実現される。また、画像保持部13は、後述する可視画像取得部12が出力する動画としての可視画像も保持している。
ガス領域抽出部14は、画像保持部13から複数の検査画像を取得し、検査画像から赤外線画像においてガスと判断されるガス存在範囲を抽出して、ガス雲画像として画像合成部16に出力する。ガス領域抽出部14は、例えば、特許国際公開第2017/073430号等に記載された公知の光学的ガス漏れ検出方法を実行させることにより、検査画像から検査対象のガス漏れを検出する。具体的には、検査対象を撮影した赤外線画像に、炭化水素系ガスによる周波数成分が吸収された領域があるとき、その領域を、例えば、ガス量を識別情報に変換し、識別情報をマッピングすることでガス雲画像を生成して出力する。本例では、検査対象を複数の時刻で撮影した赤外線画像の動画に対し、漏れたガスによる温度変化を示すガス周波数成分データを抽出したガス周波数画像をガス雲画像とする。具体的には、検査対象を撮影した赤外線画像を示す画像データから、ガス周波数成分よりも周波数が低く、検査対象の背景の温度変化を示す背景周波数成分データを除く処理を行う。このように、検査画像の動画像から空間に存在するガス雲の像の時間周波数成分を抽出してより精度の高いガス雲画像を生成することができる。
可視画像変換部は、画像保持部13からから取得した可視画像を、RGB信号の形式から、CIE(L*,a*,b*)色空間(CIELAB)に対応するL*、a*、b*信号の形式に、変換して、画像合成部16に出力する。RGB信号からL*a*bへの変換は、先ず、公知の変換式によりRGB値をXYZ値に変換し、XYZ値を公知の変換式を用いてL*a*bへ変換することにより行う。
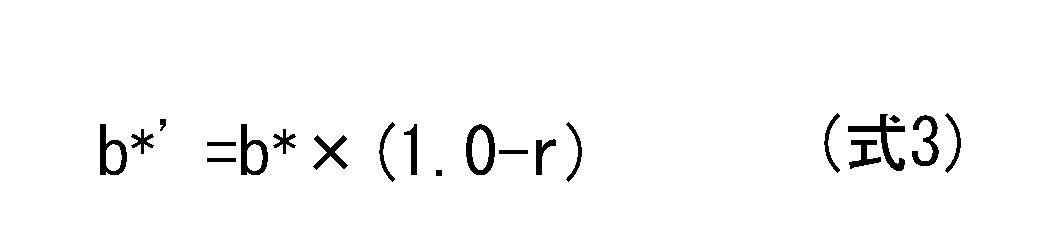
画像合成部16は、可視画像変換部から取得した可視画像上に、ガス領域抽出部14により抽出されたガス領域の情報を重畳したガス雲重畳画像を生成する。ガス領域の情報は、例えば、ガス量を色情報に変換し、ガスが検知された位置に色情報をマッピングすることで示される。具体的には、可視画像を構成するチャネルをR、G、B、可視画像のCIELABに対応するチャネルを、L*、a*、b*、赤外線画像から抽出したガス量に基づく識別情報としてガス雲画像の画素値をS(S=0~255)、可視画像に対する前記ガス雲画像との重畳割合をr(r=0~1)としたとき、ガス雲重畳画像における色空間を示すチャネルを、L*´、a*´、b*´は、式1から式3により算出される。


式1では、ガス雲画像の画素値Sと、CIELABのうち明度を表すL*値とを、画素毎に、重畳割合rと(1-r)とを乗じて重み付け加算を行うことにより両者を合成して、合成信号のL*´を生成する。可視画像をL*、a*、b*のチャネルに変換して明度とガス雲画像を重畳することにより、ガス雲画像と可視画像とをより看者の感覚に近く表現することができる。
可視画像のa*値、b*値は、(1-r)を乗じて、重畳割合rの増加に伴い減少する関係を有する、合成信号a*´、b*´を生成する。すなわち、画像合成部は、可視画像に対するガス雲画像との重畳割合rが大きいほど、ガス雲重畳画像の彩度が低くなるように、可視画像とガス雲画像を重ね合わせる構成を採る。
これより、可視画像を、色空間を示すチャネルに変換して、ガス雲画像の重畳割合rを増加したとき可視画像の彩度を低下させることにより、ガスの濃度が薄い場合にも、可視画像に対しガス雲画像をより見やすく表示することができる。一方、ガス雲画像の重畳割合rを減少したとき可視画像の彩度を増加させることにより、赤外線画像におけるガス存在範囲が大きい場合に、ガス雲画像に対し可視画像をより見やすく表示することができる。
また、ガス雲画像の画素値Sを、
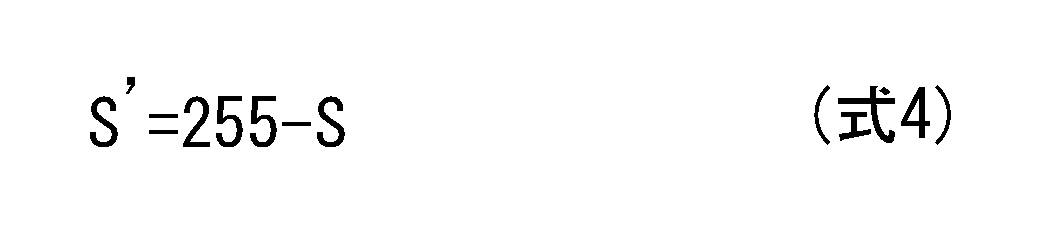
により、反転させて、Sに替えて反転画素値S´を用いて、式1から式3によりL*´、a*´、b*´を算出してもよい。画像合成部16は、生成されたガス雲重畳画像を表示画像変換部17に出力する。
表示画像変換部17は、画像合成部16から取得したガス雲重畳画像を、L*´、a*´、b*´の信号形式から表示画像のRGB信号の形式に変換して、表示部40に出力して表示させる。これより、ガス雲重畳画像をR、G、Bのチャネルに変換して、表示画像を生成することができる。
なお、L*、a*、b*信号の形式に変換する替わりに、CIE(L*,u*,v*)色空間(CIELUV)に対応するL*、u*、v*信号の形式に変換する構成としてもよい。
<その他の構成>
表示部40は、例えば、液晶ディスプレイ、有機ELディスプレイなどの表示装置(モニタ)である。警報機であってもよい。
表示部40は、例えば、液晶ディスプレイ、有機ELディスプレイなどの表示装置(モニタ)である。警報機であってもよい。
操作入力部30は、例えば、キーボード、マウス、トラックボールなどの入力装置である。
なお、表示部40と操作入力部30は、タッチパネルやタブレットなどの、表示装置と入力装置を兼ねた1つの装置として実現されてもよい。
例えば、操作入力部30を用いて、操作者は可視画像にガス雲画像を重ね合わせる際の重畳割合rを入力することができる。これより、検査者は検査画像から抽出したガス雲画像の濃度を増減することにより、ガス雲画像の態様や可視画像に適合させて、ガスの有無やどこから漏れているか判断しやすいように表示することが可能となる。
記憶部50は、画像処理装置10が動作するために必要なガス可視化画像処理プログラムなどを記憶している他、制御部CTの計算結果を一時的に格納する一時記憶領域としての機能を有する。記憶部50は、例えばDRAMなどの揮発性メモリ、及び、例えばハードディスクなどの不揮発性メモリを含んで構成される。
<動 作>
以下、図面を用いて、本実施の形態1におけるガス可視化画像処理装置10の動作について説明する。
以下、図面を用いて、本実施の形態1におけるガス可視化画像処理装置10の動作について説明する。
図3は、画像処理装置10における処理の概要を示す画像処置の流れを示す図である。
画像処理装置10では、まず、可視画像取得部12を介して検査対象を撮像した可視画像を取得し(ステップS1)、可視画像を画像保持部13に保存する。そして、可視画像変換部により可視画像をRGB信号の形式からL*、a*、b*信号の形式に変換する(ステップS2)。
次に、画像処理装置10は、検査画像取得部11を介して検査対象を撮像した検査画像を取得し(ステップS3)、取得した可視画像を画像保持部13に保存する。そして、ガス領域抽出部14により、検査対象を撮影した赤外線画像の動画から、ガスによる温度変化を示すガス周波数成分を抽出したガス周波数成分画像を、ガス存在範囲を示すガス雲画像として生成する(ステップS4)。これにより、検査画像から赤外線画像においてガスと判断されるガス存在範囲を抽出する。
次に、画像合成部16により、可視画像上に、抽出されたガス存在領域の情報を重畳したガス雲重畳画像を生成する(ステップS5)。ガス雲重畳画像における合成信号L*´、a*´、b*´は、上述のとおり、式1から式3により算出される。
さらに、表示画像変換部17により、ガス雲重畳画像を、L*´、a*´、b*´の信号形式から、表示画像におけるRGBの信号形式に変換して(ステップS6)、表示画像を表示部40により表示して(ステップS7)、処理を終了する。
<表示画像>
以下、図面を用いて、ガス可視化画像処理装置10の表示画像について、説明する。
以下、図面を用いて、ガス可視化画像処理装置10の表示画像について、説明する。
(画像処理装置10における表示画像の一例)
[画像例1]
図4(a)は、ステップS4において生成される、ガス周波数成分画像の一例である。また、可視画像の背景色が明るい場合には、検査画像を反転してから合成してもよい。図5(a)は、ガス周波数成分画像をネガポジ反転したガス周波数成分反転画像の一例である。検査画像からガスと判断されるガス存在範囲が抽出されていることが見て取れる。
[画像例1]
図4(a)は、ステップS4において生成される、ガス周波数成分画像の一例である。また、可視画像の背景色が明るい場合には、検査画像を反転してから合成してもよい。図5(a)は、ガス周波数成分画像をネガポジ反転したガス周波数成分反転画像の一例である。検査画像からガスと判断されるガス存在範囲が抽出されていることが見て取れる。
図4(b)(c)(d)は、ガス周波数成分画像と可視画像とを、30%、50%、70%の重畳割合にて重畳して生成したガス雲重畳画像に基づく、表示画像の一例である。また、図5(b)(c)(d)は、ガス周波数成分反転画像と可視画像とを、30%、50%、70%の重畳割合にて重畳して生成したガス雲重畳画像に基づく、表示画像の一例である。
このように、可視画像の背景に応じて、ガス周波数成分画像と反転画像を選択することにより、ガス雲をわかりやすく表示できる。また、重畳割合は、ガス雲の濃度などによって変更してもよい。
図4、5(b)(c)(d)によれば、重畳割合の増加に伴い、ガス存在範囲の濃度が増加するとともに、背景の可視画像における彩度(白黒では濃度)が減少していることが見て取れる。
これより、看者は、重畳割合が高い表示画像によりガス存在範囲を示すガス雲画像の絶対的な位置を把握することができる。例えば、ガス雲画像の画素値Sの絶対値が小さい場合にも、重畳割合rを増大することにより、ガス雲画像の位置を把握できる。図4(d)、図5(d)では、後述する図7(c)に示す従来の例と比較すると、ガス存在領域における、ガス雲画像の画素値Sの値が小さくガス雲の濃度が小さい、いわゆる、ハイライト部分が表示され、ガス雲の濃度が低いガス存在領域が表示されていることが見て取れる。
このとき、重畳割合が高い場合には、背景の可視画像における彩度(濃度)が低く表示されることにより、ガス雲画像の位置の把握が容易になる。
さらに、看者は、重畳割合が低い表示画像を用いて、背景の可視画像における彩度(濃度)を増加させて、背景画像に表示されたガス設備におけるガス雲画像の相対的な位置を特定することができる。これより、看者は、ガスの漏洩源の位置を容易に特定することができる。
(従来の画像処理装置における表示画像の例)
[画像例1]
次に、従来の画像処理装置における表示画像について説明する。
[画像例1]
次に、従来の画像処理装置における表示画像について説明する。
図6は、従来のガス可視化画像処理の概要を示す画像処置の流れを示す図である。図6では、図3と同じ処理は同一の番号を付している。
従来のガス可視化画像処理では、検査対象を撮像した可視画像を取得し(ステップS1)、検査対象を撮像した検査画像を取得し(ステップS3)、検査画像の動画から抽出したガス周波数成分画像を、ガス存在範囲を示すガス雲画像として生成する(ステップS4)。
次に、可視画像における、ガス雲画像のガス存在領域の位置に対応する画素の画像情報を、ガス雲画像の画素値Sに対応させた色情報に置き換える置換処理を行い(ステップS5X)、置換画像を表示画像として表示する(ステップS7X)。ここで、ガス雲画像に置き換えるべき色は、ガス雲画像の画素値Sの大きさにより選択され、RGBCMYからなる、いわゆる、純色から選択される構成を採る。例えば、ガス雲画像の画素値Sが50(max255)以上を、ガス雲として表示してもよい。このとき、画素値が大きくなるにつれ、青、水色、緑、黄色、赤(B、C、G、Y、R、M)に連続的に変化するように、画素値ごとに対応付けた色で表示させてもよい。
図7(a)~(c)は、従来のガス可視化画像処理による表示画像の一例であり、(a)は可視画像の一例である。(b)はガス周波数成分画像であり、ガス存在範囲が抽出されていることが見て取れる。(c)は表示画像の一例であり、可視画像における、ガス存在領域が純色(白黒では枠線表示)に置換されていることが見て取れる。図4(d)、図5(d)と比較すると、図4(d)、図5(d)では、ガスと判断できた箇所(破線枠内)が、図7(c)では、薄いガス部分が表示されないため、ガスかどうかこの画像からは判断できない。これより、従来のガス可視化画像処理では、ガス存在領域から、ガス雲画像の画素値Sの値が小さくガス雲の濃度が小さい、いわゆる、ハイライト部分が表示されずに、ガス存在領域から抜け落ちていることが見て取れる。
(画像処理装置10、及び従来の画像処理装置における他の表示画像)
以下、ガス可視化画像処理装置10及び従来の画像処理装置における、他の表示画像について、説明する。
以下、ガス可視化画像処理装置10及び従来の画像処理装置における、他の表示画像について、説明する。
[画像例2]
検査画像に動画像を用いてもよい。
検査画像に動画像を用いてもよい。
図8(a)~(f)は、ガス可視化画像処理装置10による、ガス周波数成分画像の動画像の一例である。破線枠内に示すように、抽出されたガス存在範囲の位置が変化する様子が見て取れる。
図9(a)~(f)は、ガス可視化画像処理装置10による表示画像であって、可視画像に、それぞれ、図8(a)~(f)に示したガス周波数成分画像を重畳したガス雲重畳画像に基づく表示画像の一例である。ガス設備の背景画像上において、抽出されたガス存在範囲の位置が変化する様子が見て取れる。このように、ガス雲重畳画像に動画像を用いることにより、ガスの動きが画像で確認できるため、ガスで設備のどこから出ているか、静止画よりも容易に確認できる。
ここでも、図9(a)~(f)の破線枠内に示すように、後述する図10(a)~(f)に示す従来の例と比較すると、ガス存在領域におけるガス雲の濃度が低いガス存在領域の位置変化が表示されていることが見て取れる。
図10(a)~(f)は、図9(a)~(f)と同一の画像に基づく従来のガス可視化画像処理装置による表示画像であって、可視画像の画像情報を、ガス雲画像に対応する色情報に置き換えた置換画像に基づく表示画像の一例である。このように、図10(a)~(f)の破線枠内では、動画であっても同様に、図9(a)~(f)においてガスと判断できた箇所(破線枠内)が、図10(a)~(f)では薄いガス部分が表示されないため、ガスかどうかこの画像からは判断できない。これより、従来のガス可視化画像処理では、ガス存在領域から、ガス雲の濃度が小さいハイライト部分が表示されずに抜け落ちていることが見て取れる。
[画像例3]
図11(a)~(f)は、ガス可視化画像処理装置10による、ガス周波数成分画像の動画像の別の一例であり、画像取得手段20(赤外線カメラ、可視カメラ)の振動によるノイズや草木の揺れによるノイズなどがある場合の例である。破線枠内に示すように、抽出されたガス存在範囲の位置が変化する様子が見て取れる。
図11(a)~(f)は、ガス可視化画像処理装置10による、ガス周波数成分画像の動画像の別の一例であり、画像取得手段20(赤外線カメラ、可視カメラ)の振動によるノイズや草木の揺れによるノイズなどがある場合の例である。破線枠内に示すように、抽出されたガス存在範囲の位置が変化する様子が見て取れる。
図12(a)~(f)は、ガス可視化画像処理装置10による表示画像であって、可視画像に、それぞれ、図11(a)~(f)に示したガス周波数成分画像を重畳したガス雲重畳画像に基づく表示画像の別の一例である。ガス設備の背景画像上において、抽出されたガス存在範囲の位置が変化する様子が見て取れる。ここでも、図12(a)~(f)の破線枠内に示すように、後述する図13(a)~(f)に示す従来の例と比較すると、振動ノイズや草木の揺れによるノイズなどがある場合でも、ガス存在領域におけるガス雲の濃度が低いガス存在領域の位置変化が認識可能に表示されていることが見て取れる。振動の影響で配管のエッジ部(被写体の境界部)等にノイズがあっても、可視のエッジ部分とちょうど重なるため、合成した図12(a)~(f)では、ガス雲だけを視認することができ、ガス存在領域の判断が容易になる。
図13(a)~(f)は、図12(a)~(f)と同一の画像に基づく従来のガス可視化画像処理装置による表示画像であって、可視画像の画像情報を、ガス雲画像に対応する色情報に置き換えた置換画像に基づく表示画像の別の一例である。図13(a)~(f)の破線枠内では、振動ノイズや草木の揺れによるノイズなどがある場合では、図12(a)~(f)と比較すると、ガス存在領域から、ガス雲の濃度が小さいハイライト部分が表示されずに抜け落ちていることが見て取れ、ガス雲が背景のノイズと区別が難しくガス雲の存在がよくわからない。
[画像例4]
図14(a)~(f)は、ガス可視化画像処理装置10による、ガス周波数成分画像の拡大した動画像の別の一例である。破線枠内に示すように、抽出されたガス存在範囲の位置が変化する様子が見て取れる。
図14(a)~(f)は、ガス可視化画像処理装置10による、ガス周波数成分画像の拡大した動画像の別の一例である。破線枠内に示すように、抽出されたガス存在範囲の位置が変化する様子が見て取れる。
図15(a)~(f)は、ガス可視化画像処理装置10による表示画像であって、可視画像に、それぞれ、図14(a)~(f)に示したガス周波数成分画像を重畳したガス雲重畳画像に基づく拡大した表示画像の別の一例である。ガス設備の背景画像上において、抽出されたガス存在範囲の位置が変化する様子が見て取れる。ここでも、図15(a)~(f)の破線枠内に示すように、後述する図16(a)~(f)に示す従来の例と比較すると、ガス存在領域におけるガス雲の濃度が低いガス存在領域の位置変化が表示されているとともに、ガス存在領域と重なった背景部分におけるガス設備の形状が視認可能であることが見て取れる。そのため、ガス存在領域と重なった背景部分が隠れることがなく、どのガス装置のどこから漏れているかなどを把握しやすい。
図16(a)~(f)は、図15(a)~(f)と同一の画像に基づく従来のガス可視化画像処理装置による表示画像であって、可視画像の画像情報を、ガス雲画像に対応する色情報に置き換えた置換画像に基づく拡大した表示画像の別の一例である。このように、拡大した表示画像では、例えば、ガス漏れ規模が大きい場合や、近くから撮影している場合などには、画像の半分にガス雲が映るような場合がある。図16(a)~(f)の破線枠内では、図15(a)~(f)と比較すると、ガス存在領域から、ガス雲の濃度が小さいハイライト部分が表示されずに抜け落ちているとともに、ガス存在領域と重なった背景部分が隠れてしまい、隠れたガス設備の形状が認識できず、どのガス装置のどこから漏れているかなど把握が困難な状態になっていることが見て取れる。
<小 括>
以上のとおり、本実施の形態1に係るガス可視化画像処理装置10は、検査対象を含む空間が可視カメラにより撮像された可視画像と、空間が赤外線カメラにより可視画像と、ほぼ一致している視野範囲について並行して撮像された検査画像とを、それぞれ取得する画像取得部INと、検査画像から空間に存在するガス雲の像を抽出してガス雲画像を生成するガス領域抽出部14と、可視画像とガス雲画像とを重ねて合わせてガス雲重畳画像を生成する画像合成部16と、備えるガス可視化画像処理装置10であって、画像合成部は、ガス雲画像の背景を看者がガス雲重畳画像から認識できるように、対象画像とガス雲画像とを重ね合わせることを特徴とする。
以上のとおり、本実施の形態1に係るガス可視化画像処理装置10は、検査対象を含む空間が可視カメラにより撮像された可視画像と、空間が赤外線カメラにより可視画像と、ほぼ一致している視野範囲について並行して撮像された検査画像とを、それぞれ取得する画像取得部INと、検査画像から空間に存在するガス雲の像を抽出してガス雲画像を生成するガス領域抽出部14と、可視画像とガス雲画像とを重ねて合わせてガス雲重畳画像を生成する画像合成部16と、備えるガス可視化画像処理装置10であって、画像合成部は、ガス雲画像の背景を看者がガス雲重畳画像から認識できるように、対象画像とガス雲画像とを重ね合わせることを特徴とする。
係る構成により、ガスの濃度が薄い場合や、赤外線画像におけるガス存在範囲が大きい場合にも、ガス雲画像と背景の可視画像とを、ガスの有無やどこから漏れているか判断しやすいように表示できるガス可視化画像処理装置、ガス可視化画像処理方法、および、プログラムを提供することを目的とすることができる。これにより、ガス漏れの有無やガス設備のどこからガスが漏れているか否かの判断が容易になる。
<変形例1>
実施の形態1に係る画像処理装置10では、検査対象を撮影した赤外線画像の動画から、ガスによる温度変化を示すガス周波数成分を抽出したガス周波数成分画像を、ガス存在範囲を示すガス雲画像として生成する構成とした(図3のステップS4)。
実施の形態1に係る画像処理装置10では、検査対象を撮影した赤外線画像の動画から、ガスによる温度変化を示すガス周波数成分を抽出したガス周波数成分画像を、ガス存在範囲を示すガス雲画像として生成する構成とした(図3のステップS4)。
しかしながら、変形例1に係る画像処理装置では、ガス領域抽出部14による、検査画像からガスと判断されるガス存在範囲を抽出するための処理方法が実施の形態1の処理方法と相違する。
図17は、画像処理装置10における処理の概要を示す画像処置の流れを示す図である。図6では、図3と同じ処理は同一の番号を付している。
図17に示すように、変形例1に係る画像処理装置では、ステップS4Aにおいて、検査対象を撮影した赤外線画像の動画から、所定のフレーム数だけ離れた時間差分画像を、ガス存在範囲を示すガス雲画像として生成することにより、検査画像から赤外線画像においてガスと判断されるガス存在範囲を抽出する。ステップS4A以外の処理は、図3に示す画像処理装置10と同じ処理であるため、説明を省略する。
以下、図面を用いて、変形例1に係るガス可視化画像処理装置の表示画像について、説明する。
[画像例5]
図18(a)は、ステップS4Aにおいて生成される、検査画像の時間差分画像の一例である。破線枠内に示すように、検査画像からガスと判断されるガス存在範囲が抽出されていることが見て取れる。
図18(a)は、ステップS4Aにおいて生成される、検査画像の時間差分画像の一例である。破線枠内に示すように、検査画像からガスと判断されるガス存在範囲が抽出されていることが見て取れる。
図18(b)(c)(d)は、検査画像の時間差分画像と可視画像とを、30%、50%、70%の重畳割合にて重畳して生成したガス雲重畳画像に基づく、表示画像の一例である。破線枠内に示すように、重畳割合の増加に伴い、ガス存在範囲の濃度が増加するとともに、背景の可視画像における彩度(白黒では濃度)が減少していることが見て取れる。
ここでも、実施の形態1と同様に、看者は、重畳割合が高い表示画像によりガス存在範囲を示すガス雲画像の絶対的な位置を把握することができる。また、図18(d)では、ガス存在領域における、ガス雲画像の画素値Sの値が小さくガス雲の濃度が小さい、いわゆる、ハイライト部分が表示され、ガス雲の濃度が低いガス存在領域が表示されていることが見て取れる。
ここでも、重畳割合が高い場合には、背景の可視画像における彩度(濃度)が低く表示され、ガス雲画像の位置の把握が容易になる。
さらに、看者は、重畳割合が低い表示画像を用いて、背景の可視画像における彩度(濃度)を増加させて、背景画像に表示されたガス設備におけるガス雲画像の相対的な位置を特定することができる。
以上のとおり、変形例1に係るガス可視化画像処理装置によれば、検査画像の動画像の時間差分処理から前記空間に存在するガス雲の像を抽出してより精度の高いガス雲画像を生成することができる。
[画像例6、7、8]
図19(a)~(f)は、変形例1に係る画像処理装置による、検査画像の時間差分画像の一例である。0.2秒で時間差分を採った画像であり、振動の影響で配管のエッジ部(被写体の境界部)等にノイズがある。図20(a)~(f)は、表示画像であって、可視画像に、それぞれ、図19(a)~(f)に示したガス周波数成分画像を重畳したガス雲重畳画像に基づく表示画像の一例である。
図19(a)~(f)は、変形例1に係る画像処理装置による、検査画像の時間差分画像の一例である。0.2秒で時間差分を採った画像であり、振動の影響で配管のエッジ部(被写体の境界部)等にノイズがある。図20(a)~(f)は、表示画像であって、可視画像に、それぞれ、図19(a)~(f)に示したガス周波数成分画像を重畳したガス雲重畳画像に基づく表示画像の一例である。
図21(a)~(f)は、変形例1に係る画像処理装置による、検査画像の時間差分画像の一例であり、画像取得手段20(赤外線カメラ、可視カメラ)の振動によるノイズや草木の揺れによるノイズなどがある場合の例である。図22(a)~(f)は、可視画像に、それぞれ、図21(a)~(f)に示したガス周波数成分画像を重畳したガス雲重畳画像に基づく表示画像の別の一例である。
図23(a)~(f)は、変形例1に係る画像処理装置による、検査画像の時間差分画像の一例である。図24(a)~(f)は、可視画像に、それぞれ、図23(a)~(f)に示したガス周波数成分画像を重畳したガス雲重畳画像に基づく拡大した表示画像の別の一例である。
図19、21、23(a)~(f)に示す時間差分画像における破線枠内に示すように、抽出されたガス存在範囲の位置が変化する様子が見て取れる。
また、図20(a)~(f)に示すガス雲重畳画像における破線枠内に示すように、ガス設備の背景画像上において、抽出されたガス存在範囲の位置が変化する様子が見て取れ、ガス存在領域におけるガス雲の濃度が低いガス存在領域の位置変化が表示されているとともに、ガス存在領域と重なった背景部分におけるガス設備の形状が視認可能であることが見て取れる。そのため、図19(a)~(f)に示すように、振動の影響で配管のエッジ部(被写体の境界部)等にノイズがあっても、可視のエッジ部分とちょうど重なるため、合成した図20(a)~(f)では、ガス雲だけを視認することができ、ガス存在領域の判断が容易になる。
また、図22(a)~(f)に示すガス雲重畳画像における破線枠内に示すように、画像取得手段20(赤外線カメラ、可視カメラ)の振動ノイズや草木の揺れによるノイズなどがある場合でも、ガス雲が背景のノイズと区別ができガス雲の存在が認識できる。
さらに、図24(a)~(f)に示すガス雲重畳画像における破線枠内に示すように、画像の半分にガス雲が映るような場合でも、ガス存在領域と重なった背景部分が隠れることがなく、どのガス装置のどこから漏れているかなどを把握しやすい。
≪実施の形態2≫
実施の形態1に係る画像処理装置10では、可視画像を、RGB信号の形式から、L*、a*、b*信号の形式に変換し、画像合成部16は、変換された可視画像上にガス領域の情報を重畳したガス雲重畳画像を生成する構成とした。
実施の形態1に係る画像処理装置10では、可視画像を、RGB信号の形式から、L*、a*、b*信号の形式に変換し、画像合成部16は、変換された可視画像上にガス領域の情報を重畳したガス雲重畳画像を生成する構成とした。
しかしながら、実施の形態2に係る画像処理装置では、RGB信号からなる可視画像上にガス領域の情報を重畳したガス雲重畳画像を生成する点で実施の形態1と相違する。
図25は、実施の形態2に係るガス可視化画像処理システム1Aとする場合がある)の概略構成図である。図25に示すように、画像処理装置10Aを構成する制御部CTは、検査画像取得部11、可視画像取得部12、画像保持部13、ガス領域抽出部14、画像合成部16Aを有し、このうち、画像合成部16A以外の構成は、図1に示す画像処理装置10と同じであるため、同一の番号を付して説明を省略する。また、画像処理装置10Aは、実施の形態1における可視画像変換部、表示画像変換部17を有していない。
画像合成部16Aは、可視画像変換部12から取得したRGB信号からなる可視画像上に、ガス領域抽出部14により抽出されたガス領域の情報を重畳したガス雲重畳画像を生成する。ガス領域の情報は、例えば、ガス量を色情報に変換し、ガスが検知された位置に色情報をマッピングすることで示される。具体的には、可視画像の信号の値とし、赤外線画像から抽出したガス量に基づく識別情報としてガス雲画像の画素値をS(S=0~255)、重畳割合をr(r=0~1)としたとき、合成信号R´、G´、B´は、式5から式7により算出される。
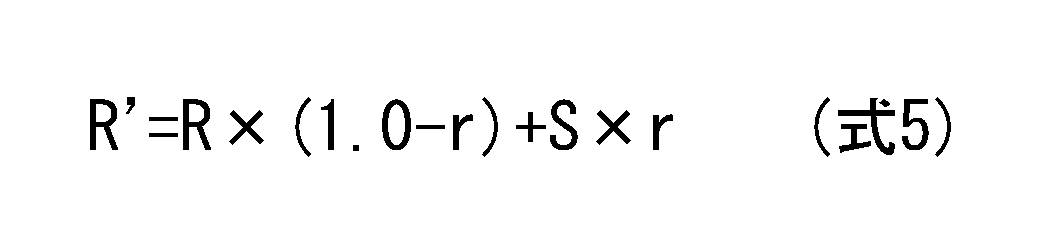
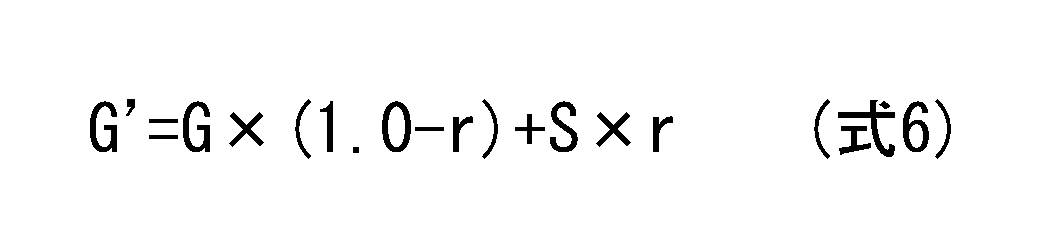

また、ガス雲画像の画素値Sを、式4により、反転させて、反転画素値S´を用いて式5から式7により合成信号R´、G´、B´を算出してもよい。画像合成部16は、生成されたガス雲重畳画像を表示部40に出力して表示させる。
なお、式5から式7の何れかを選択的に用いて、RGBの一部のチャンネルに処理するような形態としてもよい。
図26は、画像処理装置10Aにおける処理の概要を示す画像処置の流れを示す図である。図26では、図3と同じ処理は同一の番号を付している。
図26に示すように、画像処理装置10Aでは、ステップS4Bにおいて、検査対象を撮影した赤外線画像の動画から、ガスによる温度変化を示すガス周波数成分を抽出したガス周波数成分画像を、ガス存在範囲を示すガス雲画像として生成するか、あるいは、所定のフレーム数だけ離れた時間差分画像を生成し、その時間差分画像を、ガス存在範囲を示すガス雲画像として生成することにより、検査画像から赤外線画像においてガスと判断されるガス存在範囲を抽出するかの何れかの処理を行う。ステップS5Bでは、画像合成部16Aにより、式5から式7により、可視画像上に抽出されたガス存在領域の情報を重畳してガス雲重畳画像の信号R´、G´、B´を生成、ガス雲重畳画像からなる表示画像を表示部40により表示して(ステップS7)、処理を終了する。ステップS4B、S5B以外の処理は、図3に示す画像処理装置10と同じ処理であるため、説明を省略する。
以下、図面を用いて、変形例1に係るガス可視化画像処理装置の表示画像について、説明する。
[画像例9、10]
図27(a)は、ステップS4Bにおいて生成される、ガス周波数成分画像の一例である。また、図28(a)は、ガス周波数成分画像をネガポジ反転したガス周波数成分反転画像の一例である。破線枠内に示すように、検査画像からガスと判断されるガス存在範囲が抽出されていることが見て取れる。
図27(a)は、ステップS4Bにおいて生成される、ガス周波数成分画像の一例である。また、図28(a)は、ガス周波数成分画像をネガポジ反転したガス周波数成分反転画像の一例である。破線枠内に示すように、検査画像からガスと判断されるガス存在範囲が抽出されていることが見て取れる。
図27(b)は、ガス周波数成分画像と可視画像とを、50%の重畳割合にて重畳して生成したガス雲重畳画像に基づく、表示画像の一例である。また、図28(b)は、ガス周波数成分反転画像と可視画像とを、50%の重畳割合にて重畳して生成したガス雲重畳画像に基づく、表示画像の一例である。破線枠内に示すように、ガス存在領域における、ガス雲画像の画素値Sの値が小さくガス雲の濃度が小さい、いわゆる、ハイライト部分が表示され、ガス雲の濃度が低いガス存在領域が表示されていることが見て取れる。
[画像例11]
図29(a)は、ステップS4Bにおいて生成される、検査画像の時間差分画像の一例である。破線枠内に示すように、検査画像からガスと判断されるガス存在範囲が抽出されていることが見て取れる。
図29(a)は、ステップS4Bにおいて生成される、検査画像の時間差分画像の一例である。破線枠内に示すように、検査画像からガスと判断されるガス存在範囲が抽出されていることが見て取れる。
図29(b)(c)は、検査画像の時間差分画像と可視画像とを、30%、50%の重畳割合にしたときの表示画像の一例である。破線枠内に示すように、重畳割合の増加に伴い、ガス存在範囲の濃度が増加するとともに、背景の可視画像における彩度(白黒では濃度)が減少していることが見て取れる。
ここでも、実施の形態1と同様に、看者は、重畳割合が高い表示画像によりガス存在範囲を示すガス雲画像の絶対的な位置を把握することができる。この際、重畳割合が高い場合には、背景の可視画像における彩度(濃度)が低く表示され、ガス雲画像の位置の把握が容易になる。
さらに、看者は、重畳割合が低い表示画像を用いて、背景の可視画像における彩度(濃度)を増加させて、背景画像に表示されたガス設備におけるガス雲画像の相対的な位置を特定することができる。
<小 括>
以上のとおり、本実施の形態2に係るガス可視化画像処理装置10Aは、前記画像合成部は、前記可視画像を構成するR、G、Bのチャネル、又はR、G、Bの一部のチャネルに前記ガス雲画像を重ね合わせることにより、前記ガス雲重畳画像を生成することを特徴とする。
以上のとおり、本実施の形態2に係るガス可視化画像処理装置10Aは、前記画像合成部は、前記可視画像を構成するR、G、Bのチャネル、又はR、G、Bの一部のチャネルに前記ガス雲画像を重ね合わせることにより、前記ガス雲重畳画像を生成することを特徴とする。
係る構成により、実施の形態1と同様に、ガスの濃度が薄い場合や、赤外線画像におけるガス存在範囲が大きい場合にも、ガス雲画像と背景の可視画像とを、ガスの有無やどこから漏れているか判断しやすいように表示することができる。
≪その他の変形例≫
以上、実施の形態に係るガス可視化画像処理装置を説明したが、本開示は、その本質的な特徴的構成要素を除き、以上の実施の形態に何ら限定を受けるものではない。例えば、実施の形態に対して当業者が思いつく各種変形を施して得られる形態や、本発明の趣旨を逸脱しない範囲で各実施の形態における構成要素及び機能を任意に組み合わせることで実現される形態も本開示に含まれる。以下では、そのような形態の一例として、上記した実施の形態の変形例を説明する。
以上、実施の形態に係るガス可視化画像処理装置を説明したが、本開示は、その本質的な特徴的構成要素を除き、以上の実施の形態に何ら限定を受けるものではない。例えば、実施の形態に対して当業者が思いつく各種変形を施して得られる形態や、本発明の趣旨を逸脱しない範囲で各実施の形態における構成要素及び機能を任意に組み合わせることで実現される形態も本開示に含まれる。以下では、そのような形態の一例として、上記した実施の形態の変形例を説明する。
(1)上記した実施の形態では、検査画像は、赤外線カメラにより撮像された赤外線画像を例として記載したが、可視画像から前記空間に存在するガス雲の像を抽出してガス雲画像を生成する構成としてもよい。この場合、可視画像をグレーに変換し、同じ処理を適応すると、白く見える水蒸気等のガスを抽出することができる。これにより、水蒸気等の着色ガスの濃度が薄い場合や、可視画像における水蒸気等の存在範囲が大きい場合にも、水蒸気等のガス雲画像と背景の可視画像とを、水蒸気等の有無やどこから漏れているか判断しやすいように表示できる処理方法を実現できる。
(2)上記した実施の形態では、背景画像を可視画像としたが、可視画像はカラーでなく、グレーの画像であってもよい。
(3)上記した実施の形態では、検査画像の一例として、ガス設備としてガスプラントを例示して説明を行った。しかしながら、本開示はこれに限定されるものではなく、ガスを利用する機器、装置、実験室、研究室、工場、事業所における表示画像の生成に適用してもよい。
(4)本開示を上記実施の形態に基づいて説明してきたが、本開示は、上記の実施の形態に限定されず、以下のような場合も本発明に含まれる。
例えば、本発明は、マイクロプロセッサとメモリを備えたコンピュータシステムであって、上記メモリは、上記コンピュータプログラムを記憶しており、上記マイクロプロセッサは、上記コンピュータプログラムにしたがって動作するとしてもよい。例えば、本開示のシステム又はその構成要素における処理のコンピュータプログラムを有しており、このプログラムに従って動作する(又は接続された各部位に動作を指示する)コンピュータシステムであってもよい。
また、上記システム又はその構成要素における処理の全部、もしくは一部を、マイクロプロセッサ、ROM、RAM等の記録媒体、ハードディスクユニットなどから構成されるコンピュータシステムで構成した場合も本発明に含まれる。上記RAM又はハードディスクユニットには、上記各装置と同様の動作を達成するコンピュータプログラムが記憶されている。上記マイクロプロセッサが、上記コンピュータプログラムにしたがって動作することにより、各装置はその機能を達成する。
また、上記の各装置を構成する構成要素の一部又は全部は、1つのシステムLSI(Large scale Integration(大規模集積回路))から構成されているとしてもよい。システムLSIは、複数の構成部を1個のチップ上に集積して製造された超多機能LSIであり、具体的には、マイクロプロセッサ、ROM、RAMなどを含んで構成されるコンピュータシステムである。これらは個別に1チップ化されてもよいし、一部又は全てを含むように1チップ化されてもよい。上記RAMには、上記各装置と同様の動作を達成するコンピュータプログラムが記憶されている。上記マイクロプロセッサが、上記コンピュータプログラムにしたがって動作することにより、システムLSIは、その機能を達成する。例えば、システム又はその構成要素における処理がLSIのプログラムとして格納されており、このLSIがコンピュータ内に挿入され、所定のプログラムを実施する場合も本発明に含まれる。
なお、集積回路化の手法はLSIに限るものではなく、専用回路または汎用プロセッサで実現してもよい。LSI製造後に、プログラムすることが可能なFPGA(Field Programmable Gate Array)や、LSI内部の回路セルの接続や設定を再構成可能なリコンフィギュラブル・プロセッサー(Reconfigurable Processor)を利用してもよい。
さらには、半導体技術の進歩または派生する別技術によりLSIに置き換わる集積回路化の技術が登場すれば、当然、その技術を用いて機能ブロックの集積化を行ってもよい。
また、各実施の形態に係る、システム又はその構成要素の機能の一部又は全てを、CPU等のプロセッサがプログラムを実行することにより実現してもよい。システム又はその構成要素の動作を実施させるプログラムが記録された非一時的なコンピュータ読み取り可能な記録媒体であってもよい。プログラムや信号を記録媒体に記録して移送することにより、プログラムを独立した他のコンピュータシステムにより実施するとしてもよい。また、上記プログラムは、インターネット等の伝送媒体を介して流通させることができるのは言うまでもない。
また、上記実施形態に係るシステム又はその各構成要素は、CPUやGPU(Graphics Processing Unit)やプロセッサなどのプログラマブルデバイスとソフトウェアにより実現される構成であってもよい。これらの構成要素は一個の回路部品とすることができるし、複数の回路部品の集合体にすることもできる。また、複数の構成要素を組合せて一個の回路部品とすることができるし、複数の回路部品の集合体にすることもできる。
(5)機能ブロックの分割は一例であり、複数の機能ブロックを一つの機能ブロックとして実現したり、一つの機能ブロックを複数に分割したり、一部の機能を他の機能ブロックに移してもよい。また、類似する機能を有する複数の機能ブロックの機能を、単一のハードウェア又はソフトウェアが並列又は時分割に処理してもよい。
また、上記のステップが実行される順序は、本発明を具体的に説明するために例示するためのものであり、上記以外の順序であってもよい。また、上記ステップの一部が、他のステップと同時(並列)に実行されてもよい。
また、各実施の形態、及びその変形例の機能のうち少なくとも一部を組み合わせてもよい。更に上記で用いた数字は、全て本発明を具体的に説明するために例示するものであり、本発明は例示された数字に制限されない。
≪まとめ≫
以上のとおり、本実施の形態に係るガス可視化画像処理装置は、検査対象を含む空間が可視カメラにより撮像された可視画像と、前記空間が赤外線カメラにより前記可視画像と並行して撮像された検査画像とを、それぞれ取得する画像取得部と、前記検査画像から前記空間に存在するガス雲の像を抽出してガス雲画像を生成するガス領域抽出部と、前記可視画像と前記ガス雲画像とを重ねて合わせてガス雲重畳画像を生成する画像合成部とを備えるガス可視化画像処理装置であって、前記画像合成部は、前記ガス雲画像の背景を看者が前記ガス雲重畳画像から認識できるように、前記対象画像と前記ガス雲画像とを重ね合わせることを特徴とする。また、前記背景は、前記ガス雲画像と重ね合わせられた前記検査対象の像である構成としてもよい。
以上のとおり、本実施の形態に係るガス可視化画像処理装置は、検査対象を含む空間が可視カメラにより撮像された可視画像と、前記空間が赤外線カメラにより前記可視画像と並行して撮像された検査画像とを、それぞれ取得する画像取得部と、前記検査画像から前記空間に存在するガス雲の像を抽出してガス雲画像を生成するガス領域抽出部と、前記可視画像と前記ガス雲画像とを重ねて合わせてガス雲重畳画像を生成する画像合成部とを備えるガス可視化画像処理装置であって、前記画像合成部は、前記ガス雲画像の背景を看者が前記ガス雲重畳画像から認識できるように、前記対象画像と前記ガス雲画像とを重ね合わせることを特徴とする。また、前記背景は、前記ガス雲画像と重ね合わせられた前記検査対象の像である構成としてもよい。
係る構成により、ガスの濃度が薄い場合や、赤外線画像におけるガス存在範囲が大きい場合にも、ガス雲画像と背景の可視画像とを、ガスの有無やどこから漏れているか判断しやすいように表示できる。これにより、ガス漏れの有無やガス設備のどこからガスが漏れているか否かの判断が容易になる。
また、別の態様では、上記の何れかの態様において、前記画像合成部は、前記可視画像を構成するR、G、Bのチャネルを、所定の色空間を示すチャネルに変換し、得られた明度を示すチャネルに前記ガス雲画像を重ね合わせることにより、前記ガス雲重畳画像を生成する構成としてもよい。
係る構成により、可視画像を、色空間を示すチャネルに変換して、明度とガス雲画像を重畳することにより、ガス雲画像と可視画像とをより看者の感覚に近く表現することが可能となる。
また、別の態様では、上記の何れかの態様において、前記画像合成部は、前記可視画像に対する前記ガス雲画像との重畳割合が大きいほど、前記ガス雲重畳画像の彩度が低くなるように、前記可視画像と前記ガス雲画像を重ね合わせる構成としてもよい。
係る構成により、可視画像を、色空間を示すチャネルに変換して、ガス雲画像の重畳割合rを増加したとき可視画像の彩度を低下させることにより、ガスの濃度が薄い場合にも、可視画像に対しガス雲画像をより見やすく表示することができる。一方、ガス雲画像の重畳割合rを減少したとき可視画像の彩度を増加させることにより、赤外線画像におけるガス存在範囲が大きい場合に、ガス雲画像に対し可視画像をより見やすく表示することができる。
また、別の態様では、上記の何れかの態様において、前記可視画像から変換された所定の色空間を示すチャネルを、L*、a*、b*、前記ガス雲画像における濃度を示す画素値をS、前記重畳割合をr、前記ガス雲重畳画像における、前記所定の色空間を示すチャネルを、L*´、a*´、b*´としたとき、前記ガス雲重畳画像は、

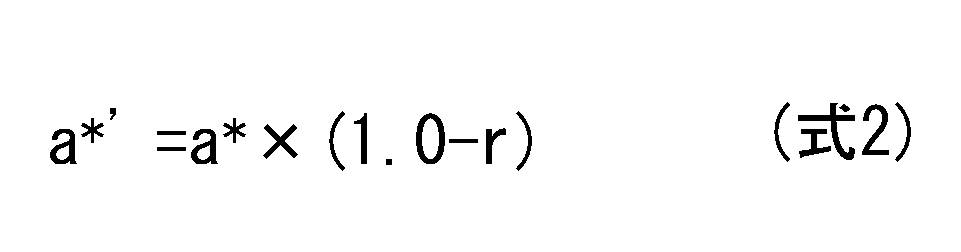

により算出される構成としてもよい。
係る構成により、可視画像をL*、a*、b*のチャネルに変換してガス雲画像と重畳することにより、ガスの有無やどこから漏れているか判断しやすいように表示が可能なガス雲重畳画像を生成することができる。
また、別の態様では、上記の何れかの態様において、さらに、前記ガス雲重畳画像を、所定の色空間を示すチャネルからR、G、Bを示すチャネルからなる表示画像に変換する表示画像変換部を備えた構成としてもよい。
係る構成により、ガス雲重畳画像をR、G、Bのチャネルに変換して、表示画像を生成することができる。
また、別の態様では、上記の何れかの態様において、前記画像合成部は、前記可視画像を構成するR、G、Bのチャネル、又はR、G、Bの一部のチャネルに前記ガス雲画像を重ね合わせることにより、前記ガス雲重畳画像を生成する構成としてもよい。
係る構成により、可視画像を構成するR、G、Bのチャネルの信号を活用して、ガス雲画像と背景の可視画像とを、ガスの有無やどこから漏れているか判断しやすいように表示することができる。
また、別の態様では、上記の何れかの態様において、前記画像合成部は、前記ガス雲画像を白黒反転する変換処理をしたのち、前記可視画像に重ね合わせる構成としてもよい。
係る構成により、可視画像の背景色が明るい場合や暗い場合に応じて、検査画像を選択的に反転してから合成することにより、検査画像からガスと判断されるガス存在範囲を可視画像に適合させて、ガスの有無やどこから漏れているか判断しやすいように表示するこ
とができる。
とができる。
また、別の態様では、上記の何れかの態様において、さらに、ガス像の白黒反転をするかどうかの操作入力を受け付ける操作入力部を備えた構成としてもよい。
係る構成により、可視画像の背景色の明度に応じて、検査者は検査画像を選択的に反転してから合成することができる。
また、別の態様では、上記の何れかの態様において、さらに、前記重畳割合の操作入力を受け付ける操作入力部を備える構成としてもよい。
係る構成により、操作入力部を用いて、操作者は可視画像にガス雲画像を重ね合わせる際の重畳割合rを入力することができる。これより、検査者は検査画像から抽出したガス雲画像の濃度を増減することにより、ガス雲画像の態様や可視画像に適合させて、ガスの有無やどこから漏れているか判断しやすいように表示することができる。
また、別の態様では、上記の何れかの態様において、前記検査画像は、複数のフレームからなる動画像であり、前記ガス雲画像は、前記検査画像から所定の時間周波数成分を抽出する処理を行った画像である構成としてもよい。
係る構成により、動画像から前記空間に存在するガス雲の像の時間周波数成分を抽出してより精度の高いガス雲画像を生成することができる。
また、別の態様では、上記の何れかの態様において、前記検査画像は、複数のフレームからなる動画像であり、前記ガス雲画像は、前記検査画像から所定の時間差分処理を行った画像である構成としてもよい。
係る構成により、動画像の時間差分処理から前記空間に存在するガス雲の像のを抽出してより精度の高いガス雲画像を生成することができる。
また、別の態様では、上記の何れかの態様において、検査対象を含む空間が可視カメラにより撮像された可視画像を取得する画像取得部と、前記可視画像から前記空間に存在するガス雲の像を抽出してガス雲画像を生成するガス領域抽出部と、前記可視画像と前記ガス雲画像とを重ねて合わせてガス雲重畳画像を生成するガス雲重畳画像部を備えたガス可視化画像処理装置であって、前記ガス雲重畳画像部は、前記ガス雲画像の背景を看者が前記ガス雲重畳画像から認識できるように、前記対象画像と前記ガス雲画像とを重ね合わせる構成としてもよい。
係る構成により、水蒸気等の着色ガスの濃度が薄い場合や、可視画像における水蒸気等の存在範囲が大きい場合にも、水蒸気等のガス雲画像と背景の可視画像とを、水蒸気等の有無やどこから漏れているか判断しやすいように表示できる処理方法を実現できる。
また、本実施の形態に係るガス可視化画像処理方法は、検査対象を含む空間が可視カメラにより撮像された可視画像と、前記空間が赤外線カメラにより前記可視画像と並行して撮像された検査画像とを、それぞれ取得し、前記検査画像から前記空間に存在するガス雲の像を抽出してガス雲画像を生成し、前記可視画像と前記ガス雲画像とを重ねて合わせてガス雲重畳画像を生成するガス可視化画像処理方法であって、前記ガス雲重畳画像を生成する処理は、前記ガス雲画像の背景を看者が前記ガス雲重畳画像から認識できるように、前記対象画像と前記ガス雲画像とを重ね合わせることを特徴とする。
係る構成により、ガスの濃度が薄い場合や、赤外線画像におけるガス存在範囲が大きい場合にも、ガス雲画像と背景の可視画像とを、ガスの有無やどこから漏れているか判断しやすいように表示できる処理方法を実現できる。
また、別の態様では、上記の何れかの態様において、検査対象を含む空間が可視カメラにより撮像された可視画像を取得し、前記可視画像から前記空間に存在するガス雲の像を抽出してガス雲画像を生成し、前記可視画像と前記ガス雲画像とを重ねて合わせてガス雲重畳画像を生成するガス可視化画像処理方法であって、前記ガス雲重畳画像を生成する処理では、前記ガス雲画像の背景を看者が前記ガス雲重畳画像から認識できるように、前記対象画像と前記ガス雲画像とを重ね合わせる構成としてもよい。
係る構成により、水蒸気等のガス雲画像と背景の可視画像とを、水蒸気等の有無やどこから漏れているか判断しやすいように表示できる処理方法を実現できる。
また、本実施の形態に係るプログラムは、コンピュータにガス可視化画像処理を行わせるプログラムであって、前記ガス可視化画像処理は、検査対象を含む空間が可視カメラにより撮像された可視画像と、前記空間が赤外線カメラにより前記可視画像と並行して撮像された検査画像とを、それぞれ取得し、前記可視画像から前記空間に存在するガス雲の像を抽出してガス雲画像を生成し、前記可視画像と前記ガス雲画像とを重ねて合わせてガス雲重畳画像を生成するガス可視化画像処理方法であって、前記ガス雲重畳画像を生成する処理では、前記ガス雲画像の背景を看者が前記ガス雲重畳画像から認識できるように、前記対象画像と前記ガス雲画像とを重ね合わせることを特徴とする。
また、本実施の形態に係るプログラムは、コンピュータにガス可視化画像処理を行わせるプログラムであって、前記ガス可視化画像処理は、検査対象を含む空間が可視カメラにより撮像された可視画像を取得し、前記可視画像から前記空間に存在するガス雲の像を抽出してガス雲画像を生成し、前記可視画像と前記ガス雲画像とを重ねて合わせてガス雲重畳画像を生成するガス可視化画像処理方法であって、前記ガス雲重畳画像を生成する処理では、前記ガス雲画像の背景を看者が前記ガス雲重畳画像から認識できるように、前記対象画像と前記ガス雲画像とを重ね合わせる構成としてもよい。
係る構成により、ガス雲画像と背景の可視画像とを、ガスの有無やどこから漏れているか判断しやすいように表示できるプログラムを提供できる。
≪補足≫
以上で説明した実施の形態は、いずれも本発明の好ましい一具体例を示すものである。実施の形態で示される数値、構成要素、構成要素の配置位置及び接続形態、処理方法、処理の順序などは一例であり、本発明を限定する主旨ではない。また、実施の形態における構成要素のうち、本発明の最上位概念を示す独立請求項に記載されていないものについては、より好ましい形態を構成する任意の構成要素として説明される。
以上で説明した実施の形態は、いずれも本発明の好ましい一具体例を示すものである。実施の形態で示される数値、構成要素、構成要素の配置位置及び接続形態、処理方法、処理の順序などは一例であり、本発明を限定する主旨ではない。また、実施の形態における構成要素のうち、本発明の最上位概念を示す独立請求項に記載されていないものについては、より好ましい形態を構成する任意の構成要素として説明される。
また、上記の方法が実行される順序は、本発明を具体的に説明するために例示するためのものであり、上記以外の順序であってもよい。また、上記方法の一部が、他の方法と同時(並列)に実行されてもよい。
また、発明の理解の容易のため、上記各実施の形態で挙げた各図の構成要素の縮尺は実際のものと異なる場合がある。また本発明は上記各実施の形態の記載によって限定されるものではなく、本発明の要旨を逸脱しない範囲において適宜変更可能である。
本開示に係るガス可視化画像処理装置、ガス可視化画像処理方法、および、プログラムは、ガス設備のガス漏れを検査に用いるシステムに広く適用可能である。
1 ガス検知システム
10 ガス可視化画像処理装置
11 検査画像取得部
12 可視画像取得部
13 画像保持部
14 ガス領域抽出部
15 画像合成部
16 表示制御部
20 画像取得手段
21 検査画像生成部(赤外線カメラ)
22 可視画像生成部(可視カメラ)
30 操作入力部
40 表示部
300 検査対象
IN 画像取得部
CT 制御部
10 ガス可視化画像処理装置
11 検査画像取得部
12 可視画像取得部
13 画像保持部
14 ガス領域抽出部
15 画像合成部
16 表示制御部
20 画像取得手段
21 検査画像生成部(赤外線カメラ)
22 可視画像生成部(可視カメラ)
30 操作入力部
40 表示部
300 検査対象
IN 画像取得部
CT 制御部
Claims (17)
- 検査対象を含む空間が可視カメラにより撮像された可視画像と、前記空間が赤外線カメラにより前記可視画像と並行して撮像された検査画像とを、それぞれ取得する画像取得部と、
前記検査画像から前記空間に存在するガス雲の像を抽出してガス雲画像を生成するガス領域抽出部と、
前記可視画像と前記ガス雲画像とを重ねて合わせてガス雲重畳画像を生成する画像合成部とを備えるガス可視化画像処理装置であって、
前記画像合成部は、前記ガス雲画像の背景を看者が前記ガス雲重畳画像から認識できるように、前記対象画像と前記ガス雲画像とを重ね合わせる
ガス可視化画像処理装置。 - 前記背景は、前記ガス雲画像と重ね合わせられた前記検査対象の像である
請求項1に記載のガス可視化画像処理装置。 - 前記画像合成部は、前記可視画像を構成するR、G、Bのチャネルを、所定の色空間を示すチャネルに変換し、得られた明度を示すチャネルに前記ガス雲画像を重ね合わせることにより、前記ガス雲重畳画像を生成する
請求項1又は2に記載のガス可視化画像処理装置。 - 前記画像合成部は、前記可視画像に対する前記ガス雲画像との重畳割合が大きいほど、前記ガス雲重畳画像の彩度が低くなるように、前記可視画像と前記ガス雲画像を重ね合わせる
請求項3に記載のガス可視化画像処理装置。 - 前記可視画像から変換された所定の色空間を示すチャネルを、L*、a*、b*、
前記ガス雲画像における濃度を示す画素値をS、
前記重畳割合をr、
前記ガス雲重畳画像における、前記所定の色空間を示すチャネルを、L*´、a*´、b*´としたとき、
前記ガス雲重畳画像は、

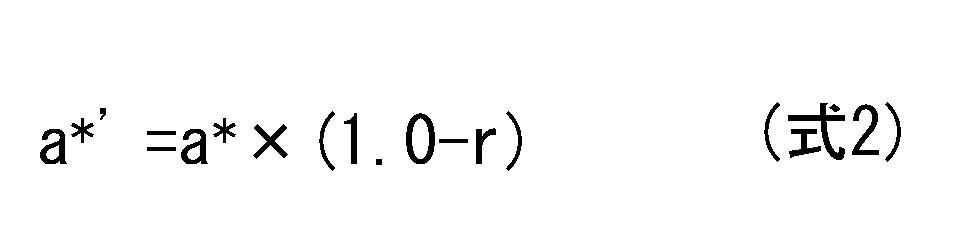
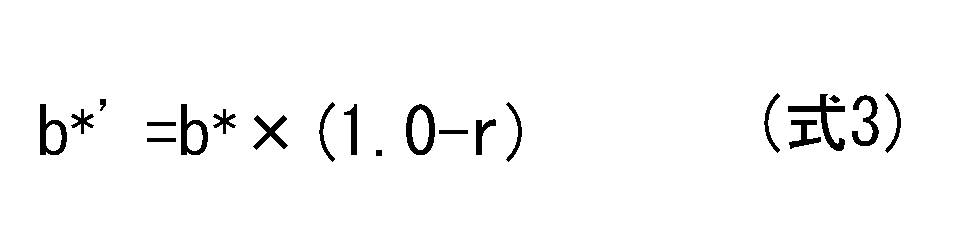
請求項4に記載のガス可視化画像処理装置。 - さらに、前記ガス雲重畳画像を、所定の色空間を示すチャネルからR、G、Bを示すチャネルからなる表示画像に変換する表示画像変換部を備えた
請求項3~5の何れか1項に記載のガス可視化画像処理装置。 - 前記画像合成部は、前記可視画像を構成するR、G、Bのチャネル、又はR、G、Bの一部のチャネルに前記ガス雲画像を重ね合わせることにより、前記ガス雲重畳画像を生成する
請求項1又は2に記載のガス可視化画像処理装置。 - 前記画像合成部は、前記ガス雲画像を白黒反転する変換処理をしたのち、前記可視画像に重ね合わせる
請求項1~7の何れか1項に記載のガス可視化画像処理装置。 - さらに、ガス像の白黒反転をするかどうかの操作入力を受け付ける操作入力部を備えた
請求項8に記載のガス可視化画像処理装置。 - さらに、前記重畳割合の操作入力を受け付ける操作入力部を備える
請求項4又は5に記載のガス可視化画像処理装置。 - 前記検査画像は、複数のフレームからなる動画像であり、
前記ガス雲画像は、前記検査画像から所定の時間周波数成分を抽出する処理を行った画像である
請求項1~10の何れか1項に記載のガス可視化画像処理装置。 - 前記検査画像は、複数のフレームからなる動画像であり、
前記ガス雲画像は、前記検査画像から所定の時間差分処理を行った画像である
請求項1~11の何れか1項に記載のガス可視化画像処理装置。 - 検査対象を含む空間が可視カメラにより撮像された可視画像を取得する画像取得部と、
前記可視画像から前記空間に存在するガス雲の像を抽出してガス雲画像を生成するガス領域抽出部と、
前記可視画像と前記ガス雲画像とを重ねて合わせてガス雲重畳画像を生成するガス雲重畳画像部を備えたガス可視化画像処理装置であって、
前記ガス雲重畳画像部は、前記ガス雲画像の背景を看者が前記ガス雲重畳画像から認識できるように、前記対象画像と前記ガス雲画像とを重ね合わせる、
ガス可視化画像処理装置。 - 検査対象を含む空間が可視カメラにより撮像された可視画像と、前記空間が赤外線カメラにより前記可視画像と並行して撮像された検査画像とを、それぞれ取得し、
前記検査画像から前記空間に存在するガス雲の像を抽出してガス雲画像を生成し、
前記可視画像と前記ガス雲画像とを重ねて合わせてガス雲重畳画像を生成するガス可視化画像処理方法であって、
前記ガス雲重畳画像を生成する処理は、前記ガス雲画像の背景を看者が前記ガス雲重畳画像から認識できるように、前記対象画像と前記ガス雲画像とを重ね合わせる
ガス可視化画像処理方法。 - 検査対象を含む空間が可視カメラにより撮像された可視画像を取得し、
前記可視画像から前記空間に存在するガス雲の像を抽出してガス雲画像を生成し、
前記可視画像と前記ガス雲画像とを重ねて合わせてガス雲重畳画像を生成するガス可視化画像処理方法であって、
前記ガス雲重畳画像を生成する処理では、前記ガス雲画像の背景を看者が前記ガス雲重
畳画像から認識できるように、前記対象画像と前記ガス雲画像とを重ね合わせるガス可視化画像処理方法。 - コンピュータにガス可視化画像処理を行わせるプログラムであって、
前記ガス可視化画像処理は、
検査対象を含む空間が可視カメラにより撮像された可視画像と、前記空間が赤外線カメラにより前記可視画像と並行して撮像された検査画像とを、それぞれ取得し、
前記可視画像から前記空間に存在するガス雲の像を抽出してガス雲画像を生成し、
前記可視画像と前記ガス雲画像とを重ねて合わせてガス雲重畳画像を生成するガス可視化画像処理方法であって、
前記ガス雲重畳画像を生成する処理では、前記ガス雲画像の背景を看者が前記ガス雲重畳画像から認識できるように、前記対象画像と前記ガス雲画像とを重ね合わせる
プログラム。 - コンピュータにガス可視化画像処理を行わせるプログラムであって、
前記ガス可視化画像処理は、
検査対象を含む空間が可視カメラにより撮像された可視画像を取得し、
前記可視画像から前記空間に存在するガス雲の像を抽出してガス雲画像を生成し、
前記可視画像と前記ガス雲画像とを重ねて合わせてガス雲重畳画像を生成するガス可視化画像処理方法であって、
前記ガス雲重畳画像を生成する処理では、前記ガス雲画像の背景を看者が前記ガス雲重畳画像から認識できるように、前記対象画像と前記ガス雲画像とを重ね合わせる
プログラム。
Applications Claiming Priority (2)
| Application Number | Priority Date | Filing Date | Title |
|---|---|---|---|
| JP2020163785 | 2020-09-29 | ||
| JP2020-163785 | 2020-09-29 |
Publications (1)
| Publication Number | Publication Date |
|---|---|
| WO2022070943A1 true WO2022070943A1 (ja) | 2022-04-07 |
Family
ID=80950243
Family Applications (1)
| Application Number | Title | Priority Date | Filing Date |
|---|---|---|---|
| PCT/JP2021/034061 Ceased WO2022070943A1 (ja) | 2020-09-29 | 2021-09-16 | ガス可視化画像処理装置、ガス可視化画像処理方法、および、プログラム |
Country Status (1)
| Country | Link |
|---|---|
| WO (1) | WO2022070943A1 (ja) |
Cited By (3)
| Publication number | Priority date | Publication date | Assignee | Title |
|---|---|---|---|---|
| CN116228618A (zh) * | 2023-05-04 | 2023-06-06 | 中科三清科技有限公司 | 一种基于图像识别的气象云图处理系统及方法 |
| JP2023170389A (ja) * | 2022-05-19 | 2023-12-01 | 株式会社タナカ技研 | 情報出力装置、撮影装置、情報出力方法、及びプログラム |
| CN119353613A (zh) * | 2024-12-25 | 2025-01-24 | 北京环拓科技有限公司 | 基于气云成像的voc气体泄漏智能巡检系统和方法 |
Citations (7)
| Publication number | Priority date | Publication date | Assignee | Title |
|---|---|---|---|---|
| CN201322680Y (zh) * | 2008-11-17 | 2009-10-07 | 浙江红相科技有限公司 | 激光成像sf6气体泄漏定位系统 |
| JP2010230596A (ja) * | 2009-03-27 | 2010-10-14 | Tokyo Electric Power Co Inc:The | 地中配管ガスリーク調査方法 |
| JP2016161396A (ja) * | 2015-03-02 | 2016-09-05 | コニカミノルタ株式会社 | 流体検知装置 |
| WO2016143754A1 (ja) * | 2015-03-09 | 2016-09-15 | コニカミノルタ株式会社 | ガス漏れ位置推定装置、ガス漏れ位置推定システム、ガス漏れ位置推定方法及びガス漏れ位置推定プログラム |
| WO2019187446A1 (ja) * | 2018-03-30 | 2019-10-03 | ソニー株式会社 | 画像処理装置、画像処理方法、画像処理プログラムおよび移動体 |
| WO2020021785A1 (ja) * | 2018-07-25 | 2020-01-30 | コニカミノルタ株式会社 | ガス検出装置、ガス検出方法、表示制御方法、およびプログラム |
| JP2020128908A (ja) * | 2019-02-08 | 2020-08-27 | コニカミノルタ株式会社 | ガス漏れ位置特定システム及びガス漏れ位置特定プログラム |
-
2021
- 2021-09-16 WO PCT/JP2021/034061 patent/WO2022070943A1/ja not_active Ceased
Patent Citations (7)
| Publication number | Priority date | Publication date | Assignee | Title |
|---|---|---|---|---|
| CN201322680Y (zh) * | 2008-11-17 | 2009-10-07 | 浙江红相科技有限公司 | 激光成像sf6气体泄漏定位系统 |
| JP2010230596A (ja) * | 2009-03-27 | 2010-10-14 | Tokyo Electric Power Co Inc:The | 地中配管ガスリーク調査方法 |
| JP2016161396A (ja) * | 2015-03-02 | 2016-09-05 | コニカミノルタ株式会社 | 流体検知装置 |
| WO2016143754A1 (ja) * | 2015-03-09 | 2016-09-15 | コニカミノルタ株式会社 | ガス漏れ位置推定装置、ガス漏れ位置推定システム、ガス漏れ位置推定方法及びガス漏れ位置推定プログラム |
| WO2019187446A1 (ja) * | 2018-03-30 | 2019-10-03 | ソニー株式会社 | 画像処理装置、画像処理方法、画像処理プログラムおよび移動体 |
| WO2020021785A1 (ja) * | 2018-07-25 | 2020-01-30 | コニカミノルタ株式会社 | ガス検出装置、ガス検出方法、表示制御方法、およびプログラム |
| JP2020128908A (ja) * | 2019-02-08 | 2020-08-27 | コニカミノルタ株式会社 | ガス漏れ位置特定システム及びガス漏れ位置特定プログラム |
Cited By (3)
| Publication number | Priority date | Publication date | Assignee | Title |
|---|---|---|---|---|
| JP2023170389A (ja) * | 2022-05-19 | 2023-12-01 | 株式会社タナカ技研 | 情報出力装置、撮影装置、情報出力方法、及びプログラム |
| CN116228618A (zh) * | 2023-05-04 | 2023-06-06 | 中科三清科技有限公司 | 一种基于图像识别的气象云图处理系统及方法 |
| CN119353613A (zh) * | 2024-12-25 | 2025-01-24 | 北京环拓科技有限公司 | 基于气云成像的voc气体泄漏智能巡检系统和方法 |
Similar Documents
| Publication | Publication Date | Title |
|---|---|---|
| WO2022070943A1 (ja) | ガス可視化画像処理装置、ガス可視化画像処理方法、および、プログラム | |
| EP2022844B1 (en) | Observing device | |
| CN101874401B (zh) | 用于测量物体活力的单芯片图像传感器 | |
| US5606413A (en) | Real time spectroscopic imaging system and method | |
| US20160247266A1 (en) | Gas visualization arrangements, devices, and methods | |
| JP6468439B2 (ja) | ガス検知用画像処理装置、ガス検知用画像処理方法及びガス検知用画像処理プログラム | |
| JP7294343B2 (ja) | ガス検出装置、情報処理装置およびプログラム | |
| JP2012519896A5 (ja) | ||
| EP3809362A1 (en) | Image processing device, image processing method, and image sensor | |
| CN103778621B (zh) | 对外来物体碎片的识别方法 | |
| US9170339B2 (en) | Radiation measurement apparatus | |
| US20180307024A1 (en) | Method for generating a reflection-reduced contrast image and corresponding device | |
| TWI843820B (zh) | 使用多種波長之光單色成像的顏色檢查方法 | |
| WO2022163671A1 (ja) | データ処理装置、方法及びプログラム並びに光学素子、撮影光学系及び撮影装置 | |
| JPH0830765A (ja) | 水域モニタリングシステム | |
| US20240121363A1 (en) | Modular infrastructure inspection platform | |
| US9558551B2 (en) | Image measurement apparatus and image measurement method for determining a proportion of positive cell nuclei among cell nuclei included in a pathologic examination specimen | |
| WO2019058863A1 (ja) | ガス検知用画像処理装置、ガス検知用画像処理方法、及び、ガス検知用画像処理プログラム | |
| JP2021046938A (ja) | 判定システム | |
| JP7156291B2 (ja) | ガス検査レポート作成支援装置、ガス検査レポート作成支援方法、及び、ガス検査レポート作成支援プログラム | |
| JPWO2022270355A5 (ja) | ||
| JP2014109562A (ja) | 色彩輝度表示装置および色彩輝度表示方法 | |
| Ciaccio et al. | Color masking improves classification of celiac disease in videocapsule endoscopy images | |
| US20240070920A1 (en) | Image processing device, image processing method, and image processing program | |
| JP2013127380A (ja) | 放射線測定装置 |
Legal Events
| Date | Code | Title | Description |
|---|---|---|---|
| 121 | Ep: the epo has been informed by wipo that ep was designated in this application |
Ref document number: 21875245 Country of ref document: EP Kind code of ref document: A1 |
|
| NENP | Non-entry into the national phase |
Ref country code: DE |
|
| 122 | Ep: pct application non-entry in european phase |
Ref document number: 21875245 Country of ref document: EP Kind code of ref document: A1 |
|
| NENP | Non-entry into the national phase |
Ref country code: JP |