WO2022054253A1 - 情報処理装置及びプログラム - Google Patents
情報処理装置及びプログラム Download PDFInfo
- Publication number
- WO2022054253A1 WO2022054253A1 PCT/JP2020/034566 JP2020034566W WO2022054253A1 WO 2022054253 A1 WO2022054253 A1 WO 2022054253A1 JP 2020034566 W JP2020034566 W JP 2020034566W WO 2022054253 A1 WO2022054253 A1 WO 2022054253A1
- Authority
- WO
- WIPO (PCT)
- Prior art keywords
- distribution
- value
- input parameter
- input
- range
- Prior art date
- Legal status (The legal status is an assumption and is not a legal conclusion. Google has not performed a legal analysis and makes no representation as to the accuracy of the status listed.)
- Ceased
Links
Images




Classifications
-
- G—PHYSICS
- G06—COMPUTING OR CALCULATING; COUNTING
- G06F—ELECTRIC DIGITAL DATA PROCESSING
- G06F17/00—Digital computing or data processing equipment or methods, specially adapted for specific functions
- G06F17/10—Complex mathematical operations
- G06F17/15—Correlation function computation including computation of convolution operations
-
- G—PHYSICS
- G06—COMPUTING OR CALCULATING; COUNTING
- G06F—ELECTRIC DIGITAL DATA PROCESSING
- G06F17/00—Digital computing or data processing equipment or methods, specially adapted for specific functions
- G06F17/10—Complex mathematical operations
- G06F17/18—Complex mathematical operations for evaluating statistical data, e.g. average values, frequency distributions, probability functions, regression analysis
Definitions
- the present invention relates to an information processing device and a program.
- Patent Document 1 discloses a technique for obtaining probability distribution data using a convolution operation.
- the convolution operation and the calculus operation are defined for continuous functions and cannot be applied to discrete data such as distributions and histograms extracted from actual big data.
- the present invention is an information processing apparatus, the acquisition unit for acquiring the first input distribution of the first input parameter and the second input distribution of the second input parameter, the first input parameter, and the second input parameter.
- the acquisition unit for acquiring the first input distribution of the first input parameter and the second input distribution of the second input parameter, the first input parameter, and the second input parameter.
- the value of the distribution of the first input parameter corresponding to the first value included in the input parameter range which is a range determined based on the first input distribution and the second input distribution, and the first.
- the size of the second subregion corresponding to the first subregion included in the input parameter range, and the size of the first subregion is provided with a generation unit for obtaining the value of the distribution with respect to the first value.
- Another embodiment of the present invention is an information processing apparatus, wherein the first input distribution of the first input parameter, the acquisition unit for acquiring the second input distribution of the second input parameter, and the first input distribution are described.
- a post-change distribution is generated by adding the unit change amount of the second input distribution, and after the minute change corresponding to the minute change amount smaller than the unit change amount based on the first input distribution and the post-change distribution. It is provided with a generation unit that generates a distribution.
- a computer is provided with an acquisition unit for acquiring a first input distribution of a first input parameter and a second input distribution of a second input parameter, the first input parameter and the second input parameter.
- the setting unit for setting the first partial area including the first value, and the range composed of the first input parameter and the second input parameter.
- the value of the distribution of the first input parameter corresponding to the first value included in the input parameter range which is a range determined based on the first input distribution and the second input distribution, and the first value.
- the computer is subjected to the acquisition unit for acquiring the first input distribution of the first input parameter and the second input distribution of the second input parameter, and the first input distribution to the second input distribution.
- the post-change distribution is generated by adding the unit change amount of, and based on the first input distribution and the post-change distribution, the post-change distribution corresponding to the minute change amount smaller than the unit change amount is generated. It is a program to function as a generator.
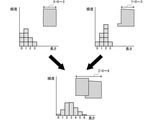
- the upper left graph of FIG. 17 is the probability distribution of the first component
- the upper right graph of FIG. 17 is the probability distribution of the second component. From these probability distributions, the graph at the bottom of FIG. 17 is obtained as the probability distribution of the third component.
- the dimension Z of the third component is +2 in the following three combinations.
- Equation 1 the sum of these three probabilities is the probability that the dimension Z of the third component becomes +2. It is assumed that the correlation coefficient can be regarded as zero.
- P (2) 3 * 0.1 * 0.1 + 4 * 0.1 * 3 * 0.1 + 2 * 0.1 * 1 * 0.1... (Equation 1)
- the two graphs shown at the top of FIG. 18 are probability distributions when X and Y are random, that is, when the correlation coefficient can be regarded as zero.
- the graph shown at the bottom of FIG. 18 is the same graph as the graph shown at the bottom of FIG.
- the graph on the upper left of FIG. 18 and the graph on the upper right of FIG. 18 should both have the same probability distribution as the graph at the bottom of FIG. 18, but both have different probability distributions. In this way, when the operation of individual data is performed, the probability distribution is different for each combination of data, and the distribution cannot be guaranteed.
- FIG. 19A shows a case where the position in the x direction of the moving body and the velocity (x, v) are acquired n times by the recognition sensor, and n positions after t seconds are obtained by the calculation of (Equation 2).
- y x + v * t... (Equation 2)
- FIG. 19B shows all the missing combinations in FIG. 19A.
- a maximum of n ** 3 combinations is required.
- the maximum combination occurs when the correlation coefficient is close to 0, for example, a vehicle located at x (i) and having a speed v (k) has a speed v (0) one second later. This is a case where the variation is in the range of ⁇ v (n). In reality, it is unlikely that the velocity v (k) will fluctuate significantly, and it is presumed that it is limited to a certain range around v (k).
- the probability distribution calculation is a calculation method in which the probability of occurrence of these combinations is incorporated as a probability distribution by reflecting the influence of the correlation coefficient as necessary to obtain the result.
- the probability distribution operation is a method of interpolating the information of combinations that are missing in the numerical operation of individual data.
- the deficiency increases, which is considered to be the reason why Monte Carlo simulation and the like do not guarantee the probability value.
- FIG. 1 is a block diagram showing a configuration of the information processing apparatus 100 of the present embodiment.
- the information processing apparatus 100 includes a control unit 110, a storage unit 120, a UI unit 130, and a communication unit 140.
- the control unit 110 includes a CPU, ROM, RAM, etc. (not shown), and controls each unit of the information processing apparatus 100 by executing various programs recorded in the ROM or the like by the CPU using the RAM or the like.
- the control unit 110 may be composed of a single chip or may be composed of a plurality of chips. Further, in the control unit 110, an ASIC may be adopted instead of the CPU. Further, in the control unit 110, the CPU and other processing circuits such as ASIC and GPU may operate in cooperation with each other.
- the storage unit 120 is, for example, a hard disk, and stores various information and various programs.
- the communication unit 140 includes a communication interface circuit for communicating with other devices connected to the information processing device 100 by wire or wirelessly according to various communication protocols.
- the UI unit 130 includes a touch panel type display, various keys, switches, and the like.
- the control unit 110 of this embodiment performs an operation on two or more input parameters and obtains an output parameter.
- the input parameter has a variation, that is, a distribution in its value
- the output parameter also has a distribution in its value. That is, both the input parameter and the output parameter have a range in their values, and the distribution value corresponding to the parameter in the width of the parameter is obtained.
- the value of the distribution is a value whose integral value is a probability value.
- x and y are obtained from the input parameters x and y to obtain the distribution of the output parameter z will be described as an example.
- the distribution of x and the distribution of y are input distributions, respectively, and the distribution of z is an output distribution.
- the two or more input parameters are all one-dimensional parameters.
- the control unit 110 processes parameters having such a distribution. Specifically, the control unit 110 performs the above processing by executing the calculation program 111 and functioning as the acquisition unit 112, the setting unit 113, the generation unit 114, and the output processing unit 115. In the following, the processing described as being performed by each functional unit is a processing performed by the control unit 110 by executing the arithmetic program 111.
- the acquisition unit 112 acquires two input parameters. Specifically, the acquisition unit 112 acquires two input parameters via, for example, the communication unit 140.
- the setting unit 113 sets the distribution range of the output parameter based on the distribution range of each of the two input parameters. Then, the setting unit 113 sets each value of the output parameter within the range of the distribution of the output parameter as the processing target, and sets the first subregion with respect to the value of the processing target.
- the first subregion is the width of the output parameter set to obtain the probability value corresponding to the value of the output parameter. It is assumed that the first partial area is set in advance.
- the generation unit 114 obtains the probability value at each value of the output parameter based on the first subregion.
- the generation unit 114 obtains the distribution of the output parameter from the probability value for all the values within the range of the output parameter.
- the output processing unit 115 outputs the distribution of output parameters. The processing of each function will be described in detail later.
- FIG. 2 is a flowchart showing an arithmetic process executed by the control unit 110 of the information processing apparatus 100.
- FIG. 3 is an explanatory diagram of the addition process.
- the operation process will be described by taking as an example the case where the operation obtains z by adding “x + y”.
- the operation process will be described by taking as an example the case where the operation obtains z by adding “x + y”.
- the z-axis is set in parallel with the x-axis on the same plane as the two-dimensional plane.
- Both x and y have a distribution (variation) with respect to the parameters shown on each axis.
- z obtained from x and y also has a distribution.
- the distribution of x and y corresponds to the input distribution
- the distribution of z corresponds to the output distribution.
- the distribution of x is shown as graph 201 with the direction perpendicular to the x-axis and opposite to the y-axis as a plus.
- the distribution of y is shown as a graph 202 with the direction perpendicular to the y-axis and opposite to the z-axis as a plus.
- the distribution of z is shown as graph 203 with the direction perpendicular to the z-axis and opposite to the y-axis as a plus.
- the distribution of z extends to a value larger than the maximum value of the distribution of x.
- the distribution values at x, y, and z are shown as Px, Py, and Pz, respectively.
- the distribution of z is obtained from the distribution of x and the distribution of y.
- the acquisition unit 112 acquires the distribution of the input parameters, that is, the distribution of x and the distribution of y (step S100).
- the setting unit 113 sets a range of combinations of x and y, that is, an input parameter range 220, based on the range 211 of the distribution of x and the range 212 of the distribution of y (step S102).
- the setting unit 113 sets a range including all combinations of x and y, which are values of z, as an input parameter range.
- the correlation coefficient is zero.
- the range in the two-dimensional plane of x and y, and the range of the maximum area determined from the range of the distribution of x and the range of the distribution of y is set as the input parameter range 220.
- the setting unit 113 sets the z distribution range 213 based on the x distribution range 211 and the y distribution range 212 (step S104).
- the value of "x + y" is a constant value on a straight line having a slope of "-1", and the value of x at the point where the straight line intersects the x-axis is the value of z. That is, among the straight lines having a slope of "-1", the value of x at the point where the straight line tangent to the lower left point of the input parameter range 220 and the x-axis intersect is the minimum value of z, and the straight line having a slope of "-1".
- the value of x at the point where the straight line tangent to the upper right point of the input parameter range and the x-axis intersect is the maximum value of z.
- the range 213 of the distribution of z is set on the z-axis shown parallel to the x-axis.
- the generation unit 114 sets the value z k of z (step S106).
- the processing of steps S106 to S112 is a loop processing, and the generation unit 114 sets each value of z as the value z k to be processed in order from the minimum value to the maximum value of z in step S106.
- z k is a numerical value at equal intervals obtained by dividing the minimum value to the maximum value of z by a predetermined number.
- z k may be a value corresponding to the unit of z. For example, when z is a length, a value in units of 1 mm may be used.
- the generation unit 114 sets the first partial region for z k (step S108).
- the generation unit 114 sets the width from z k to z k + 1 as the width dz of the first partial region of z k . That is, the width dz of the first partial region has the same width, that is, the same length regardless of the value of z.
- the generation unit 114 obtains the value of the distribution of z k (step S110).
- the generation unit 114 first sets the second subregion Sij corresponding to the width dz of the first subregion.
- the second partial region Sij is a region in the xy plane, and is a region corresponding to the first partial region.
- the combination of x and y is the combination of x and y whose value is z k .
- the second subregion Sij is enlarged and shown on the lower side of FIG.
- the second partial region Sij has a straight line having a slope “-1” corresponding to z k , a straight line having a slope “-1” corresponding to “z k + dz”, and (x). It is a rectangular area surrounded by a straight line having a slope "+1" passing through i , y j + dy) and a straight line having a slope "+1" passing through (x i + dx, y j ).
- the straight line having a slope "+1" passing through (x i , y j + dy) and the straight line having a slope "+1" passing through (x i + dx, y j ) are auxiliary for setting the second subregion S ij . It is a line.
- the second subregion Sij is a region within the input parameter range 220, and two straight lines having a slope “-1” at which the output parameter has a constant value and two parallel straight lines intersecting the straight lines. It is an area separated by an auxiliary line.
- Equation 7 can be obtained by substituting (Equation 8) in (Equation 5) and further dividing both sides by dz.
- step S110 the generation unit 114 confirms whether or not the distribution values have been obtained for all z k (step S112). If the unprocessed z k remains (N in step S112), the generation unit 114 returns to step S106, sets the unprocessed z k , and repeats the process.
- the generation unit 114 obtains the distribution value for all z k (Y in step S112), the generation unit 114 generates the z distribution based on the distribution value for each z k (step S114). Specifically, the generation unit 114 generates a continuous z distribution by using the least squares method or the like for the distribution values corresponding to the values of each z k .
- the output processing unit 115 outputs the distribution of z (step S116). Specifically, the output processing unit 115 displays the distribution of z on the display of the UI unit 130. As another example, the output processing unit 115 may transmit the distribution of z to an external device via the network.
- the information processing apparatus 100 of the present embodiment can accurately obtain the calculation results of a plurality of parameters having a distribution.
- the distribution of the input parameters may be continuous or discrete as in the histogram.
- the control unit 110 may interpolate the value of the distribution of the parameter and obtain the distribution of the output parameter by using the parameter after the interpolation as the processing target.
- the distribution of output parameters can be accurately obtained by the arithmetic processing described with reference to FIG. 2 and the like.
- N is an integer of 2 or more
- arithmetic processing when the input parameters x and y are both N-dimensional will be described.
- N is an integer of 2 or more
- two dimensions will be described as an example.
- the two-dimensional parameters of x that is, the two parameters are shown as x1 and x2.
- the two-dimensional parameters of y are referred to as y1 and y2
- the two-dimensional parameters of z are referred to as z1 and z2.
- the second subregion Sij can be converted into a rectangular region Tij . Therefore, as shown in FIG.
- the generation unit 114 obtains the distribution of z based on the z k of (Equation 9) and the rectangular region determined by dz.
- z k (z1 (m), z2 (n))... (Equation 9)
- the x i and y j corresponding to z k are shown by (Equation 10) and (Equation 11), respectively.
- x i (x1 (s), x2 (t))... (Equation 10)
- y j (y1 (q), y2 (r))... (Equation 11)
- the widths dx and dy with respect to the parameter of the corresponding dimension in the operation are equal values, for example, x1 and y1.
- the widths dx and dy corresponding to the parameters that do not correspond in the calculation, such as x1 and x2 may have different values.
- the generation unit 114 sets the input parameter range based on the correlation coefficient. More specifically, the closer the correlation coefficient is to "-1", the smaller the input parameter range is.
- FIG. 6 is a diagram showing the relationship between the correlation coefficient and the input parameter range.
- the input parameter range is the range 310 indicated by the alternate long and short dash line in the figure.
- the correlation coefficient r is set to "+0.6”
- the input parameter range is the range 320 shown by the two-dot chain line in the figure.
- the ranges 310 and 320 are both smaller than the maximum range of the input parameter range 220. By making the input parameter range smaller in this way, the amount of calculation of the value of the distribution of z can be reduced.
- the correlation coefficient is set to a negative value
- the range of z distribution 203 becomes smaller as in distribution 311.
- the range of z distribution 203 does not change as shown in distribution 321.
- the generation unit 114 limits the area range by transforming the input parameter range into a diamond shape.
- the generation unit 114 may reduce the area of the input parameter range according to the correlation coefficient, and the shape of the input parameter range after deformation is not limited to the embodiment.
- the generation unit 114 may limit the input parameter range to an elliptical shape. The process of limiting the input parameter range according to the correlation coefficient as described above can also be applied to the subtraction, multiplication, and division described later.
- FIG. 7 is an explanatory diagram of subtraction.
- an operation for obtaining z by subtracting “xy” will be described as an example.
- the range from the minimum value to the maximum value of "xy” is the range of z distribution.
- the input parameter range is the same in all of the four arithmetic operations.
- the value of "zy" is constant on a straight line having a slope of "+1" in the xy plane. Therefore, as shown in FIG. 7, for z k , all the points of the line segment within the input parameter range among the straight lines having a slope of "+1" passing through the intersection of the dotted line extending from z k and the x axis. That is, the combination of x and y is the combination of x and y that becomes z k .
- the second subregion S ij has a straight line having a slope “+1” corresponding to z k , a straight line having a slope “+1” corresponding to “z k + dz”, and (x i , y j ). It is a rectangular area surrounded by a straight line having a slope "-1" passing through and a straight line having a slope "+1" passing through (x i , y j + dy).
- the straight line having a slope "-1" passing through (x i , y j ) and the straight line having a slope "+1" passing through (x i , y j + dy) are auxiliary for setting the second subregion S ij .
- the second subregion Sij is a region within the input parameter range, and two straight lines having a slope "-1" at which the output parameter has a constant value and two auxiliary lines that intersect the straight lines and are parallel to each other.
- the area is separated by a line.
- the area aij of the second subregion Sij has the same area as the area bij of the rectangular region Tij . From the above, it can be seen that the value Pz of the distribution at z k can be obtained by (Equation 7) even in subtraction. That is, the generation unit 114 also uses (Equation 7) in the subtraction to obtain the value Pz of the distribution in z k .
- the two hyperbolas are the hyperbola corresponding to z k and the hyperbola corresponding to z k + 1
- the two straight lines having the slope "+1" are the j-th straight line and the j + 1-th straight line.
- Equation 15 holds when m auxiliary lines are set at equal intervals in the input parameter range 220.
- the j-th auxiliary line is represented by (Equation 16).
- da is a constant value.
- y x + ymax-xmin-j * da...
- the i-th hyperbola is represented by (Equation 17).
- the hyperbola corresponding to the minimum value of z k is a hyperbola passing through (xmin, ymin) in the input parameter range 220, and the hyperbola corresponding to the maximum value of z k is (xmax, ymax) in the input parameter range 220. It is a hyperbola that passes through.
- z zmin + i * dz... (Equation 17)
- x i, j , y i, j are represented by (Equation 18).
- (x i, j , y i, j ) ((-(ymax-xmin-j * da) ⁇ ((ymax-xmin-j * da) ** 2 + 4 * (zmin + i * dz))) * * 0.5) / 2, ((ymax-xmin-j * da) ⁇ ((ymax-xmin-j * da) ** 2 + 4 * (zmin + i * dz)) ** 0.5) / 2) ...
- spx i, j and spy i, j are represented by (Equation 19) and (Equation 20), and the areas a i, j of the second subregion S i, j are spx i, j and spy i .
- the areas ai and j of the second subregion Si and j are represented by (Equation 21).
- spx i, j x i + 1, j + 1 -x i, j ...
- spy i, j y i + 1, j -y i, j + 1 ...
- a i, j (spx i, j * spy i, j ) / 2...
- the second subregion S i, j is a range surrounded by the i-th hyperbola, the "i + 1" -th hyperbola, the j-th straight line, and the "j + 1" -th straight line.
- the values of x i, j , y i, j are determined by i, j, and px (x i, j ), Py (y i, j ) can be obtained by interpolating x, y acquired by the input parameters. ..
- the distribution of z can be obtained by summing the values of the distribution of the combination of i and j.
- the right side of (Equation 22) is the addition for j.
- the multiplication of the N-dimensional input parameter and the one-dimensional input parameter will be described.
- the multiplication of the two-dimensional input parameter x and the one-dimensional input parameter y will be described as an example with reference to FIG.
- a two-dimensional z-plane obtained by calculation that is, a two-dimensional plane centered on z1 and z2 is set. Further, the origin O and the x plane are set.
- the x-plane is a two-dimensional plane with x1 and x2 as axes.
- the z plane is divided into a plurality of partial regions, and the partial regions to be processed are z (m, n).
- the generation unit 114 sets the straight line overlapping the x-plane among the straight lines connecting z (m, n) and the origin O as the s-axis. That is, the value of s includes components of x1 and x2.
- the y-axis is set perpendicular to the s-axis, and a hyperbola satisfying z (m, n) in the two-dimensional planes of s and y is set. Then, the generation unit 114 performs the calculation of (Equation 22) at the point on the hyperbola. Thereby, the value of the distribution of z (m, n) can be obtained.
- x is shown as a vertical axis and y is shown as a horizontal axis.
- y is shown as a horizontal axis.
- an operation for obtaining z by division of "x / y" will be described as an example.
- the value of "x / y" is constant on a straight line passing through zero.
- a straight line with a slope of "-1" is set as an auxiliary line, and an area surrounded by two straight lines with a constant "x / y" value and two auxiliary lines with a slope of "-1". Is set as the second subregion.
- the two straight lines with constant "x / y" values are the straight lines corresponding to z k and z k + 1 , and the two straight lines with a slope of "-1" are the j-th straight line and the j + 1-th straight line. Is. These straight lines will be described later.
- the j-th auxiliary line is represented by (Equation 24).
- the i-th straight line corresponding to "x / y" is represented by (Equation 25).
- z k is a value in which one of the distribution ranges of z is equally divided into n pieces.
- dz is a constant value. In the present embodiment, dz has a width equal to "z k + 1 -z k ".
- Equation 27 holds from (Equation 24).
- b (i) * y -y + (ymin + xmin) + j * da ⁇ ⁇ ⁇ (Equation 27)
- x i, j , y i, j are represented by (Equation 28) and (Equation 29), respectively.
- y i, j ((ymin + xmin) + j * da) /
- b (i) +1) ((ymin + xmin) + j * da) / ((i * xmax / ymin + (n-1-i) * xmin / ymax) / (n-1) +1) ...
- the area of the second subregion S i, j is represented by ai, j (Equation 32).
- spxij x (i + 1, j + 1) -x (i, j)...
- spyij y (i, j + 1) -y (i + 1, j)...
- a i, j (spx i, j * spy i, j ) / 2...
- the division of the N-dimensional input parameter and the one-dimensional input parameter will be described.
- the division of the two-dimensional input parameter x and the one-dimensional input parameter y will be described as an example with reference to FIG. In this case, the same processing as the N-dimensional and one-dimensional multiplication in multiplication may be performed.
- the generation unit 114 sets the z-plane and the x-plane, and sets the partial region z (m, n) to be processed on the z-plane.
- the generation unit 114 sets the straight line overlapping the x-plane among the straight lines connecting z (m, n) and the origin O as the s-axis, and sets the y-axis perpendicular to the s-axis.
- the generation unit 114 sets a straight line that satisfies z (m, n) in the two-dimensional planes of s and y. Then, the generation unit 114 performs the calculation of (Equation 22) at the point on this straight line to obtain the probability of z (m, n).
- the acceleration a is integrated to obtain the velocity v.
- the time change of the velocity v can be simulated by creating a distribution (micro distribution) having a minute multiple such as 0.01 times or 0.001 times the acceleration a and adding these to the velocity v.
- the 0.01-fold distribution returns to the original distribution when 100 of them are added, but since the distribution operation is a lossy operation, such a minute-fold distribution cannot be obtained. Therefore, the generation unit 114 of the present embodiment obtains a distribution after the minute change corresponding to the minute change time smaller than the unit change time based on the velocity v1 and v2 after the unit change time of the acceleration a elapses.
- the unit change time is an example of the unit change amount.
- the generation unit 114 first obtains v1 (v 0 + ⁇ ) after the lapse of the change unit time of the acceleration ⁇ from v 0 .
- the change unit time is a change amount unit, and for example, when the unit of the acceleration a is km / h 2 , one hour is the change unit time.
- 1 second is the change unit time.
- the generation unit 114 weighted averages the peak value 401 of the distribution 400 of the velocity v1 and the peak value 411 of the distribution 410 of the velocity v2 to obtain "v 0 + a * dt", that is, the distribution 420 after the minute change. obtain.
- the generation unit 114 evenly divides the velocity distribution up to the peak value before and after the elapse of the change unit time, and divides each point according to the 1: 100 change unit time (for example, when the minute distribution is 0.01 times). 1: 100) Weighted average.
- the generation unit 114 may obtain the distribution after the minute change by weighted averaging the values of the parameters after the division. Further, in the present embodiment, the case where the unit change amount is time has been described as an example, but the unit change amount is not limited to time as long as it is a value that can be used for integration.
- the generation unit 114 may perform an operation by giving a negative correlation coefficient, for example, when performing feedback control. As a result, the calculation result can be converged to a certain value.
- the generation unit 114 can not only obtain the velocity from the acceleration by integration, but also obtain the position from the velocity.
- Each arithmetic expression is represented by (Equation 33) and (Equation 34).
- v v0 + a * dt ⁇ ⁇ ⁇ (Equation 33)
- x x0 + v * dt ⁇ ⁇ ⁇ (Equation 34)
- the generation unit 114 can also perform integration on a parameter having a distribution.
- the control unit 110 further obtains the durability condition of the engine based on the lifetime engine speed. Specifically, the durability condition by stress strength is obtained.
- FIG. 14 is an explanatory diagram of a process for obtaining durability.
- FIG. 14 shows a lifetime rotation speed distribution 500, a Weibull cumulative distribution 510, and a failure distribution 520.
- the horizontal axis of the graph shows the lifetime engine speed (times), the vertical axis shown on the left shows the probability of engine speed, and the vertical axis shown on the right shows the cumulative probability of intensity.
- the lifetime rotation speed distribution 500 obtained by the above (Equation 37) is stress
- the Weibull cumulative distribution 510 is strength.
- the failure distribution 520 is obtained by these integrations.
- the Weibull distribution for achieving a certain failure rate can be determined by the above steps with the failure rate as the target.
- the control unit 110 may refer to the fuel consumption distribution obtained thereby, determine a fuel consumption threshold value, determine that the engine is abnormal if it is equal to or less than the threshold value, and output a warning or the like.
- FIG. 15 is an explanatory diagram of a route simulation. Prior to the explanation, each parameter will be described. Each parameter is as follows.
- the control unit 110 obtains the distribution 602 of the square of the wind speed (Wx 2 , Wy 2 ) from the distribution 600 of the wind speed (Wx, Wy).
- the control unit 110 obtains the distribution 604 of the force (Fx, Fy) received by the ship by (Equation 41).
- Force received by the ship (Fx, Fy) Area receiving wind * Resistance area * Square of wind speed ... (Equation 41)
- control unit 110 adds the propulsive force and the resistance of water to the distribution 604 to obtain the total distribution 606 of the force applied to the ship.
- the control unit 110 obtains the acceleration (ax, ay) distribution 608 by dividing the distribution 606 by the mass.
- the control unit 110 obtains the distribution 610 of the velocity (vx (nt) + ax * dt, vy (nt) + ay * dt) after dt seconds by integration, and further obtains the velocity after a unit time (vx (vx (vx)).
- the distribution 612 of nt), vy (nt)) is obtained.
- the control unit 110 further obtains the next velocity distribution 610 from the velocity distribution 612. In this way, the control unit 110 obtains the time-series data of the speed by performing the iterative calculation.
- the control unit 110 also obtains the distribution 614 of the position (xx (mile) + vx * dt, xy (mile) + vy * dt) after dt seconds by integrating the velocity distribution 612, and further after a unit time.
- the distribution 616 of the position (xx (mile), xy (mile)) of is obtained. Further, the control unit 110 obtains the distribution 614 of the next position from the position distribution 616. In this way, the control unit 110 obtains the time-series data of the position by performing the iterative calculation.
- the velocity squared (vx 2 , vy 2 ) distribution 618 is obtained, and the velocity squared distribution 618 is multiplied by a resistance coefficient to obtain the water resistance.
- This water resistance is used when calculating the total force distribution 606.
- the control unit 110 can predict the time change of the speed and the position in the route.
- FIG. 16 is a diagram showing an example of a display screen displayed on the UI unit 130 by the control unit 110.
- a graph 710 showing the time change of the speed and a graph 720 showing the horizontal position according to the distance are displayed.
- the horizontal axis of the graph 710 shows time, and the vertical axis shows speed.
- Graph 710 shows the time change of each of the upper limit and the lower limit in the velocity distribution obtained by the above calculation.
- the horizontal axis of the graph 720 shows the route distance, and the vertical axis shows the position in the horizontal direction.
- the direction perpendicular to the traveling direction of the route is defined as the lateral direction.
- the graph 720 shows the upper limit, the addition / subtraction, and the average of the positions obtained by the above calculation.
- a 3D graph 730 showing the speed distribution at the selected time is displayed.
- the horizontal axis indicates the left-right direction and the front-back direction
- the vertical axis indicates the probability.
- control unit 110 can predict the speed and position in the route and display such information. Further, since the control unit 110 performs these operations by the distribution operation, the operation result having the distribution can be displayed. As described above, the information processing apparatus 100 of the present embodiment can accurately obtain the calculation results of a plurality of parameters having a distribution.
- the above embodiment is an example for carrying out the present invention, and various other embodiments can be adopted.
- the arithmetic processing may be executed by the cooperation of a plurality of information processing devices.
- some configurations of the above-described embodiments may be omitted, and the order of processing may be changed or omitted.
- both the value of the distribution of the first input parameter and the value of the distribution of the second input parameter are assumed to be values whose integral value of the value of the distribution is a probability value.
- the value of the distribution of each input parameter itself may be a probability value.
- the control unit 110 can use (Equation 42) instead of (Equation 7).
- the value of the distribution of each input parameter may be a frequency instead of a probability value.
- the control unit 110 can use (Equation 43) instead of (Equation 5).
- n is the total number of times.
- control unit 110 may obtain the cumulative Pz'(z k ) of the cumulative probability value or the cumulative frequency of the probability value by (Equation 44) based on the distribution of the probability value, and output this.
- the right side shows the total value of Pz (z k ) from 0 to k.
- the unit length of the output parameter is the length of the width of the first partial region, but the length of the width of the first partial region can be arbitrarily set.
- the length of the width of the first partial region may be longer or shorter than the unit length of z. That is, a gap may be formed between the first partial region of z k + 1 and the first partial region of z k + 1 may overlap with the first partial region of z k + 1. Regardless of which first subregion is used, the probability value at zk can be accurately obtained by multiplying the area of the corresponding second subregion.
- a first partial region of 1 mm is set for z k
- a first partial region of 2 mm is set for z k + 1
- a different first partial region is set for each z k .
- the first partial region may have a width including z k and may have a width centered on z k .
- zk is set at equal intervals when the distribution of z is obtained, but the value of z obtained for obtaining the distribution does not have to be a value at equal intervals. Also in this case, the control unit 110 can obtain the distribution of z by interpolating the probability values for each of the obtained z.
- the control unit 110 performs an operation using the input parameter having the smaller ratio as a numerical value.
- the numerical value in this case may be any value, and examples thereof include an average value, a maximum value, a minimum value, and the like in the range of the input parameter.
- the control unit 110 of the present embodiment has decided to output the distribution of the output parameters, but as another example, it is also possible to obtain the probability value for a predetermined zk and output it without obtaining the distribution. good. For example, when a value of z k is input by the user, the control unit 110 may obtain only the probability value for the z k and output it. Further, the width dz of the first partial region in this case is arbitrary, and may be set according to, for example, a user operation.
- the case where the first input parameter and the second input parameter are calculated as two orthogonal axes has been described as an example, but the calculation method is not limited to the embodiment.
- the first input parameter and the second input parameter may have two axes that are not orthogonal to each other.
- the input parameter range, the first subregion and the second subregion may be represented in the coordinate system.
- the embodiment can be realized as a program or a method.
- the above-mentioned devices, programs, and methods may be realized as a single device or may be realized by using parts provided by a plurality of devices, and include various aspects.
- some of them are software and some of them are hardware, so they can be changed as appropriate.
- the invention is also established as a recording medium for a program that controls a system.
- the recording medium of the program may be a magnetic recording medium or a semiconductor memory, and any recording medium developed in the future can be considered in exactly the same way.
Landscapes
- Engineering & Computer Science (AREA)
- Physics & Mathematics (AREA)
- General Physics & Mathematics (AREA)
- Data Mining & Analysis (AREA)
- Mathematical Optimization (AREA)
- Pure & Applied Mathematics (AREA)
- Theoretical Computer Science (AREA)
- Mathematical Physics (AREA)
- Computational Mathematics (AREA)
- Mathematical Analysis (AREA)
- Algebra (AREA)
- Databases & Information Systems (AREA)
- Software Systems (AREA)
- General Engineering & Computer Science (AREA)
- Computing Systems (AREA)
- Life Sciences & Earth Sciences (AREA)
- Operations Research (AREA)
- Probability & Statistics with Applications (AREA)
- Bioinformatics & Cheminformatics (AREA)
- Evolutionary Biology (AREA)
- Bioinformatics & Computational Biology (AREA)
- Image Processing (AREA)
Priority Applications (3)
| Application Number | Priority Date | Filing Date | Title |
|---|---|---|---|
| JP2022547340A JP7649452B2 (ja) | 2020-09-11 | 2020-09-11 | 情報処理装置及びプログラム |
| PCT/JP2020/034566 WO2022054253A1 (ja) | 2020-09-11 | 2020-09-11 | 情報処理装置及びプログラム |
| US18/022,796 US20230315804A1 (en) | 2020-09-11 | 2020-09-11 | Information processing device and program |
Applications Claiming Priority (1)
| Application Number | Priority Date | Filing Date | Title |
|---|---|---|---|
| PCT/JP2020/034566 WO2022054253A1 (ja) | 2020-09-11 | 2020-09-11 | 情報処理装置及びプログラム |
Publications (1)
| Publication Number | Publication Date |
|---|---|
| WO2022054253A1 true WO2022054253A1 (ja) | 2022-03-17 |
Family
ID=80631418
Family Applications (1)
| Application Number | Title | Priority Date | Filing Date |
|---|---|---|---|
| PCT/JP2020/034566 Ceased WO2022054253A1 (ja) | 2020-09-11 | 2020-09-11 | 情報処理装置及びプログラム |
Country Status (3)
| Country | Link |
|---|---|
| US (1) | US20230315804A1 (https=) |
| JP (1) | JP7649452B2 (https=) |
| WO (1) | WO2022054253A1 (https=) |
Citations (2)
| Publication number | Priority date | Publication date | Assignee | Title |
|---|---|---|---|---|
| JP2001066377A (ja) * | 1999-08-26 | 2001-03-16 | Mitsubishi Electric Corp | 気象システム |
| JP2002082995A (ja) * | 2000-09-07 | 2002-03-22 | Hitachi Ltd | 情報処理装置およびそれにより実行されるプログラムが格納された記録媒体 |
Family Cites Families (1)
| Publication number | Priority date | Publication date | Assignee | Title |
|---|---|---|---|---|
| JP5902607B2 (ja) * | 2012-12-27 | 2016-04-13 | トヨタ自動車株式会社 | 旅行時間情報提供装置、旅行時間情報提供方法 |
-
2020
- 2020-09-11 JP JP2022547340A patent/JP7649452B2/ja active Active
- 2020-09-11 US US18/022,796 patent/US20230315804A1/en active Pending
- 2020-09-11 WO PCT/JP2020/034566 patent/WO2022054253A1/ja not_active Ceased
Patent Citations (2)
| Publication number | Priority date | Publication date | Assignee | Title |
|---|---|---|---|---|
| JP2001066377A (ja) * | 1999-08-26 | 2001-03-16 | Mitsubishi Electric Corp | 気象システム |
| JP2002082995A (ja) * | 2000-09-07 | 2002-03-22 | Hitachi Ltd | 情報処理装置およびそれにより実行されるプログラムが格納された記録媒体 |
Also Published As
| Publication number | Publication date |
|---|---|
| JPWO2022054253A1 (https=) | 2022-03-17 |
| JP7649452B2 (ja) | 2025-03-21 |
| US20230315804A1 (en) | 2023-10-05 |
Similar Documents
| Publication | Publication Date | Title |
|---|---|---|
| Haralick | Propagating covariance in computer vision | |
| JP4866896B2 (ja) | 気象予測装置、気象予測方法および気象予測プログラム | |
| Li et al. | Structural health monitoring of building structures with online data mining methods | |
| Khlamov et al. | The astronomical object recognition and its near-zero motion detection in series of images by in situ modeling | |
| Hu et al. | NSGA-II approach for proper choice of nodes and knots in B-spline curve interpolation | |
| Datta et al. | Simultaneous durability assessment and relative random analysis under base shake loading conditions | |
| JP7437747B2 (ja) | 構造物-流場推定方法、構造物-流場推定プログラム、及び構造物-流場推定システム | |
| CN115423701B (zh) | 铁路场景的三维激光点云数据去噪方法及装置 | |
| US12530759B2 (en) | System and method for point cloud generation | |
| CN120894335B (zh) | 基于深度学习的装备疲劳裂纹智能检测方法及系统 | |
| WO2022054253A1 (ja) | 情報処理装置及びプログラム | |
| US7773814B2 (en) | Multi-scale analysis device | |
| Khlamov et al. | Statistical modeling for the near-zero apparent motion detection of objects in series of images from data stream | |
| Kywe et al. | Scheduling of image processing using anytime algorithm for real-time system | |
| CN116524201B (zh) | 多尺度门控融合单元的特征提取方法、装置、设备及介质 | |
| US5682438A (en) | Method and apparatus for determining a motion vector | |
| Sawada et al. | Network structure detection using convergent cross mapping on multivariate time series | |
| CN116542420A (zh) | 基于改进的era算法的结构真实模态的识别方法及装置 | |
| CN120780956A (zh) | 用于减少在根据对称输入矩阵确定逆矩阵时的计算时间的计算机实现的方法 | |
| CN115345937B (zh) | 三维坐标的确定方法、装置、电子设备及存储介质 | |
| JP2021125035A (ja) | 検知プログラム、検知方法及び検知装置 | |
| Xie et al. | Effective line detection with error propagation | |
| KR102643819B1 (ko) | 접촉 분포 예측 장치 및 그 방법 | |
| CN119378127B (zh) | 改进最大熵法的最大后验船舶波浪载荷可靠性分析方法 | |
| JP2024093351A (ja) | 情報処理装置及びプログラム |
Legal Events
| Date | Code | Title | Description |
|---|---|---|---|
| 121 | Ep: the epo has been informed by wipo that ep was designated in this application |
Ref document number: 20953318 Country of ref document: EP Kind code of ref document: A1 |
|
| ENP | Entry into the national phase |
Ref document number: 2022547340 Country of ref document: JP Kind code of ref document: A |
|
| NENP | Non-entry into the national phase |
Ref country code: DE |
|
| 122 | Ep: pct application non-entry in european phase |
Ref document number: 20953318 Country of ref document: EP Kind code of ref document: A1 |