WO2021251200A1 - プラント監視装置、プラント監視方法およびプログラム - Google Patents
プラント監視装置、プラント監視方法およびプログラム Download PDFInfo
- Publication number
- WO2021251200A1 WO2021251200A1 PCT/JP2021/020739 JP2021020739W WO2021251200A1 WO 2021251200 A1 WO2021251200 A1 WO 2021251200A1 JP 2021020739 W JP2021020739 W JP 2021020739W WO 2021251200 A1 WO2021251200 A1 WO 2021251200A1
- Authority
- WO
- WIPO (PCT)
- Prior art keywords
- abnormality
- value
- plant
- cause
- sensor
- Prior art date
Links
- 238000012806 monitoring device Methods 0.000 title claims description 55
- 238000000034 method Methods 0.000 title claims description 21
- 238000012544 monitoring process Methods 0.000 title claims description 20
- 230000005856 abnormality Effects 0.000 claims abstract description 250
- 238000001514 detection method Methods 0.000 claims abstract description 37
- 230000002159 abnormal effect Effects 0.000 claims abstract description 23
- 238000004364 calculation method Methods 0.000 claims abstract description 20
- 238000011156 evaluation Methods 0.000 description 26
- 239000007789 gas Substances 0.000 description 12
- 239000013598 vector Substances 0.000 description 11
- 238000010586 diagram Methods 0.000 description 8
- 230000006870 function Effects 0.000 description 8
- 239000011159 matrix material Substances 0.000 description 7
- 238000012545 processing Methods 0.000 description 6
- 239000000567 combustion gas Substances 0.000 description 5
- 238000000605 extraction Methods 0.000 description 5
- 238000011084 recovery Methods 0.000 description 5
- XLYOFNOQVPJJNP-UHFFFAOYSA-N water Substances O XLYOFNOQVPJJNP-UHFFFAOYSA-N 0.000 description 5
- 239000000284 extract Substances 0.000 description 3
- 239000000446 fuel Substances 0.000 description 3
- 238000004891 communication Methods 0.000 description 2
- 230000003247 decreasing effect Effects 0.000 description 2
- 230000005611 electricity Effects 0.000 description 2
- 239000010687 lubricating oil Substances 0.000 description 2
- 239000000126 substance Substances 0.000 description 2
- 230000005540 biological transmission Effects 0.000 description 1
- 238000013461 design Methods 0.000 description 1
- 230000000694 effects Effects 0.000 description 1
- 238000012423 maintenance Methods 0.000 description 1
- 239000000203 mixture Substances 0.000 description 1
- 230000003287 optical effect Effects 0.000 description 1
- 238000010248 power generation Methods 0.000 description 1
- 238000007639 printing Methods 0.000 description 1
- 238000004549 pulsed laser deposition Methods 0.000 description 1
- 239000013074 reference sample Substances 0.000 description 1
- 239000000523 sample Substances 0.000 description 1
- 239000004065 semiconductor Substances 0.000 description 1
- 238000004088 simulation Methods 0.000 description 1
- 239000007787 solid Substances 0.000 description 1
Images


Classifications
-
- G—PHYSICS
- G05—CONTROLLING; REGULATING
- G05B—CONTROL OR REGULATING SYSTEMS IN GENERAL; FUNCTIONAL ELEMENTS OF SUCH SYSTEMS; MONITORING OR TESTING ARRANGEMENTS FOR SUCH SYSTEMS OR ELEMENTS
- G05B23/00—Testing or monitoring of control systems or parts thereof
- G05B23/02—Electric testing or monitoring
-
- F—MECHANICAL ENGINEERING; LIGHTING; HEATING; WEAPONS; BLASTING
- F01—MACHINES OR ENGINES IN GENERAL; ENGINE PLANTS IN GENERAL; STEAM ENGINES
- F01D—NON-POSITIVE DISPLACEMENT MACHINES OR ENGINES, e.g. STEAM TURBINES
- F01D25/00—Component parts, details, or accessories, not provided for in, or of interest apart from, other groups
-
- F—MECHANICAL ENGINEERING; LIGHTING; HEATING; WEAPONS; BLASTING
- F02—COMBUSTION ENGINES; HOT-GAS OR COMBUSTION-PRODUCT ENGINE PLANTS
- F02C—GAS-TURBINE PLANTS; AIR INTAKES FOR JET-PROPULSION PLANTS; CONTROLLING FUEL SUPPLY IN AIR-BREATHING JET-PROPULSION PLANTS
- F02C7/00—Features, components parts, details or accessories, not provided for in, or of interest apart form groups F02C1/00 - F02C6/00; Air intakes for jet-propulsion plants
-
- G—PHYSICS
- G05—CONTROLLING; REGULATING
- G05B—CONTROL OR REGULATING SYSTEMS IN GENERAL; FUNCTIONAL ELEMENTS OF SUCH SYSTEMS; MONITORING OR TESTING ARRANGEMENTS FOR SUCH SYSTEMS OR ELEMENTS
- G05B19/00—Programme-control systems
- G05B19/02—Programme-control systems electric
- G05B19/04—Programme control other than numerical control, i.e. in sequence controllers or logic controllers
- G05B19/042—Programme control other than numerical control, i.e. in sequence controllers or logic controllers using digital processors
- G05B19/0428—Safety, monitoring
-
- G—PHYSICS
- G05—CONTROLLING; REGULATING
- G05B—CONTROL OR REGULATING SYSTEMS IN GENERAL; FUNCTIONAL ELEMENTS OF SUCH SYSTEMS; MONITORING OR TESTING ARRANGEMENTS FOR SUCH SYSTEMS OR ELEMENTS
- G05B23/00—Testing or monitoring of control systems or parts thereof
- G05B23/02—Electric testing or monitoring
- G05B23/0205—Electric testing or monitoring by means of a monitoring system capable of detecting and responding to faults
- G05B23/0218—Electric testing or monitoring by means of a monitoring system capable of detecting and responding to faults characterised by the fault detection method dealing with either existing or incipient faults
- G05B23/0224—Process history based detection method, e.g. whereby history implies the availability of large amounts of data
- G05B23/024—Quantitative history assessment, e.g. mathematical relationships between available data; Functions therefor; Principal component analysis [PCA]; Partial least square [PLS]; Statistical classifiers, e.g. Bayesian networks, linear regression or correlation analysis; Neural networks
-
- F—MECHANICAL ENGINEERING; LIGHTING; HEATING; WEAPONS; BLASTING
- F05—INDEXING SCHEMES RELATING TO ENGINES OR PUMPS IN VARIOUS SUBCLASSES OF CLASSES F01-F04
- F05D—INDEXING SCHEME FOR ASPECTS RELATING TO NON-POSITIVE-DISPLACEMENT MACHINES OR ENGINES, GAS-TURBINES OR JET-PROPULSION PLANTS
- F05D2220/00—Application
- F05D2220/30—Application in turbines
- F05D2220/32—Application in turbines in gas turbines
-
- F—MECHANICAL ENGINEERING; LIGHTING; HEATING; WEAPONS; BLASTING
- F05—INDEXING SCHEMES RELATING TO ENGINES OR PUMPS IN VARIOUS SUBCLASSES OF CLASSES F01-F04
- F05D—INDEXING SCHEME FOR ASPECTS RELATING TO NON-POSITIVE-DISPLACEMENT MACHINES OR ENGINES, GAS-TURBINES OR JET-PROPULSION PLANTS
- F05D2260/00—Function
- F05D2260/80—Diagnostics
-
- F—MECHANICAL ENGINEERING; LIGHTING; HEATING; WEAPONS; BLASTING
- F05—INDEXING SCHEMES RELATING TO ENGINES OR PUMPS IN VARIOUS SUBCLASSES OF CLASSES F01-F04
- F05D—INDEXING SCHEME FOR ASPECTS RELATING TO NON-POSITIVE-DISPLACEMENT MACHINES OR ENGINES, GAS-TURBINES OR JET-PROPULSION PLANTS
- F05D2260/00—Function
- F05D2260/83—Testing, e.g. methods, components or tools therefor
-
- G—PHYSICS
- G05—CONTROLLING; REGULATING
- G05B—CONTROL OR REGULATING SYSTEMS IN GENERAL; FUNCTIONAL ELEMENTS OF SUCH SYSTEMS; MONITORING OR TESTING ARRANGEMENTS FOR SUCH SYSTEMS OR ELEMENTS
- G05B2219/00—Program-control systems
- G05B2219/30—Nc systems
- G05B2219/41—Servomotor, servo controller till figures
- G05B2219/41108—Controlled parameter such as gas mass flow rate
Definitions
- the present disclosure relates to a plant monitoring device, a plant monitoring method and a program for monitoring the operating state of a plant.
- This monitoring device has a function of identifying the cause of an abnormality when it is determined to be an abnormality.
- a unit space composed of multiple bundles of state quantities which is a collection of state quantities for each of a plurality of sensors, is prepared in advance, and when a bundle of state quantities is obtained from a plant, the unit space is used as a reference. Then, the maharanobis distance (hereinafter referred to as MD distance) of this bundle of state quantities is obtained, and whether the operating state of the plant is normal depending on whether or not this maharanobis distance is within a predetermined threshold. Judge whether or not.
- MD distance maharanobis distance
- the MT method by calculating the desired signal-to-noise ratio for each sensor based on the Mahalanobis distance, it is possible to identify the sensor with an increased Mahalanobis distance.
- the Mahalanobis distance increases regardless of whether the sensor has a high value or a low value, so that it is not possible to distinguish between high and low value abnormalities.
- the purpose of the present disclosure is to add information on the causes of abnormalities that are likely to occur and abnormalities that are unlikely to occur at high / low values, and to create a more reliable database for estimating the failure site and to estimate the cause of the abnormality. Is to provide.
- the plant monitoring device has a unit space composed of an acquisition unit that acquires a bundle of detection values for each of a plurality of sensor values related to the plant and a bundle of detection values for each of the plurality of sensor values.
- the operating state of the plant is normal depending on whether or not the Mahalanobis distance is within a predetermined threshold and the distance calculation unit that obtains the Mahalanobis distance of the bundle of the detected values acquired by the acquisition unit as a reference. It has a determination unit for determining whether the sensor value is present or abnormal, and a determination unit for determining whether the desired SN ratio is generated by a high value or a low value for each sensor value.
- a failure site estimation database whether a specific cause of abnormality is likely to occur due to a high sensor value abnormality or a low value abnormality, and an abnormality cause is due to an abnormality with a high sensor value. It is realized by adding information about whether it is difficult to occur or it is difficult to occur due to a low value abnormality.
- a specific cause of abnormality is it easy for a specific cause of abnormality to occur due to an abnormality of a high / low value of a sensor as a distinction between a high value / a low value abnormality of a desired signal-to-noise ratio and a failure site estimation database of the present invention?
- the plant monitoring device sets the information of the event that is less likely to cause the cause due to the abnormality of the sensor to a negative value, so that the root cause of the failure is more reliable. It can be estimated well.
- FIG. 1 is a diagram for explaining an outline of the plant monitoring device 20 according to the first embodiment.
- the plant monitoring device 20 according to the present embodiment is a device for monitoring the operating state of the plant 1 having a plurality of evaluation items.
- the plant monitoring device 20 acquires a detection value indicating a state quantity for each evaluation item from a detector provided in each part of the plant 1. Then, the plant monitoring device 20 uses the Mahalanobis Taguchi method to determine whether the operating state of the plant 1 is normal or abnormal based on the acquired detection value.
- the plant 1 is a gas turbine combined power generation plant, which includes a gas turbine 10, a gas turbine generator 11, an exhaust heat recovery boiler 12, a steam turbine 13, a steam turbine generator 14, and a control device. 40 and.
- the plant 1 may be a gas turbine power plant, a nuclear power plant, or a chemical plant.
- the gas turbine 10 includes a compressor 101, a combustor 102, and a turbine 103.
- the compressor 101 compresses the air taken in from the intake port.
- the compressor 101 is provided with temperature sensors 101A and 101B as detectors for detecting the temperature inside the vehicle interior of the compressor 101, which is one of the evaluation items.
- the temperature sensor 101A may detect the temperature at the inlet of the passenger compartment (inlet air temperature) of the compressor 101
- the temperature sensor 101B may detect the temperature at the outlet of the passenger compartment (outlet air temperature).
- the combustor 102 mixes the fuel F with the compressed air introduced from the compressor 101 and burns the fuel F to generate combustion gas.
- the combustor 102 is provided with a pressure sensor 102A as a detector for detecting the pressure of the fuel F, which is one of the evaluation items.
- the turbine 103 is rotationally driven by the combustion gas supplied from the combustor 102.
- the turbine 103 is provided with temperature sensors 103A and 103B as detectors for detecting the temperature inside the vehicle interior, which is one of the evaluation items.
- the temperature sensor 103A may detect the temperature at the inlet of the vehicle interior of the turbine 103 (inlet combustion gas temperature)
- the temperature sensor 103B may detect the temperature at the outlet of the vehicle interior (outlet combustion gas temperature).
- the gas turbine generator 11 is connected to the rotor of the turbine 103 via the compressor 101, and generates electricity by the rotation of the rotor.
- the gas turbine generator 11 is provided with a thermometer 11A as a detector for detecting the temperature of the lubricating oil, which is one of the evaluation items.
- the exhaust heat recovery boiler 12 heats water with the combustion gas (exhaust gas) discharged from the turbine 103 to generate steam.
- the exhaust heat recovery boiler 12 is provided with a level meter 12A as a detector for detecting the water level of the drum, which is one of the evaluation items.
- the steam turbine 13 is driven by steam from the exhaust heat recovery boiler 12.
- the steam turbine 13 is provided with a temperature sensor 13A as a detector for detecting the temperature in the vehicle interior, which is one of the evaluation items. Further, the steam discharged from the steam turbine 13 is returned to water by the condenser 132 and sent to the exhaust heat recovery boiler 12 via the water supply pump.
- the steam turbine generator 14 is connected to the rotor 131 of the steam turbine 13 and generates electricity by the rotation of the rotor 131.
- the steam turbine generator 14 is provided with a thermometer 14A as a detector for detecting the temperature of the lubricating oil, which is one of the evaluation items.
- evaluation items are examples, and are not limited to these.
- evaluation items of the plant for example, the output of the gas turbine generator 11, the pressure in the vehicle interior of the turbine 103, the rotation speed of the rotor of the turbine 103 or the steam turbine 13, vibration, and the like may be set.
- a detector (not shown) for detecting the state quantity of these evaluation items is provided in each part of the plant 1.
- the control device 40 is a device for controlling the operation of the plant 1. Further, when the plant monitoring device 20 determines that the operating state of the plant 1 is abnormal, the control device 40 may control the operation of each part of the plant 1 according to the control signal from the plant monitoring device 20. ..
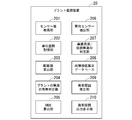
- FIG. 2 is a schematic block diagram showing a functional configuration of the plant monitoring device 20 according to the first embodiment.
- the plant monitoring device 20 includes a sensor value acquisition unit 201, a unit space storage unit 202, an MD distance calculation unit 203, a plant abnormality determination unit 204, a desired size SN ratio calculation unit 205, an abnormality sensor extraction unit 206, and a high value abnormality /. It includes a low value abnormality determination unit 207, a failure site estimation database 208, an abnormality cause estimation unit 209, and an abnormality cause output display unit 210.
- the sensor value acquisition unit 201 acquires detection values from each of the plurality of detectors provided in the plant 1. Each detector corresponds to each of a plurality of evaluation items. That is, the sensor value acquisition unit 201 acquires a bundle of detection values, which is a collection of detection values for each of a plurality of evaluation items. The sensor value acquisition unit 201 acquires a bundle of detection values every predetermined acquisition cycle (for example, 1 minute) and records it in the unit space storage unit.
- the unit space storage unit 202 stores a combination of bundles of detected values acquired from a normal plant as a unit space of Mahalanobis distance.
- the MD distance calculation unit 203 calculates the Mahalanobis distance indicating the state of the plant 1 based on the unit space stored in the unit space storage unit 202, using the bundle of detection values acquired by the sensor value acquisition unit 201 as the specification. Mahalanobis distance is a measure of the magnitude of the difference between a reference sample expressed as a unit space and a newly obtained sample.
- the presence / absence determination unit 204 of the plant abnormality determines whether or not an abnormality has occurred in the plant 1 based on the Mahalanobis distance calculated by the MD distance calculation unit 203. Specifically, the plant abnormality presence / absence determination unit 204 determines that an abnormality has occurred in the plant 1 when the Mahalanobis distance is equal to or greater than a predetermined threshold value.
- the threshold value is usually set to a value of 3 or more.
- the Nozomidai SN ratio calculation unit 205 determines that an abnormality has occurred in the gas turbine T, the presence / absence determination unit 204 of the plant has Taguchi based on the bundle of detection values acquired by the sensor value acquisition unit 201. Calculate the signal-to-noise ratio (Signal-Noise Ratio) related to the method. For example, the desired size SN ratio calculation unit 205 obtains the desired size SN ratio with or without items by orthogonal array analysis. It can be determined that the larger the desired signal-to-noise ratio is, the higher the possibility that the evaluation item related to the detected value is abnormal.
- the abnormality sensor extraction unit 206 extracts at least one abnormality sensor, which is a sensor value having a high contribution to the increase in the Mahalanobis distance, based on the desired signal-to-noise ratio calculated by the signal-to-noise ratio calculation unit 205.
- the abnormality sensor extraction unit 206 may, for example, extract a predetermined number of higher sensor values having a high desired signal-to-noise ratio among a plurality of sensor values as abnormality sensors. Further, for example, the abnormality sensor extraction unit 206 may extract a sensor value having a desired signal-to-noise ratio equal to or higher than a predetermined threshold value among a plurality of sensor values as an abnormality sensor.
- the high value abnormality / low value abnormality determination unit 207 determines that the abnormality generated for each of the plurality of sensor values is a high value abnormality due to a high detection value of the sensor value or an abnormality due to a low detection value. Identify a low value anomaly. That is, the high value abnormality / low value abnormality determination unit 207 identifies whether the increase in the Mahalanobis distance is caused by an increase in the detected value or a decrease in the detected value. Specifically, the high value abnormality / low value abnormality determination unit 207 calculates the Mahalanobis distance when the value of the bundle of detection values acquired by the sensor value acquisition unit 201 is increased or decreased for each sensor value.
- the failure site estimation database 208 creates a failure site estimation database that shows the relationship between the evaluation items, the cause of the abnormality, and whether it is a high-value abnormality or a low-value abnormality.
- FIG. 3 is a diagram showing an example of a failure site estimation database according to the first embodiment. Specifically, in the failure site estimation database, when the cause of the abnormality occurs for each evaluation item (vertical axis in FIG. 3) and the cause of each abnormality (horizontal axis in FIG. 3) related to the high value abnormality and the low value abnormality. , Retain the amount of information about the associated anomalies in the endpoint.
- I is the amount of information
- x is the number of events that have occurred
- w is the weighting coefficient based on the reliability of the data.
- the weighting coefficient w when the cause of an abnormality actually occurs and the cause of the abnormality is identified based on the report or the like is the cause of the abnormality based on the FTA data (FT: Fault Tree) generated by the maintenance personnel. May be larger than the weighting factor w when is specified.
- the weighting coefficient w when the cause of the abnormality is identified based on a method with higher accuracy than the report, such as offline analysis or simulation, is such that the cause of the abnormality actually occurs and the cause of the abnormality is based on the report or the like. May be larger than the weighting factor w when is specified.
- the cause that is unlikely to occur when a sensor abnormality occurs is, for example, expressed by the following equation (2) and becomes a negative value.
- the weight w used to calculate the amount of information related to the high-value anomaly or the low-value abnormality that has not actually occurred may be larger than the weight w used to calculate the amount of information related to the high-value anomaly or the low-value anomaly that actually occurred. ..
- the abnormality cause estimation unit 209 generates a matrix of M * 2 rows and N columns from the failure site estimation database. (Here, the M * 2 part is doubled to distinguish between high and low value abnormalities.)
- the failure site estimation database retains the amount of information associated with M evaluation items and high and low value abnormalities. ing. Therefore, the abnormality cause estimation unit 209 generates a matrix of M * 2 rows and N columns by reading the amount of information associated with the high value abnormality / low value abnormality determination unit 207 for each of the M evaluation items. do. Then, the abnormality cause estimation unit 209 performs an abnormality by multiplying the vector of 1 row M * 2 column whose element is the desired size SN ratio of each evaluation item and the generated matrix of M * 2 row N column.
- the abnormality cause estimation unit 209 estimates that the abnormality cause related to the row having a large element value in the obtained N rows and 1 column vector is the abnormality cause generated in the plant 1. That is, the abnormality cause estimation unit 209 calculates the weighted sum of the desired signal-to-noise ratio of each evaluation item and the amount of information related to the abnormality of the item for each abnormality cause, and estimates the abnormality cause based on the weighted sum. ..
- the abnormality cause output display unit 210 outputs the abnormality causes estimated by the abnormality cause estimation unit 209 in the order of certainty. Examples of output include display on a display, transmission of data to the outside, printing on a sheet, audio output, and the like.
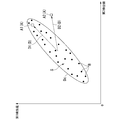
- FIG. 4 is a conceptual diagram showing the concept of Mahalanobis distance.
- the sensor value acquisition unit 201 of the plant monitoring device 20 acquires the first detection value and the second detection value of the plant 1 as a bundle B of the detection values.
- the first detected value is "gas turbine output” and the second detected value is "boiler water level”.
- the data group which is an aggregate of the bundle B of a plurality of detected values is set as the unit space S which is the reference data group, and the Mahalanobis distance D of the bundle A of the detected values acquired at a certain time point is calculated.
- the Mahalanobis distance D is a distance weighted according to the variance and correlation of the detected values in the unit space S, and the lower the similarity with the data group in the unit space S, the larger the value.
- the average Mahalanobis distance of the bundle B of the detected values constituting the unit space S is 1, and when the operating state of the plant 1 is normal, the Mahalanobis distance D of the bundle A of the detected values is generally within 4.
- the value of the Mahalanobis distance D increases according to the degree of the abnormality.
- the MT method it is determined whether the operating state of the plant 1 is normal or abnormal depending on whether the Mahalanobis distance D is within the predetermined threshold value Dc. For example, since the Mahalanobis distance D1 of the bundle A1 of the detected values is equal to or less than the threshold value Dc, it is determined that the operating state of the plant 1 at the time when the bundle A1 of the detected values is acquired is normal. Further, since the Mahalanobis distance D2 of the bundle A2 of the detected values is larger than the threshold value Dc, it is determined that the operating state of the plant 1 at the time when the bundle A2 of the detected values is acquired is abnormal.
- the threshold value Dc is set to a value larger than the maximum Mahalanobis distance among the Mahalanobis distances of each of the bundles B of the plurality of detected values constituting the unit space S, for example. At this time, it is preferable to set the threshold value Dc in consideration of the unique characteristics of the plant 1.
- the threshold value Dc may be changed by the operator via the plant monitoring device 20.
- the plant monitoring device 20 collects a bundle of detected values from the plant 1 and stores the bundle of detected values in the unit space storage unit 202 while the plant 1 is operating normally.
- the plant monitoring device 20 may acquire a bundle of normally detected values of another plant 1 having the same configuration as that of the plant 1 to be monitored and record it in the unit space storage unit 202.
- FIG. 6 is a flowchart showing a monitoring process of the plant 1 according to the first embodiment.
- the sensor value acquisition unit 201 acquires a bundle of detected values from the plant 1 (step S31).
- the MD distance calculation unit 203 calculates the Mahalanobis distance based on the unit space stored in the unit space storage unit 202 with the bundle of the detected values acquired in step S31 as the specification (step S32).
- the plant abnormality presence / absence determination unit 204 determines whether or not an abnormality has occurred in the plant 1 based on the Mahalanobis distance calculated in step S32 (step S33).
- the presence / absence determination unit 204 of the plant abnormality determines that no abnormality has occurred in the plant 1 (step S33: NO)
- the plant monitoring device 20 ends the monitoring process and waits for the next monitoring timing.
- step S33 determines that the plant 1 has an abnormality
- step S34 the desired signal-to-noise ratio related to the Taguchi method is calculated for each evaluation item based on the Mahalanobis distance calculated in step S32 (step S34).
- the plant monitoring device 20 selects evaluation items one by one, and performs the processing of steps S36 to S41 shown below for each evaluation item (step S35).
- the high value abnormality / low value abnormality determination unit 207 increases the sensor value selected in step S35 by a predetermined amount from the bundle of detection values acquired in step S31 (step S36).
- the MD distance calculation unit 203 calculates the Mahalanobis distance based on the unit space stored by the unit space storage unit 202, using the bundle of the detected values changed in step S36 as the specification (step S37).
- the high value abnormality / low value abnormality determination unit 207 determines whether the Mahalanobis distance has increased, decreased, or has not changed due to the increase in the detection value related to the abnormality sensor (step S38). For example, the high value abnormality / low value abnormality determination unit 207 may determine that the Mahalanobis distance does not change when the difference between the Mahalanobis distances is equal to or less than a predetermined threshold value. When the Mahalanobis distance is increased (step S38: increase), the high value abnormality / low value abnormality determination unit 207 determines that the abnormality sensor extracted in step S35 has a high value abnormality (step S39).
- step S38 decrease
- step S40 the high value abnormality / low value abnormality determination unit 207 determines that it cannot be classified into the abnormality sensor extracted in step S35 (step S41).
- the abnormality cause estimation unit 209 generates an M * 2 row / N column matrix using the failure site estimation database 208 (step S42).
- the vector of 1 row M * 2 column which includes the desired signal-to-noise ratio of each evaluation item calculated in step S34 and whether it is a high value abnormality or a low value abnormality, and the abnormality cause estimation unit 209, M generated in step S42.
- a vector of N rows and 1 column having the certainty of the cause of the abnormality as an element is obtained (step S43).
- the item of the desired size SN ratio that cannot be classified is set to 0.
- the abnormality cause estimation unit 209 sorts each abnormality cause in descending order of the certainty represented by the obtained vector (step S44).
- the abnormality cause estimation unit 209 is set to a negative number when it is less likely to occur than usual. Then, the abnormality cause output display unit 210 outputs the abnormality causes estimated by the abnormality cause estimation unit 209 in the sorted order (step S45). For example, the abnormality cause output display unit 210 displays the abnormality cause with the highest probability on the display, and when the user operates to receive the display command for the next abnormality cause, the abnormality cause with the next highest probability is the next. Is displayed on the display. Further, for example, the abnormality cause output display unit 210 prints a list of abnormality causes on a sheet in descending order of certainty.
- the plant monitoring device 20 determines that there is an abnormality based on the Mahalanobis distance, the abnormality of each sensor value and a plurality of causes of abnormality that may occur in the plant 1 are determined.
- the cause of the abnormality is estimated based on the failure site estimation database that maintains the relationship with the plurality of sensor values for each abnormality.
- the plant monitoring device 20 can estimate the cause of the abnormality by distinguishing whether each sensor value has an abnormality on the high value side or an abnormality on the low value side. Therefore, the plant monitoring device 20 can eliminate an event that is unlikely to occur in the estimation result of the cause of the abnormality.
- the failure site estimation database associates the cause with the high / low value abnormality sensor, and holds an amount of information indicating an increase / decrease in the possibility of occurrence of the abnormality cause. Then, the plant monitoring device 20 is a value obtained by multiplying each of the plurality of sensor values by the amount of information associated with the abnormality specified for the sensor value in the failure site estimation database and the desired signal-to-noise ratio related to the sensor value. Is calculated, and the cause of the abnormality is estimated based on the sum of the obtained values.
- the plant monitoring device 20 can eliminate an event that is unlikely to occur in the estimation result of the cause of the abnormality.
- the plant monitoring device 20 has a vector of 1 row and M * 2 columns whose elements are the desired signal-to-noise ratio of each sensor value, and M * 2 rows whose elements are the values of the failure site estimation database.
- an N-row, 1-column vector having the certainty of the cause of the abnormality as an element may be obtained.
- the cosine similarity is a value obtained by dividing the inner product of the vectors (weighted sum of the signal-to-noise ratio of each desired size and the amount of information related to the cause of the abnormality) by the product of the norms of each vector.
- the plant monitoring device 20 may obtain the weighted sum of the desired signal-to-noise ratio of each sensor value and the amount of information on the cause of the abnormality for each cause of the abnormality, regardless of the matrix calculation. ..
- the failure site estimation database according to the first embodiment retains a positive amount of information in association with the cause of the abnormality and the abnormality of the sensor value that is likely to occur when the cause of the abnormality occurs.
- the failure site estimation database according to the first embodiment retains a negative amount of information in association with an abnormality cause and an abnormality of a sensor value that is unlikely to occur when the abnormality cause occurs.
- the plant monitoring device 20 can positively reduce the certainty of the cause of the abnormality that is unlikely to occur. Therefore, the plant monitoring device 20 can eliminate an event that is unlikely to occur in the estimation result of the cause of the abnormality.
- the present invention is not limited to this.
- the failure site estimation database may hold zero information amount in association with an abnormality cause and a sensor value abnormality that is unlikely to occur when the abnormality cause occurs. ..
- the certainty of the cause of the abnormality does not decrease significantly compared to the case of having a negative amount of information, but by isolating the abnormality of each sensor value and estimating the cause of the abnormality, the estimation result of the cause of the abnormality can be obtained. Events that are unlikely to occur can be eliminated.
- the plant monitoring device 20 increases the amount of information associated with the specified abnormality for each sensor value based on the bundle of the detected values when the cause of the abnormality occurs. Update the failure site estimation database to reduce the amount of information associated with unidentified anomalies. As a result, the plant monitoring device 20 can automatically generate a failure site estimation database having an amount of information related to the opposite direction. It should be noted that the present embodiment is not limited to this, and the negative information amount may be manually input by the worker.
- the plant monitoring device 20 updates the amount of information for at least one abnormality sensor having a large desired signal-to-noise ratio among a plurality of sensor values. As a result, the plant monitoring device 20 can add a sharpness to the amount of information of each sensor value in the failure site estimation database.
- FIG. 7 is a schematic block diagram showing the configuration of a computer according to at least one embodiment.
- the computer 90 includes a processor 91, a main memory 92, a storage 93, and an interface 94.
- the above-mentioned plant monitoring device 20 is mounted on a computer 90.
- the operation of each of the above-mentioned processing units is stored in the storage 93 in the form of a program.
- the processor 91 reads a program from the storage 93, expands it into the main memory 92, and executes the above processing according to the program. Further, the processor 91 secures a storage area corresponding to each of the above-mentioned storage units in the main memory 92 according to the program. Examples of the processor 91 include a CPU (Central Processing Unit), a GPU (Graphic Processing Unit), a microprocessor, and the like.
- the program may be for realizing a part of the functions exerted by the computer 90.
- the program may exert its function in combination with another program already stored in the storage or in combination with another program mounted on another device.
- the computer 90 may include a custom LSI (Large Scale Integrated Circuit) such as a PLD (Programmable Logic Device) in addition to or in place of the above configuration.
- PLDs include PAL (Programmable Array Logic), GAL (Generic Array Logic), CPLD (Complex Programmable Logic Device), and FPGA (Field Programmable Gate Array).
- PLDs Programmable Integrated Circuit
- PAL Programmable Array Logic
- GAL Generic Array Logic
- CPLD Complex Programmable Logic Device
- FPGA Field Programmable Gate Array
- Examples of the storage 93 include HDD (Hard Disk Drive), SSD (Solid State Drive), magnetic disk, optical magnetic disk, CD-ROM (Compact Disc Read Only Memory), DVD-ROM (Digital Versatile Disc Read Only Memory). , Semiconductor memory and the like.
- the storage 93 may be an internal medium directly connected to the bus of the computer 90, or an external medium connected to the computer 90 via the interface 94 or a communication line. When this program is distributed to the computer 90 via a communication line, the distributed computer 90 may expand the program to the main memory 92 and execute the above processing.
- the storage 93 is a non-temporary tangible storage medium.
- the program may be for realizing a part of the above-mentioned functions. Further, the program may be a so-called difference file (difference program) that realizes the above-mentioned function in combination with another program already stored in the storage 93.
- difference file difference program
- the plant monitoring device 20 may be configured by a single computer 90, or the configuration of the plant monitoring device 20 is divided into a plurality of computers 90 and the plurality of computers 90 are arranged. It may function as a plant monitoring device 20 by cooperating with each other.
- the plant monitoring device (20) includes a sensor value acquisition unit (201) that acquires a bundle of detection values for each of a plurality of sensor values related to the plant (1), and the plurality of sensors.
- the distance calculation unit (203) for obtaining the Maharanobis distance of the bundle of detected values acquired by the sensor value acquisition unit (201) and the distance calculation unit (203) based on the unit space formed by collecting bundles of detected values for each value.
- the plant abnormality presence / absence determination unit (204) for determining whether the operating state of the plant (1) is normal or abnormal, and the plant.
- At least one sensor value presumed to be the cause in the bundle of detected values is either a high value abnormality due to a high detection value or an abnormality due to a low detection value.
- a high-value abnormality / low-value abnormality determination unit (207) that identifies whether the value is a low-value abnormality, a low-value abnormality or a high-value abnormality for each of the at least one sensor value, and a plurality of abnormalities that can occur in the plant.
- An abnormality cause estimation unit (209) that estimates the cause of an abnormality based on a failure site estimation database that maintains the relationship between the cause and the plurality of sensor values for each tendency, and an output unit that outputs the estimated cause of the abnormality. (210) and.
- the plant monitoring device can estimate the cause of the abnormality by distinguishing whether each sensor value has an abnormality on the high value side or an abnormality on the low value side. Therefore, the plant monitoring device can eliminate events that are unlikely to occur in the estimation result of the cause of the abnormality.
- To "acquire” is to obtain a new value. For example, “acquiring” includes receiving a value, accepting an input of a value, reading a value from a storage medium, calculating another value from one value, and the like.
- To "specify” is to use the first value to determine a second value that can take a plurality of values.
- "specify” means to calculate the second value from the first value, to read the second value corresponding to the first value by referring to the failure site estimation database, and to set the first value. It includes searching for a second value as a query, selecting a second value from a plurality of candidates based on the first value, and the like.
- the plant monitoring device (20) calculates the desired signal-to-noise ratio of the plurality of sensor values based on the bundle of the detected values.
- a ratio calculation unit (205) is provided, and the failure site estimation database retains an amount of information indicating an increase / decrease in the possibility of occurrence of an abnormality cause in association with an abnormality cause and a sensor value, and the abnormality cause estimation unit (the abnormality cause estimation unit (205) is provided.
- a value obtained by multiplying the ratio by the ratio may be obtained, and the cause of the abnormality may be estimated based on the sum of the obtained values.
- the probability of the cause of the abnormality having a large amount of information related to the sensor value having a high signal-to-noise ratio is high, and the probability of the cause of the abnormality having a small amount of information related to the sensor value having a high signal-to-noise ratio is low. Therefore, the plant monitoring device can eliminate events that are unlikely to occur in the estimation result of the cause of the abnormality.
- the cause of the abnormality and the cause of the abnormality among the low value abnormality and the high value abnormality in the failure site estimation database, the cause of the abnormality and the cause of the abnormality among the low value abnormality and the high value abnormality.
- the amount of positive information is associated with the one that is likely to occur when the problem occurs, and the cause of the abnormality and the low-value abnormality and the high-value abnormality that are likely not to occur when the cause of the abnormality occurs. May be associated with a negative amount of information.
- the plant monitoring device can positively reduce the certainty of the cause of the abnormality that is unlikely to occur. Therefore, the plant monitoring device can eliminate events that are unlikely to occur in the estimation result of the cause of the abnormality.
- the plant monitoring device in the plant monitoring device according to the third aspect, there is a possibility that it does not occur when the cause of the abnormality occurs in the failure site estimation database among the low value abnormality and the high value abnormality.
- the absolute value of the amount of information associated with the higher one may be greater than the absolute value of the amount of information associated with the one most likely to occur when the cause of the anomaly occurs.
- the program comprises a step of acquiring a bundle of detection values for each of a plurality of sensor values related to the plant and a bundle of detection values for each of the plurality of sensor values in a computer.
- the operating state of the plant depends on the step of obtaining the maharanobis distance of the bundle of the detected values acquired by the acquisition unit and whether or not the maharanobis distance is within a predetermined threshold value based on the unit space to be detected.
- the detection value is determined for the step of determining whether is normal or abnormal, and for at least one sensor value presumed to be the cause in the bundle of detection values when the operation state of the plant is determined to be abnormal.
- the step of identifying whether it is a high value abnormality due to a high value or a low value abnormality due to a low detection value, and whether it is a low value abnormality or a high value abnormality for each of the at least one sensor value, the above-mentioned A step of estimating the cause of an abnormality and a step of outputting the estimated cause of the abnormality based on a failure site estimation database that maintains the relationship between a plurality of causes of abnormality that may occur in the plant and the plurality of sensor values. Let it run.
- the plant monitoring device can estimate the true cause of the failure more reliably by setting the information of the event that is less likely to cause the cause due to the abnormality of the sensor to a negative value.
- Plant 20 Plant monitoring device 201 Sensor value acquisition unit 202 Unit spatial storage unit 203 MD distance calculation unit 204 Plant abnormality presence / absence determination unit 205 Desired size SN ratio calculation unit 206 Abnormality sensor extraction unit 207 High value abnormality / low value abnormality determination Part 208 Failure part estimation database 209 Abnormality cause estimation part 210 Abnormality cause output display part
Landscapes
- Engineering & Computer Science (AREA)
- Physics & Mathematics (AREA)
- Mechanical Engineering (AREA)
- General Engineering & Computer Science (AREA)
- Chemical & Material Sciences (AREA)
- Combustion & Propulsion (AREA)
- General Physics & Mathematics (AREA)
- Automation & Control Theory (AREA)
- Artificial Intelligence (AREA)
- Evolutionary Computation (AREA)
- Mathematical Physics (AREA)
- Testing And Monitoring For Control Systems (AREA)
Abstract
Description
本願は、2020年6月12日に、日本に出願された特願2020-102395号に基づき優先権を主張し、その内容をここに援用する。
図1は、第1の実施形態に係るプラント監視装置20の概要を説明するための図である。
本実施形態に係るプラント監視装置20は、複数の評価項目があるプラント1の運転状態を監視するための装置である。プラント監視装置20は、プラント1の各部に設けられた検出器から評価項目ごとの状態量を示す検出値を取得する。そして、プラント監視装置20は、マハラノビス・タグチ法を利用し、取得した検出値に基づいてプラント1の運転状態が正常であるか異常であるかを判定する。
本実施形態に係るプラント1は、ガスタービン複合発電プラントであり、ガスタービン10と、ガスタービン発電機11と、排熱回収ボイラ12と、蒸気タービン13と、蒸気タービン発電機14と、制御装置40と、を備える。なお、他の実施形態では、プラント1は、ガスタービン発電プラント、原子力発電プラント、化学プラントであってもよい。
図2は、第1の実施形態に係るプラント監視装置20の機能構成を示す概略ブロック図である。
プラント監視装置20は、センサー値取得部201、単位空間記憶部202、MD距離算出部203、プラントの異常の有無判定部204、望大SN比算出部205、異常センサー抽出部206、高値異常/低値異常の判定部207、故障部位推定データベース208、異常原因推定部209、異常原因出力表示部210を備える。

例えば、異常原因が現実に発生し、その報告書等に基づいて異常原因が特定されたときの重み係数wは、保守員によって生成されたFTAのデータ(FT:Fault Tree)に基づいて異常原因が特定されたときの重み係数wより大きくてよい。また、例えば、オフライン解析やシミュレーションなど、報告書より精度が高い手法に基づいて異常原因が特定されたときの重み係数wは、異常原因が現実に発生し、その報告書等に基づいて異常原因が特定されたときの重み係数wより大きくてよい。

図4は、マハラノビス距離の概念を示す概念図である。
まず、MT法によるプラント監視方法の概要について、図4を用いて説明する。
以下、プラント監視装置20の動作について説明する。
プラント監視装置20は、監視処理を開始する前に、プラント1が正常に運転している間、プラント1から検出値の束を収集して単位空間記憶部202に検出値の束を蓄積する。なお、プラント監視装置20は、監視対象のプラント1と同様の構成を有する他のプラント1の正常時の検出値の束を取得し、単位空間記憶部202に記録してもよい。
単位空間記憶部202に単位空間が記録され、また故障部位推定データベース208に故障部位推定データベースが記録されると、プラント監視装置20は、所定の監視タイミング(例えば、1時間おきのタイミング)で、以下に示す監視処理を実行する。
図6は、第1の実施形態に係るプラント1の監視処理を示すフローチャートである。
まず、高値異常/低値異常の判定部207は、ステップS31で取得した検出値の束のうち、ステップS35で選択されたセンサー値を所定量増加させる(ステップS36)。次に、MD距離算出部203は、ステップS36で変化させた検出値の束を諸元として、単位空間記憶部202が記憶する単位空間に基づいて、マハラノビス距離を算出する(ステップS37)。
マハラノビス距離が増大した場合(ステップS38:増大)、高値異常/低値異常の判定部207は、ステップS35で抽出された異常センサーに高値異常があると判定する(ステップS39)。他方、マハラノビス距離が減少した場合(ステップS38:減少)、高値異常/低値異常の判定部207は、ステップS35で抽出された異常センサーに低値異常があると判定する(ステップS40)。マハラノビス距離が変化しない場合(ステップS38:不変)、高値異常/低値異常の判定部207は、ステップS35で抽出された異常センサーに分類できないと判定する(ステップS41)。
このように、第1の実施形態によれば、プラント監視装置20は、マハラノビス距離に基づいて異常があると判定した場合に、各センサー値の異常と、プラント1に生じ得る複数の異常原因と異常別の前記複数のセンサー値との関係を保持する故障部位推定データベースとに基づいて異常原因を推定する。
これにより、プラント監視装置20は、各センサー値に高値側の異常があるか低値側の異常があるかで切り分けて異常原因の推定を行うことができる。したがって、プラント監視装置20は、異常原因の推定結果に発生する可能性が低い事象を除去することができる。
なお、他の実施形態ではこれに限られない。例えば、他の実施形態に係るプラント監視装置20は、各センサー値の望大SN比を要素とする1行M*2列のベクトルと、故障部位推定データベースの値を要素とするM*2行N列の行列の各行ベクトルとのコサイン類似度を算出することにより、異常の異常原因の確からしさを要素とするN行1列のベクトルを得てもよい。なお、コサイン類似度は、ベクトルの内積(各望大SN比と異常原因に係る情報量との加重和)を各ベクトルのノルムの積で除算した値である。例えば、他の実施形態に係るプラント監視装置20は、行列計算によらず、異常の異常原因ごとに、各センサー値の望大SN比と異常原因の情報量との加重和を求めてもよい。
なお、他の実施形態においては、これに限られない。例えば、他の実施形態に係る故障部位推定データベースは、異常原因と、当該異常原因が生じたときに発生しない可能性が高いセンサー値の異常とに関連付けて、情報量ゼロを保持してもよい。この場合にも、負の情報量を有する場合と比較して異常原因の確からしさは大きく下がらないものの、各センサー値の異常を切り分けて異常原因の推定を行うことで、異常原因の推定結果に発生する可能性が低い事象を除去することができる。
図7は、少なくとも1つの実施形態に係るコンピュータの構成を示す概略ブロック図である。
コンピュータ90は、プロセッサ91、メインメモリ92、ストレージ93、インタフェース94を備える。
上述のプラント監視装置20は、コンピュータ90に実装される。そして、上述した各処理部の動作は、プログラムの形式でストレージ93に記憶されている。プロセッサ91は、プログラムをストレージ93から読み出してメインメモリ92に展開し、当該プログラムに従って上記処理を実行する。また、プロセッサ91は、プログラムに従って、上述した各記憶部に対応する記憶領域をメインメモリ92に確保する。プロセッサ91の例としては、CPU(Central Processing Unit)、GPU(Graphic Processing Unit)、マイクロプロセッサなどが挙げられる。
各実施形態に記載のプラント監視装置、プラント監視方法およびプログラムは、例えば以下のように把握され得る。
これにより、プラント監視装置は、各センサー値に高値側の異常があるか低値側の異常があるかで切り分けて異常原因の推定を行うことができる。したがって、プラント監視装置は、異常原因の推定結果に発生する可能性が低い事象を除去することができる。
「取得する」とは、新たに値を得ることである。例えば、「取得する」は、値を受信すること、値の入力を受け付けること、記憶媒体から値を読み出すこと、ある値から他の値を算出することなどを含む。
「特定する」とは、第1の値を用いて複数の値を取り得る第2の値を定めることである。例えば、「特定する」は、第1の値から第2の値を算出すること、故障部位推定データベースを参照して第1の値に対応する第2の値を読み出すこと、第1の値をクエリとして第2の値を検索すること、第1の値に基づいて複数の候補の中から第2の値を選択することなどを含む。
これにより、望大SN比が高いセンサー値に係る情報量が大きい異常原因の確からしさが高くなり、望大SN比が高いセンサー値に係る情報量が小さい異常原因の確からしさが低くなる。したがって、プラント監視装置は、異常原因の推定結果に発生する可能性が低い事象を除去することができる。
これにより、プラント監視装置は、発生しない可能性が高い異常原因の確からしさを積極的に下げることができる。したがって、プラント監視装置は、異常原因の推定結果に発生する可能性が低い事象を除去することができる。
20 プラント監視装置
201 センサー値取得部
202 単位空間記憶部
203 MD距離算出部
204 プラントの異常の有無判定部
205 望大SN比算出部
206 異常センサー抽出部
207 高値異常/低値異常の判定部
208 故障部位推定データベース
209 異常原因推定部
210 異常原因出力表示部
Claims (5)
- プラントに関する複数のセンサー値毎の検出値の束を取得するセンサー値取得部と、
前記複数のセンサー値毎の検出値の束が集まって構成される単位空間を基準にして、取得した前記検出値の束のマハラノビス距離を求める距離演算部と、
前記マハラノビス距離が所定の閾値以内であるか否かに応じて、前記プラントの運転状態が正常であるか異常であるかを判定するプラントの異常の有無判定部と、
前記プラントの運転状態が異常と判定された場合、前記検出値の束のうち原因と推定される少なくとも1つのセンサー値について、検出値が高いことによる異常である高値異常か、検出値が低いことによる異常である低値異常かを特定する高値異常/低値異常判定部と、
前記少なくとも1つのセンサー値ごとに、低値異常か高値異常かの別と、前記プラントに生じ得る複数の異常原因と前記複数のセンサー値との関係を保持する故障部位推定データベースとに基づいて、異常原因を推定する異常原因推定部と、
推定された前記異常原因を出力する出力部と、
を有するプラント監視装置。 - 前記検出値の束に基づいて、前記複数のセンサー値のSN比を算出するSN比算出部を備え、
前記故障部位推定データベースは、異常原因とセンサー値とに関連付けて、異常原因の発生可能性の増加・減少を示す情報量を保持し、
前記異常原因推定部は、前記複数のセンサー値ごとに、前記故障部位推定データベースにおいて当該センサー値について特定された低値異常か高値異常かの別に関連付けられた情報量と、当該センサー値に係る望大SN比とを乗算した値を求め、求めた前記値の総和に基づいて前記異常原因を推定する
請求項1に記載のプラント監視装置。 - 前記故障部位推定データベースにおいて、高値異常/低値異常が発生した際、通常より異常原因が発生し易くなるものには正の情報量、通常より異常原因が発生し難くなる可能性があるものには負の情報量が関連付けられている
請求項1または請求項2に記載のプラント監視装置。 - プラントに関する複数のセンサー値毎の検出値の束を取得するステップと、
前記複数のセンサー値毎の検出値の束が集まって構成される単位空間を基準にして、取得した前記検出値の束のマハラノビス距離を求めるステップと、
前記マハラノビス距離が所定の閾値以内であるか否かに応じて、前記プラントの運転状態が正常であるか異常であるかを判定するステップと、
前記プラントの運転状態が異常と判定された場合、前記検出値の束のうち原因と推定される少なくとも1つのセンサー値について、検出値が高いことによる異常である高値異常か、検出値が低いことによる異常である低値異常かを特定するステップと、
前記少なくとも1つのセンサー値ごとに、低値異常か高値異常かの別と、前記プラントに生じ得る複数の異常原因と前記複数のセンサー値との関係を保持する故障部位推定データベースとに基づいて、異常原因を推定するステップと、
推定された前記異常原因を出力するステップと、
を有するプラント監視方法。 - コンピュータに、
プラントに関する複数のセンサー値毎の検出値の束を取得するステップと、
前記複数のセンサー値毎の検出値の束が集まって構成される単位空間を基準にして、取得した前記検出値の束のマハラノビス距離を求めるステップと、
前記マハラノビス距離が所定の閾値以内であるか否かに応じて、前記プラントの運転状態が正常であるか異常であるかを判定するステップと、
前記プラントの運転状態が異常と判定された場合、前記検出値の束のうち原因と推定される少なくとも1つのセンサー値について、検出値が高いことによる異常である高値異常か、検出値が低いことによる異常である低値異常かを特定するステップと、
前記少なくとも1つのセンサー値ごとに、低値異常か高値異常かの別と、前記プラントに生じ得る複数の異常原因と前記複数のセンサー値との関係を保持する故障部位推定データベースとに基づいて、異常原因を推定するステップと、
推定された前記異常原因を出力するステップと、
を実行させるためのプログラム。
Priority Applications (5)
| Application Number | Priority Date | Filing Date | Title |
|---|---|---|---|
| DE112021003238.0T DE112021003238T5 (de) | 2020-06-12 | 2021-05-31 | Anlagenüberwachungsvorrichtung, anlagenüberwachungsverfahren und programm |
| KR1020227042070A KR20230005951A (ko) | 2020-06-12 | 2021-05-31 | 플랜트 감시 장치, 플랜트 감시 방법 및 프로그램을 기록한 컴퓨터 판독 가능한 기록 매체 |
| CN202180037578.2A CN115668085A (zh) | 2020-06-12 | 2021-05-31 | 成套设备监视装置、成套设备监视方法及程序 |
| JP2022530478A JP7399288B2 (ja) | 2020-06-12 | 2021-05-31 | プラント監視装置、プラント監視方法およびプログラム |
| US17/928,466 US20230212980A1 (en) | 2020-06-12 | 2021-05-31 | Plant monitoring device, plant monitoring method, and program |
Applications Claiming Priority (2)
| Application Number | Priority Date | Filing Date | Title |
|---|---|---|---|
| JP2020102395 | 2020-06-12 | ||
| JP2020-102395 | 2020-06-12 |
Publications (1)
| Publication Number | Publication Date |
|---|---|
| WO2021251200A1 true WO2021251200A1 (ja) | 2021-12-16 |
Family
ID=78845666
Family Applications (1)
| Application Number | Title | Priority Date | Filing Date |
|---|---|---|---|
| PCT/JP2021/020739 WO2021251200A1 (ja) | 2020-06-12 | 2021-05-31 | プラント監視装置、プラント監視方法およびプログラム |
Country Status (6)
| Country | Link |
|---|---|
| US (1) | US20230212980A1 (ja) |
| JP (1) | JP7399288B2 (ja) |
| KR (1) | KR20230005951A (ja) |
| CN (1) | CN115668085A (ja) |
| DE (1) | DE112021003238T5 (ja) |
| WO (1) | WO2021251200A1 (ja) |
Citations (2)
| Publication number | Priority date | Publication date | Assignee | Title |
|---|---|---|---|---|
| JP2017215863A (ja) * | 2016-06-01 | 2017-12-07 | 三菱日立パワーシステムズ株式会社 | 監視装置、対象装置の監視方法、およびプログラム |
| JP2018173948A (ja) * | 2017-03-31 | 2018-11-08 | 西日本電信電話株式会社 | 故障診断装置、故障診断方法、及びコンピュータプログラム |
Family Cites Families (2)
| Publication number | Priority date | Publication date | Assignee | Title |
|---|---|---|---|---|
| JP2019063575A (ja) | 2018-12-21 | 2019-04-25 | 株式会社大都技研 | 遊技台 |
| JP7114454B2 (ja) | 2018-12-25 | 2022-08-08 | 昭和フロント株式会社 | 照明装置 |
-
2021
- 2021-05-31 CN CN202180037578.2A patent/CN115668085A/zh active Pending
- 2021-05-31 KR KR1020227042070A patent/KR20230005951A/ko unknown
- 2021-05-31 DE DE112021003238.0T patent/DE112021003238T5/de active Pending
- 2021-05-31 WO PCT/JP2021/020739 patent/WO2021251200A1/ja active Application Filing
- 2021-05-31 JP JP2022530478A patent/JP7399288B2/ja active Active
- 2021-05-31 US US17/928,466 patent/US20230212980A1/en active Pending
Patent Citations (2)
| Publication number | Priority date | Publication date | Assignee | Title |
|---|---|---|---|---|
| JP2017215863A (ja) * | 2016-06-01 | 2017-12-07 | 三菱日立パワーシステムズ株式会社 | 監視装置、対象装置の監視方法、およびプログラム |
| JP2018173948A (ja) * | 2017-03-31 | 2018-11-08 | 西日本電信電話株式会社 | 故障診断装置、故障診断方法、及びコンピュータプログラム |
Also Published As
| Publication number | Publication date |
|---|---|
| CN115668085A (zh) | 2023-01-31 |
| KR20230005951A (ko) | 2023-01-10 |
| DE112021003238T5 (de) | 2023-04-20 |
| JP7399288B2 (ja) | 2023-12-15 |
| JPWO2021251200A1 (ja) | 2021-12-16 |
| US20230212980A1 (en) | 2023-07-06 |
Similar Documents
| Publication | Publication Date | Title |
|---|---|---|
| JP5405587B2 (ja) | 航空エンジンを監視するために使用されるデータの標準化 | |
| JP6511702B2 (ja) | 監視装置、対象装置の監視方法、およびプログラム | |
| JP6088131B2 (ja) | タービン性能診断システム及び方法 | |
| CN104756029B (zh) | 一种监控设备的部件组的系统 | |
| JP2020091561A (ja) | 異常診断装置及び異常診断方法 | |
| Tsalavoutas et al. | Combining advanced data analysis methods for the constitution of an integrated gas turbine condition monitoring and diagnostic system | |
| KR20180137513A (ko) | 감시 장치, 대상 장치의 감시 방법 및 프로그램 | |
| US11555757B2 (en) | Monitoring device, monitoring method, method of creating shaft vibration determination model, and program | |
| KR102603020B1 (ko) | 플랜트 감시 장치, 플랜트 감시 방법, 및 프로그램 | |
| KR20200085817A (ko) | 단위 공간 생성 장치, 플랜트 진단 시스템, 단위 공간 생성 방법, 플랜트 진단 방법, 및 프로그램 | |
| WO2021251200A1 (ja) | プラント監視装置、プラント監視方法およびプログラム | |
| JP5668425B2 (ja) | 障害検知装置、情報処理方法、およびプログラム | |
| CN108629077B (zh) | 故障诊断装置、监视装置、故障诊断方法以及记录介质 | |
| JP7387325B2 (ja) | プラント監視装置、プラント監視方法、及びプログラム | |
| WO2022085535A1 (ja) | 要因推定装置、要因推定方法及びプログラム | |
| JP7453049B2 (ja) | 異常予兆監視システム、異常予兆監視方法、及びプログラム | |
| WO2018003028A1 (ja) | ボイラーの故障判定装置、故障判定方法およびサービス方法 | |
| JP7487412B2 (ja) | プラント監視方法、プラント監視装置及びプラント監視プログラム | |
| WO2021131403A1 (ja) | プラント監視装置、プラント監視方法、及びプログラム | |
| WO2021229815A1 (ja) | 情報処理装置、評価方法、および評価プログラム | |
| JP3923773B2 (ja) | プラント異常事象診断装置とその診断方法、ならびに記録媒体 | |
| JP2023115998A (ja) | 機器の監視診断装置及びその監視診断方法並びに機器の監視診断システム | |
| JP2019121163A (ja) | センサ選択装置およびセンサ選択方法 |
Legal Events
| Date | Code | Title | Description |
|---|---|---|---|
| 121 | Ep: the epo has been informed by wipo that ep was designated in this application |
Ref document number: 21821914 Country of ref document: EP Kind code of ref document: A1 |
|
| ENP | Entry into the national phase |
Ref document number: 2022530478 Country of ref document: JP Kind code of ref document: A |
|
| ENP | Entry into the national phase |
Ref document number: 20227042070 Country of ref document: KR Kind code of ref document: A |
|
| 122 | Ep: pct application non-entry in european phase |
Ref document number: 21821914 Country of ref document: EP Kind code of ref document: A1 |