WO2021246021A1 - 試料観察装置及び試料観察方法 - Google Patents
試料観察装置及び試料観察方法 Download PDFInfo
- Publication number
- WO2021246021A1 WO2021246021A1 PCT/JP2021/010879 JP2021010879W WO2021246021A1 WO 2021246021 A1 WO2021246021 A1 WO 2021246021A1 JP 2021010879 W JP2021010879 W JP 2021010879W WO 2021246021 A1 WO2021246021 A1 WO 2021246021A1
- Authority
- WO
- WIPO (PCT)
- Prior art keywords
- light
- sample
- scanning speed
- amount
- observation
- Prior art date
Links
Images


Classifications
-
- G—PHYSICS
- G01—MEASURING; TESTING
- G01N—INVESTIGATING OR ANALYSING MATERIALS BY DETERMINING THEIR CHEMICAL OR PHYSICAL PROPERTIES
- G01N21/00—Investigating or analysing materials by the use of optical means, i.e. using sub-millimetre waves, infrared, visible or ultraviolet light
- G01N21/62—Systems in which the material investigated is excited whereby it emits light or causes a change in wavelength of the incident light
- G01N21/63—Systems in which the material investigated is excited whereby it emits light or causes a change in wavelength of the incident light optically excited
- G01N21/64—Fluorescence; Phosphorescence
- G01N21/645—Specially adapted constructive features of fluorimeters
- G01N21/6456—Spatial resolved fluorescence measurements; Imaging
-
- G—PHYSICS
- G01—MEASURING; TESTING
- G01N—INVESTIGATING OR ANALYSING MATERIALS BY DETERMINING THEIR CHEMICAL OR PHYSICAL PROPERTIES
- G01N21/00—Investigating or analysing materials by the use of optical means, i.e. using sub-millimetre waves, infrared, visible or ultraviolet light
- G01N21/62—Systems in which the material investigated is excited whereby it emits light or causes a change in wavelength of the incident light
- G01N21/63—Systems in which the material investigated is excited whereby it emits light or causes a change in wavelength of the incident light optically excited
- G01N21/64—Fluorescence; Phosphorescence
- G01N21/645—Specially adapted constructive features of fluorimeters
- G01N21/6452—Individual samples arranged in a regular 2D-array, e.g. multiwell plates
-
- G—PHYSICS
- G02—OPTICS
- G02B—OPTICAL ELEMENTS, SYSTEMS OR APPARATUS
- G02B21/00—Microscopes
- G02B21/0004—Microscopes specially adapted for specific applications
- G02B21/002—Scanning microscopes
- G02B21/0024—Confocal scanning microscopes (CSOMs) or confocal "macroscopes"; Accessories which are not restricted to use with CSOMs, e.g. sample holders
- G02B21/0032—Optical details of illumination, e.g. light-sources, pinholes, beam splitters, slits, fibers
-
- G—PHYSICS
- G02—OPTICS
- G02B—OPTICAL ELEMENTS, SYSTEMS OR APPARATUS
- G02B21/00—Microscopes
- G02B21/0004—Microscopes specially adapted for specific applications
- G02B21/002—Scanning microscopes
- G02B21/0024—Confocal scanning microscopes (CSOMs) or confocal "macroscopes"; Accessories which are not restricted to use with CSOMs, e.g. sample holders
- G02B21/0036—Scanning details, e.g. scanning stages
-
- G—PHYSICS
- G01—MEASURING; TESTING
- G01N—INVESTIGATING OR ANALYSING MATERIALS BY DETERMINING THEIR CHEMICAL OR PHYSICAL PROPERTIES
- G01N21/00—Investigating or analysing materials by the use of optical means, i.e. using sub-millimetre waves, infrared, visible or ultraviolet light
- G01N21/62—Systems in which the material investigated is excited whereby it emits light or causes a change in wavelength of the incident light
- G01N21/63—Systems in which the material investigated is excited whereby it emits light or causes a change in wavelength of the incident light optically excited
- G01N21/64—Fluorescence; Phosphorescence
- G01N21/6428—Measuring fluorescence of fluorescent products of reactions or of fluorochrome labelled reactive substances, e.g. measuring quenching effects, using measuring "optrodes"
- G01N2021/6439—Measuring fluorescence of fluorescent products of reactions or of fluorochrome labelled reactive substances, e.g. measuring quenching effects, using measuring "optrodes" with indicators, stains, dyes, tags, labels, marks
-
- G—PHYSICS
- G01—MEASURING; TESTING
- G01N—INVESTIGATING OR ANALYSING MATERIALS BY DETERMINING THEIR CHEMICAL OR PHYSICAL PROPERTIES
- G01N2201/00—Features of devices classified in G01N21/00
- G01N2201/10—Scanning
- G01N2201/103—Scanning by mechanical motion of stage
-
- G—PHYSICS
- G02—OPTICS
- G02B—OPTICAL ELEMENTS, SYSTEMS OR APPARATUS
- G02B21/00—Microscopes
- G02B21/06—Means for illuminating specimens
-
- G—PHYSICS
- G02—OPTICS
- G02B—OPTICAL ELEMENTS, SYSTEMS OR APPARATUS
- G02B2207/00—Coding scheme for general features or characteristics of optical elements and systems of subclass G02B, but not including elements and systems which would be classified in G02B6/00 and subgroups
- G02B2207/113—Fluorescence
Definitions
- This disclosure relates to a sample observation device and a sample observation method.
- SPIM Selective Plane Illumination Microscopy
- a technique related to such a technique for example, there is a sample observation device described in Patent Document 1.
- the sample observation device of Patent Document 1 has an irradiation optical system that irradiates a sample with planar light on the XZ surface, a scanning unit that scans the sample in the Y-axis direction with respect to the irradiation surface of the planar light, and an irradiation surface.
- It has an observation axis that is tilted with respect to it, and is equipped with an imaging optical system that forms an image of the observation light generated in the sample by irradiation with planar light.
- this sample observation device a plurality of XZ image data of the sample are acquired in the Y-axis direction, and the X-image data generated by integrating the brightness values of the analysis region in the XZ image data in the Z direction are combined in the Y-axis direction to form a sample.
- XY image data is generated.
- the present disclosure has been made to solve the above problems, and an object of the present disclosure is to provide a sample observation device and a sample observation method that can simplify the setting of measurement conditions.
- the sample observation device includes a light source unit that outputs excitation light to the sample, an irradiation optical system that shapes the excitation light into planar light, and irradiates the sample with the planar light on the XZ surface. It has a scanning unit that scans the sample in the Y-axis direction at a predetermined scanning speed so as to pass through the illuminated surface of the surface light, and an observation axis that is inclined with respect to the irradiation surface.
- An imaging optical system that forms an image of the observed observation light, an image acquisition unit that acquires a plurality of XZ image data corresponding to an optical image of the observation light coupled by the imaging optical system in the Y-axis direction at a predetermined frame rate, and an image acquisition unit.
- the control unit includes a control unit that controls the amount of light and the scanning speed of the planar light, and the control unit has an optimum amount of light of the planar light represented by the product of the amount of light of the planar light and the scanning speed according to the scanning speed. With reference to the set reference table, the scanning speed and the optimum amount of planar light are determined based on the measurement sensitivity selected by the user.
- This sample observation device introduces the concept of measurement sensitivity expressed by the product of the amount of planar light and the scanning speed, and the planar light to irradiate the sample with the scanning speed of the sample according to the measurement sensitivity selected by the user. Determine the optimum amount of light.
- it is necessary to control the scanning speed and the exposure time of the sample so that the resolution in the X-axis direction and the resolution in the Y-axis direction at the image acquisition unit become equal to each other. Since the exposure time can be determined based on the number of pixels in the image acquisition unit, it is possible to calculate the scanning speed at which the resolution in the X-axis direction and the resolution in the Y-axis direction are equal.
- the amount of observation light that can be acquired by the image acquisition unit is determined by the product of the amount of observation light per unit time and the exposure time.
- the amount of observation light can be determined based on the amount of planar light applied to the sample, and the exposure time can be determined based on the scanning speed of the sample. That is, the measurement sensitivity can be determined by the amount of planar light for the same scanning speed.
- the optimum light amount of the planar light in the measurement sensitivity refers to the reference table set according to the scanning speed, and the optimum light amount of the scanning speed and the planar light is based on the measurement sensitivity selected by the user. Both can be decided. Therefore, the setting of measurement conditions can be simplified.
- the control unit may determine the maximum scanning speed that can be taken at the frame rate as the scanning speed.
- Scanning speed is a parameter related to sample observation throughput. Therefore, by determining the maximum scanning speed that can be taken at the frame rate as the scanning speed, the throughput of sample observation can be improved.
- the control unit has a plurality of different reference tables according to the frame rate, and selects one reference table from the plurality of reference tables based on the frame rate corresponding to the subarray size of the image acquisition unit selected by the user.
- the scanning speed and the optimum amount of light may be determined using the selected reference table.
- the frame rate becomes larger, so that the maximum value of the scanning speed can be increased. Therefore, by selectively using a plurality of different reference tables according to the frame rate, the throughput of sample observation can be further improved.
- the control unit may control the amount of excitation light output from the light source unit based on the determined optimum amount of light. By controlling the amount of excitation light, the amount of planar light can be easily controlled.
- the light source unit has a plurality of dimming filters having different transmittances, and the control unit selects one dimming filter from the plurality of dimming filters based on the determined optimum light amount and outputs the light source unit.
- the amount of excitation light may be controlled. This makes it possible to easily control the amount of excitation light.
- the control unit may control the current value or voltage value applied to the light source unit based on the determined optimum light amount. Even in this case, the amount of excitation light can be easily controlled.
- an output step of outputting excitation light to the sample an irradiation step of shaping the excitation light into planar light, and irradiating the sample with planar light on the XZ surface. It has a scanning step that scans the sample in the Y-axis direction at a predetermined scanning speed so as to pass through the light irradiation surface, and an observation axis that is inclined with respect to the irradiation surface.
- An imaging step for forming light an image acquisition step for acquiring a plurality of XZ image data corresponding to an optical image of observation light combined by the imaging step in the Y-axis direction at a predetermined frame rate, and execution of each step.
- a control step for controlling the light amount and scanning speed of the planar light is provided.
- the optimum light amount of the planar light in the measurement sensitivity represented by the product of the light amount of the planar light and the scanning speed is the scanning speed.
- the scanning speed and the optimum amount of planar light are determined based on the measurement sensitivity selected by the user.
- This sample observation method introduces the concept of measurement sensitivity expressed by the product of the amount of light of the planar light and the scanning speed, and the planar light to irradiate the sample with the scanning speed of the sample according to the measurement sensitivity selected by the user. Determine the optimum amount of light.
- it is necessary to control the scanning speed and the exposure time of the sample so that the resolution in the X-axis direction and the resolution in the Y-axis direction in the image acquisition step become equal to each other. Since the exposure time can be determined based on the number of pixels at the time of image acquisition, it is possible to calculate the scanning speed at which the resolution in the X-axis direction and the resolution in the Y-axis direction are equal.
- the amount of observation light that can be acquired in the image acquisition step is determined by the product of the amount of observation light per unit time and the exposure time.
- the amount of observation light can be determined based on the amount of planar light applied to the sample, and the exposure time can be determined based on the scanning speed of the sample. That is, the measurement sensitivity can be determined by the amount of planar light for the same scanning speed.
- the optimum light amount of planar light in measurement sensitivity is set according to the scanning speed, the optimum light amount of scanning speed and planar light is based on the measurement sensitivity selected by the user. Both can be decided. Therefore, the setting of measurement conditions can be simplified.
- the maximum scanning speed that can be taken at the frame rate may be determined as the scanning speed.
- Scanning speed is a parameter related to the throughput of the device required for observing the sample. Therefore, by determining the maximum scanning speed that can be taken at the frame rate as the scanning speed, the throughput of sample observation can be improved.
- the control step uses multiple different reference tables depending on the frame rate, and selects one reference table from multiple reference tables based on the frame rate corresponding to the subarray size at the time of executing the image acquisition step selected by the user. , The scanning speed and the optimum amount of light may be determined using the selected reference table. As the sub-array size becomes smaller, the frame rate becomes larger, so that the maximum value of the scanning speed can be increased. Therefore, by selectively using a plurality of different reference tables according to the frame rate, the throughput of sample observation can be further improved.
- the light amount of the excitation light in the output step may be controlled based on the determined optimum light amount.
- the amount of planar light can be easily controlled.
- a plurality of dimming filters having different transmittances are used, and in the control step, one dimming filter is selected from a plurality of dimming filters based on the determined optimum light amount, and the light amount of the excitation light in the output step is selected. May be controlled. This makes it possible to easily control the amount of excitation light.
- the current value or the voltage value applied to the light source unit that outputs the excitation light may be controlled based on the determined optimum light amount, and the light amount of the excitation light in the output step may be controlled. Even in this case, the amount of excitation light can be easily controlled.
- the setting of measurement conditions can be simplified.
- FIG. 1 is a schematic configuration diagram showing an embodiment of a sample observation device.
- This sample observation device 1 irradiates the sample S with the planar light L2, forms an image of the observation light (for example, fluorescence or scattered light) generated inside the sample S on the image forming surface, and observes the inside of the sample S.
- It is a device that acquires data.
- a slide scanner that acquires and displays an image of sample S held on a slide glass, or a plate that acquires image data of sample S held on a microplate and analyzes the image data. There are readers and so on.
- the sample observation device 1 includes a light source unit 2, an irradiation optical system 3, a scanning unit 4, an imaging optical system 5, an image acquisition unit 6, and a computer (control unit) 7. It is configured in preparation.
- sample S to be observed examples include human or animal cells, tissues, organs, animals or plants themselves, plant cells, tissues, and the like. These samples S are stained with a fluorescent material such as fluorescein-dextran (excitation wavelength: 494 nm / fluorescence wavelength: 521 nm) and tetramethylrhodamine (excitation wavelength: 555 nm / fluorescence wavelength: 580 nm).
- the sample S may be stained with a plurality of fluorescent substances. Further, the sample S may be contained in a solution, a gel, or a substance having a refractive index different from that of the sample S.
- the light source unit 2 is a portion that outputs the excitation light L1 that is applied to the sample S.
- Examples of the light source constituting the light source unit 2 include a laser light source such as a laser diode and a solid-state laser light source.
- the light source may be a light emitting diode, a super luminescent diode, or a lamp-based light source.
- the excitation light L1 output from the light source unit 2 is guided to the irradiation optical system 3.
- the light source unit 2 has a plurality of dimming filters (not shown) having different transmittances from each other. In the light source unit 2, one dimming filter is selected from a plurality of dimming filters by a control signal from the computer 7, and the amount of light of the excitation light L1 output from the light source unit 2 is controlled.
- the irradiation optical system 3 is an optical system in which the excitation light L1 output from the light source unit 2 is shaped into a planar light L2, and the shaped planar light L2 is irradiated to the sample S along the optical axis P1.
- the optical axis P1 of the irradiation optical system 3 may be referred to as the optical axis of the planar light L2.
- the irradiation optical system 3 includes an optical shaping element such as a cylindrical lens, an axicon lens, or a spatial light modulator, and is optically coupled to the light source unit 2.
- the irradiation optical system 3 may be configured to include an objective lens.
- the planar light L2 formed by the irradiation optical system 3 irradiates the sample S.
- the observation light L3 is generated on the irradiation surface R of the planar light L2.
- the observation light L3 is, for example, fluorescence excited by the planar light L2, scattered light of the planar light L2, or diffusely reflected light of the planar light L2.
- the scanning unit 4 is a mechanism for scanning the sample S with respect to the irradiation surface R of the planar light L2.
- the scanning unit 4 is configured by a moving stage 12 for moving the sample container 11 holding the sample S.
- the sample container 11 is, for example, a microplate, a slide glass, a petri dish, or the like, and has transparency to the planar light L2 and the observation light L3.
- a microplate is exemplified.
- the sample container 11 has a plate-shaped main body portion 14 in which a plurality of wells 13 in which the sample S is arranged are arranged in a straight line (or a matrix shape), and wells on one surface side of the main body portion 14. It has a plate-shaped transparent member 15 provided so as to close one end side of the 13.
- the transparent member 15 has an input surface 15a of the planar light L2 for the sample S arranged in the well 13.
- the material of the transparent member 15 is not particularly limited as long as it is a member having transparency to the planar light L2, but is, for example, glass, quartz, or synthetic resin.
- the sample container 11 is arranged with respect to the moving stage 12 so that the input surface 15a is orthogonal to the optical axis P1 of the planar light L2.
- the other end of the well 13 is open to the outside.
- the sample container 11 may be fixed to the moving stage 12.
- the moving stage 12 scans the sample container 11 at a constant speed in a preset direction according to a control signal from the computer 7.
- the moving stage 12 scans the sample container 11 in one direction in a plane orthogonal to the optical axis P1 of the planar light L2.
- the optical axis P1 direction of the planar light L2 is the Z axis
- the scanning direction of the sample container 11 by the moving stage 12 is the Y axis
- the scanning direction of the planar light L2 is orthogonal to the Y axis in a plane orthogonal to the optical axis P1 of the planar light L2.
- the direction of light is referred to as the X-axis.
- the irradiation surface R of the planar light L2 with respect to the sample S is a surface in the XZ plane.
- the imaging optical system 5 is an optical system that forms an image of the observation light L3 generated in the sample S by irradiation with the planar light L2. As shown in FIG. 2, the imaging optical system 5 includes, for example, an objective lens 16.
- the optical axis of the imaging optical system 5 is the observation axis P2 of the observation light L3.
- the observation axis P2 of the imaging optical system 5 is inclined with an inclination angle ⁇ with respect to the irradiation surface R of the planar light L2 in the sample S.
- the inclination angle ⁇ also coincides with the angle formed by the optical axis P1 and the observation axis P2 of the planar light L2 toward the sample S.
- the inclination angle ⁇ is, for example, 10 ° to 80 °.
- the inclination angle ⁇ is preferably 20 ° to 70 °. Further, from the viewpoint of improving the resolution of the observed image and the stability of the visual field, the inclination angle ⁇ is more preferably 30 ° to 65 °.
- the image acquisition unit 6 is a portion that acquires a plurality of XZ image data corresponding to an optical image by the observation light L3 imaged by the imaging optical system 5.
- the image acquisition unit 6 includes, for example, an image pickup device that captures an optical image by the observation light L3.
- Examples of the image pickup apparatus include area image sensors such as CMOS image sensors and CCD image sensors. These area image sensors are arranged on the imaging surface of the imaging optical system 5, and image an optical image by, for example, a global shutter or a rolling shutter.
- the area image sensor acquires a plurality of XZ image data (see FIG. 3), which is the data of the two-dimensional image of the sample S, in the Y-axis direction at a predetermined frame rate, and outputs the data to the computer 7.
- the computer 7 is physically configured to include a memory such as a RAM and a ROM, a processor (arithmetic circuit) such as a CPU, a communication interface, a storage unit such as a hard disk, and a display unit such as a display. Examples of such a computer 7 include a personal computer, a cloud server, a smart device (smartphone, tablet terminal, etc.) and the like.
- the computer 7 is a control unit 9 that controls the operations of the light source unit 2 and the scanning unit 4 by executing a program stored in the memory on the CPU of the computer system, and an image generation unit 8 that generates observation image data of the sample S. , And functions as an analysis unit 10 that analyzes the sample S based on the observed image data.
- the computer 7 as the control unit 9 receives the input of the measurement start operation by the user, and drives the light source unit 2, the scanning unit 4 (moving stage 12), and the image acquisition unit 6 in synchronization with each other.
- the computer 7 may control the light source so that the light source unit 2 continuously outputs the excitation light L1 while the sample S is being moved by the moving stage 12, and the light source unit 6 may control the light source in accordance with the image pickup by the image acquisition unit 6.
- the ON / OFF of the output of the excitation light L1 by the unit 2 may be controlled.
- the computer 7 may turn on / off the irradiation of the planar light L2 to the sample S by controlling the optical shutter.
- the computer 7 as the image generation unit 8 generates the observation image data of the sample S based on the plurality of XZ image data generated by the image acquisition unit 6.
- the image generation unit 8 generates observation image data of the sample S on a plane (XY plane) orthogonal to the optical axis P1 of the planar light L2, for example, based on a plurality of XZ image data output from the image acquisition unit 6. ..
- the image generation unit 8 acquires three-dimensional information of the sample S by acquiring a plurality of XZ image data 31 in the Y-axis direction.
- data is reconstructed using a plurality of XZ image data 31, and as shown in FIG.
- the sample S has an arbitrary thickness at an arbitrary position in the Z-axis direction.
- the XY image data 32 is generated as the observation image data of the sample S.
- the image generation unit 8 may generate three-dimensional data including the XY image data 32 as observation image data.
- the image generation unit 8 stores the generated observation image data, displays it on a monitor, or the like according to a predetermined operation by the user.
- the computer 7 as the analysis unit 10 executes analysis based on the observation image data generated by the image generation unit 8 and generates an analysis result.
- the analysis unit 10 stores the generated analysis result, displays it on a monitor, or the like according to a predetermined operation by the user.
- the observation image data generated by the image generation unit 8 may not be displayed on the monitor or the like, and only the analysis result generated by the analysis unit 10 may be displayed on the monitor or the like.
- control unit 9 will be described in more detail.
- control unit 9 controls the operations of the light source unit 2, the scanning unit 4 (moving stage 12), and the image acquisition unit 6 in executing the observation of the sample S.
- this sample observation device 1 the concept of "measurement sensitivity" expressed by the product of the amount of light of the planar light L2 applied to the sample S and the scanning speed of the sample S by the moving stage 12. Is introduced, and the scanning speed of the sample S and the optimum amount of light of the planar light L2 to irradiate the sample S are determined according to the measurement sensitivity selected by the user.
- the resolution Reso (X) in the X-axis direction and the resolution Reso (Y) in the Y-axis direction in the image acquisition unit 6 are equal to each other. It is necessary to control the scanning speed and the exposure time of the sample S. As an example, it is conceivable to input a trigger signal from the moving stage 12 to the image acquisition unit 6 at an interval corresponding to Reso (Y) and control the exposure according to the interval of the trigger signal.
- Reso (X) can be determined by dividing the pixel size in the X-axis direction of the image pickup device constituting the image acquisition unit 6 by a magnification
- Reso (Y) is a magnification of the pixel size in the Y-axis direction of the image pickup device. It can be determined by dividing by.
- the amount of light of the observation light L3 that can be acquired by the image acquisition unit 6 is determined by the product of the amount of light of the observation light L3 per unit time and the exposure time.
- the amount of light of the observation light L3 can be determined based on the amount of light of the planar light L2 applied to the sample S, and the exposure time can be determined based on the scanning speed of the sample S as described above. That is, the measurement sensitivity, which is the product of the amount of light of the planar light L2 and the scanning speed of the sample S, can be determined by the amount of light of the planar light L2 for the same scanning speed.
- the control unit 9 when determining the scanning speed of the sample S and the optimum light amount of the planar light L2 to irradiate the sample S, the optimum light amount of the planar light L2 in the measurement sensitivity is set according to the scanning speed. With reference to the reference table provided, the scanning speed of the sample S and the optimum amount of light of the planar light L2 are automatically determined based on the measurement sensitivity selected by the user.
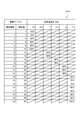
- the control unit 9 has a plurality of different reference tables 41 (41A to 41C) depending on the frame rate of the image pickup apparatus constituting the image acquisition unit 6.
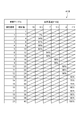
- the reference table 41A shown in FIG. 5 is used when the frame rate is high (for example, 3500 fps), and the reference table 41B shown in FIG. 6 is used when the frame rate is medium (for example, 3000 fps).
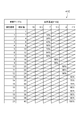
- the reference table 41C shown in 1 is used when the frame rate is small (for example, 2500 fps).
- the reference table 41 may be stored in the control unit 9 in advance, or may be stored in the control unit 9 by causing the computer 7 to read a recording medium for storing the data constituting the reference table 41. You may. Further, each observation of the sample S may be stored in the control unit 9 by wired or wireless communication.
- the row direction is the measurement sensitivity and the column direction is the scanning speed.
- the optimum amount of planar light L2 at each measurement sensitivity is shown as a relative value when the maximum output of the excitation light L1 output from the light source unit 2 is 100%. A relative value is added to the measurement sensitivity in the row direction.
- the scanning speed is 10 mm / s and the amount of light of the planar light L2 is 10% at the minimum setting value of the measurement sensitivity, and the product in this case is set to the relative value 1.
- the frame rate of the image pickup apparatus in the image acquisition unit 6 is determined according to the sub-array size of the image acquisition unit 6.
- the setting of the sub-array size is selected by the user in consideration of the amount of data used for observing the sample S, the observation accuracy, the observation area in the depth direction, and the like. Since the frame rate increases as the sub-array size decreases, the maximum value of the scanning speed can be increased.
- the relationship between the measurement sensitivity and the scanning speed is set so that the maximum scanning speed that can be taken at the frame rate of the image acquisition unit 6 is determined as the scanning speed.
- the maximum value of the scanning speed is 10 mm / s as shown in FIG.
- the scanning speed is set to 10 mm / s when the relative value setting is 1 to 10
- the scanning speed is 7 mm / s when the relative value setting is 12 to 14.
- the scanning speed is set to 5.5 mm / s.
- the scanning speed is set to 4 mm / s
- the scanning speed is set to 2.5 mm / s. In the range where the scanning speed is the same, the larger the setting of the relative value, the larger the setting value of the light amount of the planar light L2.
- the maximum scanning speed is 8.5 mm / s, as shown in FIG.
- the scanning speed is set to 8.5 mm / s when the relative value setting is 2 to 10
- the scanning speed is 7 mm when the relative value setting is 12 to 14.
- the scanning speed is set to 5.5 mm / s.
- the scanning speed is set to 20 to 24
- the scanning speed is set to 4 mm / s
- the relative value is set to 26 to 40
- the scanning speed is set to 2.5 mm / s.
- the larger the setting of the relative value the larger the setting value of the light amount of the planar light L2.
- the maximum value of the scanning speed is 7 mm / s.
- the scanning speed is set to 7 mm / s when the relative value setting is 2 to 14, and the scanning speed is 5.5 mm when the relative value setting is 16 to 18.
- the scanning speed is set to 4 mm / s.
- the scanning speed is set to 2.5 mm / s. In the range where the scanning speed is the same, the larger the setting of the relative value, the larger the setting value of the light amount of the planar light L2.
- the control unit 9 selects one reference table 41 from the plurality of reference tables 41A to 41C based on the frame rate corresponding to the sub-array size selected by the user. Then, the scanning speed of the sample S and the optimum light amount of the planar light L2 are determined based on the measurement sensitivity selected by the user with reference to the selected reference table 41. The control unit 9 controls the operations of the light source unit 2 and the scanning unit 4 based on the determined scanning speed and the optimum amount of light.
- the control unit 9 controls the amount of light of the excitation light L1 output from the light source unit 2 based on the determined optimum light amount.
- the light source unit 2 is provided with a plurality of dimming filters (not shown) having different transmittances.
- the control unit 9 selects one dimming filter from a plurality of dimming filters based on the determined optimum light amount, and controls the light amount of the excitation light L1 output from the light source unit 2.
- the amount of light of the excitation light L1 By controlling the amount of light of the excitation light L1, the amount of light of the planar light L2 irradiated to the sample S can be controlled, and as a result, the amount of light of the observation light L3 generated in the sample S can be controlled.
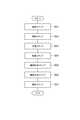
- FIG. 8 is a flowchart showing an example of the sample observation method.
- this sample observation method includes a control step (step S01), an irradiation step (step S02), a scanning step (step S03), an imaging step (step S04), and an image acquisition step (step S05). It includes an image generation step (step S06) and an analysis step (step S07).
- control step S01 first, the selection of the measurement sensitivity and the selection of the sub-array size from the user are accepted.
- the frame rate of the image pickup apparatus constituting the image acquisition unit 6 is set based on the sub-array size selected by the user, and the reference table 41 corresponding to the set frame rate is among the reference tables 41A to 41C. Is selected from.
- the selected reference table 41 is referred to, and the scanning speed and the optimum light amount corresponding to the measurement sensitivity selected by the user are determined.
- the sample S is irradiated with the planar light L2.
- the light source unit 2 is driven based on the control signal from the computer 7, and the excitation light L1 is output from the light source unit 2.
- the excitation light L1 output from the light source unit 2 is shaped by the irradiation optical system 3 to become planar light L2, which is irradiated to the sample S.
- the amount of light of the excitation light L1 output from the light source unit 2 is controlled by the selection of the dimming filter in the control unit 9 so as to have the optimum amount of light determined in the control step S01.
- the sample S is scanned against the irradiation surface R of the planar light L2.
- the moving stage 12 is driven in synchronization with the drive of the light source unit 2 based on the control signal from the computer 7.
- the sample container 11 is linearly driven in the Y-axis direction at a constant speed, and the sample S in the well 13 is scanned with respect to the irradiation surface R of the planar light L2.
- the scanning speed of the sample S by the moving stage 12 is controlled by the control unit 9 so as to be the scanning speed determined in the control step S01.
- the imaging optical system 5 having the observation axis P2 inclined with respect to the irradiation surface R is used, and the observation light L3 generated in the sample S by the irradiation of the planar light L2 is imaged by the image acquisition unit 6. An image is formed on a surface.
- the image acquisition step S05 a plurality of XZ image data 31 corresponding to the optical image formed by the observation light L3 imaged by the imaging optical system 5 are acquired at a predetermined frame rate in the Y-axis direction. The plurality of XZ image data 31 are sequentially output from the image acquisition unit 6 to the image generation unit 8.
- the observation image data of the sample S is generated based on the plurality of XZ image data 31.
- the XY image data 32 having an arbitrary thickness at an arbitrary position in the Z-axis direction in the sample S is the observation image data of the sample S. Is generated as.
- the analysis unit 10 analyzes the observed image data and generates an analysis result.
- XY image data 32 which is observation image data
- the analysis unit 10 evaluates the reagent based on the obtained XY image data 32, and the evaluation data is generated as an analysis result.
- the analysis unit 10 may acquire and analyze three-dimensional data including the XY image data 32 as observation image data.
- the sample observation device 1 introduces the concept of measurement sensitivity expressed by the product of the light amount of the planar light L2 and the scanning speed, and the optimum light amount of the planar light in the measurement sensitivity depends on the scanning speed.
- the scanning speed of the sample S and the optimum amount of light of the planar light L2 to irradiate the sample S are determined according to the measurement sensitivity selected by the user.
- the user selects the measurement sensitivity, so that the scanning speed of the sample S and the surface to be irradiated on the sample S are not complicatedly set for the light source unit 2, the scanning unit 4, and the image acquisition unit 6. Since the optimum amount of light for the light L2 is determined, the setting of measurement conditions can be simplified.
- the maximum scanning speed that can be taken at the frame rate of the image acquisition unit 6 is determined as the scanning speed.
- Scanning speed is a parameter related to sample observation throughput. Therefore, by determining the maximum scanning speed that can be taken at the frame rate of the image acquisition unit 6 as the scanning speed, the throughput of sample observation can be improved.
- the control unit 9 has a plurality of different reference tables 41 (41A to 41C) according to the frame rate, and the frame rate corresponds to the sub-array size of the image acquisition unit 6 selected by the user. Based on this, one reference table 41 is selected from the plurality of reference tables 41A to 41C, and the scanning speed and the optimum light amount are determined using the selected reference table 41. As the sub-array size becomes smaller, the frame rate becomes larger, so that the maximum value of the scanning speed can be increased. Therefore, by selectively using a plurality of different reference tables 41A to 41C according to the frame rate, the throughput of sample observation can be more reliably improved.
- the sample observation device 1 controls the amount of light of the excitation light L1 output from the light source unit 2 based on the determined optimum amount of light. By controlling the amount of the excitation light L1 in this way, the amount of the planar light L2 irradiated on the sample S can be easily controlled.
- one dimming filter is selected from a plurality of dimming filters having different transmittances. Thereby, the amount of light of the excitation light L1 can be easily controlled.
- the control unit 9 has a plurality of different reference tables 41 (41A to 41C) depending on the frame rate, but the control unit 9 has a single reference table 41 regardless of the frame rate. May have.
- the control unit 9 controls so that the light amount of the excitation light L1 becomes the optimum light amount by selecting one dimming filter from the plurality of dimming filters arranged in the light source unit 2. , One dimming filter may be selected and applied from a plurality of dimming filters for the planar light L2. Further, the control unit 9 may control the output of the light source itself by controlling the current value or the voltage value applied to the light source unit 2. Even in this case, the amount of the excitation light L1 can be easily controlled.
Landscapes
- Physics & Mathematics (AREA)
- Health & Medical Sciences (AREA)
- Analytical Chemistry (AREA)
- General Physics & Mathematics (AREA)
- Chemical & Material Sciences (AREA)
- Biochemistry (AREA)
- Life Sciences & Earth Sciences (AREA)
- General Health & Medical Sciences (AREA)
- Nuclear Medicine, Radiotherapy & Molecular Imaging (AREA)
- Immunology (AREA)
- Pathology (AREA)
- Optics & Photonics (AREA)
- Investigating, Analyzing Materials By Fluorescence Or Luminescence (AREA)
- Microscoopes, Condenser (AREA)
Priority Applications (3)
| Application Number | Priority Date | Filing Date | Title |
|---|---|---|---|
| JP2022528448A JPWO2021246021A1 (de) | 2020-06-01 | 2021-03-17 | |
| US17/925,131 US20230184681A1 (en) | 2020-06-01 | 2021-03-17 | Sample observation device and sample observation method |
| EP21818864.7A EP4137864A4 (de) | 2020-06-01 | 2021-03-17 | Probenbeobachtungsvorrichtung und probenbeobachtungsverfahren |
Applications Claiming Priority (2)
| Application Number | Priority Date | Filing Date | Title |
|---|---|---|---|
| JP2020-095508 | 2020-06-01 | ||
| JP2020095508 | 2020-06-01 |
Publications (1)
| Publication Number | Publication Date |
|---|---|
| WO2021246021A1 true WO2021246021A1 (ja) | 2021-12-09 |
Family
ID=78830778
Family Applications (1)
| Application Number | Title | Priority Date | Filing Date |
|---|---|---|---|
| PCT/JP2021/010879 WO2021246021A1 (ja) | 2020-06-01 | 2021-03-17 | 試料観察装置及び試料観察方法 |
Country Status (4)
| Country | Link |
|---|---|
| US (1) | US20230184681A1 (de) |
| EP (1) | EP4137864A4 (de) |
| JP (1) | JPWO2021246021A1 (de) |
| WO (1) | WO2021246021A1 (de) |
Citations (6)
| Publication number | Priority date | Publication date | Assignee | Title |
|---|---|---|---|---|
| JP2012226145A (ja) * | 2011-04-20 | 2012-11-15 | Yokogawa Electric Corp | 顕微鏡装置 |
| JP2017053918A (ja) * | 2015-09-07 | 2017-03-16 | オリンパス株式会社 | シート照明顕微鏡システム、画像処理装置、シート照明顕微鏡法、及び、プログラム |
| JP2018520388A (ja) * | 2015-07-17 | 2018-07-26 | ライカ マイクロシステムズ シーエムエス ゲゼルシャフト ミット ベシュレンクテル ハフツングLeica Microsystems CMS GmbH | 複数の対象面を同時にイメージングする光シート顕微鏡 |
| JP2019526829A (ja) * | 2016-08-15 | 2019-09-19 | ライカ マイクロシステムズ シーエムエス ゲゼルシャフト ミット ベシュレンクテル ハフツングLeica Microsystems CMS GmbH | ライトシート顕微鏡 |
| JP2019184403A (ja) * | 2018-04-09 | 2019-10-24 | 浜松ホトニクス株式会社 | 試料観察装置及び試料観察方法 |
| JP2019184401A (ja) | 2018-04-09 | 2019-10-24 | 浜松ホトニクス株式会社 | 試料観察装置及び試料観察方法 |
-
2021
- 2021-03-17 JP JP2022528448A patent/JPWO2021246021A1/ja active Pending
- 2021-03-17 US US17/925,131 patent/US20230184681A1/en active Pending
- 2021-03-17 EP EP21818864.7A patent/EP4137864A4/de active Pending
- 2021-03-17 WO PCT/JP2021/010879 patent/WO2021246021A1/ja unknown
Patent Citations (6)
| Publication number | Priority date | Publication date | Assignee | Title |
|---|---|---|---|---|
| JP2012226145A (ja) * | 2011-04-20 | 2012-11-15 | Yokogawa Electric Corp | 顕微鏡装置 |
| JP2018520388A (ja) * | 2015-07-17 | 2018-07-26 | ライカ マイクロシステムズ シーエムエス ゲゼルシャフト ミット ベシュレンクテル ハフツングLeica Microsystems CMS GmbH | 複数の対象面を同時にイメージングする光シート顕微鏡 |
| JP2017053918A (ja) * | 2015-09-07 | 2017-03-16 | オリンパス株式会社 | シート照明顕微鏡システム、画像処理装置、シート照明顕微鏡法、及び、プログラム |
| JP2019526829A (ja) * | 2016-08-15 | 2019-09-19 | ライカ マイクロシステムズ シーエムエス ゲゼルシャフト ミット ベシュレンクテル ハフツングLeica Microsystems CMS GmbH | ライトシート顕微鏡 |
| JP2019184403A (ja) * | 2018-04-09 | 2019-10-24 | 浜松ホトニクス株式会社 | 試料観察装置及び試料観察方法 |
| JP2019184401A (ja) | 2018-04-09 | 2019-10-24 | 浜松ホトニクス株式会社 | 試料観察装置及び試料観察方法 |
Also Published As
| Publication number | Publication date |
|---|---|
| EP4137864A1 (de) | 2023-02-22 |
| US20230184681A1 (en) | 2023-06-15 |
| EP4137864A4 (de) | 2024-06-05 |
| JPWO2021246021A1 (de) | 2021-12-09 |
Similar Documents
| Publication | Publication Date | Title |
|---|---|---|
| US11822066B2 (en) | Sample observation device and sample observation method | |
| JP2022132488A (ja) | 装置、方法、及びプログラム | |
| WO2021246021A1 (ja) | 試料観察装置及び試料観察方法 | |
| EP3779411B1 (de) | Probenbeobachtungsvorrichtung und probenbeobachtungsverfahren | |
| US11340165B2 (en) | Sample observation device and sample observation method | |
| JP6978562B2 (ja) | 試料観察装置及び試料観察方法 | |
| JP6754408B2 (ja) | 試料観察装置及び試料観察方法 | |
| EP4321917A1 (de) | Probenbeobachtungsvorrichtung und probenbeobachtungsverfahren | |
| US20240184090A1 (en) | Sample observation device and sample observation method | |
| WO2021256429A1 (ja) | 試料観察装置及び試料観察方法 | |
| JP7125936B2 (ja) | 試料観察装置及び試料観察方法 |
Legal Events
| Date | Code | Title | Description |
|---|---|---|---|
| 121 | Ep: the epo has been informed by wipo that ep was designated in this application |
Ref document number: 21818864 Country of ref document: EP Kind code of ref document: A1 |
|
| ENP | Entry into the national phase |
Ref document number: 2022528448 Country of ref document: JP Kind code of ref document: A |
|
| ENP | Entry into the national phase |
Ref document number: 2021818864 Country of ref document: EP Effective date: 20221118 |
|
| NENP | Non-entry into the national phase |
Ref country code: DE |