WO2021246021A1 - 試料観察装置及び試料観察方法 - Google Patents
試料観察装置及び試料観察方法 Download PDFInfo
- Publication number
- WO2021246021A1 WO2021246021A1 PCT/JP2021/010879 JP2021010879W WO2021246021A1 WO 2021246021 A1 WO2021246021 A1 WO 2021246021A1 JP 2021010879 W JP2021010879 W JP 2021010879W WO 2021246021 A1 WO2021246021 A1 WO 2021246021A1
- Authority
- WO
- WIPO (PCT)
- Prior art keywords
- light
- sample
- scanning speed
- amount
- observation
- Prior art date
Links
Images


Classifications
-
- G—PHYSICS
- G01—MEASURING; TESTING
- G01N—INVESTIGATING OR ANALYSING MATERIALS BY DETERMINING THEIR CHEMICAL OR PHYSICAL PROPERTIES
- G01N21/00—Investigating or analysing materials by the use of optical means, i.e. using sub-millimetre waves, infrared, visible or ultraviolet light
- G01N21/62—Systems in which the material investigated is excited whereby it emits light or causes a change in wavelength of the incident light
- G01N21/63—Systems in which the material investigated is excited whereby it emits light or causes a change in wavelength of the incident light optically excited
- G01N21/64—Fluorescence; Phosphorescence
- G01N21/645—Specially adapted constructive features of fluorimeters
- G01N21/6456—Spatial resolved fluorescence measurements; Imaging
-
- G—PHYSICS
- G01—MEASURING; TESTING
- G01N—INVESTIGATING OR ANALYSING MATERIALS BY DETERMINING THEIR CHEMICAL OR PHYSICAL PROPERTIES
- G01N21/00—Investigating or analysing materials by the use of optical means, i.e. using sub-millimetre waves, infrared, visible or ultraviolet light
- G01N21/62—Systems in which the material investigated is excited whereby it emits light or causes a change in wavelength of the incident light
- G01N21/63—Systems in which the material investigated is excited whereby it emits light or causes a change in wavelength of the incident light optically excited
- G01N21/64—Fluorescence; Phosphorescence
- G01N21/645—Specially adapted constructive features of fluorimeters
- G01N21/6452—Individual samples arranged in a regular 2D-array, e.g. multiwell plates
-
- G—PHYSICS
- G02—OPTICS
- G02B—OPTICAL ELEMENTS, SYSTEMS OR APPARATUS
- G02B21/00—Microscopes
- G02B21/0004—Microscopes specially adapted for specific applications
- G02B21/002—Scanning microscopes
- G02B21/0024—Confocal scanning microscopes (CSOMs) or confocal "macroscopes"; Accessories which are not restricted to use with CSOMs, e.g. sample holders
- G02B21/0032—Optical details of illumination, e.g. light-sources, pinholes, beam splitters, slits, fibers
-
- G—PHYSICS
- G02—OPTICS
- G02B—OPTICAL ELEMENTS, SYSTEMS OR APPARATUS
- G02B21/00—Microscopes
- G02B21/0004—Microscopes specially adapted for specific applications
- G02B21/002—Scanning microscopes
- G02B21/0024—Confocal scanning microscopes (CSOMs) or confocal "macroscopes"; Accessories which are not restricted to use with CSOMs, e.g. sample holders
- G02B21/0036—Scanning details, e.g. scanning stages
-
- G—PHYSICS
- G01—MEASURING; TESTING
- G01N—INVESTIGATING OR ANALYSING MATERIALS BY DETERMINING THEIR CHEMICAL OR PHYSICAL PROPERTIES
- G01N21/00—Investigating or analysing materials by the use of optical means, i.e. using sub-millimetre waves, infrared, visible or ultraviolet light
- G01N21/62—Systems in which the material investigated is excited whereby it emits light or causes a change in wavelength of the incident light
- G01N21/63—Systems in which the material investigated is excited whereby it emits light or causes a change in wavelength of the incident light optically excited
- G01N21/64—Fluorescence; Phosphorescence
- G01N21/6428—Measuring fluorescence of fluorescent products of reactions or of fluorochrome labelled reactive substances, e.g. measuring quenching effects, using measuring "optrodes"
- G01N2021/6439—Measuring fluorescence of fluorescent products of reactions or of fluorochrome labelled reactive substances, e.g. measuring quenching effects, using measuring "optrodes" with indicators, stains, dyes, tags, labels, marks
-
- G—PHYSICS
- G01—MEASURING; TESTING
- G01N—INVESTIGATING OR ANALYSING MATERIALS BY DETERMINING THEIR CHEMICAL OR PHYSICAL PROPERTIES
- G01N2201/00—Features of devices classified in G01N21/00
- G01N2201/10—Scanning
- G01N2201/103—Scanning by mechanical motion of stage
-
- G—PHYSICS
- G02—OPTICS
- G02B—OPTICAL ELEMENTS, SYSTEMS OR APPARATUS
- G02B21/00—Microscopes
- G02B21/06—Means for illuminating specimens
-
- G—PHYSICS
- G02—OPTICS
- G02B—OPTICAL ELEMENTS, SYSTEMS OR APPARATUS
- G02B2207/00—Coding scheme for general features or characteristics of optical elements and systems of subclass G02B, but not including elements and systems which would be classified in G02B6/00 and subgroups
- G02B2207/113—Fluorescence
Definitions
- This disclosure relates to a sample observation device and a sample observation method.
- SPIM Selective Plane Illumination Microscopy
- a technique related to such a technique for example, there is a sample observation device described in Patent Document 1.
- the sample observation device of Patent Document 1 has an irradiation optical system that irradiates a sample with planar light on the XZ surface, a scanning unit that scans the sample in the Y-axis direction with respect to the irradiation surface of the planar light, and an irradiation surface.
- It has an observation axis that is tilted with respect to it, and is equipped with an imaging optical system that forms an image of the observation light generated in the sample by irradiation with planar light.
- this sample observation device a plurality of XZ image data of the sample are acquired in the Y-axis direction, and the X-image data generated by integrating the brightness values of the analysis region in the XZ image data in the Z direction are combined in the Y-axis direction to form a sample.
- XY image data is generated.
- the present disclosure has been made to solve the above problems, and an object of the present disclosure is to provide a sample observation device and a sample observation method that can simplify the setting of measurement conditions.
- the sample observation device includes a light source unit that outputs excitation light to the sample, an irradiation optical system that shapes the excitation light into planar light, and irradiates the sample with the planar light on the XZ surface. It has a scanning unit that scans the sample in the Y-axis direction at a predetermined scanning speed so as to pass through the illuminated surface of the surface light, and an observation axis that is inclined with respect to the irradiation surface.
- An imaging optical system that forms an image of the observed observation light, an image acquisition unit that acquires a plurality of XZ image data corresponding to an optical image of the observation light coupled by the imaging optical system in the Y-axis direction at a predetermined frame rate, and an image acquisition unit.
- the control unit includes a control unit that controls the amount of light and the scanning speed of the planar light, and the control unit has an optimum amount of light of the planar light represented by the product of the amount of light of the planar light and the scanning speed according to the scanning speed. With reference to the set reference table, the scanning speed and the optimum amount of planar light are determined based on the measurement sensitivity selected by the user.
- This sample observation device introduces the concept of measurement sensitivity expressed by the product of the amount of planar light and the scanning speed, and the planar light to irradiate the sample with the scanning speed of the sample according to the measurement sensitivity selected by the user. Determine the optimum amount of light.
- it is necessary to control the scanning speed and the exposure time of the sample so that the resolution in the X-axis direction and the resolution in the Y-axis direction at the image acquisition unit become equal to each other. Since the exposure time can be determined based on the number of pixels in the image acquisition unit, it is possible to calculate the scanning speed at which the resolution in the X-axis direction and the resolution in the Y-axis direction are equal.
- the amount of observation light that can be acquired by the image acquisition unit is determined by the product of the amount of observation light per unit time and the exposure time.
- the amount of observation light can be determined based on the amount of planar light applied to the sample, and the exposure time can be determined based on the scanning speed of the sample. That is, the measurement sensitivity can be determined by the amount of planar light for the same scanning speed.
- the optimum light amount of the planar light in the measurement sensitivity refers to the reference table set according to the scanning speed, and the optimum light amount of the scanning speed and the planar light is based on the measurement sensitivity selected by the user. Both can be decided. Therefore, the setting of measurement conditions can be simplified.
- the control unit may determine the maximum scanning speed that can be taken at the frame rate as the scanning speed.
- Scanning speed is a parameter related to sample observation throughput. Therefore, by determining the maximum scanning speed that can be taken at the frame rate as the scanning speed, the throughput of sample observation can be improved.
- the control unit has a plurality of different reference tables according to the frame rate, and selects one reference table from the plurality of reference tables based on the frame rate corresponding to the subarray size of the image acquisition unit selected by the user.
- the scanning speed and the optimum amount of light may be determined using the selected reference table.
- the frame rate becomes larger, so that the maximum value of the scanning speed can be increased. Therefore, by selectively using a plurality of different reference tables according to the frame rate, the throughput of sample observation can be further improved.
- the control unit may control the amount of excitation light output from the light source unit based on the determined optimum amount of light. By controlling the amount of excitation light, the amount of planar light can be easily controlled.
- the light source unit has a plurality of dimming filters having different transmittances, and the control unit selects one dimming filter from the plurality of dimming filters based on the determined optimum light amount and outputs the light source unit.
- the amount of excitation light may be controlled. This makes it possible to easily control the amount of excitation light.
- the control unit may control the current value or voltage value applied to the light source unit based on the determined optimum light amount. Even in this case, the amount of excitation light can be easily controlled.
- an output step of outputting excitation light to the sample an irradiation step of shaping the excitation light into planar light, and irradiating the sample with planar light on the XZ surface. It has a scanning step that scans the sample in the Y-axis direction at a predetermined scanning speed so as to pass through the light irradiation surface, and an observation axis that is inclined with respect to the irradiation surface.
- An imaging step for forming light an image acquisition step for acquiring a plurality of XZ image data corresponding to an optical image of observation light combined by the imaging step in the Y-axis direction at a predetermined frame rate, and execution of each step.
- a control step for controlling the light amount and scanning speed of the planar light is provided.
- the optimum light amount of the planar light in the measurement sensitivity represented by the product of the light amount of the planar light and the scanning speed is the scanning speed.
- the scanning speed and the optimum amount of planar light are determined based on the measurement sensitivity selected by the user.
- This sample observation method introduces the concept of measurement sensitivity expressed by the product of the amount of light of the planar light and the scanning speed, and the planar light to irradiate the sample with the scanning speed of the sample according to the measurement sensitivity selected by the user. Determine the optimum amount of light.
- it is necessary to control the scanning speed and the exposure time of the sample so that the resolution in the X-axis direction and the resolution in the Y-axis direction in the image acquisition step become equal to each other. Since the exposure time can be determined based on the number of pixels at the time of image acquisition, it is possible to calculate the scanning speed at which the resolution in the X-axis direction and the resolution in the Y-axis direction are equal.
- the amount of observation light that can be acquired in the image acquisition step is determined by the product of the amount of observation light per unit time and the exposure time.
- the amount of observation light can be determined based on the amount of planar light applied to the sample, and the exposure time can be determined based on the scanning speed of the sample. That is, the measurement sensitivity can be determined by the amount of planar light for the same scanning speed.
- the optimum light amount of planar light in measurement sensitivity is set according to the scanning speed, the optimum light amount of scanning speed and planar light is based on the measurement sensitivity selected by the user. Both can be decided. Therefore, the setting of measurement conditions can be simplified.
- the maximum scanning speed that can be taken at the frame rate may be determined as the scanning speed.
- Scanning speed is a parameter related to the throughput of the device required for observing the sample. Therefore, by determining the maximum scanning speed that can be taken at the frame rate as the scanning speed, the throughput of sample observation can be improved.
- the control step uses multiple different reference tables depending on the frame rate, and selects one reference table from multiple reference tables based on the frame rate corresponding to the subarray size at the time of executing the image acquisition step selected by the user. , The scanning speed and the optimum amount of light may be determined using the selected reference table. As the sub-array size becomes smaller, the frame rate becomes larger, so that the maximum value of the scanning speed can be increased. Therefore, by selectively using a plurality of different reference tables according to the frame rate, the throughput of sample observation can be further improved.
- the light amount of the excitation light in the output step may be controlled based on the determined optimum light amount.
- the amount of planar light can be easily controlled.
- a plurality of dimming filters having different transmittances are used, and in the control step, one dimming filter is selected from a plurality of dimming filters based on the determined optimum light amount, and the light amount of the excitation light in the output step is selected. May be controlled. This makes it possible to easily control the amount of excitation light.
- the current value or the voltage value applied to the light source unit that outputs the excitation light may be controlled based on the determined optimum light amount, and the light amount of the excitation light in the output step may be controlled. Even in this case, the amount of excitation light can be easily controlled.
- the setting of measurement conditions can be simplified.
- FIG. 1 is a schematic configuration diagram showing an embodiment of a sample observation device.
- This sample observation device 1 irradiates the sample S with the planar light L2, forms an image of the observation light (for example, fluorescence or scattered light) generated inside the sample S on the image forming surface, and observes the inside of the sample S.
- It is a device that acquires data.
- a slide scanner that acquires and displays an image of sample S held on a slide glass, or a plate that acquires image data of sample S held on a microplate and analyzes the image data. There are readers and so on.
- the sample observation device 1 includes a light source unit 2, an irradiation optical system 3, a scanning unit 4, an imaging optical system 5, an image acquisition unit 6, and a computer (control unit) 7. It is configured in preparation.
- sample S to be observed examples include human or animal cells, tissues, organs, animals or plants themselves, plant cells, tissues, and the like. These samples S are stained with a fluorescent material such as fluorescein-dextran (excitation wavelength: 494 nm / fluorescence wavelength: 521 nm) and tetramethylrhodamine (excitation wavelength: 555 nm / fluorescence wavelength: 580 nm).
- the sample S may be stained with a plurality of fluorescent substances. Further, the sample S may be contained in a solution, a gel, or a substance having a refractive index different from that of the sample S.
- the light source unit 2 is a portion that outputs the excitation light L1 that is applied to the sample S.
- Examples of the light source constituting the light source unit 2 include a laser light source such as a laser diode and a solid-state laser light source.
- the light source may be a light emitting diode, a super luminescent diode, or a lamp-based light source.
- the excitation light L1 output from the light source unit 2 is guided to the irradiation optical system 3.
- the light source unit 2 has a plurality of dimming filters (not shown) having different transmittances from each other. In the light source unit 2, one dimming filter is selected from a plurality of dimming filters by a control signal from the computer 7, and the amount of light of the excitation light L1 output from the light source unit 2 is controlled.
- the irradiation optical system 3 is an optical system in which the excitation light L1 output from the light source unit 2 is shaped into a planar light L2, and the shaped planar light L2 is irradiated to the sample S along the optical axis P1.
- the optical axis P1 of the irradiation optical system 3 may be referred to as the optical axis of the planar light L2.
- the irradiation optical system 3 includes an optical shaping element such as a cylindrical lens, an axicon lens, or a spatial light modulator, and is optically coupled to the light source unit 2.
- the irradiation optical system 3 may be configured to include an objective lens.
- the planar light L2 formed by the irradiation optical system 3 irradiates the sample S.
- the observation light L3 is generated on the irradiation surface R of the planar light L2.
- the observation light L3 is, for example, fluorescence excited by the planar light L2, scattered light of the planar light L2, or diffusely reflected light of the planar light L2.
- the scanning unit 4 is a mechanism for scanning the sample S with respect to the irradiation surface R of the planar light L2.
- the scanning unit 4 is configured by a moving stage 12 for moving the sample container 11 holding the sample S.
- the sample container 11 is, for example, a microplate, a slide glass, a petri dish, or the like, and has transparency to the planar light L2 and the observation light L3.
- a microplate is exemplified.
- the sample container 11 has a plate-shaped main body portion 14 in which a plurality of wells 13 in which the sample S is arranged are arranged in a straight line (or a matrix shape), and wells on one surface side of the main body portion 14. It has a plate-shaped transparent member 15 provided so as to close one end side of the 13.
- the transparent member 15 has an input surface 15a of the planar light L2 for the sample S arranged in the well 13.
- the material of the transparent member 15 is not particularly limited as long as it is a member having transparency to the planar light L2, but is, for example, glass, quartz, or synthetic resin.
- the sample container 11 is arranged with respect to the moving stage 12 so that the input surface 15a is orthogonal to the optical axis P1 of the planar light L2.
- the other end of the well 13 is open to the outside.
- the sample container 11 may be fixed to the moving stage 12.
- the moving stage 12 scans the sample container 11 at a constant speed in a preset direction according to a control signal from the computer 7.
- the moving stage 12 scans the sample container 11 in one direction in a plane orthogonal to the optical axis P1 of the planar light L2.
- the optical axis P1 direction of the planar light L2 is the Z axis
- the scanning direction of the sample container 11 by the moving stage 12 is the Y axis
- the scanning direction of the planar light L2 is orthogonal to the Y axis in a plane orthogonal to the optical axis P1 of the planar light L2.
- the direction of light is referred to as the X-axis.
- the irradiation surface R of the planar light L2 with respect to the sample S is a surface in the XZ plane.
- the imaging optical system 5 is an optical system that forms an image of the observation light L3 generated in the sample S by irradiation with the planar light L2. As shown in FIG. 2, the imaging optical system 5 includes, for example, an objective lens 16.
- the optical axis of the imaging optical system 5 is the observation axis P2 of the observation light L3.
- the observation axis P2 of the imaging optical system 5 is inclined with an inclination angle ⁇ with respect to the irradiation surface R of the planar light L2 in the sample S.
- the inclination angle ⁇ also coincides with the angle formed by the optical axis P1 and the observation axis P2 of the planar light L2 toward the sample S.
- the inclination angle ⁇ is, for example, 10 ° to 80 °.
- the inclination angle ⁇ is preferably 20 ° to 70 °. Further, from the viewpoint of improving the resolution of the observed image and the stability of the visual field, the inclination angle ⁇ is more preferably 30 ° to 65 °.
- the image acquisition unit 6 is a portion that acquires a plurality of XZ image data corresponding to an optical image by the observation light L3 imaged by the imaging optical system 5.
- the image acquisition unit 6 includes, for example, an image pickup device that captures an optical image by the observation light L3.
- Examples of the image pickup apparatus include area image sensors such as CMOS image sensors and CCD image sensors. These area image sensors are arranged on the imaging surface of the imaging optical system 5, and image an optical image by, for example, a global shutter or a rolling shutter.
- the area image sensor acquires a plurality of XZ image data (see FIG. 3), which is the data of the two-dimensional image of the sample S, in the Y-axis direction at a predetermined frame rate, and outputs the data to the computer 7.
- the computer 7 is physically configured to include a memory such as a RAM and a ROM, a processor (arithmetic circuit) such as a CPU, a communication interface, a storage unit such as a hard disk, and a display unit such as a display. Examples of such a computer 7 include a personal computer, a cloud server, a smart device (smartphone, tablet terminal, etc.) and the like.
- the computer 7 is a control unit 9 that controls the operations of the light source unit 2 and the scanning unit 4 by executing a program stored in the memory on the CPU of the computer system, and an image generation unit 8 that generates observation image data of the sample S. , And functions as an analysis unit 10 that analyzes the sample S based on the observed image data.
- the computer 7 as the control unit 9 receives the input of the measurement start operation by the user, and drives the light source unit 2, the scanning unit 4 (moving stage 12), and the image acquisition unit 6 in synchronization with each other.
- the computer 7 may control the light source so that the light source unit 2 continuously outputs the excitation light L1 while the sample S is being moved by the moving stage 12, and the light source unit 6 may control the light source in accordance with the image pickup by the image acquisition unit 6.
- the ON / OFF of the output of the excitation light L1 by the unit 2 may be controlled.
- the computer 7 may turn on / off the irradiation of the planar light L2 to the sample S by controlling the optical shutter.
- the computer 7 as the image generation unit 8 generates the observation image data of the sample S based on the plurality of XZ image data generated by the image acquisition unit 6.
- the image generation unit 8 generates observation image data of the sample S on a plane (XY plane) orthogonal to the optical axis P1 of the planar light L2, for example, based on a plurality of XZ image data output from the image acquisition unit 6. ..
- the image generation unit 8 acquires three-dimensional information of the sample S by acquiring a plurality of XZ image data 31 in the Y-axis direction.
- data is reconstructed using a plurality of XZ image data 31, and as shown in FIG.
- the sample S has an arbitrary thickness at an arbitrary position in the Z-axis direction.
- the XY image data 32 is generated as the observation image data of the sample S.
- the image generation unit 8 may generate three-dimensional data including the XY image data 32 as observation image data.
- the image generation unit 8 stores the generated observation image data, displays it on a monitor, or the like according to a predetermined operation by the user.
- the computer 7 as the analysis unit 10 executes analysis based on the observation image data generated by the image generation unit 8 and generates an analysis result.
- the analysis unit 10 stores the generated analysis result, displays it on a monitor, or the like according to a predetermined operation by the user.
- the observation image data generated by the image generation unit 8 may not be displayed on the monitor or the like, and only the analysis result generated by the analysis unit 10 may be displayed on the monitor or the like.
- control unit 9 will be described in more detail.
- control unit 9 controls the operations of the light source unit 2, the scanning unit 4 (moving stage 12), and the image acquisition unit 6 in executing the observation of the sample S.
- this sample observation device 1 the concept of "measurement sensitivity" expressed by the product of the amount of light of the planar light L2 applied to the sample S and the scanning speed of the sample S by the moving stage 12. Is introduced, and the scanning speed of the sample S and the optimum amount of light of the planar light L2 to irradiate the sample S are determined according to the measurement sensitivity selected by the user.
- the resolution Reso (X) in the X-axis direction and the resolution Reso (Y) in the Y-axis direction in the image acquisition unit 6 are equal to each other. It is necessary to control the scanning speed and the exposure time of the sample S. As an example, it is conceivable to input a trigger signal from the moving stage 12 to the image acquisition unit 6 at an interval corresponding to Reso (Y) and control the exposure according to the interval of the trigger signal.
- Reso (X) can be determined by dividing the pixel size in the X-axis direction of the image pickup device constituting the image acquisition unit 6 by a magnification
- Reso (Y) is a magnification of the pixel size in the Y-axis direction of the image pickup device. It can be determined by dividing by.
- the amount of light of the observation light L3 that can be acquired by the image acquisition unit 6 is determined by the product of the amount of light of the observation light L3 per unit time and the exposure time.
- the amount of light of the observation light L3 can be determined based on the amount of light of the planar light L2 applied to the sample S, and the exposure time can be determined based on the scanning speed of the sample S as described above. That is, the measurement sensitivity, which is the product of the amount of light of the planar light L2 and the scanning speed of the sample S, can be determined by the amount of light of the planar light L2 for the same scanning speed.
- the control unit 9 when determining the scanning speed of the sample S and the optimum light amount of the planar light L2 to irradiate the sample S, the optimum light amount of the planar light L2 in the measurement sensitivity is set according to the scanning speed. With reference to the reference table provided, the scanning speed of the sample S and the optimum amount of light of the planar light L2 are automatically determined based on the measurement sensitivity selected by the user.
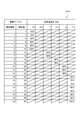
- the control unit 9 has a plurality of different reference tables 41 (41A to 41C) depending on the frame rate of the image pickup apparatus constituting the image acquisition unit 6.
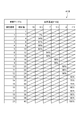
- the reference table 41A shown in FIG. 5 is used when the frame rate is high (for example, 3500 fps), and the reference table 41B shown in FIG. 6 is used when the frame rate is medium (for example, 3000 fps).
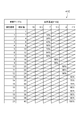
- the reference table 41C shown in 1 is used when the frame rate is small (for example, 2500 fps).
- the reference table 41 may be stored in the control unit 9 in advance, or may be stored in the control unit 9 by causing the computer 7 to read a recording medium for storing the data constituting the reference table 41. You may. Further, each observation of the sample S may be stored in the control unit 9 by wired or wireless communication.
- the row direction is the measurement sensitivity and the column direction is the scanning speed.
- the optimum amount of planar light L2 at each measurement sensitivity is shown as a relative value when the maximum output of the excitation light L1 output from the light source unit 2 is 100%. A relative value is added to the measurement sensitivity in the row direction.
- the scanning speed is 10 mm / s and the amount of light of the planar light L2 is 10% at the minimum setting value of the measurement sensitivity, and the product in this case is set to the relative value 1.
- the frame rate of the image pickup apparatus in the image acquisition unit 6 is determined according to the sub-array size of the image acquisition unit 6.
- the setting of the sub-array size is selected by the user in consideration of the amount of data used for observing the sample S, the observation accuracy, the observation area in the depth direction, and the like. Since the frame rate increases as the sub-array size decreases, the maximum value of the scanning speed can be increased.
- the relationship between the measurement sensitivity and the scanning speed is set so that the maximum scanning speed that can be taken at the frame rate of the image acquisition unit 6 is determined as the scanning speed.
- the maximum value of the scanning speed is 10 mm / s as shown in FIG.
- the scanning speed is set to 10 mm / s when the relative value setting is 1 to 10
- the scanning speed is 7 mm / s when the relative value setting is 12 to 14.
- the scanning speed is set to 5.5 mm / s.
- the scanning speed is set to 4 mm / s
- the scanning speed is set to 2.5 mm / s. In the range where the scanning speed is the same, the larger the setting of the relative value, the larger the setting value of the light amount of the planar light L2.
- the maximum scanning speed is 8.5 mm / s, as shown in FIG.
- the scanning speed is set to 8.5 mm / s when the relative value setting is 2 to 10
- the scanning speed is 7 mm when the relative value setting is 12 to 14.
- the scanning speed is set to 5.5 mm / s.
- the scanning speed is set to 20 to 24
- the scanning speed is set to 4 mm / s
- the relative value is set to 26 to 40
- the scanning speed is set to 2.5 mm / s.
- the larger the setting of the relative value the larger the setting value of the light amount of the planar light L2.
- the maximum value of the scanning speed is 7 mm / s.
- the scanning speed is set to 7 mm / s when the relative value setting is 2 to 14, and the scanning speed is 5.5 mm when the relative value setting is 16 to 18.
- the scanning speed is set to 4 mm / s.
- the scanning speed is set to 2.5 mm / s. In the range where the scanning speed is the same, the larger the setting of the relative value, the larger the setting value of the light amount of the planar light L2.
- the control unit 9 selects one reference table 41 from the plurality of reference tables 41A to 41C based on the frame rate corresponding to the sub-array size selected by the user. Then, the scanning speed of the sample S and the optimum light amount of the planar light L2 are determined based on the measurement sensitivity selected by the user with reference to the selected reference table 41. The control unit 9 controls the operations of the light source unit 2 and the scanning unit 4 based on the determined scanning speed and the optimum amount of light.
- the control unit 9 controls the amount of light of the excitation light L1 output from the light source unit 2 based on the determined optimum light amount.
- the light source unit 2 is provided with a plurality of dimming filters (not shown) having different transmittances.
- the control unit 9 selects one dimming filter from a plurality of dimming filters based on the determined optimum light amount, and controls the light amount of the excitation light L1 output from the light source unit 2.
- the amount of light of the excitation light L1 By controlling the amount of light of the excitation light L1, the amount of light of the planar light L2 irradiated to the sample S can be controlled, and as a result, the amount of light of the observation light L3 generated in the sample S can be controlled.
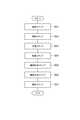
- FIG. 8 is a flowchart showing an example of the sample observation method.
- this sample observation method includes a control step (step S01), an irradiation step (step S02), a scanning step (step S03), an imaging step (step S04), and an image acquisition step (step S05). It includes an image generation step (step S06) and an analysis step (step S07).
- control step S01 first, the selection of the measurement sensitivity and the selection of the sub-array size from the user are accepted.
- the frame rate of the image pickup apparatus constituting the image acquisition unit 6 is set based on the sub-array size selected by the user, and the reference table 41 corresponding to the set frame rate is among the reference tables 41A to 41C. Is selected from.
- the selected reference table 41 is referred to, and the scanning speed and the optimum light amount corresponding to the measurement sensitivity selected by the user are determined.
- the sample S is irradiated with the planar light L2.
- the light source unit 2 is driven based on the control signal from the computer 7, and the excitation light L1 is output from the light source unit 2.
- the excitation light L1 output from the light source unit 2 is shaped by the irradiation optical system 3 to become planar light L2, which is irradiated to the sample S.
- the amount of light of the excitation light L1 output from the light source unit 2 is controlled by the selection of the dimming filter in the control unit 9 so as to have the optimum amount of light determined in the control step S01.
- the sample S is scanned against the irradiation surface R of the planar light L2.
- the moving stage 12 is driven in synchronization with the drive of the light source unit 2 based on the control signal from the computer 7.
- the sample container 11 is linearly driven in the Y-axis direction at a constant speed, and the sample S in the well 13 is scanned with respect to the irradiation surface R of the planar light L2.
- the scanning speed of the sample S by the moving stage 12 is controlled by the control unit 9 so as to be the scanning speed determined in the control step S01.
- the imaging optical system 5 having the observation axis P2 inclined with respect to the irradiation surface R is used, and the observation light L3 generated in the sample S by the irradiation of the planar light L2 is imaged by the image acquisition unit 6. An image is formed on a surface.
- the image acquisition step S05 a plurality of XZ image data 31 corresponding to the optical image formed by the observation light L3 imaged by the imaging optical system 5 are acquired at a predetermined frame rate in the Y-axis direction. The plurality of XZ image data 31 are sequentially output from the image acquisition unit 6 to the image generation unit 8.
- the observation image data of the sample S is generated based on the plurality of XZ image data 31.
- the XY image data 32 having an arbitrary thickness at an arbitrary position in the Z-axis direction in the sample S is the observation image data of the sample S. Is generated as.
- the analysis unit 10 analyzes the observed image data and generates an analysis result.
- XY image data 32 which is observation image data
- the analysis unit 10 evaluates the reagent based on the obtained XY image data 32, and the evaluation data is generated as an analysis result.
- the analysis unit 10 may acquire and analyze three-dimensional data including the XY image data 32 as observation image data.
- the sample observation device 1 introduces the concept of measurement sensitivity expressed by the product of the light amount of the planar light L2 and the scanning speed, and the optimum light amount of the planar light in the measurement sensitivity depends on the scanning speed.
- the scanning speed of the sample S and the optimum amount of light of the planar light L2 to irradiate the sample S are determined according to the measurement sensitivity selected by the user.
- the user selects the measurement sensitivity, so that the scanning speed of the sample S and the surface to be irradiated on the sample S are not complicatedly set for the light source unit 2, the scanning unit 4, and the image acquisition unit 6. Since the optimum amount of light for the light L2 is determined, the setting of measurement conditions can be simplified.
- the maximum scanning speed that can be taken at the frame rate of the image acquisition unit 6 is determined as the scanning speed.
- Scanning speed is a parameter related to sample observation throughput. Therefore, by determining the maximum scanning speed that can be taken at the frame rate of the image acquisition unit 6 as the scanning speed, the throughput of sample observation can be improved.
- the control unit 9 has a plurality of different reference tables 41 (41A to 41C) according to the frame rate, and the frame rate corresponds to the sub-array size of the image acquisition unit 6 selected by the user. Based on this, one reference table 41 is selected from the plurality of reference tables 41A to 41C, and the scanning speed and the optimum light amount are determined using the selected reference table 41. As the sub-array size becomes smaller, the frame rate becomes larger, so that the maximum value of the scanning speed can be increased. Therefore, by selectively using a plurality of different reference tables 41A to 41C according to the frame rate, the throughput of sample observation can be more reliably improved.
- the sample observation device 1 controls the amount of light of the excitation light L1 output from the light source unit 2 based on the determined optimum amount of light. By controlling the amount of the excitation light L1 in this way, the amount of the planar light L2 irradiated on the sample S can be easily controlled.
- one dimming filter is selected from a plurality of dimming filters having different transmittances. Thereby, the amount of light of the excitation light L1 can be easily controlled.
- the control unit 9 has a plurality of different reference tables 41 (41A to 41C) depending on the frame rate, but the control unit 9 has a single reference table 41 regardless of the frame rate. May have.
- the control unit 9 controls so that the light amount of the excitation light L1 becomes the optimum light amount by selecting one dimming filter from the plurality of dimming filters arranged in the light source unit 2. , One dimming filter may be selected and applied from a plurality of dimming filters for the planar light L2. Further, the control unit 9 may control the output of the light source itself by controlling the current value or the voltage value applied to the light source unit 2. Even in this case, the amount of the excitation light L1 can be easily controlled.
Landscapes
- Physics & Mathematics (AREA)
- Health & Medical Sciences (AREA)
- Analytical Chemistry (AREA)
- General Physics & Mathematics (AREA)
- Chemical & Material Sciences (AREA)
- Biochemistry (AREA)
- Life Sciences & Earth Sciences (AREA)
- General Health & Medical Sciences (AREA)
- Nuclear Medicine, Radiotherapy & Molecular Imaging (AREA)
- Immunology (AREA)
- Pathology (AREA)
- Optics & Photonics (AREA)
- Investigating, Analyzing Materials By Fluorescence Or Luminescence (AREA)
- Microscoopes, Condenser (AREA)
Abstract
この試料観察装置1では、面状光L2の光量と走査速度との積で表される測定感度における面状光L2の最適光量が走査速度に応じて設定された参照テーブル41を参照し、ユーザによって選択された測定感度に基づいて走査部4の走査速度と試料Sに照射される面状光L2の最適光量とを決定する。
Description
本開示は、試料観察装置及び試料観察方法に関する。
細胞などの3次元立体構造を持つ試料の内部を観察する手法の一つとして、SPIM(Selective Plane Illumination Microscopy)が知られている。かかる手法に関する技術として、例えば特許文献1に記載の試料観察装置がある。この特許文献1の試料観察装置は、試料にXZ面で面状光を照射する照射光学系と、面状光の照射面に対して試料をY軸方向に走査する走査部と、照射面に対して傾斜する観察軸を有し、面状光の照射によって試料で発生した観察光を結像する結像光学系を備えている。この試料観察装置では、試料のXZ画像データをY軸方向について複数取得し、XZ画像データにおける解析領域の輝度値をZ方向に積算して生成したX画像データをY軸方向に結合して試料のXY画像データを生成する。
上述のような試料観察装置では、試料の解析を実現するため、試料からの観察光を画像データとして取得する際の測定条件の最適化が重要となる。しかしながら、測定条件の最適化には、光源、走査部、画像取得部といった各要素の設定が必要であり、設定の簡単化が解決すべき課題となっている。
本開示は、上記課題の解決のためになされたものであり、測定条件の設定の簡単化が図られる試料観察装置及び試料観察方法を提供することを目的とする。
本開示の一側面に係る試料観察装置は、試料に対する励起光を出力する光源部と、励起光を面状光に整形し、試料に前記面状光をXZ面で照射する照射光学系と、面状光の照射面を通過するように試料を所定の走査速度でY軸方向に走査する走査部と、照射面に対して傾斜する観察軸を有し、面状光の照射によって試料で発生した観察光を結像する結像光学系と、結像光学系によって結合された観察光の光像に対応するXZ画像データを所定のフレームレートでY軸方向に複数取得する画像取得部と、面状光の光量及び走査速度を制御する制御部と、を備え、制御部は、面状光の光量と走査速度との積で表されるにおける面状光の最適光量が走査速度に応じて設定された参照テーブルを参照し、ユーザによって選択された測定感度に基づいて走査速度と面状光の最適光量とを決定する。
この試料観察装置では、面状光の光量と走査速度との積で表される測定感度の概念を導入し、ユーザが選択した測定感度に応じて試料の走査速度と試料に照射する面状光の最適光量とを決定する。試料の観察を行う場合、画像取得部でのX軸方向の解像度とY軸方向の解像度とが等しくなるように試料の走査速度と露光時間とを制御する必要がある。露光時間は、画像取得部の画素数に基づいて決定できるため、X軸方向の解像度とY軸方向の解像度とが等しくなる走査速度を算出できる。また、画像取得部で取得できる観察光の光量は、単位時間当たりの観察光の光量と露光時間との積で決まる。観察光の光量は、試料に照射される面状光の光量に基づいて決定でき、露光時間は、試料の走査速度に基づいて決定できる。つまり、測定感度は、同じ走査速度に対しては、面状光の光量によって決定できる。この試料観察装置では、測定感度における面状光の最適光量が走査速度に応じて設定された参照テーブルを参照することで、ユーザが選択した測定感度に基づいて走査速度及び面状光の最適光量の双方を決定できる。したがって、測定条件の設定の簡単化が図られる。
制御部は、フレームレートにおいて採り得る最大走査速度を走査速度として決定してもよい。走査速度は、試料観察のスループットに関連するパラメータである。したがって、フレームレートにおいて採り得る最大走査速度を走査速度として決定することで、試料観察のスループットの向上が図られる。
制御部は、フレームレートに応じて複数の異なる参照テーブルを有し、ユーザによって選択された画像取得部のサブアレイサイズに対応するフレームレートに基づいて複数の参照テーブルから一の参照テーブルを選択し、選択した参照テーブルを用いて走査速度と最適光量とを決定してもよい。サブアレイサイズが小さくなるほどフレームレートが大きくなるため、走査速度の最大値を大きくすることが可能となる。したがって、フレームレートに応じて複数の異なる参照テーブルを選択的に用いることで、試料観察のスループットを一層確実に向上できる。
制御部は、決定した最適光量に基づいて光源部から出力される励起光の光量を制御してもよい。励起光の光量を制御することにより、面状光の光量を容易に制御できる。
光源部は、透過率が互いに異なる複数の減光フィルタを有し、制御部は、決定した最適光量に基づいて複数の減光フィルタから一の減光フィルタを選択して光源部から出力される励起光の光量を制御してもよい。これにより、励起光の光量を簡便に制御できる。
制御部は、決定した最適光量に基づいて光源部に印加する電流値又は電圧値を制御してもよい。この場合においても、励起光の光量を簡便に制御できる。
本開示の一側面に係る試料観察方法では、試料に対する励起光を出力する出力ステップと、励起光を面状光に整形し、試料に面状光をXZ面で照射する照射ステップと、面状光の照射面を通過するように試料を所定の走査速度でY軸方向に走査する走査ステップと、照射面に対して傾斜する観察軸を有し、面状光の照射によって試料で発生した観察光を結像する結像ステップと、結像ステップによって結合された観察光の光像に対応するXZ画像データを所定のフレームレートでY軸方向に複数取得する画像取得ステップと、各ステップの実行にあたって面状光の光量及び走査速度を制御する制御ステップと、を備え、制御ステップでは、面状光の光量と走査速度との積で表される測定感度における面状光の最適光量が走査速度に応じて設定された参照テーブルを参照し、ユーザによって選択された測定感度に基づいて走査速度と面状光の最適光量とを決定する。
この試料観察方法では、面状光の光量と走査速度との積で表される測定感度の概念を導入し、ユーザが選択した測定感度に応じて試料の走査速度と試料に照射する面状光の最適光量とを決定する。試料の観察を行う場合、画像取得ステップでのX軸方向の解像度とY軸方向の解像度とが等しくなるように試料の走査速度と露光時間とを制御する必要がある。露光時間は、画像取得の際の画素数に基づいて決定できるため、X軸方向の解像度とY軸方向の解像度とが等しくなる走査速度を算出できる。また、画像取得ステップで取得できる観察光の光量は、単位時間当たりの観察光の光量と露光時間との積で決まる。観察光の光量は、試料に照射される面状光の光量に基づいて決定でき、露光時間は、試料の走査速度に基づいて決定できる。つまり、測定感度は、同じ走査速度に対しては、面状光の光量によって決定できる。この試料観察方法では、測定感度における面状光の最適光量が走査速度に応じて設定された参照テーブルを参照することで、ユーザが選択した測定感度に基づいて走査速度及び面状光の最適光量の双方を決定できる。したがって、測定条件の設定の簡単化が図られる。
制御ステップでは、フレームレートにおいて採り得る最大走査速度を走査速度として決定してもよい。走査速度は、試料の観察に要する装置のスループットに関連するパラメータである。したがって、フレームレートにおいて採り得る最大走査速度を走査速度として決定することで、試料観察のスループットの向上が図られる。
制御ステップでは、フレームレートに応じて複数の異なる参照テーブルを用い、ユーザによって選択された画像取得ステップ実行時のサブアレイサイズに対応するフレームレートに基づいて複数の参照テーブルから一の参照テーブルを選択し、選択した参照テーブルを用いて走査速度と最適光量とを決定してもよい。サブアレイサイズが小さくなるほどフレームレートが大きくなるため、走査速度の最大値を大きくすることが可能となる。したがって、フレームレートに応じて複数の異なる参照テーブルを選択的に用いることで、試料観察のスループットを一層確実に向上できる。
制御ステップでは、決定した最適光量に基づいて出力ステップにおける励起光の光量を制御してもよい。励起光の光量を制御することにより、面状光の光量を容易に制御できる。
出力ステップでは、透過率が互いに異なる複数の減光フィルタを用い、制御ステップでは、決定した最適光量に基づいて複数の減光フィルタから一の減光フィルタを選択して出力ステップにおける励起光の光量を制御してもよい。これにより、励起光の光量を簡便に制御できる。
制御ステップでは、決定した最適光量に基づいて励起光を出力する光源部に印加する電流値又は電圧値を制御し、出力ステップにおける励起光の光量を制御してもよい。この場合においても、励起光の光量を簡便に制御できる。
本開示によれば、測定条件の設定の簡単化が図られる。
以下、図面を参照しながら、本開示の一側面に係る試料観察装置及び試料観察方法の好適な実施形態について詳細に説明する。
図1は、試料観察装置の一実施形態を示す概略構成図である。この試料観察装置1は、面状光L2を試料Sに照射し、試料Sの内部で発生した観察光(例えば蛍光又は散乱光など)を結像面に結像させて試料S内部の観察画像データを取得する装置である。この種の試料観察装置1としては、スライドガラスに保持される試料Sの画像を取得し表示するスライドスキャナ、あるいはマイクロプレートに保持される試料Sの画像データを取得し、画像データを解析するプレートリーダなどがある。試料観察装置1は、図1に示すように、光源部2と、照射光学系3と、走査部4と、結像光学系5と、画像取得部6と、コンピュータ(制御部)7とを備えて構成されている。
観察対象となる試料Sとしては、例えばヒト或いは動物の細胞、組織、臓器、動物或いは植物自体、植物の細胞、組織などが挙げられる。これらの試料Sは、例えばフルオレセインーデキストラン(励起波長:494nm/蛍光波長:521nm)、テトラメチルローダミン(励起波長:555nm/蛍光波長:580nm)などの蛍光材料によって染色されている。なお、試料Sは、複数の蛍光物質によって染色されてもよい。また、試料Sは、溶液、ゲル、或いは試料Sとは屈折率の異なる物質に含まれていてもよい。
光源部2は、試料Sに照射される励起光L1を出力する部分である。光源部2を構成する光源としては、例えばレーザダイオード、固体レーザ光源といったレーザ光源が挙げられる。光源は、発光ダイオード、スーパールミネッセントダイオード、ランプ系光源であってもよい。光源部2から出力された励起光L1は、照射光学系3に導光される。また、光源部2は、透過率が互いに異なる複数の減光フィルタ(不図示)を有している。光源部2では、コンピュータ7からの制御信号によって複数の減光フィルタから一の減光フィルタが選択され、光源部2から出力される励起光L1の光量が制御される。
照射光学系3は、光源部2から出力された励起光L1を面状光L2に整形し、整形された面状光L2を光軸P1に沿って試料Sに照射する光学系である。以下の説明では、照射光学系3の光軸P1を面状光L2の光軸という場合もある。照射光学系3は、例えばシリンドリカルレンズ、アキシコンレンズ、或いは空間光変調器などの光整形素子を含んで構成され、光源部2に対して光学的に結合されている。照射光学系3は、対物レンズを含んで構成されていてもよい。照射光学系3によって形成された面状光L2は、試料Sに照射される。面状光L2が照射された試料Sでは、面状光L2の照射面Rにおいて観察光L3が発生する。観察光L3は、例えば面状光L2によって励起された蛍光、面状光L2の散乱光、或いは面状光L2の拡散反射光である。
走査部4は、面状光L2の照射面Rに対して試料Sを走査する機構である。本実施形態では、走査部4は、試料Sを保持する試料容器11を移動させる移動ステージ12によって構成されている。試料容器11は、例えばマイクロプレート、スライドガラス、シャーレ等であり、面状光L2及び観察光L3に対して透明性を有している。本実施形態では、マイクロプレートを例示する。試料容器11は、図2に示すように、試料Sが配置される複数のウェル13が一直線状(或いはマトリクス状)に配列された板状の本体部14と、本体部14の一面側においてウェル13の一端側を塞ぐように設けられた板状の透明部材15とを有している。
ウェル13内への試料Sの配置にあたり、ウェル13内には、試料Sと共に培養液、蛍光指示薬、バッファ等の溶液が充填されている。溶液からは、自家蛍光が発せられる。透明部材15は、ウェル13内に配置された試料Sに対する面状光L2の入力面15aを有している。透明部材15の材質は、面状光L2に対する透明性を有する部材であれば特に限定はされないが、例えばガラス、石英、或いは合成樹脂である。試料容器11は、入力面15aが面状光L2の光軸P1と直交するように移動ステージ12に対して配置されている。なお、ウェル13の他端側は、外部に開放された状態となっている。試料容器11は、移動ステージ12に対して固定されていてもよい。
移動ステージ12は、図1に示すように、コンピュータ7からの制御信号に従い、予め設定された方向に試料容器11を定速で走査する。本実施形態では、移動ステージ12は、面状光L2の光軸P1と直交する平面内の一方向に試料容器11を走査する。以下の説明では、面状光L2の光軸P1方向をZ軸、移動ステージ12による試料容器11の走査方向をY軸、面状光L2の光軸P1と直交する平面内においてY軸に直交する方向をX軸と称する。試料Sに対する面状光L2の照射面Rは、XZ平面内の面となる。
結像光学系5は、面状光L2の照射によって試料Sで発生した観察光L3を結像する光学系である。結像光学系5は、図2に示すように、例えば対物レンズ16を含んで構成されている。結像光学系5の光軸は、観察光L3の観察軸P2となっている。この結像光学系5の観察軸P2は、試料Sにおける面状光L2の照射面Rに対して傾斜角度θをもって傾斜している。傾斜角度θは、試料Sに向かう面状光L2の光軸P1と観察軸P2とがなす角とも一致する。傾斜角度θは、例えば10°~80°となっている。観察画像の解像度を向上させる観点から、傾斜角度θは、20°~70°であることが好ましい。また、観察画像の解像度の向上及び視野の安定性の観点から、傾斜角度θは、30°~65°であることが更に好ましい。
画像取得部6は、図1に示すように、結像光学系5によって結像された観察光L3による光像に対応するXZ画像データを複数取得する部分である。画像取得部6は、例えば観察光L3による光像を撮像する撮像装置を含んで構成されている。撮像装置としては、例えばCMOSイメージセンサ、CCDイメージセンサといったエリアイメージセンサが挙げられる。これらのエリアイメージセンサは、結像光学系5による結像面に配置され、例えばグローバルシャッタ或いはローリングシャッタによって光像を撮像する。エリアイメージセンサは、試料Sの二次元画像のデータであるXZ画像データ(図3参照)を所定のフレームレートでY軸方向について複数取得し、コンピュータ7に出力する。
コンピュータ7は、物理的には、RAM、ROM等のメモリ、及びCPU等のプロセッサ(演算回路)、通信インターフェイス、ハードディスク等の格納部、ディスプレイ等の表示部を備えて構成されている。かかるコンピュータ7としては、例えばパーソナルコンピュータ、クラウドサーバ、スマートデバイス(スマートフォン、タブレット端末など)などが挙げられる。コンピュータ7は、メモリに格納されるプログラムをコンピュータシステムのCPUで実行することにより、光源部2及び走査部4の動作を制御する制御部9、試料Sの観察画像データを生成する画像生成部8、及び観察画像データに基づいて試料Sの解析を行う解析部10として機能する。
制御部9としてのコンピュータ7は、ユーザによる測定開始の操作の入力を受け、光源部2、走査部4(移動ステージ12)、及び画像取得部6を同期させて駆動する。この場合、コンピュータ7は、移動ステージ12による試料Sの移動中、光源部2が励起光L1を連続的に出力するように光源を制御してもよく、画像取得部6による撮像に合わせて光源部2による励起光L1の出力のON/OFFを制御してもよい。また、照射光学系3が光シャッタ(不図示)を備えている場合、コンピュータ7は、当該光シャッタの制御によって試料Sへの面状光L2の照射をON/OFFさせてもよい。
画像生成部8としてのコンピュータ7は、画像取得部6によって生成された複数のXZ画像データに基づいて試料Sの観察画像データを生成する。画像生成部8は、画像取得部6から出力された複数のXZ画像データに基づいて、例えば面状光L2の光軸P1に直交する面(XY面)における試料Sの観察画像データを生成する。具体的には、画像生成部8では、図3(A)に示すように、XZ画像データ31をY軸方向に複数取得することによって、試料Sの3次元情報が蓄積される。画像生成部8では、複数のXZ画像データ31を用いてデータが再構築され、例えば図3(B)に示すように、試料SにおけるZ軸方向の任意の位置において任意の厚さを持ったXY画像データ32が試料Sの観察画像データとして生成される。画像生成部8は、XY画像データ32を含む3次元データを観察画像データとして生成してもよい。画像生成部8は、ユーザによる所定の操作に従って、生成した観察画像データの格納、モニタ等への表示等を実行する。
解析部10としてのコンピュータ7は、画像生成部8によって生成された観察画像データに基づいて解析を実行し、解析結果を生成する。解析部10は、ユーザによる所定の操作に従って、生成した解析結果の格納、モニタ等への表示等を実行する。なお、画像生成部8によって生成された観察画像データのモニタ等への表示は行わず、解析部10によって生成された解析結果のみをモニタ等に表示してもよい。
次に、上述した制御部9について更に詳細に説明する。
上述したように、制御部9は、試料Sの観察を実行するにあたり、光源部2、走査部4(移動ステージ12)、及び画像取得部6の動作を制御する。これらの各要素の制御にあたり、この試料観察装置1では、試料Sに照射される面状光L2の光量と移動ステージ12による試料Sの走査速度との積で表される「測定感度」の概念を導入し、ユーザが選択した測定感度に応じて試料Sの走査速度と試料Sに照射する面状光L2の最適光量とを決定する。
試料観察装置1において試料Sの観察を行う場合、図4に示すように、画像取得部6でのX軸方向の解像度Reso(X)とY軸方向の解像度Reso(Y)とが等しくなるように試料Sの走査速度と露光時間とを制御する必要がある。一例として、Reso(Y)に対応する間隔で移動ステージ12から画像取得部6にトリガ信号を入力し、トリガ信号の間隔に対応して露光を行うように制御することが考えられる。Reso(X)は、画像取得部6を構成する撮像装置のX軸方向の画素サイズを倍率で除算することによって決定でき、Reso(Y)は、同撮像装置のY軸方向の画素サイズを倍率で除算することによって決定できる。また、露光時間は、画像取得部6を構成する撮像装置のフレームレートに基づいて決定できる。露光時間を決定することでX軸方向の解像度とY軸方向の解像度とが等しくなる走査速度を算出できる。例えば画像取得部6を構成する撮像装置のフレームレート(最大フレームレート)が10kHzである場合、露光時間は0.1msとなる。この場合、Reso(X)=Reso(Y)=10μmとすると、走査速度は100mm/sと決定される。
また、画像取得部6で取得できる観察光L3の光量は、単位時間当たりの観察光L3の光量と露光時間との積で決まる。観察光L3の光量は、試料Sに照射される面状光L2の光量に基づいて決定でき、露光時間は、上述したように、試料Sの走査速度に基づいて決定できる。つまり、面状光L2の光量と試料Sの走査速度との積である測定感度は、同じ走査速度に対しては、面状光L2の光量によって決定できる。異なる測定感度に対し、面状光L2の最適光量が同一になる条件は複数存在するが、その際の走査速度はそれぞれ異なる。このことから、制御部9では、試料Sの走査速度と試料Sに照射する面状光L2の最適光量とを決定するにあたり、測定感度における面状光L2の最適光量が走査速度に応じて設定された参照テーブルを参照し、ユーザによって選択された測定感度に基づいて試料Sの走査速度と面状光L2の最適光量とを自動的に決定する。
図5~図7は、参照テーブルの一例を示す図である。本実施形態では、制御部9は、画像取得部6を構成する撮像装置のフレームレートに応じて複数の異なる参照テーブル41(41A~41C)を有している。図5に示す参照テーブル41Aは、フレームレートが大(例えば3500fps)である場合に用いられ、図6に示す参照テーブル41Bは、フレームレートが中(例えば3000fps)である場合に用いられ、図7に示す参照テーブル41Cは、フレームレートが小(例えば2500fps)である場合に用いられる。参照テーブル41は、予め制御部9に記憶させたものであってもよく、参照テーブル41を構成するデータを格納する記録媒体をコンピュータ7に読み込ませることによって制御部9に記憶させたものであってもよい。また、試料Sの観察毎に有線又は無線の通信によって制御部9に記憶させる態様であってもよい。
これらの参照テーブル41A~41Cでは、行方向が測定感度、列方向が走査速度となっている。各測定感度における面状光L2の最適光量は、光源部2から出力される励起光L1の最大出力を100%とした場合の相対値で示されている。なお、行方向の測定感度には、相対値が付記されている。図5~図7の例では、測定感度の最小設定値において、走査速度が10mm/s及び面状光L2の光量が10%となっており、この場合の積を相対値1としている。
画像取得部6における撮像装置のフレームレートは、画像取得部6のサブアレイサイズに対応して決定される。サブアレイサイズの設定は、試料Sの観察に用いるデータ量や観察精度、深さ方向の観察エリアなどを考慮し、ユーザによって選択される。サブアレイサイズが小さくなるほどフレームレートが大きくなるため、走査速度の最大値を大きくすることができる。参照テーブル41A~41Cでは、画像取得部6のフレームレートにおいて採り得る最大走査速度が走査速度として決定されるように、測定感度と走査速度との関係が設定されている。
サブアレイサイズが小さい場合に選択される参照テーブル41Aでは、図5に示すように、走査速度の最大値は、10mm/sとなっている。この参照テーブル41Aが選択される場合、相対値の設定が1~10の場合には走査速度が10mm/sに設定され、相対値の設定が12~14の場合には走査速度が7mm/sに設定され、相対値の設定が16~18の場合には走査速度が5.5mm/sに設定される。また、相対値の設定が20~24の場合には走査速度が4mm/sに設定され、相対値の設定が26~40の場合には走査速度が2.5mm/sに設定される。同一の走査速度となる範囲では、相対値の設定が大きくなるほど面状光L2の光量の設定値が大きくなる。
サブアレイサイズが中程度である場合に選択される参照テーブル41Bでは、図6に示すように、走査速度の最大値は、8.5mm/sとなっている。この参照テーブル41Bが選択される場合、相対値の設定が2~10の場合には走査速度が8.5mm/sに設定され、相対値の設定が12~14の場合には走査速度が7mm/sに設定され、相対値の設定が16~18の場合には走査速度が5.5mm/sに設定される。また、相対値の設定が20~24の場合には走査速度が4mm/sに設定され、相対値の設定が26~40の場合には走査速度が2.5mm/sに設定される。同一の走査速度となる範囲では、相対値の設定が大きくなるほど面状光L2の光量の設定値が大きくなる。
サブアレイサイズが大きい場合に選択される参照テーブル41Cでは、図7に示すように、走査速度の最大値は、7mm/sとなっている。この参照テーブル41Cが選択される場合、相対値の設定が2~14の場合には走査速度が7mm/sに設定され、相対値の設定が16~18の場合には走査速度が5.5mm/sに設定される。また、相対値の設定が20~24の場合には走査速度が4mm/sに設定され、相対値の設定が26~40の場合には走査速度が2.5mm/sに設定される。同一の走査速度となる範囲では、相対値の設定が大きくなるほど面状光L2の光量の設定値が大きくなる。
制御部9は、ユーザによって選択されたサブアレイサイズに対応するフレームレートに基づいて複数の参照テーブル41A~41Cから一の参照テーブル41を選択する。そして、選択した参照テーブル41を参照し、ユーザによって選択された測定感度に基づいて試料Sの走査速度と面状光L2の最適光量とを決定する。制御部9は、決定した走査速度及び最適光量に基づいて光源部2及び走査部4の動作を制御する。
制御部9は、光源部2の制御にあたっては、決定した最適光量に基づいて光源部2から出力される励起光L1の光量を制御する。上述したように、光源部2には、透過率が互いに異なる複数の減光フィルタ(不図示)が設けられている。制御部9は、決定した最適光量に基づいて複数の減光フィルタから一の減光フィルタを選択し、光源部2から出力される励起光L1の光量を制御する。励起光L1の光量の制御により、試料Sに照射される面状光L2の光量を制御でき、その結果として、試料Sで発生する観察光L3の光量を制御できる。
図8は、試料観察方法の一例を示すフローチャートである。同図に示すように、この試料観察方法は、制御ステップ(ステップS01)、照射ステップ(ステップS02)、走査ステップ(ステップS03)、結像ステップ(ステップS04)、画像取得ステップ(ステップS05)、画像生成ステップ(ステップS06)、及び解析ステップ(ステップS07)を備えている。
制御ステップS01では、まず、ユーザからの測定感度の選択及びサブアレイサイズの選択を受け付ける。制御部9では、ユーザによって選択されたサブアレイサイズに基づいて画像取得部6を構成する撮像装置のフレームレートが設定され、設定されたフレームレートに対応する参照テーブル41が参照テーブル41A~41Cのうちから選択される。次に、制御部9では、選択された参照テーブル41が参照され、ユーザによって選択された測定感度に対応する走査速度及び最適光量が決定される。
照射ステップS02では、試料Sに面状光L2を照射する。ユーザによって測定開始の操作が入力されると、コンピュータ7からの制御信号に基づいて光源部2が駆動し、光源部2から励起光L1が出力される。光源部2から出力された励起光L1は、照射光学系3によって整形されて面状光L2となり、試料Sに照射される。光源部2から出力される励起光L1の光量は、制御ステップS01で決定された最適光量となるように、制御部9での減光フィルタの選択によって制御される。
走査ステップS03では、面状光L2の照射面Rに対して試料Sを走査する。ユーザによって測定開始の操作が入力されると、コンピュータ7からの制御信号に基づいて、光源部2の駆動と同期して移動ステージ12が駆動する。これにより、試料容器11がY軸方向に定速で直線的に駆動し、面状光L2の照射面Rに対してウェル13内の試料Sが走査される。移動ステージ12による試料Sの走査速度は、制御ステップS01で決定された走査速度となるように制御部9によって制御される。
結像ステップS04では、照射面Rに対して傾斜する観察軸P2を有する結像光学系5を用い、面状光L2の照射によって試料Sで発生した観察光L3を画像取得部6の結像面に対して結像する。画像取得ステップS05では、結像光学系5によって結像された観察光L3による光像に対応するXZ画像データ31を所定のフレームレートでY軸方向について複数取得する。複数のXZ画像データ31は、画像取得部6から画像生成部8に順次出力される。
画像生成ステップS06では、複数のXZ画像データ31に基づいて試料Sの観察画像データを生成する。ここでは、画像取得ステップS05で得られた複数のXZ画像データ31に基づいて、試料SにおけるZ軸方向の任意の位置において任意の厚さを持ったXY画像データ32が試料Sの観察画像データとして生成される。
解析ステップS07では、解析部10によって観察画像データを解析し、解析結果を生成する。例えば創薬スクリーニングでは、試料容器11に試料S及び試薬を入れた状態で、観察画像データであるXY画像データ32の取得がなされる。解析部10では、得られたXY画像データ32に基づいて試薬の評価がなされ、評価データが解析結果として生成される。なお解析部10は、XY画像データ32を含む3次元データを観察画像データとして取得し、解析してもよい。
以上説明したように、試料観察装置1では、面状光L2の光量と走査速度との積で表される測定感度の概念を導入し、測定感度における面状光の最適光量が走査速度に応じて設定された参照テーブル41を参照することで、ユーザが選択した測定感度に応じて試料Sの走査速度と試料Sに照射する面状光L2の最適光量とを決定する。この試料観察装置1では、ユーザが測定感度を選択することで、光源部2、走査部4、及び画像取得部6に対する複雑な設定をせずに試料Sの走査速度と試料Sに照射する面状光L2の最適光量が決定されるため、測定条件の設定の簡単化が図られる。
また、試料観察装置1では、画像取得部6のフレームレートにおいて採り得る最大走査速度を走査速度として決定する。走査速度は、試料観察のスループットに関連するパラメータである。したがって、画像取得部6のフレームレートにおいて採り得る最大走査速度を走査速度として決定することで、試料観察のスループットの向上が図られる。
また、試料観察装置1では、制御部9がフレームレートに応じて複数の異なる参照テーブル41(41A~41C)を有し、ユーザによって選択された画像取得部6のサブアレイサイズに対応するフレームレートに基づいて複数の参照テーブル41A~41Cから一の参照テーブル41を選択し、選択した参照テーブル41を用いて走査速度と最適光量とを決定する。サブアレイサイズが小さくなるほどフレームレートが大きくなるため、走査速度の最大値を大きくすることが可能となる。したがって、フレームレートに応じて複数の異なる参照テーブル41A~41Cを選択的に用いることで、試料観察のスループットを一層確実に向上できる。
また、試料観察装置1では、決定した最適光量に基づいて光源部2から出力される励起光L1の光量を制御する。このように、励起光L1の光量を制御することにより、試料Sに照射される面状光L2の光量を容易に制御できる。試料観察装置1では、励起光L1の光量の制御にあたり、透過率が互いに異なる複数の減光フィルタから一の減光フィルタを選択する。これにより、励起光L1の光量を簡便に制御できる。
本開示は、上記実施形態に限られるものではない。例えば上記実施形態では、制御部9がフレームレートに応じて複数の異なる参照テーブル41(41A~41C)を有しているが、制御部9は、フレームレートに依らず、単一の参照テーブル41を有していてもよい。また、上記実施形態では、制御部9が光源部2に配置した複数の減光フィルタから一の減光フィルタを選択することによって励起光L1の光量が最適光量となるように制御しているが、面状光L2に対して複数の減光フィルタから一の減光フィルタを選択して適用する態様であってもよい。また、制御部9が光源部2に印加する電流値又は電圧値を制御することによって、光源の出力自体を制御する態様であってもよい。この場合においても、励起光L1の光量を簡便に制御できる。
1…試料観察装置、2…光源部、3…照射光学系、4…走査部、5…結像光学系、6…画像取得部、8…画像生成部、9…制御部、10…解析部、31…XZ画像データ、41(41A~41C)…参照テーブル、L1…励起光、L2…面状光、L3…観察光、P2…観察軸、R…照射面。
Claims (12)
- 試料に対する励起光を出力する光源部と、
前記励起光を面状光に整形し、前記試料に前記面状光をXZ面で照射する照射光学系と、
前記面状光の照射面を通過するように前記試料を所定の走査速度でY軸方向に走査する走査部と、
前記照射面に対して傾斜する観察軸を有し、前記面状光の照射によって前記試料で発生した観察光を結像する結像光学系と、
前記結像光学系によって結合された前記観察光の光像に対応するXZ画像データを所定のフレームレートで複数取得する画像取得部と、
前記面状光の光量及び前記走査速度を制御する制御部と、を備え、
前記制御部は、前記面状光の光量と前記走査速度との積で表される測定感度における前記面状光の最適光量が前記走査速度に応じて設定された参照テーブルを参照し、ユーザによって選択された前記測定感度に基づいて前記走査速度と前記面状光の最適光量とを決定する試料観察装置。 - 前記制御部は、前記フレームレートにおいて採り得る最大走査速度を前記走査速度として決定する請求項1記載の試料観察装置。
- 前記制御部は、前記フレームレートに応じて複数の異なる前記参照テーブルを有し、ユーザによって選択された前記画像取得部のサブアレイサイズに対応するフレームレートに基づいて前記複数の参照テーブルから一の参照テーブルを選択し、選択した前記参照テーブルを用いて前記走査速度と前記最適光量とを決定する請求項1又は2記載の試料観察装置。
- 前記制御部は、決定した前記最適光量に基づいて前記光源部から出力される前記励起光の光量を制御する請求項1~3のいずれか一項記載の試料観察装置。
- 前記光源部は、透過率が互いに異なる複数の減光フィルタを有し、
前記制御部は、決定した前記最適光量に基づいて前記複数の減光フィルタから一の減光フィルタを選択して前記光源部から出力される前記励起光の光量を制御する請求項4記載の試料観察装置。 - 前記制御部は、決定した前記最適光量に基づいて前記光源部に印加する電流値又は電圧値を制御する請求項4記載の試料観察装置。
- 試料に対する励起光を出力する出力ステップと、
前記励起光を面状光に整形し、前記試料に前記面状光をXZ面で照射する照射ステップと、
前記面状光の照射面を通過するように前記試料を所定の走査速度でY軸方向に走査する走査ステップと、
前記照射面に対して傾斜する観察軸を有し、前記面状光の照射によって前記試料で発生した観察光を結像する結像ステップと、
前記結像ステップによって結合された前記観察光の光像に対応するXZ画像データを所定のフレームレートで複数取得する画像取得ステップと、
前記各ステップの実行にあたって前記面状光の光量及び前記走査速度を制御する制御ステップと、を備え、
前記制御ステップでは、前記面状光の光量と前記走査速度との積で表される測定感度における前記面状光の最適光量が前記走査速度に応じて設定された参照テーブルを参照し、ユーザによって選択された前記測定感度に基づいて前記走査速度と前記面状光の最適光量とを決定する試料観察方法。 - 前記制御ステップでは、前記フレームレートにおいて採り得る最大走査速度を前記走査速度として決定する請求項7記載の試料観察方法。
- 前記制御ステップでは、前記フレームレートに応じて複数の異なる前記参照テーブルを用い、ユーザによって選択された前記画像取得ステップ実行時のサブアレイサイズに対応するフレームレートに基づいて前記複数の参照テーブルから一の参照テーブルを選択し、選択した前記参照テーブルを用いて前記走査速度と前記最適光量とを決定する請求項7又は8記載の試料観察方法。
- 前記制御ステップでは、決定した前記最適光量に基づいて前記出力ステップにおける前記励起光の光量を制御する請求項7~9のいずれか一項記載の試料観察方法。
- 前記出力ステップでは、透過率が互いに異なる複数の減光フィルタを用い、
前記制御ステップでは、決定した前記最適光量に基づいて前記複数の減光フィルタから一の減光フィルタを選択して前記出力ステップにおける前記励起光の光量を制御する請求項10記載の試料観察方法。 - 前記制御ステップでは、決定した前記最適光量に基づいて前記励起光を出力する光源部に印加する電流値又は電圧値を制御し、前記出力ステップにおける前記励起光の光量を制御する請求項10記載の試料観察方法。
Priority Applications (3)
| Application Number | Priority Date | Filing Date | Title |
|---|---|---|---|
| JP2022528448A JPWO2021246021A1 (ja) | 2020-06-01 | 2021-03-17 | |
| US17/925,131 US20230184681A1 (en) | 2020-06-01 | 2021-03-17 | Sample observation device and sample observation method |
| EP21818864.7A EP4137864A4 (en) | 2020-06-01 | 2021-03-17 | DEVICE AND METHOD FOR SAMPLE OBSERVATION |
Applications Claiming Priority (2)
| Application Number | Priority Date | Filing Date | Title |
|---|---|---|---|
| JP2020-095508 | 2020-06-01 | ||
| JP2020095508 | 2020-06-01 |
Publications (1)
| Publication Number | Publication Date |
|---|---|
| WO2021246021A1 true WO2021246021A1 (ja) | 2021-12-09 |
Family
ID=78830778
Family Applications (1)
| Application Number | Title | Priority Date | Filing Date |
|---|---|---|---|
| PCT/JP2021/010879 WO2021246021A1 (ja) | 2020-06-01 | 2021-03-17 | 試料観察装置及び試料観察方法 |
Country Status (4)
| Country | Link |
|---|---|
| US (1) | US20230184681A1 (ja) |
| EP (1) | EP4137864A4 (ja) |
| JP (1) | JPWO2021246021A1 (ja) |
| WO (1) | WO2021246021A1 (ja) |
Citations (6)
| Publication number | Priority date | Publication date | Assignee | Title |
|---|---|---|---|---|
| JP2012226145A (ja) * | 2011-04-20 | 2012-11-15 | Yokogawa Electric Corp | 顕微鏡装置 |
| JP2017053918A (ja) * | 2015-09-07 | 2017-03-16 | オリンパス株式会社 | シート照明顕微鏡システム、画像処理装置、シート照明顕微鏡法、及び、プログラム |
| JP2018520388A (ja) * | 2015-07-17 | 2018-07-26 | ライカ マイクロシステムズ シーエムエス ゲゼルシャフト ミット ベシュレンクテル ハフツングLeica Microsystems CMS GmbH | 複数の対象面を同時にイメージングする光シート顕微鏡 |
| JP2019526829A (ja) * | 2016-08-15 | 2019-09-19 | ライカ マイクロシステムズ シーエムエス ゲゼルシャフト ミット ベシュレンクテル ハフツングLeica Microsystems CMS GmbH | ライトシート顕微鏡 |
| JP2019184403A (ja) * | 2018-04-09 | 2019-10-24 | 浜松ホトニクス株式会社 | 試料観察装置及び試料観察方法 |
| JP2019184401A (ja) | 2018-04-09 | 2019-10-24 | 浜松ホトニクス株式会社 | 試料観察装置及び試料観察方法 |
-
2021
- 2021-03-17 JP JP2022528448A patent/JPWO2021246021A1/ja active Pending
- 2021-03-17 US US17/925,131 patent/US20230184681A1/en active Pending
- 2021-03-17 EP EP21818864.7A patent/EP4137864A4/en active Pending
- 2021-03-17 WO PCT/JP2021/010879 patent/WO2021246021A1/ja unknown
Patent Citations (6)
| Publication number | Priority date | Publication date | Assignee | Title |
|---|---|---|---|---|
| JP2012226145A (ja) * | 2011-04-20 | 2012-11-15 | Yokogawa Electric Corp | 顕微鏡装置 |
| JP2018520388A (ja) * | 2015-07-17 | 2018-07-26 | ライカ マイクロシステムズ シーエムエス ゲゼルシャフト ミット ベシュレンクテル ハフツングLeica Microsystems CMS GmbH | 複数の対象面を同時にイメージングする光シート顕微鏡 |
| JP2017053918A (ja) * | 2015-09-07 | 2017-03-16 | オリンパス株式会社 | シート照明顕微鏡システム、画像処理装置、シート照明顕微鏡法、及び、プログラム |
| JP2019526829A (ja) * | 2016-08-15 | 2019-09-19 | ライカ マイクロシステムズ シーエムエス ゲゼルシャフト ミット ベシュレンクテル ハフツングLeica Microsystems CMS GmbH | ライトシート顕微鏡 |
| JP2019184403A (ja) * | 2018-04-09 | 2019-10-24 | 浜松ホトニクス株式会社 | 試料観察装置及び試料観察方法 |
| JP2019184401A (ja) | 2018-04-09 | 2019-10-24 | 浜松ホトニクス株式会社 | 試料観察装置及び試料観察方法 |
Also Published As
| Publication number | Publication date |
|---|---|
| EP4137864A1 (en) | 2023-02-22 |
| US20230184681A1 (en) | 2023-06-15 |
| EP4137864A4 (en) | 2024-06-05 |
| JPWO2021246021A1 (ja) | 2021-12-09 |
Similar Documents
| Publication | Publication Date | Title |
|---|---|---|
| US11822066B2 (en) | Sample observation device and sample observation method | |
| JP2022132488A (ja) | 装置、方法、及びプログラム | |
| WO2021246021A1 (ja) | 試料観察装置及び試料観察方法 | |
| EP3779411B1 (en) | Sample observation device and sample observation method | |
| US11340165B2 (en) | Sample observation device and sample observation method | |
| JP6978562B2 (ja) | 試料観察装置及び試料観察方法 | |
| JP6754408B2 (ja) | 試料観察装置及び試料観察方法 | |
| EP4321917A1 (en) | Sample observation device and sample observation method | |
| US20240184090A1 (en) | Sample observation device and sample observation method | |
| WO2021256429A1 (ja) | 試料観察装置及び試料観察方法 | |
| JP7125936B2 (ja) | 試料観察装置及び試料観察方法 |
Legal Events
| Date | Code | Title | Description |
|---|---|---|---|
| 121 | Ep: the epo has been informed by wipo that ep was designated in this application |
Ref document number: 21818864 Country of ref document: EP Kind code of ref document: A1 |
|
| ENP | Entry into the national phase |
Ref document number: 2022528448 Country of ref document: JP Kind code of ref document: A |
|
| ENP | Entry into the national phase |
Ref document number: 2021818864 Country of ref document: EP Effective date: 20221118 |
|
| NENP | Non-entry into the national phase |
Ref country code: DE |