WO2021220597A1 - Système, procédé de commande, procédé de transmission d'informations et programme informatique - Google Patents
Système, procédé de commande, procédé de transmission d'informations et programme informatique Download PDFInfo
- Publication number
- WO2021220597A1 WO2021220597A1 PCT/JP2021/006756 JP2021006756W WO2021220597A1 WO 2021220597 A1 WO2021220597 A1 WO 2021220597A1 JP 2021006756 W JP2021006756 W JP 2021006756W WO 2021220597 A1 WO2021220597 A1 WO 2021220597A1
- Authority
- WO
- WIPO (PCT)
- Prior art keywords
- evaluation
- brain
- subject
- evaluation index
- disease
- Prior art date
Links
Images


Classifications
-
- G—PHYSICS
- G06—COMPUTING; CALCULATING OR COUNTING
- G06T—IMAGE DATA PROCESSING OR GENERATION, IN GENERAL
- G06T7/00—Image analysis
- G06T7/0002—Inspection of images, e.g. flaw detection
- G06T7/0012—Biomedical image inspection
-
- A—HUMAN NECESSITIES
- A61—MEDICAL OR VETERINARY SCIENCE; HYGIENE
- A61B—DIAGNOSIS; SURGERY; IDENTIFICATION
- A61B10/00—Other methods or instruments for diagnosis, e.g. instruments for taking a cell sample, for biopsy, for vaccination diagnosis; Sex determination; Ovulation-period determination; Throat striking implements
-
- A—HUMAN NECESSITIES
- A61—MEDICAL OR VETERINARY SCIENCE; HYGIENE
- A61B—DIAGNOSIS; SURGERY; IDENTIFICATION
- A61B5/00—Measuring for diagnostic purposes; Identification of persons
- A61B5/0033—Features or image-related aspects of imaging apparatus classified in A61B5/00, e.g. for MRI, optical tomography or impedance tomography apparatus; arrangements of imaging apparatus in a room
- A61B5/004—Features or image-related aspects of imaging apparatus classified in A61B5/00, e.g. for MRI, optical tomography or impedance tomography apparatus; arrangements of imaging apparatus in a room adapted for image acquisition of a particular organ or body part
- A61B5/0042—Features or image-related aspects of imaging apparatus classified in A61B5/00, e.g. for MRI, optical tomography or impedance tomography apparatus; arrangements of imaging apparatus in a room adapted for image acquisition of a particular organ or body part for the brain
-
- A—HUMAN NECESSITIES
- A61—MEDICAL OR VETERINARY SCIENCE; HYGIENE
- A61B—DIAGNOSIS; SURGERY; IDENTIFICATION
- A61B5/00—Measuring for diagnostic purposes; Identification of persons
- A61B5/05—Detecting, measuring or recording for diagnosis by means of electric currents or magnetic fields; Measuring using microwaves or radio waves
- A61B5/055—Detecting, measuring or recording for diagnosis by means of electric currents or magnetic fields; Measuring using microwaves or radio waves involving electronic [EMR] or nuclear [NMR] magnetic resonance, e.g. magnetic resonance imaging
-
- A—HUMAN NECESSITIES
- A61—MEDICAL OR VETERINARY SCIENCE; HYGIENE
- A61B—DIAGNOSIS; SURGERY; IDENTIFICATION
- A61B5/00—Measuring for diagnostic purposes; Identification of persons
- A61B5/40—Detecting, measuring or recording for evaluating the nervous system
- A61B5/4058—Detecting, measuring or recording for evaluating the nervous system for evaluating the central nervous system
- A61B5/4064—Evaluating the brain
-
- A—HUMAN NECESSITIES
- A61—MEDICAL OR VETERINARY SCIENCE; HYGIENE
- A61B—DIAGNOSIS; SURGERY; IDENTIFICATION
- A61B5/00—Measuring for diagnostic purposes; Identification of persons
- A61B5/40—Detecting, measuring or recording for evaluating the nervous system
- A61B5/4076—Diagnosing or monitoring particular conditions of the nervous system
- A61B5/4088—Diagnosing of monitoring cognitive diseases, e.g. Alzheimer, prion diseases or dementia
-
- A—HUMAN NECESSITIES
- A61—MEDICAL OR VETERINARY SCIENCE; HYGIENE
- A61B—DIAGNOSIS; SURGERY; IDENTIFICATION
- A61B5/00—Measuring for diagnostic purposes; Identification of persons
- A61B5/72—Signal processing specially adapted for physiological signals or for diagnostic purposes
- A61B5/7235—Details of waveform analysis
- A61B5/7264—Classification of physiological signals or data, e.g. using neural networks, statistical classifiers, expert systems or fuzzy systems
- A61B5/7267—Classification of physiological signals or data, e.g. using neural networks, statistical classifiers, expert systems or fuzzy systems involving training the classification device
-
- A—HUMAN NECESSITIES
- A61—MEDICAL OR VETERINARY SCIENCE; HYGIENE
- A61B—DIAGNOSIS; SURGERY; IDENTIFICATION
- A61B5/00—Measuring for diagnostic purposes; Identification of persons
- A61B5/72—Signal processing specially adapted for physiological signals or for diagnostic purposes
- A61B5/7271—Specific aspects of physiological measurement analysis
- A61B5/7275—Determining trends in physiological measurement data; Predicting development of a medical condition based on physiological measurements, e.g. determining a risk factor
-
- G—PHYSICS
- G06—COMPUTING; CALCULATING OR COUNTING
- G06T—IMAGE DATA PROCESSING OR GENERATION, IN GENERAL
- G06T2207/00—Indexing scheme for image analysis or image enhancement
- G06T2207/10—Image acquisition modality
- G06T2207/10072—Tomographic images
- G06T2207/10104—Positron emission tomography [PET]
-
- G—PHYSICS
- G06—COMPUTING; CALCULATING OR COUNTING
- G06T—IMAGE DATA PROCESSING OR GENERATION, IN GENERAL
- G06T2207/00—Indexing scheme for image analysis or image enhancement
- G06T2207/10—Image acquisition modality
- G06T2207/10072—Tomographic images
- G06T2207/10108—Single photon emission computed tomography [SPECT]
-
- G—PHYSICS
- G06—COMPUTING; CALCULATING OR COUNTING
- G06T—IMAGE DATA PROCESSING OR GENERATION, IN GENERAL
- G06T2207/00—Indexing scheme for image analysis or image enhancement
- G06T2207/20—Special algorithmic details
- G06T2207/20076—Probabilistic image processing
-
- G—PHYSICS
- G06—COMPUTING; CALCULATING OR COUNTING
- G06T—IMAGE DATA PROCESSING OR GENERATION, IN GENERAL
- G06T2207/00—Indexing scheme for image analysis or image enhancement
- G06T2207/20—Special algorithmic details
- G06T2207/20084—Artificial neural networks [ANN]
-
- G—PHYSICS
- G06—COMPUTING; CALCULATING OR COUNTING
- G06T—IMAGE DATA PROCESSING OR GENERATION, IN GENERAL
- G06T2207/00—Indexing scheme for image analysis or image enhancement
- G06T2207/30—Subject of image; Context of image processing
- G06T2207/30004—Biomedical image processing
- G06T2207/30016—Brain
Definitions
- the present invention relates to a system capable of evaluating dementia.
- Patent Document 1 describes a driving aptitude diagnostic device and a driving aptitude that are not easily affected by the examination environment, the physical condition and mental state of the subject, the inspector's arbitrariness, etc., and can diagnose the driving aptitude of the subject with high reliability. It is stated to provide a diagnostic method.
- This driving aptitude diagnostic device includes a white matter lesion inspection means for inspecting the degree of cerebral white matter lesions of a subject and a driving aptitude determination means for judging the driving aptitude of a subject based on the test results of the white matter lesion inspection means.
- the driving aptitude determination means is characterized in that when the degree of white matter lesions inspected by the white matter lesion inspection means is equal to or higher than a specified value, the subject's driving aptitude is judged to be unsuitable.
- One aspect of the present invention is based on a first input module configured to obtain a first evaluation index based on data relating to the physical state of the subject's brain and data relating to the function of the subject's brain. Based on the evaluation values obtained by the second input module configured to obtain the second evaluation index and the first evaluation function with the first evaluation index and the second evaluation index as variables, the subject A system with an estimation module configured to estimate the state of dementia and / or other brain damage. It is possible to combine the evaluation results of data related to the physical state of the brain and the evaluation results of data related to brain function into one collaborative evaluation result using an evaluation function, and dementia with higher accuracy. The state of can be evaluated.
- the estimation module has a function (unit) to evaluate the effect on those dementia. It may be included.
- the estimation module may also include a function of estimating the prevalence of the first causative disease.
- the system has a first input module configured to obtain a first rating index based on data on the physical state of the subject's brain and a second rating based on data on the function of the subject's brain. It has a second input module configured to obtain an index and an estimation module configured to estimate the state of brain damage, including dementia, of the subject.
- the method includes the following steps. 1. 1. The estimation module obtains a first evaluation index and a second evaluation index via the first input module and the second input module. 2. To estimate the dementia status of a subject based on the evaluation values obtained by the first evaluation function with the first evaluation index and the second evaluation index as variables.
- the presumed dementia condition may include at least one of the information required for the prevention and treatment of dementia, such as the presence or absence of dementia, the stage, and the causative disease.
- the program obtains a first evaluation index based on data related to the physical state of the subject's brain and a second evaluation index based on data related to the function of the subject's brain. And, based on the evaluation value obtained by the first evaluation function with the first evaluation index and the second evaluation index as variables, it has an instruction to estimate the state of dementia of the subject by a computer.
- the program may be provided by recording on a computer-readable recording medium.
- a flowchart showing a dementia evaluation method The figure which shows the example of the test or the test which measures the health condition of a brain.
- FIG. 3 a diagram showing an example of a test or test for measuring brain health.
- Cognitive test score example An example of an odds table.
- the figure which shows the categorization It is a schematic diagram which shows the 1st example of the structure of the system of 3rd Embodiment. It is a schematic diagram which shows an example of the evaluation result of the hippocampal region.
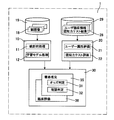
- FIG. 1 shows a system (dementia evaluation system) 1 for evaluating brain disorders such as dementia according to the present invention.
- This system 1 is based on a first input module 10 configured to acquire a first evaluation index X1 based on data on the physical state of the subject's brain and data on the function of the subject's brain.
- the evaluation value obtained by the second input module 20 configured to acquire the second evaluation index X2 and the first evaluation function f1 having the first evaluation index X1 and the second evaluation index X2 as variables.
- It has an estimation module 30 configured to estimate the state of brain disorders (dementia and / or other brain disorders), including dementia, of the subject based on fv.
- the system 1 further includes a database 19 in which image data including the subject's brain image 18 is accumulated and a database 29 in which clinical information 28 including the subject's cognitive test results is accumulated.
- Brain disorders include dementia, attention disorders, memory disorders, executive dysfunction, social behavior disorders, aphasia, apraxia, apraxia, and other higher brain disorders.
- Dementia includes AD (Alzheimer Disease), DLB (Dementia with Lewy Bodies, Lewy body dementias), and other dementia, such as frontotemporal dementia and progressive supranuclear dementia.
- AD Alzheimer Disease
- DLB Dementia with Lewy Bodies, Lewy body dementias
- other dementia such as frontotemporal dementia and progressive supranuclear dementia.
- the state of brain disorder is the presence or absence of brain disorder, its progress state, the presence or absence and differentiation of the causative disease (causative disease) of brain disorder such as dementia, the progress state of one or more causative diseases, etc.
- the state of brain disorder is the presence or absence of brain disorder, its progress state, the presence or absence and differentiation of the causative disease (causative disease) of brain disorder such as dementia, the progress state
- This system 1 One of the purposes of this system 1 is to realize numerical quantification by combining multiple evaluations for various states of subject dementia, brain disorder including dementia, or brain disorder not including dementia. , It is possible to categorize various states and to provide information for further evaluation analysis for each category. It is effective not only to treat subjects but also to perform evaluation analysis by dividing subjects with various states of brain damage into categories in other fields such as clinical research. For example, this system 1 is also effective for evaluating the effects and effects of medicines, foods and drinks, supplements, and other products ingested by various people on the brain or brain disorders such as dementia. It may be used as a separate marker. The System 1 may also be applicable to the evaluation of information devices, games and other applications that may affect the brain or brain damage. Examples of assessing the state of dementia will be described below, including other objectives and effects of the system.
- the first input module 10 includes a first evaluation unit 11 that obtains a first evaluation index X1 that statistically evaluates a first type of medical image of a region of interest of at least a part of the subject's brain.
- a second evaluation unit 12 that obtains a first evaluation index X1 that evaluates a subject's medical image using a first model that has been machine-learned to evaluate the first disease based on one type of medical image. And include.
- CT Computed Tomography
- MRI Magnetic Resonance Imaging
- PET Positron Emission Tomography
- SPECT Single Photon Emission Computed Tomography
- PET-CT PET-CT
- modality images are used for diagnosing various diseases (diseases).
- the modality image (medical image) 18 of the subject's brain is used to acquire data related to the physical state of the subject's brain, and is utilized for diagnosing diseases such as dementia and Parkinson's disease. There is.
- the physical state of the brain indicates a state in which the brain can be measured by a physical method, and various modality images including MRI, PET, SPECT capable of measuring morphology, glucose metabolism, blood flow, etc. Based on, the states that can be evaluated, measured, and estimated by methods such as statistical processing and learning models are shown.
- Examples of medical image types are CT and MRI, which can reflect highly accurate morphological information.
- Other examples of types of medical images are PET and SPECT, which are obtained by administering a radiopharmaceutical into the subject's body, such as by intravenous injection, and imaging the radiation emitted by the drug in the body. , The image is generated. According to the images using the drug, not only the morphology of each part in the body, but also how the drug administered in the body is distributed, or the state of accumulation of substances in the body that react with the drug, etc. Since it can be grasped, it can contribute to the improvement of the diagnosis accuracy of the disease.
- a PET image is taken using a so-called Pittsburgh compound B as a radiopharmaceutical for PET (tracer), and the degree of accumulation of amyloid ⁇ protein in the brain is measured based on the captured PET image to obtain Alzheimer's disease. It can be useful for the differential diagnosis or early diagnosis of.
- SPECT images there is an imaging method that visualizes the distribution of a dopamine transporter (DAT) called DatSCAN (Dopamine transporter SCAN) in a SPECT examination in which a radiopharmaceutical called 123I-Ioflupane is administered.
- DAT dopamine transporter
- the purpose of this imaging is early diagnosis of Parkinson's disease (PS) of Parkinson's disease (PD), assistance in diagnosis of Lewy body dementia (DLB, Dementia with Lewy Bodies), and dopamine nerve loss in the striatum.
- PS Parkinson's disease
- PD Lewy body dementia
- DLB Lewy body dementia
- Lewydova A type of medication decision called Lewydova can be mentioned.
- the first evaluation unit 11 uses statistical processing for the evaluation of medical images.
- the first evaluation unit 11 may evaluate by making a statistical comparison between the brain image of the subject and the brain image of a healthy person.
- VBM Vehicle Based Morphometry
- a typical statistical process is to generate a Z-score map. Therefore, the first evaluation unit 11 may acquire the Z score as the first evaluation index X1.
- the data (normal standard brain) obtained by calculating the average value and standard deviation for each boxel from the MR image of the normal case that has undergone brain morphology standardization processing and creating the average image and standard deviation image. It is created by substituting the value and the value of the subject's image data (processed image) into the following formula for calculating the Z score.
- z (M (x, y, z) -I (x, y, z)) / SD (x, y, z) M and SD represent the average image and the standard deviation image of the normal standard brain, and I represents the processed image.
- a voxel in which the Z score map has a positive value indicates a region with atrophy as compared with a normal standard brain, and it can be interpreted that the larger the value, the larger the divergence statistically. For example, if the Z score is "2", it means that the average value exceeds twice the standard deviation, and it is evaluated that there is a statistically significant difference with a risk rate of about 5%.
- M, SD and I may be calculated in the region of interest, respectively, and the average of all positive Z scores may be obtained.
- This PET image shows the SUVR value (SUV) showing the ratio of the sum of the amyloid ⁇ protein accumulation (SUV, Standardized Uptake Value) in the cerebral gray matter of a part of the brain to the amyloid ⁇ protein accumulation (SUV) in the cerebellum.
- SUVR Standardized Uptake Value Ratio, cerebellar ratio SUVR
- SUVR can be adopted as statistical processing. SUVR can be defined by the following equation.
- the molecule of this formula indicates the sum of the SUVs of the four cerebral gray matter sites, namely the cortical regions of the cerebrum (frontal cortex, anterior and posterior zonal cortex, parietal lobe, and lateral temporal lobe), and the denominator indicates the SUV of the cerebellum. ..
- BR Biting Ratio
- C in the formula is the average value of DAT in each region of interest
- Cspecific indicates the average value of the putamen and the caudate nucleus in the brain
- Cnonspecific indicates the average value of the occipital cortex in the brain.
- the second evaluation unit 12 has a first disease, for example, AD (Alzheimer Disease), DLB (Dementia with Lewy Bodies), based on a medical image common to or different from the first evaluation unit 11. , Lewy body dementias), the subject's brain image 18 is evaluated using a first model (learning model) machine-learned to evaluate.
- AD Alzheimer's disease
- DLB Delivery Linear Biharmonic Deformation
- the second evaluation unit 12 may acquire the output softmax value Xa of the activation function when estimating the first causative disease by the deep learning discrimination model as the first evaluation index X1.
- the first input module 10 may output the following values obtained by the first evaluation unit 11 and / or the second evaluation unit 12 as the first evaluation index X1.
- Xa Output softmax value of the activation function when estimating the first causative disease by a deep learning discrimination model using a brain image as an input.
- Xb Output softmax value of the activation function when the first causative disease is estimated by a deep learning differential model in the image obtained by filtering the brain image in the region of interest by statistical processing of the brain image.
- Xc Volume value or blood flow of the region of interest by statistical processing of brain images.
- Xd Z-score value of volume or blood flow evaluation of the region of interest by statistical processing of brain images.
- Xe Volume value or blood flow rate of the region of interest when estimating the first causative disease by a deep learning differential model using a brain image as an input.
- Xf Z-score value of volume or blood flow evaluation of the region of interest when estimating the first causative disease by a deep learning differential model using a brain image as an input.
- the second input module 20 includes a configuration for acquiring an evaluation of clinical information 28 including a cognitive test as a second evaluation index X2.
- the second input module 20 includes a unit 22 that evaluates the cognitive test and a unit 21 that evaluates other clinical information related to the user's attributes.
- the cognitive ability test is used as a means for acquiring data related to the brain function of the subject, particularly as a test for checking the cognitive function of the brain.
- the contents of the cognitive test include, for example, calculations such as addition and subtraction, Stroop, N-Back, and quick word writing, but are not limited thereto.
- Specific examples of the cognitive test are disclosed in, for example, Japanese Patent Application Laid-Open No. 2019-75071 of the applicant of the present application. Examples include a test for "subtraction", a test for N-Back (eg, 1-Back), and a test for "immediate playback" (word recall).
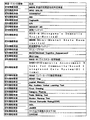
- the cognitive ability test is not limited to these, and a test or test for measuring the state of brain health (including the state of cognitive function and the presence / absence and degree of brain disease and psychiatric disease) listed in FIGS. 3 and 4 and others. A similar type of inspection or test may be adopted.
- the function of the brain refers to the ability to judge by an artificial action involving the brain other than the physical state of the brain, for example, expression, comprehension, and the like.
- brain function may be adequately judged by the results of appropriate cognitive tests.
- the result of the cognitive test can be scored based on the reaction time (response time) of the subject to the cognitive test and the number of correct answers (hereinafter, this scored one is called "cognitive score"). That.).
- the cognitive score information may be used as a second evaluation index X2 for evaluating the brain function of the subject.
- the brain age can be estimated by expressing the result of the cognitive test (cognitive score) as a normal distribution, and the evaluation index may be corrected using the age of the subject.
- the evaluation index for evaluating the state of brain function can be obtained based on clinical information including the cognitive test score.
- the clinical information may include any one of age, gender, educational history, work history, gene (ApoE, etc.), blood test result, and interview result (ADL interview, etc.) in addition to the cognitive test score.
- the second evaluation index X2 which is based on data related to brain function, has an estimated range of dementia risk from pre-MCI (pre-stage of Mild Cognitive Impairment) to MCI (Mild Cognitive Impairment).
- AD Alzheimer's dementia
- AD is also effective as an index that accurately indicates the risk.
- a typical estimation module 30 that estimates the dementia state of a subject based on the evaluation value fv obtained by the first evaluation function f1 with the first evaluation index X1 and the second evaluation index X2 as variables described above.
- An example is the function of estimating the prevalence of a first causative disease, eg, AD or DLB (disease estimation function, unit) 35.
- the first input module 10 includes a configuration for acquiring a first evaluation index X1 regarding the discrimination of the first causative disease
- the second input module 20 includes a second evaluation index regarding the discrimination of the first causative disease. Includes a configuration to acquire X2.
- the second input module 20 may include a configuration to be acquired as a second evaluation index X2 including the result 28 of the cognitive ability test suitable for discriminating the first causative disease.
- a different example of the estimation module 30 is the function of assessing the effect of ingestion on dementia when the subject is included in the group ingesting at least one of medicines, foods and drinks, and supplements (clinical evaluation function, clinical evaluation unit). ) 36.
- the evaluation result in the function 36 to be evaluated can be used as a stratified marker corresponding to a biomarker in stratified medicine. Therefore, the system 1 may include a module that provides information as a stratification marker based on the estimation of the estimation module 30.
- a quantified stratified marker can be provided in collaboration with a number of factors, two or more, as described in more detail below, and a patient-quantified marker. It is possible to classify into categories according to the purpose, and to find categories necessary for evaluation such as research or medical treatment.
- the unit 35 for estimating the morbidity state will be further described as an example.
- the morbidity estimation unit 35 includes an odds determination unit 31 for determining the presence or absence of morbidity based on odds, and a probability determination unit 32 for determining the probability of morbidity.
- the first evaluation index X1 is the odds x1 of the first causative disease
- the second evaluation index X2 is the odds x2 of the first causative disease
- the probability determination unit 32 uses the morbidity probability p as the evaluation value as the following first evaluation function f1b. Includes the configuration obtained by.
- i is an integer.
- the first evaluation index X1 may be any of the above-mentioned values Xa to Xf, and may include a plurality of values.
- the log odds of the disease probability p of two classes that is, one of the causative diseases (causative diseases) A (AD or DLB)
- AD or DLB causative diseases
- the coefficient wi can be obtained by maximum likelihood estimation (stochastic gradient descent method or the like).
- the evaluation function f1b it can be determined that if the morbidity probability p is greater than 0.5, it is disease A, and if it is 0.5 or less, it is not disease A.
- the first evaluation function f1c of the desired causative disease based on multi-value logistic regression may be as follows.
- y * is a target class (disease)
- Y is a set of all classes (disease) to be evaluated
- wy is a weighting coefficient of each evaluation index of class (disease) y.
- dementia as non-AD dementia, in addition to Lewy body dementia, frontotemporal dementia, progressive supranuclear palsy, corticobasal degeneration, and argyrophilic dementia It can be used to distinguish these causative diseases.
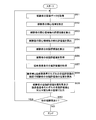
- FIG. 2 shows an evaluation method using the dementia evaluation system 1 by a flowchart.
- the dementia evaluation system 1 can be provided as an information processing device including computer resources including a memory and a CPU, and the control method can be provided as a program having instructions that can be executed by the computer.
- the program (program product) may be provided by recording it on a recording medium readable by a computer, or may be provided in a state where it can be downloaded from the Internet or the like.
- the dementia evaluation system 1 may be provided as a service (Software as a Service) via the Internet.
- the estimation module 30 In a system 1 having a first input module 10, a second input module 20, and an estimation module 30 configured to estimate a subject's dementia status, in step 51, the estimation module 30 The first evaluation index X1 is acquired from the first input module 10, and in step 52, the estimation module 30 acquires the second evaluation index X2 via the second input module 20. Further, in step 53, the estimation module 30 is a subject based on the evaluation value obtained by the first evaluation function having the first evaluation index X1 and the second evaluation index X2 as variables, for example, the evaluation function f1a or f1b described above. Estimate the state of dementia.
- the estimation module 30 may perform a process 54 for estimating the morbidity of the first causative disease.
- the estimation module 30 may perform a process 58 for evaluating the effect of the ingested drug on dementia.
- the estimation module 30 may acquire the value obtained by the first evaluation unit 11 statistically evaluating the medical image as the first evaluation index X1 via the first input module 10.
- the value obtained by evaluating the medical image by the evaluation unit 12 of 2 may be acquired as the first evaluation index X1, and as shown in the values Xa to Xf, the value obtained by statistically evaluating the medical image and the machine learning are performed.
- a first evaluation index X1 may be obtained that reflects both the values obtained when the medical image of the subject is evaluated using the model (first model).
- the estimation module 30 may acquire an evaluation of clinical information including a cognitive ability test as a second evaluation index X2. Further, in steps 51 and 52, the estimation module 30 may acquire the first evaluation index X1 relating to the discrimination of the first causative disease and the second evaluation index X2 relating to the discrimination of the first causative disease. Often, in step 53, the prevalence of the first causative disease may be estimated by the first evaluation function.
- the estimation module 30 may perform a process of estimating the first causative disease when the evaluation value by the evaluation function exceeds the first threshold value.
- the evaluation function is the process 55 for determining the odds and the process 56 for determining the probability using the logistic regression model.
- the process 55 for determining the odds will be further described.
- FIG. 5 shows an example of the distribution (number of incorrect answers) of the delayed regeneration score of the cognitive ability test (ADAS-Jcog) for each disease group acquired by the second input module 20. Specifically, it shows the number of incorrect answers for delayed regeneration between a subject having an AD-causing disease and a subject having a DLB-causing disease.
- ADAS-Jcog cognitive ability test
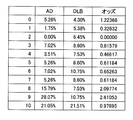
- FIG. 6 shows an odds table created from the distribution of delayed regeneration scores of the cognitive test (ADAS-Jcog) for each disease group.
- the output value of the activation function (softmax function) of the deep learning discrimination model that inputs the brain image of each subject is acquired by the first input module 10.
- the estimation module 30 a disease in which the softmax value acquired from the first input module 10 is set as the first evaluation index X1 and the clinical information (cognitive ability test) result score of the same subject (examinee) is input.
- the odds score is set to the second evaluation index X2, and the evaluation value S indicating that the causative disease is AD is obtained by multiplying the indexes X1 and X2 by the first evaluation function f1a.
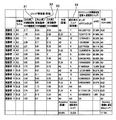
- FIG. 7 shows the first evaluation index X1, the second evaluation index X2, and the evaluation value S obtained as described above.
- the evaluation value S to be evaluated is equal to or higher than the cutoff value (threshold value, 50% in this example), it is possible to determine whether or not the patient has a brain disease or AD in this example.
- the discrimination accuracy was 72% for the image alone, but the discrimination accuracy became 83% by collaborating with the first evaluation index X1 and the second evaluation index X2 to discriminate the disease. Rose.
- the odds table may be composed of the ratio of the cognitive score of the subjects in the disease group as learning data to that of the control group.
- the determination of Alzheimer's disease and Lewy body dementias was evaluated using an MRI image and a delayed regeneration score of ADAS-Jcog, but the evaluation is not limited to this.
- FIG. 8 shows the first evaluation index X1, the second evaluation index X2, and the evaluation value py by logistic regression obtained as described above.
- the evaluated evaluation value py is equal to or higher than the cutoff value (threshold value, 50% in this example), it is possible to determine whether or not the patient has a brain disease or AD in this example.
- the discrimination accuracy was 72% for the image alone, but the discrimination accuracy became 83% by collaborating with the first evaluation index X1 and the second evaluation index X2 to discriminate the disease. Rose.
- the input of the logistic regression model was evaluated using the MRI image and the delayed regeneration score of ADAS-Jcog for the determination of Alzheimer's disease and Lewy body dementias, but the input is not limited to this.
- the first evaluation indexes X1, X2, and X3 are evaluated by inputting the values calculated by the Z score for each of the three different brain regions into the logistic regression together with the second evaluation index X4. Indicates the value py.
- the evaluated evaluation value py is equal to or higher than the cutoff value (threshold value, 50% in this example), it is possible to determine whether or not the patient has a brain disease or AD in this example.
- the discrimination accuracy was 56% for the image alone, but the discrimination accuracy was 78 by collaborating with the first evaluation indexes X1 to X3 and the second evaluation index X4 to discriminate the disease. It rose to%.
- the input of the logistic regression model was evaluated using the Z score and the delayed regeneration score of ADAS-Jcog for the determination of Alzheimer's disease and Lewy body dementias, but the input is not limited to this.
- FIG. 10 shows a case where the Negative / Positive of the image evaluation and the cognitive test score are determined for a certain disease or its degree.
- the following four categories can be obtained by determining the Negative / Positive of each of the image evaluation and the cognitive test score for a certain disease or its degree.
- Category A Image (Positive) and Cognitive Test (Positive)
- B Image (Negative) and Cognitive Test (Positive)
- C Image (Positive) and Cognitive Test (Negative)
- D Image (Negative) and Cognitive Test (Negative)
- a method of determining the disease using a cutoff as an evaluation index of the brain image For example, the degree of blood flow decrease (CIScore) at a specific part of the occipital lobe is evaluated for a patient with Alzheimer's disease and a subject with Lewy body dementias.
- CIScore degree of blood flow decrease
- a method of discrimination based on the cutoff value In addition to setting the cutoff, a method of determining the attribute according to the magnitude of the evaluation index of the brain image may be provided separately from the cutoff.
- the cut-off values of CDR and MMSE can be used to distinguish between healthy subjects, mild dementia, and Alzheimer's disease patients.
- the evaluation of the drug efficacy is evaluated by categorizing the subjects using the evaluation of the brain image alone, the clinical information (for example, cognitive ability test) result score, and the type and progression classification of the brain disease evaluated by integrating the two. It is possible to determine the target person and use it as information for performing evaluation analysis for each category.
- the estimation (evaluation) and / or the process leading to the estimation of the estimation module 30 described above, the first evaluation index X1, the second evaluation index X2, and other information xi can be used for smartphones, PCs, tablets, and paper.
- a module that outputs to the included output medium may be included.
- the output form may be characters, figures, images, information encrypted by a QR code (registered trademark), or information indicating an access destination of the information.
- the system 1 is a module that classifies subjects into a predetermined category based on the estimation of the estimation module 30 and / or the process leading to the estimation, the first evaluation index X1, the second evaluation index X2, and other information xi. May include.
- the estimation evaluation of the estimation module 30 can also be used as a stratification marker.
- the estimation module 30 outputs an estimated value y as an evaluation value when at least one of the first evaluation index X1 and the second evaluation index X2 is the explanatory variable xi and the weighting coefficient of each explanatory variable xi is wi.
- (Hat) can be calculated by the equation (1) as the first evaluation function.
- x0 1, and w0 is an intercept.
- label -1 represents a healthy person and label 1 represents dementia. It is possible to classify unknown data xi according to whether y (hat) is larger or smaller than 0.
- the weighting coefficient wi in the equation (1) can be obtained by solving the optimization problem in which the loss function F shown in the equation (2) is minimized.
- k 1, ..., N is the number of data samples, and yk is the measured value.
- ⁇ is a parameter that can be set in advance, and determines the magnitude of the influence of the regularization term represented by the square of the L2 norm of wi.
- the estimation module 30 determines the state of brain damage including dementia of the subject based on the evaluation values obtained by the first evaluation function using the first evaluation index and the second evaluation index as explanatory variables.
- the first evaluation function is represented by a linear combination of explanatory variables having a weighting coefficient corresponding to each explanatory variable as a coefficient, which is predicted by ridge regression using training data, as in Eq. (1).
- NS The explanatory variable may be only one of the first evaluation index and the second evaluation index.
- the third embodiment in order to evaluate the risk of degenerative brain disease, a system for evaluating each part (region of interest) of the brain image (MR, SPECT, PET, etc.) of the subject, and evaluation of the characteristic part of the subject. A system for assessing the risk of brain disease for the entire brain based on the value will be described.
- the MR image is also referred to as an MRI image.
- the MRI image includes, for example, a T1-weighted image, a T2-weighted image, a diffusion-weighted image, a flare image, a diffusion tensor image, a QSM image, a pseudo PET image, a pseudo SPECT image, and the like.
- Brain diseases include dementia (including AD, DLB, frontal temporal lobe degeneration (FTLD), normal pressure hydrocephalus (NPH), etc.), brain tumors, psychiatric disorders (also called psychiatric disorders, schizophrenia, epilepsy, etc.) Mood disorders, addiction disorders, higher dysfunction, etc.), Parkinson's disease, Asperger's syndrome, attention deficiency / hyperactivity disorder (ADHD), sleep disorders, childhood diseases, ischemic brain disorders, mood disorders (depression, etc.) Includes) etc.
- brain disorders include dementia and multiple sclerosis as diseases related to the brain, and mild cognitive impairment (MCI: Mild cognitive impairment) and Alzheimer as diseases related to amyloid ⁇ , for example.
- Mild cognitive impairment due to illness MCIdue to AD
- prodromal AD pre-symptomatic AD of Alzheimer's disease / preclinical AD
- Parkinson's disease multiple sclerosis
- insomnia sleep disorders
- cognition includes neurodegenerative diseases such as functional decline, cognitive impairment, and amyloid positive / negative disorders.
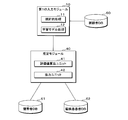
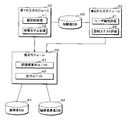
- FIG. 11 is a schematic diagram showing a first example of the configuration of the system of the third embodiment.
- the system (also referred to as “evaluation system” or “dementia evaluation system”) includes a first input module 10 and an estimation module 40.
- the first input module 10 has the same configuration as that of the first embodiment.
- the estimation module 40 includes an evaluation value calculation unit 41 and an output unit 42.
- the first input module 10 can access necessary information by referring to the subject DB 60.
- the subject DB 60 may be the database 19 of the first embodiment.
- the estimation module 40 can access necessary information by referring to each of the healthy subject DB61 and the brain disease patient DB62.
- the first input module 10 includes a first evaluation unit 11 and a second evaluation unit 12.
- the first evaluation unit 11 calculates a first evaluation index X1 that statistically evaluates a medical image of each part (region of interest) of the subject's brain.
- the second evaluation unit 12 uses a machine-learned trained model to output the first evaluation index X1 of each part (region of interest) of the subject's brain based on the medical image.
- the first evaluation index X1 of each part (region of interest) is output.
- only one of the first evaluation unit 11 and the second evaluation unit 12 may be used, or both may be used.
- the first input module 10 outputs the first evaluation index X1 of each part (region of interest) of the subject's brain to the estimation module 40.
- the Z score value of the gray matter volume value of the region of interest on the anatomical standard space will be described as the first evaluation index X1, but the first evaluation index X1 is not limited to the Z score.
- the Z score of a specific part of the brain can be calculated by the following formula for each pixel of the part.
- Z score (pixel value of subject's brain part-average value of healthy person's part) / (standard deviation of healthy person's part)
- the Z-score of the part can be obtained as the average value of the positive Z-scores for each pixel of the part.
- the Z score represents the degree (degree) in which the pixel value of the part of the subject deviates from the pixel value of the part of the brain of a healthy person. In the case of MR images, the larger the Z-score value, the more atrophy is indicated as compared with the healthy subject.
- Brain regions include the mesencephalon, superior parietal lobule, inferior parietal lobule, pale sphere, cerebrum, paracentral lobule, hippocampus, parahippocampal gyrus, precuneus, lateral ventricle, and amygdala. , But not limited to, olfactory infield, brain stem, etc.
- the first input module 10 can calculate the Extent and Ratio for each part.
- Extent represents the ratio of the number of voxels having a Z score of 2 or more in the site to the total number of voxels in the site.
- Z score is 2 or more
- the average value of the pixel values is twice or more the standard deviation, and a statistically significant difference is observed.
- Ratio is a value obtained by dividing the average Z score in a site by the average Z score of the whole brain.
- the first input module 10 outputs the calculated Extent and Ratio to the estimation module 40.
- the output unit 42 has a function as an output unit, and outputs display data for display on a display device (not shown).
- the display device may be a device incorporated in the system or a device external to the system.
- FIG. 12 is a schematic diagram showing an example of the evaluation results of the hippocampal region.
- FIG. 12 schematically shows an image when the subject's brain is viewed from the front, and may differ from the actual image.
- the part with the pattern is the hippocampus on each side, and the color or pattern is changed according to the value of the first evaluation index (Z score) and displayed on a map (evaluation index map).
- Z score the first evaluation index
- the Z score is 0.7
- the Extent 20%
- Ratio 1.5 times.
- the Z score is calculated by treating each of the left and right hippocampal regions as one region.
- the numerical values shown in FIG. 12 are numerical values for convenience and may differ from actual values.
- FIG. 13 is a schematic diagram showing an example of the evaluation result of the middle temporal gyrus region.
- FIG. 13 schematically shows an image of the cross section of the middle temporal gyrus of the subject, and may differ from the actual image.
- the part with the pattern is the middle temporal gyrus on each of the left and right sides, and the color or pattern is changed according to the value of the first evaluation index (Z score) and displayed in a map. ..
- the Z score is 0.41
- the Extent is 0%
- the Ratio is 0 times.
- the Z score is calculated by treating each of the left and right middle temporal gyrus regions as one region.
- the numerical values shown in FIG. 13 are numerical values for convenience and may differ from actual values.
- the doctor or the like can be used as a material for diagnosing various brain diseases including dementia of the subject.
- the evaluation value calculation unit 41 has a function as a calculation unit, and is based on a first evaluation index of each of a plurality of parts (regions of interest) of the subject's brain and a weighting coefficient corresponding to each first evaluation index.
- the area evaluation value also referred to as "site evaluation value" of each of a plurality of areas of interest is calculated.
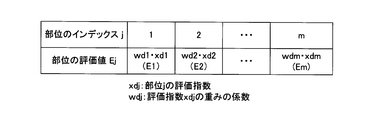
- FIG. 14 is a schematic diagram showing an example of evaluation values of each part.
- the index of the part is j
- the number of parts is m.
- the evaluation index of each part j is xdj
- the weighting coefficient of the evaluation coefficient xdj is wdj.
- the output unit 42 can output the evaluation value of the portion calculated by the evaluation value calculation unit 41.
- the output unit 42 may output display data for displaying the evaluation values of each of the plurality of parts of the subject's brain in a predetermined order (for example, in descending order of the evaluation values).
- the evaluation value calculation unit 41 accepts the selection of a required subject from a plurality of subjects, the evaluation value calculation unit 41 can calculate the evaluation value of each of the plurality of parts of the brain of the selected subject.
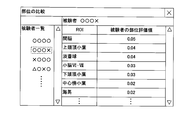
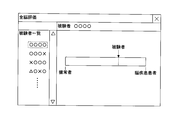
- FIG. 15 is a schematic view showing a first example of a comparison screen of parts.
- the site comparison screen has an area for displaying a list of subjects and an area for displaying an evaluation value of a site for each subject's site (ROI).
- ROI site for each subject's site
- the IDs and names of a plurality of subjects are displayed in a list, and the target subjects can be selected.
- a doctor or the like can select a subject to be diagnosed from a list.
- the subject OOO surrounded by a broken line is selected.
- the evaluation values of the parts of the subject can be displayed side by side in descending order of the evaluation values.
- FIG. 15 is a schematic view showing a first example of a comparison screen of parts.
- the site comparison screen has an area for displaying a list of subjects and an area for displaying an evaluation value of a site for each subject's site (ROI).
- the subject list the IDs and names of a plurality of subjects are displayed in a list, and the target subjects
- the evaluation value of the diencephalon is 0.5, which is the largest value, it is displayed at the highest level.
- the ROI and the evaluation value of the part are displayed in association with each other in descending order of the evaluation value.
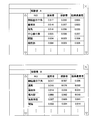
- FIG. 16 is a schematic view showing a second example of a comparison screen of parts.
- the difference from the first example illustrated in FIG. 15 is that the evaluation value of each part of a healthy subject and the evaluation value of each part of a specific brain disease patient are displayed.
- the estimation module 40 has a function as a healthy person evaluation value acquisition unit, and can acquire evaluation values of each of a plurality of parts of a healthy person (for example, an average of evaluation values of a large number of healthy people) from a healthy person DB61. can. Further, the estimation module 40 has a function as a brain disease patient evaluation value acquisition unit, and the evaluation value of each of a plurality of sites of the brain disease patient suffering from a specific brain disease from the brain disease patient DB62 (for example, a specific brain). The average of the evaluation values of a large number of patients with brain diseases suffering from the disease) can be obtained.
- the estimation module 40 can selectively acquire the evaluation value of each of a plurality of sites of a specific brain disease patient from a plurality
- the evaluation value of each part of both the healthy person and the brain disease patient is displayed, but the evaluation value of each part of either the healthy person or the brain disease patient may be displayed. That is, the output unit 42 can output display data for displaying the evaluation values of the plurality of parts of the subject and the healthy subject in a comparable display mode. In addition, the output unit 42 can output display data for displaying the evaluation values of each of the plurality of parts of the subject and the patient with the brain disease in a comparable display mode.
- a plurality of types of brain diseases are displayed in a list on the comparison screen of the parts illustrated in FIG. 16, and a required brain disease can be selected from the listed brain diseases. , Each time a brain disease is selected, the evaluation value of each part of the brain disease patient suffering from the selected brain disease may be displayed.
- the evaluation value is compared with that of the healthy subject.
- the state of the subject's brain disease can be determined as compared with the patient with the brain disease.
- FIG. 17 is a schematic diagram showing a third example of a comparison screen of parts.
- the brain disease of the subject based on the evaluation value for each part of the subject.
- DLB Lewy body dementias
- AD Alzheimer's disease
- the medial temporal region is a gray matter region including the parahippocampal gyrus and the hippocampus.
- subject A in the case of subject A, the hippocampal atrophy evaluation appears at the top, but the evaluation value of subject A is smaller than the evaluation value of the brain disease patient, and it can be judged that the atrophy state is mild. ..
- subject B it can be judged that the evaluation values of the hippocampus and the parahippocampal gyrus are large and the atrophy is progressing.
- subject A can be presumed to have Lewy body dementias
- subject B can be presumed to have Alzheimer's dementia.
- the estimation module 40 has a function as an estimation unit, and is based on a whole-brain evaluation value obtained by a second evaluation function having a first evaluation index of each of a plurality of parts of the subject's brain as a variable. Estimate the state of brain damage including dementia. Specifically, the evaluation value calculation unit 41 can calculate the whole brain evaluation value by using the second evaluation function.
- the second evaluation function can be expressed by equation (3).
- EA is a predicted value of the whole brain evaluation value
- xdj is an evaluation index of the site j
- wdj is a weighting coefficient of the evaluation coefficient xdj
- m is the number of parts
- ⁇ is a constant that evaluates the error.
- the weighting coefficient wdj in the equation (3) can be obtained by solving the optimization problem in which the loss function L shown in the equation (4) is minimized.
- E is the measured value of the whole brain evaluation value.
- ⁇ is a parameter that can be set in advance, and determines the magnitude of the influence of the regularization term represented by the square of the L2 norm of wdj. That is, the second evaluation function represented by the equation (3) is the first evaluation index whose coefficient is the weighting coefficient wdj corresponding to each of the first evaluation indexes xdj, which is predicted by ridge regression using the training data. It is represented by a linear combination of xdj.
- the label of each class you want to separate is -1 and 1.
- label -1 represents a healthy person and label 1 represents dementia.
- Classification can be performed based on whether the whole brain evaluation value EA is larger or smaller than 0 with respect to the unknown evaluation index xdj.
- the brain diseases may be classified by a majority vote for all possible combinations of the two classes. ..
- the brain disease B1 is twice, the brain disease B2 is once, and the healthy person is If it is classified 0 times, it can be classified into the most frequent brain disease B1.
- FIG. 18 is a schematic diagram showing an example of the correlation of Z scores between each part of the left brain and the right brain.
- j is an index indicating the site.
- the part j of the right brain corresponds to the part of the left brain (j + 51).
- the straight line shown by the broken line represents a portion having a large correlation with the Z score. That is, the same part on the left and right tends to have a large correlation with the Z score.
- FIG. 19 is a schematic diagram showing an example of a method of consolidating the left and right brains.
- the part of the right brain is represented by j
- the same part of the left brain as the right brain is represented by (j + 51).
- the first aggregation method is a method in which the right brain region j and the left brain region (j + 51) are unified into the right brain index j and aggregated into one region.
- the number of parts in each of the right and left brains is 51 and the number of parts in the entire brain is 102
- the number of parts is changed from 102 to 51 by the first aggregation method.
- the estimation accuracy of the whole brain evaluation value could be set to about 96%.
- the number of parts in the entire brain is not limited to 102, and other values may be used.
- the second aggregation method is a method of unifying the average of the weighting coefficient of the right brain region j and the weighting coefficient of the left brain region (j + 51) into the right brain region index. Assuming that the number of parts in each of the right and left brains is 51 and the number of parts in the entire brain is 102, the number of parts is changed from 102 to 51 by the second aggregation method. By ridge regression using the second aggregation method, the estimation accuracy of the whole brain evaluation value could be set to about 91%.
- the third aggregation method is a method of unifying the larger value of the weighting coefficient of the right brain part j and the weighting coefficient of the left brain part (j + 51) into the right brain part index. Assuming that the number of parts in each of the right and left brains is 51 and the number of parts in the entire brain is 102, the number of parts is changed from 102 to 51 by the third aggregation method. By ridge regression using the third aggregation method, the estimation accuracy of the whole brain evaluation value could be set to about 82%.
- FIG. 20 is a schematic diagram showing a specific example of the whole brain evaluation value.
- the whole brain evaluation value EA can be obtained by the formula (3).
- the number j of the parts can be, for example, 51, and the number of evaluation values of the parts is also 51.
- the meaning of the whole brain evaluation value will be described on a two-dimensional plane by setting the number of sites to 2.
- the site evaluation values are E1 and E2.
- the distance from the class dividing line (plane) that divides the classes (healthy subjects, patients with brain diseases) on the two-dimensional name surface is the whole brain evaluation value.
- -d1 represents the whole brain evaluation value
- d2 represents the whole brain evaluation value
- the healthy subject side has a negative sign
- the brain disease patient side has a positive sign.
- FIG. 21 is a schematic diagram showing a first example of the whole brain evaluation screen.
- the whole-brain evaluation screen has an area for displaying a list of subjects and an area for displaying the whole-brain evaluation values of subjects.
- the IDs and names of a plurality of subjects are displayed in a list, and the target subjects can be selected.
- a doctor or the like can select a subject to be diagnosed from a list.
- the subject OOOOO surrounded by the broken line is selected.
- the estimation module 40 has a function as a whole-brain evaluation value acquisition unit, acquires the whole-brain evaluation value of a healthy person from a healthy person DB61, and obtains a whole-brain evaluation of a required brain disease of a brain-disease patient from a brain-disease patient DB62. You can get the value.
- the whole-brain evaluation value of the subject can be displayed in a display mode that can be compared with the whole-brain evaluation value (for example, the average value of the whole-brain evaluation value) of a healthy person and a patient with a brain disease.
- the whole-brain evaluation value for example, the average value of the whole-brain evaluation value
- one end of the horizontal bar graph is a healthy person, the other end is a brain disease patient, and the subject is represented by a position on the horizontal bar graph. This makes it possible to visually express whether the subject is close to a healthy person or a patient with a brain disease.
- a plurality of subjects can be dynamically switched and the whole brain evaluation value can be displayed. Further, although not shown, on the whole brain evaluation screen illustrated in FIG. 21, a plurality of types of brain diseases are displayed in a list, and a required brain disease can be selected from the listed brain diseases. Each time a brain disease is selected, a horizontal bar graph showing the brain disease patient suffering from the selected brain disease at the other end may be displayed.
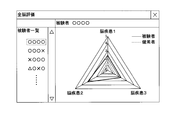
- FIG. 22 is a schematic diagram showing a second example of the whole brain evaluation screen.
- the whole brain evaluation value of the subject and the whole brain evaluation value of a healthy person and a patient with a brain disease can be represented on a radar chart.
- the axes of multiple brain diseases are arranged in a regular polygonal shape from the center.
- three brain diseases 1, 2, and 3 are represented by a regular triangular radar chart.
- the position of a healthy person on the radar chart is shown by a broken line, and the position of a subject is shown by a solid line. This makes it possible to visually express whether the subject is close to a healthy person or a patient with a brain disease for each brain disease.
- the first evaluation index X1 is used, but the second evaluation index X2 may be used in addition to the first evaluation index.
- FIG. 23 is a schematic diagram showing a third example of the whole brain evaluation screen.
- the possibility of each brain disease (in the example of FIG. 23, brain diseases 1, 2, 3, and 4) based on the whole brain evaluation value of the subject is shown by the size of a circle as shown in the bubble chart. It is visually represented by.
- the size of the circle becomes smaller as the subject's whole brain evaluation value approaches the average of the whole brain evaluation values of healthy subjects, and conversely, the subject's whole brain evaluation value becomes the whole brain of the brain disease patient. The closer to the average of the evaluation values, the larger the size of the circle.
- the subject OOOO is likely to be a brain disease patient of brain disease 1.
- the subject OOOO may have a few brain diseases or cannot be denied. Furthermore, it can be seen that the subject OOOO is, for example, at the level of a healthy person for brain disease 4.
- the types of brain diseases are not limited to four as shown in FIG. 23.
- FIG. 24 is a schematic diagram showing a fourth example of the whole brain evaluation screen.
- the symbols A to F of each cell can be the type of brain disease or the part of the brain.
- the numbers in the table can express the strength of the association of each brain disease or each site. The number may be the subject's whole-brain assessment. Further, as shown in FIG. 24, the strength of the relationship between each brain disease or each site may be represented by the pattern or color attached to each cell. In the example of FIG. 24, it can be seen that subject OOOO has a strong association with respect to brain disease (or site) C.
- FIG. 25 is a schematic diagram showing a fifth example of the whole brain evaluation screen.
- the possibility of each brain disease (brain diseases 1 and 2 in the example of FIG. 23) based on the whole brain evaluation value of the subject is visually represented by a matrix chart. It is divided into four regions S1 to S4 by a two-axis matrix.
- Region S1 represents that the possibility of brain disease 2 is high and the possibility of brain disease 1 is low (that is, it can be determined that it is brain disease 2).
- Region S2 represents that the possibility of brain disease 2 is high and the possibility of brain disease 1 is also high (that is, it can be determined that both brain diseases 1 and 2 are present).
- Region S3 represents that the possibility of brain disease 2 is low and the possibility of brain disease 1 is also low (that is, it can be determined that neither brain disease 1 nor 2 is present).
- Region S4 represents that the possibility of brain disease 2 is low and the possibility of brain disease 1 is high (that is, it can be determined that it is brain disease 1).
- the subject OOOO can be determined to have both brain diseases 1 and 2.
- FIG. 26 is a schematic diagram showing a second example of the configuration of the system of the third embodiment.
- the second example differs from the second example in that it includes a second input module 20. Since the second input module 20 is the same as the case of the first embodiment shown in FIG. 1, the description thereof will be omitted.
- the estimation module 40 recognizes the subject based on the whole-brain evaluation value obtained by the second evaluation function having the first evaluation index and the second evaluation index X2 as variables for each of the plurality of parts of the subject's brain. The state of brain damage including dementia can be estimated.
- the evaluation value calculation unit 41 can calculate the whole brain evaluation value by using the second evaluation function.
- the second evaluation function can be expressed by the above equation (3), and the evaluation index xdj includes the first evaluation index and the second evaluation index X2.
- FIGS. 27A and 27B are schematic views showing an example of the ROC curve.
- FIG. 27A shows the ROC (Receiver Operating Characteristic) curve when AD and DLB are differentiated using only the first evaluation index (Z score of 51 sites), and
- FIG. 27B shows the first evaluation index in addition to the first evaluation index. It is a ROC curve when it was differentiated using the evaluation index of 2 (delayed reproduction score in the ADASCog cognitive test).
- the vertical axis represents the true positive rate (TPR) and the horizontal axis represents the FRP (false positive rate).
- the ROC curve is a plot of the true positive rate and the false positive rate calculated for each cutoff point that distinguishes between normal and abnormal in AD diagnosis and DLB diagnosis.
- AUC Area Under the Curve
- AUC can take a value from 0 to 1. The closer the AUC is to 1, the higher the discrimination accuracy.
- FIG. 27B has a higher AUC.
- the discrimination accuracy is improved by adding a delayed regeneration score that evaluates a decrease in long-term memory (stronger in AD cases).
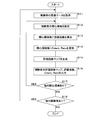
- FIG. 28 is a flowchart showing the procedure of the first example of the output processing of the evaluation result of each part of the brain.
- the system acquires image data of the subject's brain (S11) and sets the subject's region of interest (site) (S12).
- the system calculates an evaluation index (for example, Z score) for each region of interest (S13), and calculates Exent and Ratio for each region of interest (S14).
- an evaluation index for example, Z score
- the system generates an evaluation index map for each region of interest based on the calculated evaluation index (S15), and outputs the evaluation index map, evaluation index, Exent, and Ratio of the subject (S16).
- the system determines the presence or absence of another region of interest (S17), and if there is another region of interest (YES in S17), the process continues in steps S12 and subsequent steps.
- the system determines the presence or absence of other subjects (S18). If there are other subjects (YES in S18), the system continues the process after step S11, and if there are no other subjects (NO in S18), the system ends the process.
- FIG. 29 is a flowchart showing the procedure of the second example of the output processing of the evaluation result of each part of the brain.
- the system acquires image data of the subject's brain (S31) and sets the subject's region of interest (site) (S32).
- the system calculates an evaluation index (for example, Z score) for each region of interest (S33), and calculates a site evaluation value Ej for each region of interest of the subject (S34).
- xdj is an evaluation index (for example, Z score) of the part j
- wdj is a weighting coefficient.
- the system acquires the site evaluation value for each region of interest of the healthy subject from the healthy subject DB61 (S35), and acquires the site evaluation value for each region of interest of the brain disease patient from the brain disease patient DB 62 (S36).
- the system determines whether or not to display in the order of the site evaluation values (for example, in descending order) (S37), and when displaying in the order of the site evaluation values (YES in S37), sorts in the order of the site evaluation values of the subjects (S38). , The process of step S39 described later is performed.
- the system determines whether or not to display the site evaluation values of the subject in comparison with healthy subjects and patients with brain diseases (S39).
- the system outputs the site evaluation values of the subject, the healthy person, and the brain disease patient (S40), and performs the process of step S42 described later.
- the system When not displayed in comparison with healthy subjects and patients with brain diseases (NO in S39), the system outputs the site evaluation value of the subject (S41) and determines the presence or absence of other subjects (S42). If there are other subjects (YES in S42), the system continues the process from step S31 onward, and if there are no other subjects (NO in S42), the system ends the process.
- FIG. 30 is a flowchart showing the procedure of output processing of the whole brain evaluation result.
- the system acquires image data of the subject's brain (S51) and sets the subject's region of interest (site) (S52).
- the system calculates an evaluation index (for example, Z score) for each region of interest (S53), and calculates a site evaluation value Ej for each region of interest of the subject (S54).
- xdj is an evaluation index (for example, Z score) of the part j
- wdj is a weighting coefficient.
- the system calculates the whole brain evaluation value EA (S55).
- the whole brain evaluation value EA can be calculated by the formula (3).
- the system acquires the whole brain evaluation value of the healthy person from the healthy person DB61 (S56), and obtains the whole brain evaluation value of the brain disease patient from the brain disease patient DB62 (S57).
- the system calculates the position of the subject's whole-brain evaluation value within the range of the whole-brain evaluation value of each of the healthy subject and the patient with brain disease (S58). For example, if the average of the whole brain evaluation values of healthy subjects is a, the average of the whole brain evaluation values of brain disease patients is b, and the whole brain evaluation value of subjects is c, the value c is in the range of a to b.
- the position can be determined by where it is.
- the system outputs the whole brain evaluation value of the subject in a display mode (see, for example, FIG. 21) that can be compared with the whole brain evaluation value of each of the healthy subject and the brain disease patient (S59).
- the system determines the presence or absence of other subjects (S60). If there are other subjects (YES in S60), the system continues the process after step S51, and if there are no other subjects (NO in S60), the system ends the process.
- the Z score value of the gray matter volume value of the region of interest on the anatomical standard space is used as the first evaluation index X1, but the first evaluation index is It is not limited to the Z score.
- physical quantities such as blood flow in the region of interest and accumulation of malignant proteins (eg, amyloid ⁇ , tau protein, etc.) in the region of interest may be used.
- a physical quantity when used, it may be normalized by using a ratio of the physical quantity in the region of interest exceeding a predetermined threshold value (for example, the ratio of the number of voxels exceeding the threshold value to the total number of voxels in the region of interest). ..
- the evaluation index can be compared between the regions of interest regardless of the size of the region of interest.
- At least one of SUVR and BR may be used as the first evaluation index X1.
- at least one of the terms w SUVR / SUVR and w BR / BR may be added.
- w SUVR is a weighting coefficient of the evaluation index SUVR
- w BR is a weighting coefficient of the evaluation index BR.
- the evaluation index SUVR or the evaluation index BR is used, and if the index values are standardized values from the distribution of the healthy person DB, etc., the evaluation of each part is performed only by the Z score, as in the case of evaluating each part. The importance of each subject being judged to be sick can be evaluated.
Landscapes
- Health & Medical Sciences (AREA)
- Life Sciences & Earth Sciences (AREA)
- Engineering & Computer Science (AREA)
- Neurology (AREA)
- Physics & Mathematics (AREA)
- General Health & Medical Sciences (AREA)
- Medical Informatics (AREA)
- Veterinary Medicine (AREA)
- Surgery (AREA)
- Molecular Biology (AREA)
- Heart & Thoracic Surgery (AREA)
- Biomedical Technology (AREA)
- Pathology (AREA)
- Animal Behavior & Ethology (AREA)
- Public Health (AREA)
- Biophysics (AREA)
- Physiology (AREA)
- Nuclear Medicine, Radiotherapy & Molecular Imaging (AREA)
- Radiology & Medical Imaging (AREA)
- Psychology (AREA)
- Neurosurgery (AREA)
- Computer Vision & Pattern Recognition (AREA)
- Psychiatry (AREA)
- Artificial Intelligence (AREA)
- Child & Adolescent Psychology (AREA)
- General Physics & Mathematics (AREA)
- Quality & Reliability (AREA)
- Theoretical Computer Science (AREA)
- Developmental Disabilities (AREA)
- Hospice & Palliative Care (AREA)
- Signal Processing (AREA)
- High Energy & Nuclear Physics (AREA)
- Evolutionary Computation (AREA)
- Fuzzy Systems (AREA)
- Mathematical Physics (AREA)
- Measuring And Recording Apparatus For Diagnosis (AREA)
- Magnetic Resonance Imaging Apparatus (AREA)
Abstract
L'invention concerne un système qui détermine l'état de démence par une combinaison de techniques de différenciation d'images et de scores de test cognitif. Un système (1) comprend : un premier module d'entrée (10) qui est conçu pour obtenir un premier indice d'évaluation sur la base de données se rapportant à l'état physique du cerveau d'un sujet ; un second module d'entrée (20) qui est conçu pour obtenir un second indice d'évaluation sur la base de données se rapportant à la fonction du cerveau du sujet ; et un module d'estimation (30) qui est conçu pour estimer l'état de démence du sujet sur la base d'une valeur d'évaluation obtenue par une première fonction d'évaluation dans laquelle le premier indice d'évaluation et le second indice d'évaluation sont utilisés en tant que variables.
Priority Applications (2)
| Application Number | Priority Date | Filing Date | Title |
|---|---|---|---|
| US17/921,775 US20230169648A1 (en) | 2020-04-28 | 2021-02-24 | System, Control Method, Information Providing Method, and Recording Medium |
| JP2022518622A JPWO2021220597A1 (fr) | 2020-04-28 | 2021-02-24 |
Applications Claiming Priority (2)
| Application Number | Priority Date | Filing Date | Title |
|---|---|---|---|
| JP2020079504 | 2020-04-28 | ||
| JP2020-079504 | 2020-04-28 |
Publications (1)
| Publication Number | Publication Date |
|---|---|
| WO2021220597A1 true WO2021220597A1 (fr) | 2021-11-04 |
Family
ID=78331943
Family Applications (1)
| Application Number | Title | Priority Date | Filing Date |
|---|---|---|---|
| PCT/JP2021/006756 WO2021220597A1 (fr) | 2020-04-28 | 2021-02-24 | Système, procédé de commande, procédé de transmission d'informations et programme informatique |
Country Status (3)
| Country | Link |
|---|---|
| US (1) | US20230169648A1 (fr) |
| JP (1) | JPWO2021220597A1 (fr) |
| WO (1) | WO2021220597A1 (fr) |
Cited By (1)
| Publication number | Priority date | Publication date | Assignee | Title |
|---|---|---|---|---|
| WO2024080450A1 (fr) * | 2022-10-12 | 2024-04-18 | 주식회사 피맥스 | Procédé et dispositif d'évaluation d'un trouble de la santé mentale à l'aide d'un modèle comportemental et d'images médicales |
Families Citing this family (2)
| Publication number | Priority date | Publication date | Assignee | Title |
|---|---|---|---|---|
| AU2023257288A1 (en) * | 2022-04-22 | 2024-08-22 | NeuroGeneces Inc. | Sensing system with features for determining physiological metrics of a subject and for predicting electrophysiological events of a subject |
| CN117159001B (zh) * | 2023-11-04 | 2024-03-15 | 北京视友科技有限责任公司 | 脑功能发育的评估方法和系统 |
Citations (11)
| Publication number | Priority date | Publication date | Assignee | Title |
|---|---|---|---|---|
| WO2002053209A1 (fr) * | 2000-12-27 | 2002-07-11 | Philips Japan, Ltd. | Systeme de controle de l'information d'un dispositif de traitement sanguin et de l'information biologique, dispositif de controle de l'information d'un dispositif de traitement sanguin et de l'information biologique, et procede de commande correspondant |
| JP2006208250A (ja) * | 2005-01-28 | 2006-08-10 | Daiichi Radioisotope Labs Ltd | 画像データの領域分類解析システム |
| US20090306534A1 (en) * | 2006-04-03 | 2009-12-10 | President And Fellows Of Harvard College | Systems and methods for predicting effectiveness in the treatment of psychiatric disorders, including depression |
| JP2010012176A (ja) * | 2008-07-07 | 2010-01-21 | Hamamatsu Photonics Kk | 脳疾患診断システム |
| JP2010520478A (ja) * | 2007-03-06 | 2010-06-10 | コーニンクレッカ フィリップス エレクトロニクス エヌ ヴィ | Pet/mrフロー推定を用いて補われる自動診断及び自動整列 |
| JP2011521220A (ja) * | 2008-05-15 | 2011-07-21 | ユニヴェルシテ ピエール エ マリー キュリー(パリ シス) | アルツハイマー病の予測を支援する方法及び自動化システム、並びに、前記システムをトレーニングする方法 |
| JP2013109540A (ja) * | 2011-11-21 | 2013-06-06 | Hitachi Ltd | 判別と回帰を同時に行う回帰分析システムおよび回帰分析方法 |
| US20180070823A1 (en) * | 2015-04-02 | 2018-03-15 | Cambridge Cognition Limited | Systems and methods for assessing cognitive function |
| US20180310870A1 (en) * | 2017-05-01 | 2018-11-01 | The Charles Stark Draper Laboratory, Inc. | Deep learning architecture for cognitive examination subscore trajectory prediction in alzheimer's disease |
| JP2019074343A (ja) * | 2017-10-12 | 2019-05-16 | 日本メジフィジックス株式会社 | 画像処理装置、画像処理方法およびプログラム |
| US20190392579A1 (en) * | 2018-06-25 | 2019-12-26 | The Royal Institution For The Advancement Of Learning/Mcgill University | Method and system of performing medical treatment outcome assessment or medical condition diagnostic |
-
2021
- 2021-02-24 US US17/921,775 patent/US20230169648A1/en active Pending
- 2021-02-24 JP JP2022518622A patent/JPWO2021220597A1/ja active Pending
- 2021-02-24 WO PCT/JP2021/006756 patent/WO2021220597A1/fr active Application Filing
Patent Citations (11)
| Publication number | Priority date | Publication date | Assignee | Title |
|---|---|---|---|---|
| WO2002053209A1 (fr) * | 2000-12-27 | 2002-07-11 | Philips Japan, Ltd. | Systeme de controle de l'information d'un dispositif de traitement sanguin et de l'information biologique, dispositif de controle de l'information d'un dispositif de traitement sanguin et de l'information biologique, et procede de commande correspondant |
| JP2006208250A (ja) * | 2005-01-28 | 2006-08-10 | Daiichi Radioisotope Labs Ltd | 画像データの領域分類解析システム |
| US20090306534A1 (en) * | 2006-04-03 | 2009-12-10 | President And Fellows Of Harvard College | Systems and methods for predicting effectiveness in the treatment of psychiatric disorders, including depression |
| JP2010520478A (ja) * | 2007-03-06 | 2010-06-10 | コーニンクレッカ フィリップス エレクトロニクス エヌ ヴィ | Pet/mrフロー推定を用いて補われる自動診断及び自動整列 |
| JP2011521220A (ja) * | 2008-05-15 | 2011-07-21 | ユニヴェルシテ ピエール エ マリー キュリー(パリ シス) | アルツハイマー病の予測を支援する方法及び自動化システム、並びに、前記システムをトレーニングする方法 |
| JP2010012176A (ja) * | 2008-07-07 | 2010-01-21 | Hamamatsu Photonics Kk | 脳疾患診断システム |
| JP2013109540A (ja) * | 2011-11-21 | 2013-06-06 | Hitachi Ltd | 判別と回帰を同時に行う回帰分析システムおよび回帰分析方法 |
| US20180070823A1 (en) * | 2015-04-02 | 2018-03-15 | Cambridge Cognition Limited | Systems and methods for assessing cognitive function |
| US20180310870A1 (en) * | 2017-05-01 | 2018-11-01 | The Charles Stark Draper Laboratory, Inc. | Deep learning architecture for cognitive examination subscore trajectory prediction in alzheimer's disease |
| JP2019074343A (ja) * | 2017-10-12 | 2019-05-16 | 日本メジフィジックス株式会社 | 画像処理装置、画像処理方法およびプログラム |
| US20190392579A1 (en) * | 2018-06-25 | 2019-12-26 | The Royal Institution For The Advancement Of Learning/Mcgill University | Method and system of performing medical treatment outcome assessment or medical condition diagnostic |
Cited By (1)
| Publication number | Priority date | Publication date | Assignee | Title |
|---|---|---|---|---|
| WO2024080450A1 (fr) * | 2022-10-12 | 2024-04-18 | 주식회사 피맥스 | Procédé et dispositif d'évaluation d'un trouble de la santé mentale à l'aide d'un modèle comportemental et d'images médicales |
Also Published As
| Publication number | Publication date |
|---|---|
| US20230169648A1 (en) | 2023-06-01 |
| JPWO2021220597A1 (fr) | 2021-11-04 |
Similar Documents
| Publication | Publication Date | Title |
|---|---|---|
| WO2021220597A1 (fr) | Système, procédé de commande, procédé de transmission d'informations et programme informatique | |
| Maass et al. | Comparison of multiple tau-PET measures as biomarkers in aging and Alzheimer's disease | |
| Zarkali et al. | Fiber-specific white matter reductions in Parkinson hallucinations and visual dysfunction | |
| Goswami et al. | Frontotemporal correlates of impulsivity and machine learning in retired professional athletes with a history of multiple concussions | |
| Rondina et al. | Selecting the most relevant brain regions to discriminate Alzheimer's disease patients from healthy controls using multiple kernel learning: A comparison across functional and structural imaging modalities and atlases | |
| Bron et al. | Diagnostic classification of arterial spin labeling and structural MRI in presenile early stage dementia | |
| Huang et al. | White matter changes in healthy adolescents at familial risk for unipolar depression: a diffusion tensor imaging study | |
| Lerch et al. | Automated cortical thickness measurements from MRI can accurately separate Alzheimer's patients from normal elderly controls | |
| Bede et al. | Pathological neural networks and artificial neural networks in ALS: diagnostic classification based on pathognomonic neuroimaging features | |
| Wang et al. | Diffusion tensor imaging of vascular parkinsonism: structural changes in cerebral white matter and the association with clinical severity | |
| Colloby et al. | The application of statistical parametric mapping to 123I-FP-CIT SPECT in dementia with Lewy bodies, Alzheimer's disease and Parkinson's disease | |
| Li et al. | Discriminative analysis of multivariate features from structural MRI and diffusion tensor images | |
| Albrecht et al. | Atrophy in midbrain & cerebral/cerebellar pedunculi is characteristic for progressive supranuclear palsy–A double-validation whole-brain meta-analysis | |
| Youssofzadeh et al. | Multi-kernel learning with dartel improves combined MRI-PET classification of Alzheimer’s disease in AIBL data: group and individual analyses | |
| Van Weehaeghe et al. | Combined brain and spinal FDG PET allows differentiation between ALS and ALS mimics | |
| Li et al. | Cognition-related white matter integrity dysfunction in Alzheimer's disease with diffusion tensor image | |
| Borsa et al. | Interference and conflict monitoring in individuals with amnestic mild cognitive impairment: A structural study of the anterior cingulate cortex | |
| Catricalà et al. | Functional correlates of preserved naming performance in amnestic Mild Cognitive Impairment | |
| Zhutovsky et al. | Individual prediction of behavioral variant frontotemporal dementia development using multivariate pattern analysis of magnetic resonance imaging data | |
| Zahn et al. | Mapping of temporal and parietal cortex in progressive nonfluent aphasia and Alzheimer's disease using chemical shift imaging, voxel-based morphometry and positron emission tomography | |
| Beheshti et al. | FLAIR-wise machine-learning classification and lateralization of MRI-negative 18F-FDG PET-positive temporal lobe epilepsy | |
| Pérez‐Millan et al. | Classifying Alzheimer's disease and frontotemporal dementia using machine learning with cross‐sectional and longitudinal magnetic resonance imaging data | |
| WO2021221008A1 (fr) | Système, procédé de commande et programme | |
| Yousefzadeh-Nowshahr et al. | Quantitative analysis of regional distribution of tau pathology with 11C-PBB3-PET in a clinical setting | |
| Ni et al. | Detection of Alzheimer’s disease using ECD SPECT images by transfer learning from FDG PET |
Legal Events
| Date | Code | Title | Description |
|---|---|---|---|
| 121 | Ep: the epo has been informed by wipo that ep was designated in this application |
Ref document number: 21795863 Country of ref document: EP Kind code of ref document: A1 |
|
| ENP | Entry into the national phase |
Ref document number: 2022518622 Country of ref document: JP Kind code of ref document: A |
|
| NENP | Non-entry into the national phase |
Ref country code: DE |
|
| 122 | Ep: pct application non-entry in european phase |
Ref document number: 21795863 Country of ref document: EP Kind code of ref document: A1 |