WO2021193199A1 - 糖鎖を解析する方法 - Google Patents
糖鎖を解析する方法 Download PDFInfo
- Publication number
- WO2021193199A1 WO2021193199A1 PCT/JP2021/010385 JP2021010385W WO2021193199A1 WO 2021193199 A1 WO2021193199 A1 WO 2021193199A1 JP 2021010385 W JP2021010385 W JP 2021010385W WO 2021193199 A1 WO2021193199 A1 WO 2021193199A1
- Authority
- WO
- WIPO (PCT)
- Prior art keywords
- nucleic acid
- labeled
- cell
- cells
- sugar chain
- Prior art date
- Legal status (The legal status is an assumption and is not a legal conclusion. Google has not performed a legal analysis and makes no representation as to the accuracy of the status listed.)
- Ceased
Links
Images


Classifications
-
- G—PHYSICS
- G01—MEASURING; TESTING
- G01N—INVESTIGATING OR ANALYSING MATERIALS BY DETERMINING THEIR CHEMICAL OR PHYSICAL PROPERTIES
- G01N33/00—Investigating or analysing materials by specific methods not covered by groups G01N1/00 - G01N31/00
- G01N33/48—Biological material, e.g. blood, urine; Haemocytometers
- G01N33/50—Chemical analysis of biological material, e.g. blood, urine; Testing involving biospecific ligand binding methods; Immunological testing
- G01N33/53—Immunoassay; Biospecific binding assay; Materials therefor
- G01N33/5308—Immunoassay; Biospecific binding assay; Materials therefor for analytes not provided for elsewhere, e.g. nucleic acids, uric acid, worms, mites
-
- C—CHEMISTRY; METALLURGY
- C12—BIOCHEMISTRY; BEER; SPIRITS; WINE; VINEGAR; MICROBIOLOGY; ENZYMOLOGY; MUTATION OR GENETIC ENGINEERING
- C12Q—MEASURING OR TESTING PROCESSES INVOLVING ENZYMES, NUCLEIC ACIDS OR MICROORGANISMS; COMPOSITIONS OR TEST PAPERS THEREFOR; PROCESSES OF PREPARING SUCH COMPOSITIONS; CONDITION-RESPONSIVE CONTROL IN MICROBIOLOGICAL OR ENZYMOLOGICAL PROCESSES
- C12Q1/00—Measuring or testing processes involving enzymes, nucleic acids or microorganisms; Compositions therefor; Processes of preparing such compositions
- C12Q1/68—Measuring or testing processes involving enzymes, nucleic acids or microorganisms; Compositions therefor; Processes of preparing such compositions involving nucleic acids
- C12Q1/6844—Nucleic acid amplification reactions
- C12Q1/686—Polymerase chain reaction [PCR]
-
- G—PHYSICS
- G01—MEASURING; TESTING
- G01N—INVESTIGATING OR ANALYSING MATERIALS BY DETERMINING THEIR CHEMICAL OR PHYSICAL PROPERTIES
- G01N33/00—Investigating or analysing materials by specific methods not covered by groups G01N1/00 - G01N31/00
- G01N33/48—Biological material, e.g. blood, urine; Haemocytometers
- G01N33/50—Chemical analysis of biological material, e.g. blood, urine; Testing involving biospecific ligand binding methods; Immunological testing
- G01N33/58—Chemical analysis of biological material, e.g. blood, urine; Testing involving biospecific ligand binding methods; Immunological testing involving labelled substances
-
- C—CHEMISTRY; METALLURGY
- C07—ORGANIC CHEMISTRY
- C07K—PEPTIDES
- C07K14/00—Peptides having more than 20 amino acids; Gastrins; Somatostatins; Melanotropins; Derivatives thereof
- C07K14/415—Peptides having more than 20 amino acids; Gastrins; Somatostatins; Melanotropins; Derivatives thereof from plants
- C07K14/42—Lectins, e.g. concanavalin, phytohaemagglutinin
-
- G—PHYSICS
- G01—MEASURING; TESTING
- G01N—INVESTIGATING OR ANALYSING MATERIALS BY DETERMINING THEIR CHEMICAL OR PHYSICAL PROPERTIES
- G01N2400/00—Assays, e.g. immunoassays or enzyme assays, involving carbohydrates
- G01N2400/10—Polysaccharides, i.e. having more than five saccharide radicals attached to each other by glycosidic linkages; Derivatives thereof, e.g. ethers, esters
Definitions
- the present invention relates to a method for analyzing sugar chains. More specifically, the present invention relates to a method for analyzing a sugar chain, a kit for analyzing a sugar chain, and a sugar chain binding substance.
- the present application claims priority based on Japanese Patent Application No. 2020-053296 filed in Japan on March 24, 2020, the contents of which are incorporated herein by reference.
- sugar chains have functions such as mediating cell-cell interactions and change according to the type and state of cells.
- sugar chains can be used as cell undifferentiated markers and cancer markers.
- sugar chain analysis has been performed by a method of staining cells or the like using lectins or antibodies, a method of using a liquid chromatography and mass spectrometer, a method of using a lectin array in which various types of lectins are immobilized on a substrate, etc. (See, for example, Patent Document 1).
- sugar chains can be analyzed relatively easily.
- it may be difficult to analyze the glycome of an actual living cell because the protein extracted by destroying the cell is analyzed.
- it is necessary to use about 500 ng of protein for analysis and it is not possible to analyze sugar chains at the single cell level. For this reason, it is particularly difficult to analyze tissue sections.
- the lectin array is produced by using a special spotter, it tends to be difficult to produce a uniform lectin array due to a difference between lots. Therefore, it may be difficult to obtain analysis results with good reproducibility by the method using a lectin array.
- analysis of sugar chains using a lectin array requires a special and expensive scanner for detection. Against this background, an object of the present invention is to provide a new technique for analyzing sugar chains.
- the present invention includes the following aspects.
- a method for analyzing a sugar chain on the surface of a cell wherein the cell is brought into contact with a nucleic acid-labeled sugar chain-binding substance, and the sugar chain-binding substance labeled on the cell is labeled.
- a method comprising detecting a nucleic acid, wherein the type and amount of the nucleic acid corresponds to the type and amount of sugar chains on the surface of the cell.
- the method according to claim 1 wherein the phenotype of the cell or RNA information in the cell is further analyzed together with the sugar chain.
- [3] The method according to [1] or [2], wherein contacting the cell with the nucleic acid-labeled sugar chain-binding substance is performed in a buffer solution containing albumin.
- [4] The method according to any one of [1] to [3], which is carried out at the 1-cell level.
- [5] The method according to any one of [1] to [4], wherein the detection is performed by real-time quantitative PCR, digital PCR, or sequencing by a next-generation sequencer.
- Nucleic acid-labeled sugar chain binding substance [7] A kit for analyzing sugar chains on the surface of cells, which comprises the sugar chain-binding substance according to [6].
- FIG. 5 is a photograph showing the results of Coomassie Brilliant Blue (CBB) staining after separating each purified fusion protein by SDS-polyacrylamide gel electrophoresis (SDS-PAGE) in Experimental Example 1. It is a photograph which shows the result of agarose gel electrophoresis in Experimental Example 1.
- FIG. 2 is a photograph showing the results of silver staining of samples from each process of preparation of nucleic acid-labeled lectins in Experimental Example 2 by subjecting them to SDS-PAGE.
- FIG. 3 is a photograph showing the results of silver staining of samples from each process of preparation of nucleic acid-labeled lectins in Experimental Example 3 by subjecting them to SDS-PAGE.
- FIG. 5 is a photograph showing the results of Coomassie Brilliant Blue (CBB) staining after separating each purified fusion protein by SDS-polyacrylamide gel electrophoresis (SDS-PAGE) in Experimental Example 1. It is a photograph which shows the result
- FIG. 5 is a photograph showing the results of silver staining of samples from each process of purification of nucleic acid-labeled lectins in Experimental Example 4 by subjecting them to SDS-PAGE.
- FIG. 5 is a photograph showing the results of silver staining of samples from each process of purification of nucleic acid-labeled lectins in Experimental Example 5 by subjecting them to SDS-PAGE.
- It is a graph which shows the result of the real-time quantitative PCR in Experimental Example 6.
- It is a graph which shows the result of the flow cytometry analysis in Experimental Example 6.
- the graph shows the results of flow cytometry analysis on the horizontal axis and the results of real-time quantitative PCR on the vertical axis. It is a graph which shows the result of the real-time quantitative PCR in Experimental Example 11. It is a figure which shows the result of Experimental Example 12. It is a graph which shows the result of Experimental Example 13. It is a graph which shows the result of Experimental Example 14. It is a graph which shows the result of Experimental Example 15. It is a graph which shows the result of Experimental Example 15. 6 is a graph showing typical results of analysis of sugar chains on the surface of cells and RNA in cells at the cell level in Experimental Example 16. 6 is a graph showing typical results of analysis of sugar chains on the surface of cells and RNA in cells at the cell level in Experimental Example 16.
- Experimental Example 17 it is a scatter diagram which shows the binding amount of rBC2LCN lectin to each cell, and the expression level of the VIM gene in each cell.
- the correlation coefficient between the expression level of the POU5F1 gene in each cell and the binding amount of 39 types of lectins was calculated and arranged in descending order.
- the correlation coefficient between the expression level of the OTX2 gene in each cell and the binding amount of 39 types of lectins was calculated and arranged in descending order.
- the invention provides a nucleic acid-labeled sugar chain binding material.
- the sugar chain on the surface of the cell can be easily and highly sensitively analyzed.
- the sugar chain-binding substance is not particularly limited as long as it recognizes the sugar chain structure and specifically binds to the substance, and examples thereof include lectins, antibodies, antibody fragments, and aptamers.
- examples of the antibody fragment include F (ab') 2 , Fab', Fab, Fv, scFv and the like.
- lectin is defined as a general term for proteins having an activity of binding to a sugar chain.
- the lectin is not particularly limited, and for example, the lectins shown in Tables 1 to 5 below can be preferably used.
- “Natural” indicates that it is derived from a natural product
- "E. coli” indicates that it is a genetically modified organism.
- "EY Lab.” Indicates EY Laboratories, "Wako” indicates Fujifilm Wako Pure Chemical Industries, Ltd., “Seikagaku” indicates Seikagaku Corporation, and "Vector” indicates Vector Laboratories.
- sia indicates sialic acid
- GlcNAc indicates N-acetyl-glucosamine
- Man indicates mannose
- Gal indicates D-galactose
- GalNAc indicates N-acetyl-galactosamine
- Fuc indicates L-fucose
- Glc indicates D-glucose
- LacNAc indicates N-acetyl-lactosamine
- lectin a recombinant lectin derived from Escherichia coli that has not been modified with a sugar chain is preferable. Further, in order to comprehensively analyze the sugar chain, it is preferable to use a mixture of lectins that recognize the monosaccharides Sia, Gal, GlcNAc, Man, Fuc, and GalNAc constituting the sugar chain.
- the nucleic acid that labels the sugar chain binding substance may be, for example, a cyclic nucleic acid, for example, a single-stranded nucleic acid fragment, or for example, a double-stranded nucleic acid fragment.
- examples of the cyclic nucleic acid include plasmid DNA and the like.
- the nucleic acid that labels the sugar chain-binding substance may be DNA or RNA, but from the viewpoint of stability, DNA is preferable.
- the base sequence of the nucleic acid that labels the sugar chain-binding substance is preferably a base sequence that does not exist in nature.
- the signal indicating the presence of the sugar chain-binding substance can be amplified.
- the detection sensitivity can be increased.
- the length does not affect the binding of the sugar chain and provides information indicating the corresponding sugar chain binding substance. It is not particularly limited as long as it can be retained, and may be, for example, several tens of bases (or base pairs) to several tens of kilobases (or base pairs). Further, the nucleic acid may be circular DNA such as a plasmid.
- the nucleic acid labeling the sugar chain binding substance may be detected by real-time quantitative PCR, digital PCR, or sequence by a next-generation sequencer.
- the nucleic acid labeling the sugar chain binding substance further has a base sequence region to which the PCR primer can hybridize.
- the nucleic acid labeling the sugar chain-binding substance is a base that enables pretreatment for next-generation sequencing such as bridge PCR and emulsion PCR. It is preferable to have more sequences.
- the length of the nucleic acid labeling the sugar chain binding substance is particularly preferably 50 to 100 bases.
- the base sequence for encoding the sugar chain binding substance is 10 to 30 bases, and it is preferable to add an adapter sequence of 10 to 30 bases to the 5'side and the 3'side, respectively.
- the base sequence for encoding the sugar chain-binding substance is selected so that there is no base bias.
- the base sequence of the PCR primer is a base sequence (5 to 10 bases) for identifying various types of cells, and hybridizes to the flow cell in the next-generation sequence. It preferably contains a base sequence (20 to 30 bases) for hybridizing.
- the nucleic acid may be bound to the sugar chain-binding substance, for example, by linking the nucleic acid-binding domain to the sugar-chain-binding substance and binding the nucleic acid to the nucleic acid-binding domain.
- a chemical linker may be used to bind the sugar chain-binding substance to the nucleic acid, or a click reaction may be used to bind the sugar chain-binding substance to the nucleic acid.
- a functional group such as an amino group or an SH group may be introduced into the nucleic acid.
- an azide group, an alkyne group or the like may be introduced into the nucleic acid. The introduction of these groups can be carried out by chemical synthesis of nucleic acids or the like.
- a spacer may exist between the sugar chain binding substance and the nucleic acid.
- the spacer is not particularly limited, and examples thereof include polyethylene glycol chains, polyacrylamide chains, polyester chains, polyurethane chains, copolymers thereof, and the like.
- the spacer may be derived from a chemical linker.
- the spacer may contain a cleaveable group.
- the nucleic acid is separated from the sugar chain-binding substance by irradiating the nucleic acid-labeled sugar chain-binding substance with light. It becomes possible to collect it.
- the present invention is a method for analyzing a sugar chain on the surface of a cell, in which the cell is brought into contact with a nucleic acid-labeled sugar chain binding substance and the sugar chain binding bound to the cell.
- a method comprising detecting the nucleic acid labeled with a substance, wherein the type and amount of the nucleic acid corresponds to the type and amount of sugar chains on the surface of the cell.
- the cells are not particularly limited, and examples thereof include microorganisms (viruses, bacteria, fungi), insect cells, plant cells, animal cells, and the like.
- a tissue section or the like can also be used as a sample. The cell or tissue section may be alive or fixed.
- the cell to be analyzed is brought into contact with a nucleic acid-labeled sugar chain-binding substance.
- a nucleic acid-labeled sugar chain binding substance the above-mentioned substances can be used.
- nucleic acid-labeled sugar chain binding substance may be brought into contact with cells alone, or two or more types may be mixed and brought into contact with cells. By simultaneously contacting cells with various nucleic acid-labeled sugar chain-binding substances, it becomes possible to comprehensively analyze the sugar chain structure on the surface of cells.
- Contact between the cell and the nucleic acid-labeled sugar chain-binding substance can be performed by mixing the cell and the nucleic acid-labeled sugar chain-binding substance in a solution such as in a medium, physiological saline, or a buffer solution. ..
- the cells are brought into contact with the nucleic acid-labeled sugar chain-binding substance in a buffer solution containing albumin.
- the detection signal can be significantly enhanced by contacting the cells with the nucleic acid-labeled sugar chain-binding substance in a buffer solution containing albumin.
- buffer solution examples include Tris buffer solution, phosphate buffered saline and the like.
- composition of the phosphate buffered saline examples include NaCl 137 mmol / L, KCl 2.7 mmol / L, Na 2 HPO 4 10 mmol / L, and KH 2 PO 4 1.76 mmol / L. Further, it is preferable that the pH of the phosphate buffered saline is adjusted to about 7.4.
- albumin bovine serum albumin, human serum albumin and the like can be used.
- Albumin may be a recombinant.
- the concentration of albumin in the buffer solution is preferably about 0.1 to 10% by mass.
- the amount of the nucleic acid-labeled sugar chain-binding substance to be brought into contact with the cell to be analyzed may be one or more molecules per one type of nucleic acid-labeled sugar chain-binding substance per cell. It is preferable that the amount is such that the sugar chains existing on the surface of the cell can be saturated.
- the time for contacting the nucleic acid-labeled sugar chain-binding substance with the cell to be analyzed is particularly limited as long as the sugar chain-binding substance is sufficiently time to bind to the sugar chain on the surface of the cell to be analyzed. It may be, for example, about 10 minutes to 24 hours, for example, about 10 minutes to 8 hours, for example, about 10 minutes to 3 hours, or for example, about 1 hour. ..
- the temperature at which the nucleic acid-labeled sugar chain-binding substance is brought into contact is not particularly limited as long as the sugar chain-binding substance binds to the sugar chain on the surface of the cell to be analyzed, and is, for example, about 4 to 37 ° C. It's okay.
- the sugar chain-binding substance binds to the sugar chain on the surface of the cell to be analyzed.
- the unreacted sugar chain-binding substance can be removed, for example, by repeating the operation of adding a buffer solution and centrifuging the cells to remove the supernatant one to several times.
- the nucleic acid labeled with the sugar chain binding substance bound to the cell is detected.
- the nucleic acid may be detected in a state where the nucleic acid-labeled sugar chain-binding substance is bound to the cell, or the nucleic acid-labeled sugar chain-binding substance is dissociated from the cell, and the nucleic acid-labeled sugar is further detected. It may be performed after separating the chain-binding substance from the cell, or after separating and recovering the nucleic acid from the nucleic acid-labeled sugar chain-binding substance.
- Examples of the method for dissociating the nucleic acid-labeled sugar chain-binding substance from the cell include a method in which the cell reacts with a sugar that competes with the sugar chain-binding substance, and a method in which a surfactant is allowed to act on the sugar chain-binding substance and the surface of the cell.
- a method of dissociating the bond with the sugar chain a method of dissociating the bond between the sugar chain-binding substance and the sugar chain on the cell surface by changing the pH, and a method of acting a reducing agent to dissociate the sugar chain-binding substance and the sugar on the cell surface. Examples thereof include a method of dissociating the bond with the chain.
- the nucleic acid when a cleaving group is introduced between the nucleic acid and the sugar chain-binding substance, the nucleic acid can be separated and recovered from the nucleic acid-labeled sugar chain-binding substance.
- the nucleic acid when a group that can be cleaved by light irradiation has been introduced between the nucleic acid and the sugar chain-binding substance in advance, the nucleic acid can be separated from the nucleic acid-labeled sugar chain-binding substance by irradiating with light. .. Then, for example, the nucleic acid can be recovered by centrifuging and collecting the supernatant.
- the detection of the nucleic acid labeled with the sugar chain binding substance bound to the cell may be performed by, for example, real-time quantitative PCR, digital PCR, or sequencing by a next-generation sequencer.
- the detection signal can be amplified and the detection sensitivity can be increased.
- the type and amount of nucleic acid detected corresponds to the type and amount of sugar chains on the surface of the cell.
- the type of nucleic acid is the type of the base sequence of the nucleic acid labeled with the sugar chain binding substance.
- the type of sugar chain-binding substance on which the nucleic acid is labeled can be specified. Therefore, by specifying the base sequence of the nucleic acid, the sugar chain structure existing on the surface of the cell to be analyzed can be specified.
- the amount of nucleic acid having a specific base sequence corresponds to the amount of sugar chain-binding substance bound to the cell to be analyzed. That is, the amount of nucleic acid having a specific base sequence corresponds to the amount of a specific sugar chain structure present on the surface of the cell to be analyzed. This makes it possible to quantitatively analyze the type and amount of sugar chain structure existing on the surface of the cell to be analyzed.
- Real-time quantitative PCR, digital PCR, and next-generation sequencing can be performed using a general-purpose device. Therefore, if these devices already exist, it is not necessary to prepare a new special device for the analysis of sugar chains.
- the method of this embodiment since the method of this embodiment has high detection sensitivity, it is possible to analyze sugar chains on the surface of cells at the single cell level.
- one cell is used as a sample, a nucleic acid-labeled sugar chain-binding substance is brought into contact with the sample, and the nucleic acid labeled with the bound sugar chain-binding substance is detected.
- the cells are still alive even after the nucleic acid is recovered from the surface of the cells. Therefore, it is possible to analyze the sugar chain on the cell surface and simultaneously analyze the cell phenotype or intracellular RNA information.
- cell phenotypes include cell morphology, proliferation ability, differentiation ability, infiltration ability, tumorigenic ability, expression of marker protein, and the like.
- intracellular genetic information or cell phenotype can also be analyzed at the single cell level.
- intracellular RNA information include nucleotide sequence information or expression level information such as mRNA, microRNA, 16S rRNA, and non-coding RNA.
- the present invention provides a kit for analyzing sugar chains on the surface of cells, which comprises the above-mentioned nucleic acid-labeled sugar chain-binding substance.
- the above-mentioned analysis of sugar chains on the surface of cells can be preferably performed.
- the kit of the present embodiment may contain one kind of nucleic acid-labeled sugar chain binding substance, or may contain two or more kinds, for example, 10 kinds or more, for example, 30 kinds or more, for example, 50 kinds or more, for example, 100 kinds or more. You may. It is preferable that the kit of the present embodiment contains a large number of nucleic acid-labeled sugar chain-binding substances because it facilitates comprehensive analysis of the sugar chain structure existing on the surface of cells.
- the kit of the present embodiment may further contain a buffer solution containing albumin as a solvent for contacting the nucleic acid-labeled sugar chain-binding substance with the cells to be analyzed.
- the buffer solution containing albumin is the same as that described above.
- the background can be suppressed by contacting the cells with the nucleic acid-labeled sugar chain-binding substance in a buffer solution containing albumin.
- kit of the present embodiment may further contain a primer for detecting a nucleic acid bound to a sugar chain binding substance.
- Nucleic acids bound to sugar chain-binding substances can be detected by real-time quantitative PCR, digital PCR, next-generation sequencing, etc. using the primers.
- for real-time PCR indicates the sequence number of the base sequence used for real-time PCR analysis in the experimental example described later, and "for next-generation sequence” was used for the next-generation sequence in the experimental example described later. Indicates that it is the sequence number of the base sequence.
- Example 1 (Preparation of nucleic acid-labeled lectin 1) An attempt was made to prepare a nucleic acid-labeled lectin. First, a fusion protein of a lectin and a nucleic acid binding domain was prepared. BC2LCN lectin was used as the lectin. The amino acid sequence of BC2LCN lectin is shown in SEQ ID NO: 1.
- a peptide having four consecutive arginine residues SEQ ID NO: 2, hereinafter referred to as "R4"
- R5" a peptide having five consecutive arginine residues
- R6 A peptide having 6 consecutive arginine residues
- R7 a peptide having 7 consecutive arginine residues
- a peptide having 10 consecutive residues (SEQ ID NO: 6, hereinafter referred to as "R10") and the HMG BoxA domain of mitochondrial transcription factor A (TFAM) (SEQ ID NO: 7, hereinafter referred to as "TFAM”) are used. bottom. It is known that arginine is basic and easily binds to a nucleic acid having a phosphoric acid moiety.
- rBC2LCN recombinant BC2LCN lectin
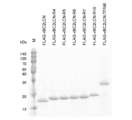
- FIG. 1 is a photograph showing the results of coomassie brilliant blue (CBB) staining after separating each purified fusion protein by SDS-polyacrylamide gel electrophoresis (SDS-PAGE).
- CBB coomassie brilliant blue
- M indicates a molecular weight marker
- FLAG-rBC2LCN indicates a fusion protein having no nucleic acid binding domain
- FLAG-rBC2LCN-R4 indicates a fusion protein linked with "R4".
- FLAG-rBC2LCN-R5 indicates a fusion protein linked with "R5"
- FLAG-rBC2LCN-R6 indicates a fusion protein linked with "R6”
- FLAG-rBC2LCN-R7 indicates a fusion protein linked with "R7”.
- FLAG-rBC2LCN-R10 indicates a fusion protein linked with "R10”
- FLAG-rBC2LCN-TFAM indicates a fusion protein linked with "TFAM”.
- each purified fusion protein and plasmid DNA was analyzed. Specifically, 1 ⁇ g of plasmid DNA (pCR2.1) and 1, 2, 3, 4, 5 ⁇ g of each fusion protein were mixed and subjected to agarose gel electrophoresis.
- FIG. 2 is a photograph showing the results of agarose gel electrophoresis.
- M indicates a molecular weight marker
- rBC2LCN indicates a fusion protein having no nucleic acid binding domain
- rBC2LCN-R4 indicates a fusion protein linked with "R4"
- rBC2LCN-R5" Indicates a fusion protein linked with "R5"
- rBC2LCN-R6 indicates a fusion protein linked with "R6”
- rBC2LCN-R7 indicates a fusion protein linked with "R7”
- rBC2LCN-R10 indicates a fusion protein linked with "R7”.
- "” Indicates a fusion protein in which "R10” is linked
- rBC2LCN-TFAM indicates a fusion protein in which "TFAM” is linked.
- nucleic acid-labeled lectin can be prepared by mixing a nucleic acid with a fusion protein of a lectin and a nucleic acid binding domain.
- S-4FB N-succinimidyl-4-formylbenzamide
- 4FB-oligonucleotide 4 -Formylbenzamide
- HyNic-protein succinimidyl-4-hydrazinonicotinate acetone hydrazone
- a nucleic acid-labeled lectin was prepared by binding an oligonucleotide to rBC2LCN according to the instructions of the kit.
- rBC2LCN was used as the lectin.
- an oligonucleotide having the nucleotide sequence shown in SEQ ID NO: 8 was used as the nucleic acid.
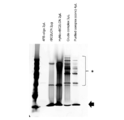
- FIG. 3 is a photograph showing the results of silver staining of samples from each process of preparation of nucleic acid-labeled lectins by subjecting them to SDS-PAGE.
- 4FB-oligo represents a 4FB-ized oligonucleotide
- HyNic-rBC2LCN represents a HyNicized rBC2LCN
- Rede complex represents an unpurified reactant
- Purified complex (conc) Represents a purified and concentrated reactant.
- “*” indicates rBC2LCN to which the oligonucleotide is bound
- the arrow indicates rBC2LCN to which the oligonucleotide is not bound.
- nucleic acid-labeled lectin can be prepared by using a commercially available kit.
- each rBC2LCN converted to DBCO was mixed with a 10-fold molar concentration of azide oligonucleotide (SEQ ID NO: 8) and reacted at 4 ° C. overnight.
- the oligonucleotide was azide-modified at the 5'end.
- FIG. 4 is a photograph showing the results of silver-staining the samples of each process by subjecting them to SDS-PAGE.
- DBCO-rBC2LCN represents rBC2LCN converted to DBCO
- 15x represents rBC2LCN converted to DBCO
- 15x represents rBC2LCN converted to DBCO
- 15x represents rBC2LCN converted to DBCO
- 15x represents rBC2LCN converted to DBCO
- 15x "30x”, and “50x” react with NHS-DBCO having 15-fold, 30-fold, and 50-fold molar concentrations, respectively.
- Cyrude complex represents an unpurified reaction product.
- * indicates rBC2LCN to which the oligonucleotide is bound
- the arrow indicates rBC2LCN to which the oligonucleotide is not bound.
- nucleic acid-labeled lectin 4 (Preparation of nucleic acid-labeled lectin 4) Nucleic acid-labeled lectins were prepared using the click reaction between the azide group and the alkyne group. Specifically, first, rBC2LCN was reacted with a 2-fold molar concentration of dibenzocyclooctyne-N-hydroxysuccinimidyl ester (NHS-DBCO) at room temperature for 1 hour to convert it into DBCO. Subsequently, a 10-fold molar concentration of azide oligonucleotide (SEQ ID NO: 8) was mixed with DBCO-modified rBC2LCN and reacted at 4 ° C.
- SEQ ID NO: 8 azide oligonucleotide
- nucleic acid-labeled lectin was obtained overnight to obtain a nucleic acid-labeled lectin.
- the oligonucleotide was azide-modified at the 5'end.
- the nucleic acid-labeled lectin was purified by affinity chromatography using fucose sepharose.
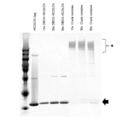
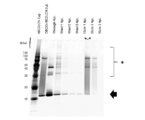
- FIG. 5 is a photograph showing the results of silver staining of samples from each process of purification of nucleic acid-labeled lectins by subjecting them to SDS-PAGE.
- DBCO-rBC2LCN represents DBCO-converted rBC2LCN
- Crede complex represents an unpurified nucleic acid-labeled lectin.
- Thinough represents a sample that has passed through an affinity column
- Wash1", “Wash2", and “Wash3” represent the first, second, and third cleaning solutions, respectively
- Elute3 represents the first, second, and third eluates, respectively.
- * indicates rBC2LCN to which the oligonucleotide is bound
- the arrow indicates rBC2LCN to which the oligonucleotide is not bound.
- rBC2LCN a recombinant of ABA lectin (rABA), a recombinant of LSLN lectin (rLSRN), SNA lectin (catalog number "L-1300", Vector), GSLII lectin (catalog number).
- rABA ABA lectin
- rLSRN LSLN lectin
- SNA SNA lectin
- GSLII GSLII lectin
- Each lectin was purified by affinity chromatography using Sepharose beads in which the sugar to which each lectin was bound was immobilized.
- N-acetylglucosamine-immobilized Sepharose beads were used for purification of rABA
- galactose-immobilized Sepharose beads were used for purification of rLSRN
- lactose was immobilized for SNA purification.
- Sepharose beads are used
- N-acetylglucosamine-immobilized Sepharose beads are used for GSLII purification
- fucose-immobilized Sepharose beads are used for rAAL purification
- mannose is immobilized for ConA purification.
- the Sepharose beads were used.
- oligonucleotide SEQ ID NO: 8
- PC-DBCO-modified rBC2LCN PC-DBCO-modified rBC2LCN
- a 10-fold molar concentration of azide oligonucleotide SEQ ID NO: 8
- PC-DBCO-modified rBC2LCN PC-DBCO-modified rBC2LCN
- the oligonucleotide was azide-modified at the 5'end.
- the nucleic acid-labeled lectin was purified by affinity chromatography using fucose sepharose.
- FIG. 6 is a photograph showing the results of silver staining of samples from each process of purification of nucleic acid-labeled lectins by subjecting them to SDS-PAGE.
- PC-DBCO-rBC2LCN represents PC-DBCO-converted rBC2LCN
- Through represents a sample that has passed through an affinity column
- Wash1, represents a sample that has passed through an affinity column
- Wash1 represents a sample that has passed through an affinity column
- Wash1 "Wash2,” and “Wash3”
- the first, second, and third cleaning solutions are represented, and “Elute1", “Elute2", and “Elute3” represent the first, second, and third elution solutions, respectively.
- “*” indicates rBC2LCN to which the oligonucleotide is bound
- the arrow indicates rBC2LCN to which the oligonucleotide is not bound.
- Each lectin was purified by affinity chromatography using Sepharose beads in which the sugar to which each lectin was bound was immobilized. Samples from each process of purification were subjected to SDS-PAGE and silver-stained. As a result, it was confirmed that each oligonucleotide could be cleaved to each of rABA, rLSRN, SNA, GSLII, rAAL and ConA by light irradiation. rice field.
- nucleic acid-labeled lectin the nucleic acid-labeled rBC2LCN lectin prepared in the same manner as in Experimental Example 4 was used.
- cells MIAPaCa-2 cells, BxPC-3 cells and Capan-1 cells, which are all human pancreatic cancer-derived cells, were used.
- each of 1 ⁇ 10 5 cells is suspended in 100 ⁇ L of phosphate buffered saline (PBS) (hereinafter, may be referred to as “BSA-PBS”) containing 1% by mass of bovine serum albumin (BSA). It became cloudy. Subsequently, 100 ng of nucleic acid-labeled rBC2LCN lectin was added to each cell suspension and reacted at 4 ° C. for 1 hour. Subsequently, each cell was washed 3 times with 1 mL of BSA-PBS and then suspended in 200 ⁇ L of BSA-PBS.
- PBS phosphate buffered saline
- each cell was stained with R-phycoerythrin-labeled rBC2LCN lectin, and flow cytometric analysis was performed.
- Method 2 was primarily different from Method 1 in that the reaction between the nucleic acid-labeled lectin and the cells was performed in OptiMEM medium rather than in BSA-PBS.
- nucleic acid-labeled lectin and cells the same ones as in Method 1 were used. First, each of 1 ⁇ 10 5 cells was suspended in 100 ⁇ L of OptiMEM medium (Thermo Fisher Scientific). Subsequently, 100 ng of nucleic acid-labeled rBC2LCN lectin was added to each cell suspension and reacted at 4 ° C. for 1 hour. Subsequently, each cell was washed 3 times with 1 mL of BSA-PBS and then suspended in 200 ⁇ L of PBS.
- OptiMEM medium Thermo Fisher Scientific
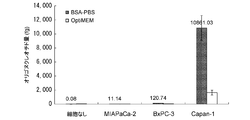
- the supernatant was collected by centrifugation at 15000 rpm for 10 minutes, and the oligonucleotide bound to rBC2LCN lectin was quantified by real-time quantitative PCR.
- FIG. 7A is a graph showing the results of real-time quantitative PCR.
- “BSA-PBS” indicates the result of Method 1
- “OptiMEM” indicates the result of Method 2.
- FIG. 7B is a graph showing the results of flow cytometry analysis.
- the analysis result by real-time quantitative PCR shown in FIG. 7A was in agreement with the result of flow cytometry analysis, and rBC2LCN lectin showed the highest reactivity to Capan-1 cells and also reacted to BxPC-3 cells. It was revealed that it did not react with MIAPaCa-2 cells.
- Example 7 (Examination of nucleic acid release conditions by light irradiation) The conditions for releasing nucleic acid from a nucleic acid-labeled lectin capable of releasing nucleic acid by light irradiation were investigated.
- the nucleic acid-labeled lectin the nucleic acid-labeled rBC2LCN lectin prepared in the same manner as in Experimental Example 5 was used.
- cells Capan-1 cells, which are cells derived from human pancreatic cancer, were used.
- UV ultraviolet
- oligonucleotide was released by irradiation for 5 minutes, 10 minutes or 15 minutes.
- the supernatant was collected by centrifugation at 15,000 rpm for 10 minutes, and the oligonucleotide bound to the rBC2LCN lectin was quantified by real-time quantitative PCR.
- a sample in which the supernatant was recovered by immediate centrifugation without irradiation with ultraviolet rays a sample in which the supernatant was recovered by centrifugation after leaving for 15 minutes at room temperature without irradiation with ultraviolet rays, and 100 ⁇ L of 0.2M fucose were added.
- the nucleic acid-labeled rBC2LCN lectin was released from the cells by reacting at 4 ° C. for 15 minutes, and then the sample was centrifuged to collect the supernatant, and the oligonucleotide bound to the rBC2LCN lectin was quantified by real-time quantitative PCR.
- FIG. 8 is a graph showing the results of real-time quantitative PCR.
- “0 minutes without irradiation” indicates the result of a sample obtained by centrifuging at 15000 rpm for 10 minutes without irradiation for 10 minutes
- “15 minutes without irradiation” means without irradiation with ultraviolet rays. After leaving at room temperature for 15 minutes, the result was obtained by centrifuging at 15000 rpm for 10 minutes to collect the supernatant.
- control 15 minutes 100 ⁇ L of 0.2 M fucose was added and reacted at 4 ° C. for 15 minutes. It represents the result of a sample in which the nucleic acid-labeled rBC2LCN lectin was released from the cells and then centrifuged at 15,000 rpm for 10 minutes to collect the supernatant.
- normal lectins unlabeled lectins
- nucleic acid-labeled lectins were labeled with fluorescein isothiocyanate (FITC) and reacted with cells, and flow cytometric analysis was performed.
- FITC fluorescein isothiocyanate
- GSLII, rABA, rBC2LCN, rLSRN, and SNA were used as the unlabeled lectin.
- nucleic acid-labeled lectin a nucleic acid-labeled substance of the same lectin (GSLII, rABA, rBC2LCN, rLSRN, SNA) prepared in the same manner as in Experimental Example 4 was used.
- cells SUIT-2 cells, AsPC-1 cells, BxPC-3 cells, MIAPaCa-2 cells and Capan-1 cells, which are all human pancreatic cancer-derived cells, were used.
- FIGS. 9A-9E are graphs showing the results of flow cytometry analysis.
- FIG. 9A is the result of SUIT-2 cells
- FIG. 9B is the result of AsPC-1 cells
- FIG. 9C is the result of BxPC-3 cells
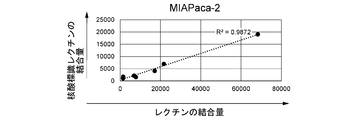
- FIG. 9D is the result of MIAPaCa-2 cells
- the horizontal axis shows the binding amount (average fluorescence intensity) of unlabeled lectins (GSLII, rABA, rBC2LCN, rLSRN, SNA), and the vertical axis shows the nucleic acid-labeled lectins (GSLII, rABA, rBC2LCN,).
- the binding amount (average fluorescence intensity) of rLSRN, SNA) is shown.
- nucleic acid-labeled lectin As the nucleic acid-labeled lectin, a nucleic acid-labeled lectin (GSLII, rABA, rBC2LCN, rLSRN, SNA) prepared in the same manner as in Experimental Example 5 and capable of releasing nucleic acid by light irradiation was used.
- the cells Capan-1 cells, which are cells derived from human pancreatic cancer, were used.
- ⁇ 10 5 cells were suspended in 100 ⁇ L of BSA-PBS and dispensed into a tube. Subsequently, 100 ng of nucleic acid-labeled lectins (GSLII, rABA, rBC2LCN, rLSRN, SNA) were added to each cell suspension and reacted at 4 ° C. for 1 hour. Subsequently, each cell was washed 3 times with 1 mL of BSA-PBS and then suspended in 500 ⁇ L of BSA-PBS.
- GSLII nucleic acid-labeled lectins
- a part of each cell was subjected to flow cytometric analysis, and the remaining part was subjected to real-time quantitative PCR to measure the amount of lectin bound to the cells.
- Real-time quantitative PCR was performed as follows. First, a part of cells is irradiated with ultraviolet rays having a peak wavelength at a wavelength of 365 nm for 15 minutes at 15 W using an ultraviolet (UV) irradiation device (catalog number “95-0042-14”, Funakoshi Co., Ltd.) to obtain an oligonucleotide. Was released. Subsequently, the supernatant was collected by centrifugation at 15,000 rpm for 10 minutes, and the liberated oligonucleotide was quantified by real-time quantitative PCR.
- UV ultraviolet
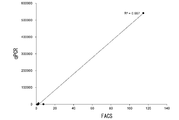
- FIG. 10 is a graph showing the results of flow cytometry analysis and real-time quantitative PCR.
- qPCR represents the result of real-time quantitative PCR (amount of oligonucleotide)
- FACS represents the result of flow cytometry analysis (average fluorescence intensity).
- Capan-1 cells were suspended in 100 ⁇ L of BSA-PBS and dispensed into tubes. Subsequently, 100 ng of each FITC-labeled lectin was added to the cell suspension and reacted at 4 ° C. for 1 hour. Subsequently, each cell was washed 3 times with 1 mL of BSA-PBS and then suspended in 200 ⁇ L of BSA-PBS. Subsequently, each cell was subjected to flow cytometric analysis, and the amount of each lectin bound to the cell was measured.
- Capan-1 cells were suspended in 100 ⁇ L of BSA-PBS and dispensed into a tube. Subsequently, 100 ng of each nucleic acid-labeled lectin was added to the cell suspension and reacted at 4 ° C. for 1 hour. Subsequently, each cell was washed 3 times with 1 mL of BSA-PBS and then suspended in 500 ⁇ L of BSA-PBS.
- each cell is irradiated with ultraviolet rays having a peak wavelength at a wavelength of 365 nm for 15 minutes at 15 W using an ultraviolet (UV) irradiation device (catalog number “95-0042-14”, Funakoshi Co., Ltd.) to irradiate the oligonucleotide. It was released. Subsequently, the supernatant was collected by centrifugation at 15,000 rpm for 10 minutes, and the liberated oligonucleotides were quantified by real-time quantitative PCR.
- UV ultraviolet
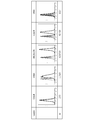
- FIG. 11A is a graph showing the results of flow cytometry analysis.
- MFI indicates the average value of the measured fluorescence intensities.
- FIG. 11B is a graph showing the results of real-time quantitative PCR.
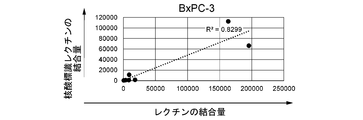
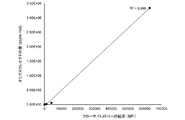
- FIG. 12 is a graph showing the results of flow cytometry analysis on the horizontal axis and the results of real-time quantitative PCR on the vertical axis based on the results of FIGS. 11A and 11B.
- nucleic acid-labeled lectin a nucleic acid-labeled rBC2LCN lectin prepared in the same manner as in Experimental Example 5 capable of releasing nucleic acid by light irradiation was used.
- cells Capan-1 cells, which are cells derived from human pancreatic cancer, were used.
- Capan-1 cells were suspended in 100 ⁇ L of BSA-PBS and placed in a tube. Subsequently, 100 ng of nucleic acid-labeled rBC2LCN lectin was added to each cell suspension and reacted at 4 ° C. for 1 hour. Subsequently, each cell was washed 3 times with 1 mL of BSA-PBS and then suspended in 200 ⁇ L of BSA-PBS.
- each cell is irradiated with ultraviolet rays having a peak wavelength at a wavelength of 365 nm for 15 minutes at 15 W using an ultraviolet (UV) irradiation device (catalog number “95-0042-14”, Funakoshi Co., Ltd.) to irradiate the oligonucleotide. It was released. Subsequently, the supernatant was collected by centrifugation at 15,000 rpm for 10 minutes, and the liberated oligonucleotides were quantified by real-time quantitative PCR.
- UV ultraviolet
- FIG. 13 is a graph showing the results of real-time quantitative PCR.
- control is the result of a sample in which a series of reactions were carried out without adding the nucleic acid-labeled rBC2LCN lectin.
- binding of the lectin can be analyzed even for one cell by reacting the nucleic acid-labeled lectin with the cell and detecting the nucleic acid bound to the nucleic acid-labeled lectin.
- nucleic acid-labeled lectin examples include nucleic acid-labeled lectins (SNA, ConA, GSLII, rBC2LCN, rAAL, rABA, rLSRN, rPSL1a, rDiscoidinI, rF17AG, rPVL, rCGL2, rPAIL, rPPL, rRSIIL, prepared in the same manner as in Experimental Example 4.
- the cells include Capan-1 cells, BxPC-3 cells, PANC-1 cells, AsPC1 cells, which are human pancreatic cancer-derived cells, and Lec1, Rec2, and Lec8, which are mutant cells of CHO cells and CHO cells. Using.
- UV ultraviolet
- a PCR reaction was carried out using this as a template, and analysis was performed with a next-generation sequencer.
- PCR was performed with I5index primer (SEQ ID NO: 75) and I7index primer (SEQ ID NO: 76), and the amplified PCR product was purified and concentrated. ) Confirmed. Subsequently, the nucleotide sequences of the nucleic acids labeled with the nucleic acid-labeled lectin bound to each cell are sequenced using a next-generation sequencer (product name "MiSeq", Illumina), and the number of reads of the detected nucleotide sequences is totaled. bottom.
- nnnnnnnnn in SEQ ID NOs: 75 and 76 (where “n” represents “a”, “t”, “g” or “c") has a different sequence for each cell, and the cell has a different sequence. Used for identification.
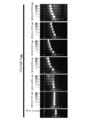
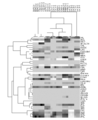
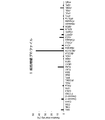
- FIG. 14 is a diagram showing the results of cluster analysis using the number of reads of the base sequence of the nucleic acid labeled on each lectin.
- the binding of the lectin to the cells can be analyzed by reacting 10,000 cells with the nucleic acid-labeled lectin and sequencing the nucleic acid bound to the nucleic acid-labeled lectin with a next-generation sequencer. rice field. Furthermore, it was clarified that the reaction pattern with the lectin was different in each cell.
- nucleic acid-labeled lectin 6 (Examination of reactivity of nucleic acid-labeled lectin 6) A mixture of multiple nucleic acid-labeled lectins was reacted with 10,000 cells and one cell, respectively, and their binding was analyzed using a next-generation sequencer.
- nucleic acid-labeled lectin examples include nucleic acid-labeled lectins (SNA, ConA, GSLII, rBC2LCN, rAAL, rABA, rLSRN, rPSL1a, rDiscoidinI, rF17AG, rPVL, rCGL2, rPAIL, rPPL, rRSIIL, prepared in the same manner as in Experimental Example 4.
- rCNL WFA, HPA, SSA, rOrysata, rPALa, rDiscoidinII, CSA, rGRFT, rSRL, rAOL, rBana, rBC2LA, rC14, rCalsepa, rGal3C, rGC2, rMlectin (PODXL) antibody was used.
- 201B7 which is a human iPS cell line was used as a cell.
- 100,000 human iPS cells were suspended in 100 ⁇ L of BSA-PBS and dispensed into a tube. Subsequently, 0.5 ng of each nucleic acid-labeled lectin was added to the cell suspension, and the mixture was reacted at 4 ° C. for 1 hour. Subsequently, the cells were washed 3 times with 1 mL of BSA-PBS and then suspended in 200 ⁇ L of BSA-PBS.
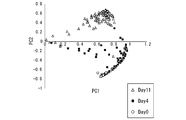
- FIG. 15 is a graph showing the results of principal component analysis of the obtained number of reads.
- PC1 indicates Principle component 1 (main component 1)
- PC2 indicates Principle component 2 (main component 2).
- black circles indicate the results of analysis at the level of one cell
- white circles indicate the results of analysis at the level of 10,000 cells.
- the binding of the lectin to the cell can be analyzed at the cell level by reacting the cell with a mixture of the nucleic acid-labeled lectin and sequencing the nucleic acid bound to the nucleic acid-labeled lectin with a next-generation sequencer. It became. Moreover, although the analysis result at the cell level was similar to the analysis result of 10,000 cells, it was clarified that the cell population had a considerably heterogeneous sugar chain.
- nucleic acid-labeled lectin examples include nucleic acid-labeled lectins (rBC2LCN, rAAL, rABA, rLSRN, rPSL1a, rDiscoidinI, rF17AG, rPVL, rCGL2, rPAIL, rPPL, rRSIIL, rCNL, WFA, HPA, etc., prepared in the same manner as in Experimental Example 4.
- SSA, rOrysata, rPALa, rDiscoidinII were used.
- microorganisms Escherichia coli, Deinococcus radiodurance, and budding yeast (Saccharomyces cerevisiae) were used.
- nucleotide sequences of the nucleic acids labeled with the nucleic acid-labeled lectin bound to each microorganism were sequenced using a next-generation sequencer (product name "MiSeq", Illumina). , The number of reads of the detected base sequence was totaled. The sequence was performed three times independently for each microorganism.
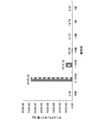
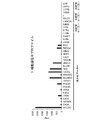
- FIG. 16 is a graph showing the number of reads of the base sequence of the nucleic acid labeled on each lectin.
- E. coli indicates Escherichia coli
- D. radio indicates Deinococcus radiodurance
- S. cerev indicates Saccharomyces cerevisiae.
- the binding of the lectin to the microorganism can be analyzed at the level of one microorganism by reacting the cells of the microorganism with the nucleic acid-labeled lectin and sequencing the nucleic acid bound to the nucleic acid-labeled lectin with a next-generation sequencer. It became.
- nucleic acid-labeled lectin examples include nucleic acid-labeled lectins (SNA, ConA, GSLII, rBC2LCN, rAAL, rABA, rLSRN, rPSL1a, rDiscoidinI, rF17AG, rPVL, rCGL2, rPAIL, rPPL, rRSIIL, prepared in the same manner as in Experimental Example 4.
- rCNL WFA, HPA, SSA, rOrysata, rPALa, rDiscoidinII, CSA, rGRFT, rSRL, rAOL, rBana, rBC2LA, rC14, rCalsepa, rGal3C, rGC2, rMlectin (PODXL) antibody was used.
- FIGS. 17A and 17B are graphs showing the results of principal component analysis of the obtained number of reads.
- "PC1" indicates Principle component 1 (main component 1)
- "PC2” indicates Principle component 2 (main component 2).
- Day 0" indicates that it is the result of iPS cells before differentiation induction
- Day 4" indicates that it is the result of iPS cells 4 days after differentiation induction
- Day 7 indicates that it is the result of iPS cells 7 days after differentiation induction. Shows that it is the result of iPS cells in the eye.
- the binding of the lectin to the cell can be analyzed at the cell level by reacting the cell with a mixture of the nucleic acid-labeled lectin and sequencing the nucleic acid bound to the nucleic acid-labeled lectin with a next-generation sequencer. It became. Moreover, although the analysis result at the cell level was similar to the analysis result of 10,000 cells, it was clarified that the cell population had a considerably heterogeneous sugar chain.
- This result further supports the ability to analyze the sugar chains of individual cells that make up the cell population at the level of one cell.
- Example 16 (Analysis of sugar chains on the surface of cells and RNA in cells at the cell level 1) 100,000 human iPS cell 201B7 strains were suspended in 100 ⁇ L of BSA-PBS and dispensed into tubes. Subsequently, 0.5 ng of each nucleic acid-labeled lectin was added to the cell suspension, and the mixture was reacted at 4 ° C. for 1 hour. Subsequently, the cells were washed 3 times with 1 mL of BSA-PBS and then suspended in 200 ⁇ L of BSA-PBS.
- UV ultraviolet
- a PCR reaction was carried out using this as a template, and analysis was performed with a next-generation sequencer.
- a cDNA library was prepared from the total RNA of one cell precipitated after centrifugation using GenNext (R) RamDA-seq (TM) Single Cell Kit (Toyobo Co., Ltd.).
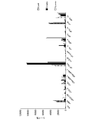
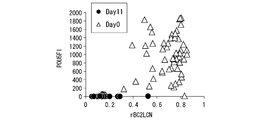
- FIGS. 18A and 18B are graphs showing typical results of analysis of sugar chains on the surface of cells and RNA in cells at the cell level.
- FIG. 18A is the result of the sugar chain profile
- FIG. 18B is the result of the gene profile.
- the vertical axis indicates the signal intensity (relative value)
- the horizontal axis indicates the type of lectin.
- the vertical axis indicates TPM (Transcripts Per Million)
- the horizontal axis indicates the gene name of each marker gene of undifferentiated marker, inner lung lobe marker, mesoderm marker, and ectoderm marker.
- RNA information as well as sugar chain information on the cell surface can be obtained from one cell.
- a human iPS cell 201B7 strain was used in a commercially available kit (product name "STEMdiff SMADi Natural Invention Kit, 2 pack", catalog number “# 08582", Stem Cell Technologies, Inc.) to ectoderm (nerve). And the cells were collected on the 0th and 11th days.
- nucleic acid-labeled lectins examples include nucleic acid-labeled lectins (SNA, ConA, GSLII, rBC2LCN, rAAL, rABA, rLSRN, rPSL1a, rDiscoidinI, rF17AG, rPVL, rCGL2, rPAIL, rPPL, rRSIIL, prepared in the same manner as in Experimental Example 4.
- rCNL WFA, HPA, SSA, rOrysata, rPALa, rDiscoidinII, CSA, rGRFT, rSRL, rAOL, rBana, rBC2LA, rC14, rCalsepa, rGal3C, rGC2, rMlectin (PODXL) antibody was used.
- Each cell was suspended in 100 ⁇ L of BSA-PBS and dispensed into a tube. Subsequently, 0.5 ng of each nucleic acid-labeled lectin was added to the cell suspension, and the mixture was reacted at 4 ° C. for 1 hour. Subsequently, the cells were washed 3 times with 1 mL of BSA-PBS and then suspended in 200 ⁇ L of BSA-PBS.
- the cells are dispensed one by one, and using an ultraviolet (UV) irradiator (catalog number "95-0042-14", Funakoshi Co., Ltd.), ultraviolet rays having a peak wavelength at a wavelength of 365 nm are applied at 15 W for 15 minutes.
- Irradiation was performed to release the oligonucleotide from the nucleic acid-labeled lectin, and the supernatant was collected after centrifugation.
- a PCR reaction was carried out using the collected supernatant as a template, sequenced using a next-generation sequencer (product name "MiSeq", Illumina), and the number of reads of the detected base sequence was totaled.
- a cDNA library was prepared from the total RNA of one cell precipitated after centrifugation using GenNext (R) RamDA-seq (TM) Single Cell Kit (Toyobo Co., Ltd.).
- HISAT2 v2.1.0 http://daehwankimlab.github.io/hisat2/.
- Mapping to the genome was performed using Bowtie2 2.3.5.1 (https://sourceforge.net/projects/bowtie-bio/files/bowtie2/2.3.5.1/).
- mapping to a transcript was performed using StringTie v1.3.4d (https://ccb.jhu.edu/software/stringtie/).
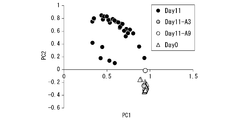
- FIG. 19A is a graph showing the results of principal component analysis of the obtained sugar chain profile. As a result, it was clarified that the heterogeneity of the sugar chain profile was increased in the cells on the 11th day after the induction of differentiation as compared with the 0th day.
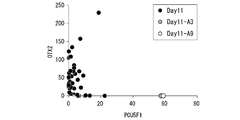
- the expression of the nerve differentiation marker OTX2 gene and the undifferentiated marker POU5F1 gene was confirmed in each of the cells of Day11-A3 and Day11-A9 showing the sugar chain profile close to the 0th day.
- FIG. 19B is a graph showing the results of analyzing the expression level of each marker gene. As a result, it was clarified that the expression of the neural differentiation marker was low and the expression of the undifferentiated marker was high in each of the cells of Day11-A3 and Day11-A9. That is, it was clarified that these cells were in an undifferentiated state without being induced to differentiate even on the 11th day after the induction of ectoderm (nerve) differentiation.
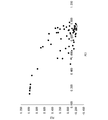
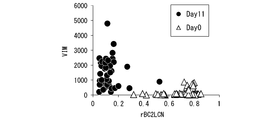
- FIG. 20A shows the results of calculating the correlation coefficient between the amount of rBC2LCN lectin that specifically binds to human iPS cells to each cell and the expression level of 27,686 gene clusters, and arranging them in descending order of numerical value. It is a graph.
- FIG. 20B is a scatter plot showing the amount of rBC2LCN lectin bound to each cell and the expression level of the undifferentiated marker POU5F1 gene.
- FIG. 20C is a scatter plot showing the amount of rBC2LCN lectin bound to each cell and the expression level of the nerve differentiation marker VIM gene.
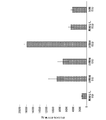
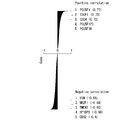
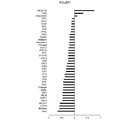
- FIG. 21A is a diagram in which the correlation coefficient between the expression level of the undifferentiated marker POU5F1 gene in each cell and the binding amount of 39 types of lectins was calculated and arranged in descending order.
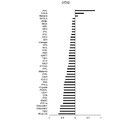
- FIG. 21B is a diagram in which the correlation coefficient between the expression level of the nerve differentiation marker OTX2 gene in each cell and the binding amount of 39 types of lectins was calculated and arranged in descending order.
- the lectin showing the highest positive correlation coefficient with the expression level of the undifferentiated marker POU5F1 gene was rBC2LCN.
- the lectin showing the highest positive correlation coefficient with the expression level of the neural differentiation marker OTX2 gene is rAAL. That is, it was considered that rAAL may exhibit significantly higher reactivity to nerve cells after induction of differentiation than human iPS cells.
- sugar chains and genes expressed in heterogeneous and diverse cell populations can be simultaneously measured at the 1-cell level by the method of this experimental example, and further expressed at the 1-cell level from the obtained data. It was shown that the relationship between sugar chains and genes can be clarified.
Landscapes
- Health & Medical Sciences (AREA)
- Life Sciences & Earth Sciences (AREA)
- Chemical & Material Sciences (AREA)
- Engineering & Computer Science (AREA)
- Immunology (AREA)
- Molecular Biology (AREA)
- Biomedical Technology (AREA)
- Hematology (AREA)
- Urology & Nephrology (AREA)
- Analytical Chemistry (AREA)
- Biotechnology (AREA)
- General Health & Medical Sciences (AREA)
- Microbiology (AREA)
- Biochemistry (AREA)
- Physics & Mathematics (AREA)
- Organic Chemistry (AREA)
- Medicinal Chemistry (AREA)
- Food Science & Technology (AREA)
- Cell Biology (AREA)
- General Physics & Mathematics (AREA)
- Pathology (AREA)
- Proteomics, Peptides & Aminoacids (AREA)
- Chemical Kinetics & Catalysis (AREA)
- Wood Science & Technology (AREA)
- Zoology (AREA)
- Tropical Medicine & Parasitology (AREA)
- Biophysics (AREA)
- Bioinformatics & Cheminformatics (AREA)
- General Engineering & Computer Science (AREA)
- Genetics & Genomics (AREA)
- Measuring Or Testing Involving Enzymes Or Micro-Organisms (AREA)
Priority Applications (1)
| Application Number | Priority Date | Filing Date | Title |
|---|---|---|---|
| US17/913,698 US20230117360A1 (en) | 2020-03-24 | 2021-03-15 | Method for analyzing sugar chain |
Applications Claiming Priority (2)
| Application Number | Priority Date | Filing Date | Title |
|---|---|---|---|
| JP2020-053296 | 2020-03-24 | ||
| JP2020053296A JP7445966B2 (ja) | 2020-03-24 | 2020-03-24 | 糖鎖を解析する方法 |
Publications (1)
| Publication Number | Publication Date |
|---|---|
| WO2021193199A1 true WO2021193199A1 (ja) | 2021-09-30 |
Family
ID=77886263
Family Applications (1)
| Application Number | Title | Priority Date | Filing Date |
|---|---|---|---|
| PCT/JP2021/010385 Ceased WO2021193199A1 (ja) | 2020-03-24 | 2021-03-15 | 糖鎖を解析する方法 |
Country Status (3)
| Country | Link |
|---|---|
| US (1) | US20230117360A1 (enExample) |
| JP (1) | JP7445966B2 (enExample) |
| WO (1) | WO2021193199A1 (enExample) |
Cited By (1)
| Publication number | Priority date | Publication date | Assignee | Title |
|---|---|---|---|---|
| WO2024048644A1 (ja) * | 2022-08-30 | 2024-03-07 | 国立大学法人東京大学 | 担体、複合体、医薬組成物、及び診断薬 |
Families Citing this family (2)
| Publication number | Priority date | Publication date | Assignee | Title |
|---|---|---|---|---|
| WO2025169902A1 (ja) * | 2024-02-05 | 2025-08-14 | 国立研究開発法人産業技術総合研究所 | 神経細胞集団に残存する未分化細胞を検出または除去する方法 |
| WO2025242912A1 (en) * | 2024-05-23 | 2025-11-27 | Institut National de la Santé et de la Recherche Médicale | Conjugates for mass spectrometry imaging |
Citations (5)
| Publication number | Priority date | Publication date | Assignee | Title |
|---|---|---|---|---|
| JP2008187932A (ja) * | 2007-02-02 | 2008-08-21 | National Institute Of Advanced Industrial & Technology | 生細胞表層分子解析方法及び部材 |
| JP2009219388A (ja) * | 2008-03-14 | 2009-10-01 | Jsr Corp | イムノpcr用磁性粒子、標的物質の検出方法、および標的物質の検出キット |
| JP2017507656A (ja) * | 2014-02-26 | 2017-03-23 | ヴェンタナ メディカル システムズ, インク. | 生物学的試料分析のための光選択的方法 |
| WO2017061449A1 (ja) * | 2015-10-05 | 2017-04-13 | 国立研究開発法人産業技術総合研究所 | がん細胞の検出方法、がん細胞内に物質を導入するための試薬、及びがん治療用組成物 |
| JP2020503893A (ja) * | 2016-12-30 | 2020-02-06 | ブリンク アーゲー | 分析物の検出を行うための予め製作された微粒子 |
Family Cites Families (2)
| Publication number | Priority date | Publication date | Assignee | Title |
|---|---|---|---|---|
| KR102556494B1 (ko) * | 2017-10-31 | 2023-07-18 | 엔코디아, 인코포레이티드 | 핵산 암호화 및/또는 표지를 이용한 분석용 키트 |
| US11561359B2 (en) * | 2018-02-09 | 2023-01-24 | Carl Zeiss Meditec Ag | Balancing device for rotary apparatus |
-
2020
- 2020-03-24 JP JP2020053296A patent/JP7445966B2/ja active Active
-
2021
- 2021-03-15 US US17/913,698 patent/US20230117360A1/en active Pending
- 2021-03-15 WO PCT/JP2021/010385 patent/WO2021193199A1/ja not_active Ceased
Patent Citations (5)
| Publication number | Priority date | Publication date | Assignee | Title |
|---|---|---|---|---|
| JP2008187932A (ja) * | 2007-02-02 | 2008-08-21 | National Institute Of Advanced Industrial & Technology | 生細胞表層分子解析方法及び部材 |
| JP2009219388A (ja) * | 2008-03-14 | 2009-10-01 | Jsr Corp | イムノpcr用磁性粒子、標的物質の検出方法、および標的物質の検出キット |
| JP2017507656A (ja) * | 2014-02-26 | 2017-03-23 | ヴェンタナ メディカル システムズ, インク. | 生物学的試料分析のための光選択的方法 |
| WO2017061449A1 (ja) * | 2015-10-05 | 2017-04-13 | 国立研究開発法人産業技術総合研究所 | がん細胞の検出方法、がん細胞内に物質を導入するための試薬、及びがん治療用組成物 |
| JP2020503893A (ja) * | 2016-12-30 | 2020-02-06 | ブリンク アーゲー | 分析物の検出を行うための予め製作された微粒子 |
Non-Patent Citations (5)
| Title |
|---|
| ANONYMOUS: "Fluorescent label rBC2LCN", FUJIFILM, 28 January 2019 (2019-01-28), XP055861426, Retrieved from the Internet <URL:https://labchem-wako.fujifilm.com/jp/category/00571.html> [retrieved on 20210510] * |
| FENG YIMEI; GUO YUNA; LI YIRAN; TAO JING; DING LIN; WU JIE; JU HUANGXIAN: "Lectin-mediated in situ rolling circle amplification on exosomes for probing cancer-related glycan pattern", ANALYTICA CHIMICA ACTA, ELSEVIER, AMSTERDAM, NL, vol. 1039, 19 July 2018 (2018-07-19), AMSTERDAM, NL , pages 108 - 115, XP085505074, ISSN: 0003-2670, DOI: 10.1016/j.aca.2018.07.040 * |
| HIRABAYASHI, J. ET AL.: "Glycomics, Coming of Age!", TRENDS IN GLYCOSCIENCE AND GLYCOTECHNOLOGY, vol. 12, no. 63, 2000, pages 1 - 5, XP055861424 * |
| MISEVIC, G. N. ET AL.: "New Nanotechnology Applications in Single Cell Analysis: Why and How?", EXPRESSION PROFILING IN NEUROSCIENCE, vol. 64, 2012, pages 271 - 281 * |
| TATENO HIROAKI: "Development of sugar chain profiling technique and application to regenerative medicine and drug develpoment", BIOSCIENCE AND INDUSTRY AWARD-WINNING ACHIEVEMENTS OF BIOINDUSTRY RESEARCH AWARD, vol. 77, 2019, pages 326 - 327 * |
Cited By (1)
| Publication number | Priority date | Publication date | Assignee | Title |
|---|---|---|---|---|
| WO2024048644A1 (ja) * | 2022-08-30 | 2024-03-07 | 国立大学法人東京大学 | 担体、複合体、医薬組成物、及び診断薬 |
Also Published As
| Publication number | Publication date |
|---|---|
| US20230117360A1 (en) | 2023-04-20 |
| JP2021151206A (ja) | 2021-09-30 |
| JP7445966B2 (ja) | 2024-03-08 |
Similar Documents
| Publication | Publication Date | Title |
|---|---|---|
| CN107636162B (zh) | 用针对特定群体的抗原筛选t细胞的组合物和方法 | |
| WO2021193199A1 (ja) | 糖鎖を解析する方法 | |
| AU759785B2 (en) | A process to study changes in gene expression in T lymphocytes | |
| CN102858995A (zh) | 靶向测序方法 | |
| EP3998338B1 (en) | Method for amplifying nucleic acid using solid-phase carrier | |
| AU2009202745A1 (en) | Analysis of methylated nucleic acid | |
| JP7212720B2 (ja) | 高精度シーケンシング方法 | |
| US20190161794A1 (en) | Methods for removal of adaptor dimers from nucleic acid sequencing preparations | |
| CN113046385A (zh) | 液态酵母单双杂高通量筛库方法及其应用 | |
| JP2022174242A (ja) | 標的核酸の検出方法 | |
| Southard et al. | Comprehensive transcription factor perturbations recapitulate fibroblast transcriptional states | |
| CA2267642A1 (en) | Methods for detecting mutation in base sequence | |
| CN110229846A (zh) | 用于转基因水稻筛查的通用阳性标准质粒及其构建方法 | |
| CN104088019A (zh) | 一种基于双分子荧光互补技术的肽适配子文库构建方法 | |
| EP4512896A1 (en) | Method and kit for identifying multifactorial interaction in biological sample | |
| EP4353836B1 (en) | Highly accurate sequencing method | |
| US20200347448A1 (en) | Functional metagenomics | |
| US20220034881A1 (en) | Barcoded peptide-mhc complexes and uses thereof | |
| CN116472052A (zh) | 阵列肽新表位生成器 | |
| Kato | Adaptor-tagged competitive PCR: study of the mammalian nervous system | |
| WO2025207407A1 (en) | Programmable enrichment via rna fish for single-cell rna analysis | |
| AU2011203953B2 (en) | Analysis of methylated nucleic acid | |
| KR20110002277A (ko) | 우점종 제거 기술에 기반한 희소 미생물 또는 신규 미생물의 단일 세포 유래 게놈 라이브러리의 제조방법 | |
| Rinehart et al. | CONCEPTS All living organisms contain DNA that can be assayed by a variety of methods to answer important questions about plant pathology, such as relatedness, phylogeny, and pathogen identity, among others. DNA fingerprinting techniques, such as DAF, RAPD, and AFLP, utilize arbitrary priming and do not require prior knowledge of the plant pathogen genome, and are useful for investigations of diseases of unknown etiology. SSR and SNP methods rely on DNA sequence data and provide more detailed information, including the potential to detect specific pathogens using PCR amplification. | |
| Berns | Isolation of calf lens messenger RNA and its translation in heterologous systems |
Legal Events
| Date | Code | Title | Description |
|---|---|---|---|
| 121 | Ep: the epo has been informed by wipo that ep was designated in this application |
Ref document number: 21777061 Country of ref document: EP Kind code of ref document: A1 |
|
| NENP | Non-entry into the national phase |
Ref country code: DE |
|
| 122 | Ep: pct application non-entry in european phase |
Ref document number: 21777061 Country of ref document: EP Kind code of ref document: A1 |
|
| 122 | Ep: pct application non-entry in european phase |
Ref document number: 21777061 Country of ref document: EP Kind code of ref document: A1 |