WO2021186711A1 - 意識喪失推定装置、意識喪失推定方法及びプログラム - Google Patents
意識喪失推定装置、意識喪失推定方法及びプログラム Download PDFInfo
- Publication number
- WO2021186711A1 WO2021186711A1 PCT/JP2020/012440 JP2020012440W WO2021186711A1 WO 2021186711 A1 WO2021186711 A1 WO 2021186711A1 JP 2020012440 W JP2020012440 W JP 2020012440W WO 2021186711 A1 WO2021186711 A1 WO 2021186711A1
- Authority
- WO
- WIPO (PCT)
- Prior art keywords
- estimation
- probability
- unconsciousness
- unit
- blood flow
- Prior art date
Links
Images


Classifications
-
- A—HUMAN NECESSITIES
- A61—MEDICAL OR VETERINARY SCIENCE; HYGIENE
- A61B—DIAGNOSIS; SURGERY; IDENTIFICATION
- A61B5/00—Measuring for diagnostic purposes; Identification of persons
- A61B5/24—Detecting, measuring or recording bioelectric or biomagnetic signals of the body or parts thereof
- A61B5/316—Modalities, i.e. specific diagnostic methods
- A61B5/318—Heart-related electrical modalities, e.g. electrocardiography [ECG]
- A61B5/346—Analysis of electrocardiograms
- A61B5/349—Detecting specific parameters of the electrocardiograph cycle
- A61B5/352—Detecting R peaks, e.g. for synchronising diagnostic apparatus; Estimating R-R interval
-
- A—HUMAN NECESSITIES
- A61—MEDICAL OR VETERINARY SCIENCE; HYGIENE
- A61B—DIAGNOSIS; SURGERY; IDENTIFICATION
- A61B5/00—Measuring for diagnostic purposes; Identification of persons
- A61B5/48—Other medical applications
- A61B5/4806—Sleep evaluation
- A61B5/4809—Sleep detection, i.e. determining whether a subject is asleep or not
-
- A—HUMAN NECESSITIES
- A61—MEDICAL OR VETERINARY SCIENCE; HYGIENE
- A61B—DIAGNOSIS; SURGERY; IDENTIFICATION
- A61B5/00—Measuring for diagnostic purposes; Identification of persons
- A61B5/02—Detecting, measuring or recording pulse, heart rate, blood pressure or blood flow; Combined pulse/heart-rate/blood pressure determination; Evaluating a cardiovascular condition not otherwise provided for, e.g. using combinations of techniques provided for in this group with electrocardiography or electroauscultation; Heart catheters for measuring blood pressure
- A61B5/026—Measuring blood flow
-
- A—HUMAN NECESSITIES
- A61—MEDICAL OR VETERINARY SCIENCE; HYGIENE
- A61B—DIAGNOSIS; SURGERY; IDENTIFICATION
- A61B5/00—Measuring for diagnostic purposes; Identification of persons
- A61B5/24—Detecting, measuring or recording bioelectric or biomagnetic signals of the body or parts thereof
- A61B5/316—Modalities, i.e. specific diagnostic methods
- A61B5/318—Heart-related electrical modalities, e.g. electrocardiography [ECG]
- A61B5/346—Analysis of electrocardiograms
- A61B5/349—Detecting specific parameters of the electrocardiograph cycle
- A61B5/363—Detecting tachycardia or bradycardia
-
- A—HUMAN NECESSITIES
- A61—MEDICAL OR VETERINARY SCIENCE; HYGIENE
- A61B—DIAGNOSIS; SURGERY; IDENTIFICATION
- A61B5/00—Measuring for diagnostic purposes; Identification of persons
- A61B5/24—Detecting, measuring or recording bioelectric or biomagnetic signals of the body or parts thereof
- A61B5/316—Modalities, i.e. specific diagnostic methods
- A61B5/318—Heart-related electrical modalities, e.g. electrocardiography [ECG]
- A61B5/346—Analysis of electrocardiograms
- A61B5/349—Detecting specific parameters of the electrocardiograph cycle
- A61B5/364—Detecting abnormal ECG interval, e.g. extrasystoles, ectopic heartbeats
-
- A—HUMAN NECESSITIES
- A61—MEDICAL OR VETERINARY SCIENCE; HYGIENE
- A61B—DIAGNOSIS; SURGERY; IDENTIFICATION
- A61B5/00—Measuring for diagnostic purposes; Identification of persons
- A61B5/72—Signal processing specially adapted for physiological signals or for diagnostic purposes
- A61B5/7221—Determining signal validity, reliability or quality
-
- A—HUMAN NECESSITIES
- A61—MEDICAL OR VETERINARY SCIENCE; HYGIENE
- A61B—DIAGNOSIS; SURGERY; IDENTIFICATION
- A61B5/00—Measuring for diagnostic purposes; Identification of persons
- A61B5/72—Signal processing specially adapted for physiological signals or for diagnostic purposes
- A61B5/7271—Specific aspects of physiological measurement analysis
- A61B5/7275—Determining trends in physiological measurement data; Predicting development of a medical condition based on physiological measurements, e.g. determining a risk factor
-
- A—HUMAN NECESSITIES
- A61—MEDICAL OR VETERINARY SCIENCE; HYGIENE
- A61B—DIAGNOSIS; SURGERY; IDENTIFICATION
- A61B5/00—Measuring for diagnostic purposes; Identification of persons
- A61B5/08—Detecting, measuring or recording devices for evaluating the respiratory organs
Definitions
- the present invention relates to a consciousness loss estimation device, a consciousness loss estimation method and a program.
- Non-Patent Document 1 Unintentional loss of consciousness during work is dangerous for both the person and those around him. For example, if the driver loses consciousness while driving, the passengers including the driver and the people around the car are at risk (Non-Patent Document 1).
- loss of consciousness If the person or others around him / her can know that the possibility of loss of consciousness is increasing before such loss of consciousness (hereinafter referred to as “loss of consciousness”) occurs, the risk caused by the loss of consciousness is increased. Can be reduced. Therefore, it is required to improve the accuracy of estimating the possibility of loss of consciousness.
- an object of the present invention is to provide a technique for improving the accuracy of estimating the possibility of loss of consciousness.
- One aspect of the present invention is based on a time series of cerebral blood flow correlation amount, which is a time series of amounts that correlate with the cerebral blood flow of the estimation target, and whether or not the state of the ventricle of the estimation target is normal is determined in a predetermined repetition cycle.
- It is a consciousness loss estimation device including a consciousness loss probability acquisition unit for acquiring the lost consciousness probability.
- the second explanatory diagram explaining the relationship between the probability of unconsciousness and the cerebral blood flow correlation amount time series in the first embodiment.
- the third explanatory diagram explaining the relationship between the probability of unconsciousness and the cerebral blood flow correlation amount time series in the first embodiment.
- the fourth explanatory diagram explaining the relationship between the probability of unconsciousness and the cerebral blood flow correlation amount time series in the first embodiment.
- a second flowchart showing an example of the flow of processing executed by the unconsciousness estimation system 100a of the second embodiment The figure which shows an example of the system configuration of the unconsciousness estimation system 100b of 3rd Embodiment. The figure which shows an example of the functional structure of the control part 20b in 3rd Embodiment. The figure which shows an example of the system configuration of the unconsciousness estimation system 100c of 4th Embodiment. The figure which shows an example of the functional structure of the control part 20c in 4th Embodiment. The figure which shows an example of the system configuration of the unconsciousness estimation system 100d of 5th Embodiment. The figure which shows an example of the functional structure of the control part 20d in 5th Embodiment.
- FIG. 3 is a third diagram showing the correspondence between the electrocardiographic time series and the model waveform in the third modification.
- FIG. 4 is a fourth diagram showing the correspondence between the electrocardiographic time series and the model waveform in the third modification.
- the first figure which shows the correspondence between the aortic blood flow time series and the model waveform in the 3rd modification.
- the second figure which shows the correspondence between the aortic blood flow time series and the model waveform in the 3rd modification.
- FIG. 1 is an explanatory diagram illustrating an outline of the unconsciousness estimation system 100 of the first embodiment.
- the unconsciousness estimation system 100 estimates the probability that the estimation target 901 is already unconscious.
- the estimation target 901 may be a human or an animal.
- the unconsciousness estimation system 100 will be described by taking the case where the estimation target 901 is a person as an example.
- the unconsciousness estimation system 100 includes a biosensor 1.
- the biological sensor 1 measures an amount that correlates with the cerebral blood flow of the estimation target 901 that is the measurement target (hereinafter referred to as “cerebral blood flow correlation amount”).
- the unconsciousness estimation system 100 acquires a time series of the cerebral blood flow correlation amount of the estimation target 901 (hereinafter referred to as “cerebral blood flow correlation amount time series”) using the biological sensor 1. Details of the biosensor 1 will be described later.
- the cerebral blood flow correlation amount may be any amount as long as it has a correlation with the cerebral blood flow amount of the estimation target 901.
- the cerebral blood flow correlation amount may be, for example, an amount indicating the state of electrical activity of the heart.
- the quantity indicating the state of electrical activity of the heart is, for example, the time change of the electric potential (electric potential) shown by the graph of the electrocardiogram. That is, the quantity indicating the state of electrical activity of the heart is a time series of electrocardiographic potential (hereinafter referred to as "electrocardiographic time series").
- electrocardiographic time series is an electrocardiogram graph.
- the cerebral blood flow correlation amount may be, for example, the blood flow amount of the carotid artery or the aorta.
- the cerebral blood flow correlation time series is the time series of aortic blood flow.
- the unconsciousness estimation system 100 will be described by taking as an example the case where the cerebral blood flow correlation amount time series is the electrocardiographic time series.
- the brain of the estimation target 901 After the unconsciousness estimation system 100 starts acquiring the cerebral blood flow correlation amount time series of the estimation target 901 at a predetermined timing, the brain of the estimation target 901 has a predetermined repetition cycle (hereinafter referred to as "estimation cycle").
- the blood flow correlation amount time series is repeatedly acquired.
- the time point at which the process of repeatedly acquiring the cerebral blood flow correlation amount time series of the estimation target 901 in the estimation cycle is started is referred to as the estimation start time point.
- the period from the acquisition of the cerebral blood flow correlation amount time series to the next acquisition of the cerebral blood flow correlation amount time series is referred to as a unit period.
- the unconsciousness loss estimation system 100 executes the out-of-range data determination process and the ventricular state estimation process, which will be described later, once each time the cerebral blood flow correlation amount time series is acquired after the estimation start time.
- the unconsciousness estimation system 100 After the start of probability acquisition, the unconsciousness estimation system 100 includes the out-of-range data determination process and the ventricular state estimation process each time the cerebral blood flow correlation amount time series is acquired, as well as the unconsciousness completed probability acquisition process and consciousness, which will be described later.
- the loss determination process is executed once for each.
- the probability acquisition start time is the time when the state of the ventricle of the estimation target 901 is determined to be abnormal for the first time after the consciousness loss estimation system 100 starts the acquisition of the brain correlation amount time series of the estimation target 901.
- the unconsciousness estimation system 100 executes the measurement reliability estimation process described later after the probability acquisition start time at the latest.
- the out-of-range data determination process the ventricular state estimation process, the measurement reliability estimation process, the consciousness loss probability acquisition process, and the consciousness loss determination process will be described together with an outline of the consciousness loss estimation system 100. ..
- the unconsciousness estimation system 100 repeatedly executes the out-of-range data determination process in the estimation cycle after the estimation start time.
- the out-of-range data determination process is based on the cerebral blood flow correlation amount time series, and the range in which the cerebral blood flow correlation amount indicated by each data of the cerebral blood flow correlation amount time series corresponds to the time position of each data (hereinafter, "threshold region"). It is a process of determining whether or not it is out of the range of).
- the time position is a position in the time axis direction of each data of the cerebral blood flow correlation amount time series (hereinafter referred to as “cerebral blood flow correlation amount point data”).
- the unconsciousness estimation system 100 determines whether or not each cerebral blood flow correlation amount point data is out of range data by executing the out-of-range data determination process.
- the out-of-range data is cerebral blood flow correlation amount point data outside the range of the threshold region.
- the threshold area is a range having at least an upper limit value and a lower limit value.
- the upper limit value of the threshold area is hereinafter referred to as an upper threshold value.
- the lower limit of the threshold area is hereinafter referred to as a lower threshold.
- the threshold region is determined according to the distribution of the cerebral blood flow correlation amount point data within the period of the first length including the time position where the threshold region is determined.
- the period of the first length is referred to as the first period.
- the first length (that is, the length of the first period) may be any time as long as it has a plurality of predetermined number or more of cerebral blood flow correlation quantity point data within the first period.
- the first length is, for example, 3 seconds.
- the upper threshold is, for example, when the average value of the cerebral blood flow correlation amount indicated by the cerebral blood flow correlation amount point data in the first period including the time position where the threshold region is determined is M and the standard deviation is V. (M + V).
- the lower threshold is, for example, when the average value of the cerebral blood flow correlation amount indicated by the cerebral blood flow correlation amount point data in the first period including the time position where the threshold region is determined is M and the standard deviation is V. (MV).
- the calculation of the upper limit value of the threshold area and the lower limit value of the threshold area is not necessarily limited to the average value M and the standard deviation V, and the detection sensitivity may be adjusted by multiplying the standard deviation V by a constant (correction value). You may convert it. Further, it may be calculated based on the variance (of the cerebral blood flow correlation amount) or the gradient, or may be adjusted by the device other than the biological signal, environmental data, and continuity (presence or absence of deficiency of the observed value).
- Being out of the threshold region means that the value is either less than the lower threshold or greater than the upper threshold.
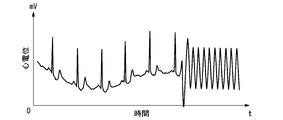
- FIG. 2 is a diagram showing an upper threshold value, a lower threshold value, a threshold value region, and out-of-range data in the first embodiment.
- FIG. 2 shows the electrocardiographic time series as an example of the cerebral blood flow correlation amount time series.
- the horizontal axis of FIG. 2 indicates the elapsed time from the time of the origin.
- the vertical axis of FIG. 2 shows the electrocardiographic potential.
- FIG. 2 shows an upper threshold value and a lower threshold value. As shown in FIG. 2, the upper threshold and the lower threshold are not necessarily the same at all times.
- the range of the electrocardiographic potential indicated by D1, D2 and D3 is the threshold region at time T1, time T2 and time T3, respectively. As shown in FIG. 2, the range of the electrocardiographic potential indicated by the threshold region is not always the same at all times.
- FIG. 2 shows a set of cerebral blood flow correlation quantity point data determined to be out-of-range data.
- the unconsciousness estimation system 100 executes the ventricular state estimation process in the estimation cycle after the estimation start time.
- the ventricular state estimation process is executed after the out-of-range data determination process is executed during the unit period.
- the ventricular state estimation process includes a normal ventricular state estimation process and an abnormal ventricular state estimation process. In the ventricular state estimation process, the normal ventricular state estimation process is first executed, and then the abnormal ventricular state estimation process is executed according to the result of the normal ventricular state estimation process.
- the normal ventricular state estimation process first, it is determined whether or not the state of the ventricle of the estimation target 901 is normal based on the determination result of the out-of-range data determination process. In the normal ventricular state estimation process, when it is determined that the state of the ventricle of the estimation target 901 is normal, it is estimated that the state of the ventricle of the estimation target 901 is normal.
- the abnormal ventricular state estimation process is executed when it is estimated to be abnormal (that is, abnormal) by the normal ventricular state estimation process.
- the abnormal ventricular state estimation process is a process of estimating which of the predetermined abnormal ventricular states the ventricular state of the estimation target 901 is, based on the cerebral blood flow correlation amount time series. ..
- Abnormal ventricular condition is a ventricular condition associated with loss of consciousness.
- the predetermined abnormal ventricular state may be any ventricular state as long as it is a ventricular state related to unconsciousness.
- An abnormal ventricular condition is, for example, a ventricular condition in which ventricular tachycardia is occurring.
- the abnormal ventricular condition may be, for example, a condition of the ventricle in which ventricular fibrillation is occurring.
- the unconsciousness estimation system 100 will be described by taking as an example a case where the predetermined abnormal ventricular state is ventricular tachycardia and a case where the ventricular fibrillation is performed.
- the unconsciousness estimation system 100 estimates the ventricular state of the estimation target 901 by executing the ventricular state estimation process.
- the unconsciousness estimation system 100 transmits a warning to the transmission destination.
- the warning transmitted to the transmission destination when the ventricular condition is determined to be abnormal by the ventricular condition estimation process is referred to as a first warning.
- the first warning is information indicating that the estimation target 901 has a high probability of being unconscious.
- the transmission destination is, for example, the administrator 902 or the estimation target 901 itself.
- the transmission destination may be not only the manager 902 or the estimation target 901 but also a safety device such as an automatic stop device or an autopilot system.
- the unconsciousness estimation process is a process for acquiring the unconsciousness probability.
- the unconsciousness completed probability is the probability that the estimation target 901 is already in a state of unconsciousness, and the elapsed time from the start of probability acquisition, the change in the measurement environment, and the cerebral blood flow correlation time series acquired by the unconsciousness estimation system 100. It is a probability corresponding to a change in the state of the estimation target 901 that appears as a change in.
- the unconsciousness probability is an indicator of the possibility of unconsciousness.
- the state of the estimation target 901 that appears as a change in the cerebral blood flow correlation time series acquired by the consciousness loss estimation system 100 is referred to as a consciousness loss-related state. Specifically, whether or not a change in the unconsciousness-related state has occurred is estimated by the ventricular state estimation process.
- the measurement environment is the state of a device (hereinafter referred to as “acquisition-related device”) related to acquisition of the cerebral blood flow correlation amount time series of the estimation target 901 such as the biological sensor 1.
- the acquisition-related device includes, for example, a communication path when the information of the biosensor 1 is transmitted to the transmission destination using the communication path in the unconsciousness estimation system 100.
- the change in the measurement environment means that the state of the acquisition-related device changes.
- the change in the measurement environment is, for example, a change in the operation of the acquisition-related device from a normal operation to an abnormal operation. Abnormal operation occurs, for example, when the acquisition-related device is broken.
- the change in the acquisition environment is, for example, a change in which the electrode of the biosensor 1 deviates from the estimation target 901 when the biosensor 1 is a device for measuring the cerebral blood flow correlation amount using the electrode attached to the estimation target 901. You may.
- the reliability of the cerebral blood flow correlation amount time series output by the acquisition-related device (hereinafter referred to as "measurement reliability") is when the operation of the acquisition-related device is normal. Lower than. Since the unconsciousness completed probability is the probability that the estimated target 901 is already in the unconscious state, the consciousness is changed when the operation of the acquisition-related device changes from normal to abnormal, although the unconsciousness-related state of the estimated target 901 does not change. The probability of being lost is reduced.
- the probability of unconsciousness being lost is the probability that the estimated target 901 is already in a state of unconsciousness, if the state related to loss of consciousness changes from an abnormal state to a normal state, although there is no change in the measurement environment, the person loses consciousness. The probability of completion is reduced.
- the state in which the unconsciousness-related state is abnormal is, for example, a state in which the movement of the heart of the estimation target 901 is abnormal.
- the probability that the estimation target 901 loses consciousness increases with the passage of time. Therefore, if there is no change between the measurement environment and the state related to loss of consciousness of the estimation target 901, the probability of loss of consciousness increases with the passage of time.
- the unconsciousness probability is also a value indicating the reliability of the estimation result of the ventricular state estimation process. For example, if there is no change between the measurement environment and the state of the ventricle of the estimation target 901 after the start of probability acquisition, the displayed unconsciousness probability indicates the probability of increasing with the passage of time.
- the horizontal axis of graph G1 indicates time.
- the vertical axis of the graph G1 shows the probability of unconsciousness.
- the time t1 in the graph G1 is the time when the probability acquisition starts. Therefore, the time t1 in the graph G1 is an example at the time when the unconsciousness completed probability acquisition process is started.
- the origin on the time axis of the graph G1 is an example of the estimation start time.
- the probability of losing consciousness is just a probability. Therefore, even if the probability of losing consciousness is high, the estimation target 901 may not have lost consciousness.
- the consciousness loss estimation system 100 After the probability acquisition start time, the consciousness loss estimation system 100 repeatedly executes the consciousness loss determination process in the estimation cycle.
- the unconsciousness determination process is a process for determining whether or not the unconsciousness loss probability is equal to or higher than a predetermined probability (hereinafter referred to as “reference probability”).
- the loss of consciousness estimation system 100 transmits a warning to the transmission destination.
- the warning transmitted to the transmission destination when the probability of loss of consciousness is equal to or higher than the reference probability is referred to as a second warning.
- the second warning is information indicating that the estimation target 901 has a high probability of being unconscious.
- the unconsciousness estimation system 100 may transmit not only the second warning but also the unconsciousness probability itself to the transmission destination.
- the transmission destination is, for example, the administrator 902 or the estimation target 901 itself.
- the transmission destination may be not only the manager 902 or the estimation target 901 but also a safety device such as an automatic stop device or an autopilot system.
- the unconsciousness estimation system 100 executes the unconsciousness probability acquisition process without transmitting the warning to the transmission destination. However, after the unconsciousness probability has become equal to or higher than the reference probability even once, the unconsciousness estimation system 100 may transmit the second warning even if the unconsciousness probability is less than the reference probability.
- the unconsciousness estimation system 100 executes the measurement reliability estimation process at the latest after the probability acquisition start time.
- the measurement reliability estimation process is a process for estimating the measurement reliability based on the cerebral blood flow correlation amount time series.
- the measurement reliability estimation process for example, when the value of a predetermined index indicated by the cerebral blood flow correlation amount time series is the value at the time of failure of the acquisition-related device, the measurement reliability is higher than that when the acquisition-related device is not failed. This is a process that estimates the degree to be low.
- the predetermined index indicated by the cerebral blood flow correlation amount time series is, for example, the electrocardiographic potential indicated by the electrocardiographic time series.
- the electrocardiographic potential is a value equal to or greater than the measurement limit of the device, it is estimated that the acquisition-related device has failed in the measurement reliability estimation process.
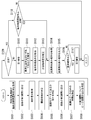
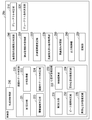
- FIG. 3 is a diagram showing an example of the system configuration of the consciousness loss estimation system 100 of the first embodiment.
- the unconsciousness estimation system 100 includes a biological sensor 1 and an unconsciousness estimation device 2.
- the biosensor 1 repeatedly measures the cerebral blood flow correlation amount to be measured at a predetermined time interval shorter than the estimation cycle.
- the measurement result of the biological sensor 1 is a cerebral blood flow correlation amount time series.
- the biological sensor 1 outputs the measurement result to the unconsciousness estimation device 2.
- the biosensor 1 is, for example, a heart rate sensor.
- the unconsciousness loss estimation device 2 repeatedly acquires the cerebral blood flow correlation amount time series acquired by the biological sensor 1 in the estimation cycle.
- the unconsciousness estimation device 2 executes out-of-range data determination processing, ventricular state estimation processing, consciousness loss completion probability acquisition processing, and consciousness loss determination processing based on the cerebral blood flow correlation amount time series.
- the unconsciousness estimation device 2 includes a control unit 20 including a processor 91 such as a CPU (Central Processing Unit) connected by a bus and a memory 92, and executes a program.
- the unconsciousness estimation device 2 functions as a device including a control unit 20, a communication unit 21, an input unit 22, a storage unit 23, and an output unit 24 by executing a program.
- the processor 91 reads the program stored in the storage unit 23, and stores the read program in the memory 92.
- the processor 91 executes the program stored in the memory 92, the unconsciousness estimation device 2 functions as a device including the control unit 20, the communication unit 21, the input unit 22, the storage unit 23, and the output unit 24.
- the control unit 20 controls the operation of each functional unit included in the own device (consciousness loss estimation device 2).
- the control unit 20 acquires, for example, a cerebral blood flow correlation amount time series at an estimated cycle.
- the reciprocal of the estimation period (that is, the sampling rate) is, for example, 1 kHz.
- the control unit 20 executes, for example, out-of-range data determination processing, ventricular state estimation processing, consciousness loss completed probability acquisition processing, and consciousness loss determination processing.
- the communication unit 21 includes a communication interface for connecting the own device to the biosensor 1.
- the communication unit 21 communicates with the biosensor 1 via, for example, a network.
- the communication unit 21 acquires the cerebral blood flow correlation amount time series from the biosensor 1 by communicating with the biosensor 1.
- the input unit 22 includes an input device such as a mouse, a keyboard, and a touch panel.
- the input unit 22 may be configured as an interface for connecting these input devices to its own device.
- the storage unit 23 is configured by using a storage device such as a magnetic hard disk device or a semiconductor storage device.
- the storage unit 23 stores various information related to the unconsciousness estimation device 2.
- the storage unit 23 stores, for example, the history of the cerebral blood flow correlation amount time series output by the biological sensor 1.
- the storage unit 23 stores, for example, a program for controlling the operation of the unconsciousness estimation device 2 in advance.
- the storage unit 23 stores, for example, information indicating an estimation start time point.
- the storage unit 23 stores, for example, information indicating a probability acquisition start time point.
- the storage unit 23 stores, for example, the history of the unconsciousness probability.
- the output unit 24 includes a display device such as a CRT (Cathode Ray Tube) display, a liquid crystal display, and an organic EL (Electro-Luminescence) display, and an information output device such as an audio output device such as a speaker.
- the output unit 24 may be configured as an interface for connecting these output devices to its own device.
- the output unit 24 outputs information about the unconsciousness estimation device 2.
- the output unit 24 outputs, for example, the information input to the input unit 22.
- the output unit 24 outputs, for example, the first warning.
- the output unit 24 outputs, for example, a second warning.
- the output unit 24 outputs, for example, the probability of loss of consciousness.
- the output unit 24 outputs, for example, the measurement reliability.
- the information output by the output unit 24 is acquired by the transmission destination such as the administrator 902 or the estimation target 901 itself.
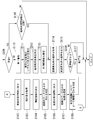
- FIG. 4 is a diagram showing an example of the functional configuration of the control unit 20 in the first embodiment.
- the control unit 20 includes a time series acquisition unit 210, an out-of-range data determination unit 220, a ventricular state estimation unit 230, a probability acquisition processing execution determination unit 240, a probability acquisition condition acquisition unit 250, a measurement reliability estimation unit 260, and a probability of loss of consciousness. It includes an acquisition unit 270, a loss of consciousness determination unit 280, an output control unit 290, and a recording unit 300.
- the time series acquisition unit 210 repeatedly acquires the cerebral blood flow correlation amount time series at the estimation cycle via the communication unit 21.
- the out-of-range data determination unit 220 executes the out-of-range data determination process for the cerebral blood flow correlation amount time series acquired by the time series acquisition unit 210.
- the out-of-range data determination unit 220 executes a threshold area determination process as a part of the out-of-range data determination process.
- the threshold area determination process is a process for determining the threshold area of each time position. More specifically, the threshold region determination process is a process of determining the threshold region to be determined according to the cerebral blood flow correlation quantity point data distribution within the first period including the time position where the threshold region is determined.
- the out-of-range data determination unit 220 includes a first division unit 221, a distribution acquisition unit 222, a threshold area determination unit 223, and an out-of-range data in-range determination unit 224.
- the first division unit 221 divides the cerebral blood flow correlation amount time series in the time axis direction by a plurality of first periods.
- the distribution acquisition unit 222 acquires the cerebral blood flow correlation amount point data statistic for each first period.
- the cerebral blood flow correlation amount point data statistic is a statistic relating to the distribution of the cerebral blood flow correlation amount indicated by the cerebral blood flow correlation amount point data belonging to each first period, which is the amount for each first period.
- the statistic regarding the distribution may be any statistic as long as it can represent the distribution.
- Statistics related to distribution are, for example, mean values and deviations.
- the deviation may be any statistic as long as it is a statistic indicating a deviation from the average value, and may be, for example, a standard deviation.
- the unconsciousness estimation system 100 will be described by taking the case where the cerebral blood flow correlation amount point data statistic is the average value and the standard deviation as an example.
- the threshold area determination unit 223 determines the threshold area for each first period based on the cerebral blood flow correlation amount point data statistic.
- the threshold area determination process is a process in which the threshold area is determined in each first period by a series of processes executed by the first division unit 221 and the distribution acquisition unit 222 and the threshold area determination unit 223.
- the out-of-range data in-range determination unit 224 determines whether or not each cerebral blood flow correlation amount point data is out-of-range data by using the threshold area determined by the threshold area determination process.
- the out-of-range data determination process is a process of determining whether or not each cerebral blood flow correlation amount point data is out-of-range data by the threshold area determination process and the process executed by the out-of-range data in-range determination unit 224.
- the ventricular state estimation unit 230 executes the ventricular state estimation process.
- the ventricular state estimation unit 230 includes a second division unit 231, a time integration unit 232, a peak period determination unit 233, a normal ventricular state estimation unit 234, and an abnormal ventricular state estimation unit 235.
- the second division unit 231 divides the cerebral blood flow correlation amount time series by a plurality of second periods.
- the length of the second period is shorter than the length of the first period that shares some or all of the time positions.
- the length of the second period is, for example, 200 milliseconds.
- the time integration unit 232 integrates the length of the period including only the out-of-range data for each second period.
- the total value (that is, the integrated time) of the length of the period including only the out-of-range data is referred to as the out-of-range time.
- the peak period determination unit 233 determines whether or not the out-of-range time exceeds a predetermined time (hereinafter referred to as "threshold time") for each second period.
- the threshold time is a time shorter than the length of the second period. If the length of the second period is 200 ms, the threshold time is, for example, 50 ms.
- the second period in which the out-of-range time is determined to be longer than the threshold time by the peak period determination unit 233 is referred to as a peak period.
- the normal ventricular state estimation unit 234 executes the normal ventricular state estimation process. Specifically, the normal ventricular state estimation unit 234 determines whether the ventricular state of the estimation target 901 is normal or abnormal based on the appearance in the cerebral blood flow correlation amount time series during the peak period.
- the normal ventricular state estimation unit 234 determines that the ventricular state of the estimation target 901 is not normal, for example, when a predetermined number of adjacent second periods in the time axis direction are peak periods. That is, the normal ventricular state estimation unit 234 determines that the ventricular state of the estimation target 901 is not normal when the condition that the peak period is continuous by a predetermined number in the time axis direction is satisfied.
- the predetermined number is, for example, 5 times. For example, when the length of the second period is 200 ms and the threshold time is 50 ms and the five adjacent second periods in the time axis direction are the peak periods, the normal ventricular state estimation unit 234 , It is determined that the state of the ventricle of the estimation target 901 is not normal.
- the ventricular condition of subject 901 is a condition in which ventricular tachycardia or ventricular fibrillation has occurred. That is, the condition that the length of the second period is 200 milliseconds and the threshold time is 50 milliseconds and the five adjacent second periods in the time axis direction are the peak periods is a medical point of view. It is a condition that the state of the ventricle of the estimation target 901 is not normal.
- the state in which the ventricle of the estimation target 901 is normal is a condition that the heartbeat interval is within a medically known predetermined range (hereinafter referred to as "reference frequency range”) from a medical point of view. Equivalent.
- the process of determining whether the state of the ventricle of the estimation target 901 by the normal ventricular state estimation unit 234 is normal or abnormal is equivalent to the process of determining whether the heartbeat interval is within the reference frequency range.
- the normal ventricular state estimation unit 234 determines that the ventricular condition of the estimation target 901 is normal, it estimates that the ventricular condition of the estimation target 901 is normal.
- the abnormal ventricular state estimation unit 235 executes the abnormal ventricular state estimation process when the normal ventricular state estimation unit 234 determines that the ventricular state of the estimation target 901 is abnormal.
- the abnormal ventricular state estimation unit 235 first sets a value related to the heartbeat interval indicated by the cerebral blood flow correlation amount time series based on the cerebral blood flow correlation amount time series (hereinafter, “heartbeat interval related value”). ".) Is acquired. In the abnormal ventricular state estimation process, the abnormal ventricular state estimation unit 235 then estimates the abnormal ventricular state of the estimation target 901 based on the acquired heartbeat interval-related values.
- the heart rate interval related value is, for example, the heart rate interval itself.
- the abnormal ventricular state estimation unit 235 indicates that the ventricular state of the estimation target 901 is a state of ventricular fibrillation when the frequency of appearance of the peak period is higher than the first reference frequency. Presumed to be.
- the first reference frequency is the highest value within the reference frequency range.
- the abnormal ventricular state estimation unit 235 states that the ventricular state of the estimation target 901 is ventricular tachycardia when the frequency of appearance of the peak period is less than the second reference frequency. Presumed to be in a beat state.
- the second reference frequency is the minimum value within the reference frequency range.
- the heart rate interval-related value may be, for example, cardiac output.
- the heart rate interval-related value may be, for example, organ blood flow.
- the heartbeat interval is acquired by, for example, a method of acquiring the R spine peak point acquired from the combination of the threshold value and the inflection point and measuring the time interval with the next R spine peak point.
- the cardiac output per hour is, for example, the standard value of human stroke volume observed by a cardiac output meter and the stroke volume corrected by Frank-Starling's law multiplied by the heart rate. It is estimated based on the calculated value.
- the organ blood flow is information stored in advance in the storage unit 23 indicating the relationship between the blood pressure observed using the deep blood pressure meter, the continuous sphygmomanometer, the posture and the environmental sensor, and the standard blood pressure of the organ (hereinafter,). It is estimated using "information related to organ blood pressure"). More specifically, the organ blood flow is estimated by estimating the ratio between the cerebral blood flow and the blood flow of other organs based on the information related to the organ blood flow.
- Organ blood flow is a quantity related to blood flow and blood distribution in organs closely related to loss of consciousness such as the brain and heart. Closely related to loss of consciousness of the brain, heart, etc. refers to the organs involved in blood circulation of the cranial nerve tissue and the circulatory regulation function, specifically, the brain, heart, head and neck and thoracic blood vessels, lungs, and their circulatory regulation. Means function.
- the series of processes provided by each functional unit included in the ventricular state estimation unit 230 from the second division unit 231 to the abnormal ventricular state estimation unit 235 is an example of the ventricular state estimation process.
- the probability acquisition process execution determination unit 240 determines whether or not to execute the unconsciousness-completed probability acquisition process. Specifically, when the probability acquisition process execution determination unit 240 executes the unconscious probability acquisition process when the timing for determining whether or not to execute the unconscious probability acquisition process is after the probability acquisition start time. judge. The probability acquisition process execution determination unit 240 determines that the unconscious probability acquisition process is not executed when the timing for determining whether or not to execute the unconscious probability acquisition process is not after the probability acquisition start time.
- the probability acquisition condition acquisition unit 250 provides information indicating the probability determination condition based on the estimation result of the ventricular state estimation unit 230 and the information indicating the relationship between the ventricular state and the probability determination condition stored in the storage unit 23 in advance. get.
- the probability determination condition is a condition for each combination of the elapsed time from the start of probability acquisition, the change in the measurement environment, and the change in the state of the estimation target 901 that appears as a change in the cerebral blood flow correlation time series. Includes conditions that give the amount of change.
- the probability determination condition is, for example, a condition that gives the amount of change in the unconsciousness completed probability when the elapsed time from the probability acquisition start time changes by a unit time.
- the probability determination condition also includes a condition indicating an initial value of the unconsciousness probability.
- the initial value of the unconsciousness probability is the unconsciousness probability immediately after the start of probability acquisition.
- the measurement reliability estimation unit 260 executes the measurement reliability estimation process.
- the measurement reliability estimation unit 260 estimates the measurement reliability by executing the measurement reliability estimation process.
- the unconsciousness probability acquisition unit 270 executes the unconsciousness probability acquisition process. Specifically, the unconscious probability acquisition unit 270 includes the probability acquisition condition acquired by the probability acquisition condition acquisition unit 250, the measurement reliability estimated by the measurement reliability estimation unit 260, and the elapsed time from the probability acquisition start time. And, the unconsciousness completed probability is acquired based on the estimation result of the ventricular state estimation unit 230 after the probability acquisition start time.
- the unconsciousness probability acquisition unit 270 acquires the unconsciousness probability. Is higher than the unconsciousness probability acquired in the last unit period.
- the reference reliability is a predetermined value.
- the unconsciousness probability acquisition unit 270 acquires the unconsciousness probability. , Lower than the unconsciousness probability acquired in the last unit period.
- the unconsciousness probability acquired by the unconsciousness probability acquisition unit 270 is lower than the unconsciousness acquisition probability acquired in the immediately preceding unit period.
- the unconsciousness determination unit 280 executes the unconsciousness determination process.
- the output control unit 290 controls the operation of the output unit 24.
- the output control unit 290 controls, for example, the operation of the output unit 24 to cause the output unit 24 to output the first warning.
- the output control unit 290 controls, for example, the operation of the output unit 24 to cause the output unit 24 to output a second warning.
- the output control unit 290 controls, for example, the operation of the output unit 24 to cause the output unit 24 to output the unconsciousness completed probability.
- the output control unit 290 controls the operation of the output unit 24, for example, and causes the output unit 24 to output the measurement reliability.
- the recording unit 300 records various information in the storage unit 23.
- the recording unit 300 records, for example, information indicating an estimation start time in the storage unit 23.
- the recording unit 300 records, for example, information indicating the probability acquisition start time in the storage unit 23.
- the recording unit 300 records, for example, the estimation result of the ventricular state estimation unit 230 in the storage unit 23.
- the recording unit 300 records, for example, the probability condition acquired by the probability acquisition condition acquisition unit 250 in the storage unit 23.
- the recording unit 300 records, for example, the measurement reliability estimated by the measurement reliability estimation unit 260 in the storage unit 23.
- the recording unit 300 records, for example, the unconsciousness completed probability acquired by the unconsciousness loss probability acquisition unit 270 in the storage unit 23.
- the recording unit 300 records, for example, the determination result of the unconsciousness determination unit 280 in the storage unit 23.
- FIG. 5 is a flowchart showing an example of the flow of processing executed by the unconsciousness estimation system 100 in the first embodiment.
- FIG. 5 is a flowchart showing a flow of processing executed in one unit period. Therefore, in the unconsciousness estimation system 100, the flowchart shown in FIG. 5 is repeatedly executed in the estimation cycle.
- the process of acquiring the cerebral blood flow correlation amount time series by the biological sensor 1 is repeatedly executed at a predetermined timing.
- the process of acquiring the cerebral blood flow correlation amount time series by the time series acquisition unit 210 is also repeatedly executed at predetermined time intervals. Further, after each process of the flowchart shown in FIG. 5 is executed, the recording unit 300 records information indicating the execution result of each process in the storage unit 23. For example, the recording unit 300 records information indicating the probability acquisition start time in the storage unit 23 at the probability acquisition start time.
- the time series acquisition unit 210 acquires the cerebral blood flow correlation amount time series acquired by the biological sensor 1 (step S101). By executing the process of step S101, the process of the unit period is started.
- step S101 the first division unit 221 divides the cerebral blood flow correlation amount time series in the time axis direction by a plurality of first periods (step S102).
- the distribution acquisition unit 222 acquires the cerebral blood flow correlation amount point data statistic for each first period (step S103).
- the threshold region determination unit 223 determines the threshold region for each first period based on the cerebral blood flow correlation amount point data statistic (step S104).
- the out-of-range data in-range determination unit 224 determines whether or not each cerebral blood flow correlation amount point data in the cerebral blood flow correlation amount time series is out-of-range data (step S105).
- the processing of steps S102 to S104 is the threshold area determination processing, and the processing of steps S102 to S105 is the out-of-range data determination processing. As shown in the flow of steps S102 to S105, the threshold area determination process is executed before the execution of step S105.
- the second division unit 231 divides the cerebral blood flow correlation amount time series by a plurality of second periods (step S106).
- the time integration unit 232 acquires the out-of-range time for each second period (step S107).
- the peak period determination unit 233 determines whether or not each second period is a peak period (step S108).
- the normal ventricular state estimation unit 234 determines whether the ventricular state of the estimation target 901 is normal or abnormal (step S109). When the state of the ventricle of the estimation target 901 is not normal (step S109: NO), the output control unit 290 controls the operation of the output unit 24 to cause the output unit 24 to output the first warning (step S110).
- the abnormal ventricular state estimation unit 235 executes the abnormal ventricular state estimation process (step S111). The abnormal ventricular state estimation unit 235 estimates which abnormal ventricular state is the state of the ventricle of the estimation target 901 by executing the abnormal ventricular state estimation process.
- step S106 The series of processes from step S106 to step S111 is an example of the ventricular state estimation process.
- step S111 the probability acquisition condition acquisition unit 250 acquires the probability acquisition condition based on the estimation result of the abnormal ventricular state estimation unit 235 (step S112).
- the measurement reliability estimation unit 260 estimates the measurement reliability based on the cerebral blood flow correlation amount time series (step S113).
- the unconsciousness probability acquisition unit 270 acquires the unconsciousness probability (step S114).
- the operation of the output unit 24 is controlled so that the output unit 24 outputs the probability of loss of consciousness by displaying or the like (step S115).
- the unconsciousness determination unit 280 determines whether or not the unconsciousness completed probability is equal to or greater than the reference probability (step S116).
- step S116: YES When the probability of loss of consciousness is equal to or greater than the reference probability (step S116: YES), the output control unit 290 controls the operation of the output unit 24 to cause the output unit 24 to output a second warning (step S117). On the other hand, when the unconsciousness completed probability is less than the reference probability (step S116: NO), the processing in the unit period ends without outputting the second warning.
- the probability acquisition process execution determination unit 240 determines whether or not to execute the unconscious probability acquisition process (step S118). Specifically, the probability acquisition process execution determination unit 240 determines whether or not the timing for determining whether or not to execute the unconscious probability acquisition process is after the probability acquisition start time.
- step S118 If the timing for determining whether or not to execute the unconsciousness acquisition probability acquisition process is after the probability acquisition start time (step S118: YES), the process in step S114 is executed. On the other hand, when the timing for determining whether or not to execute the unconsciousness probability acquisition process is not after the probability acquisition start time (step S118: NO), the process in the unit period ends without acquiring the unconsciousness probability acquisition process. do.
- step S109 When it is determined in step S109 that the state of the ventricle of the estimation target 901 is normal, the output control unit 290 controls the operation of the output unit 24, and the output unit 24 is informed of the state of the ventricle of the estimation target 901. Information indicating that it is normal may be output.
- the graphs of the unconsciousness probability in FIGS. 6 to 9 are examples of the unconsciousness probability output by the output unit 24 in the process of step S115.
- the electrocardiographic time series and the graphs of changes in cerebral blood flow in FIGS. 6 to 9 are examples of cerebral blood flow correlation time series, respectively.
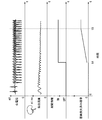
- FIG. 6 is a first explanatory diagram illustrating the relationship between the probability of unconsciousness and the cerebral blood flow correlation amount time series in the first embodiment.
- FIG. 6 shows the same electrocardiographic time series, a graph of changes in cerebral blood flow, information indicating whether or not it is after the start of probability acquisition (hereinafter referred to as “period information”), and a graph of unconsciousness probability. It is the figure shown on the time axis.
- the horizontal axis of FIG. 6 indicates the time. Therefore, the horizontal axis of FIG. 6 indicates the passage of time from the time of the origin when the time of the origin is set to 0.
- the time of origin in FIG. 6 is an example of the estimation start time.
- the period information indicates whether or not each time on the horizontal axis is a time after the probability acquisition start time.
- ON indicates that the time is a time after the probability acquisition start time.
- OFF indicates that the time is a time before the probability acquisition start time.
- the time t2 in FIG. 6 is an example at the start of probability acquisition.
- FIG. 6 shows that the cerebral blood flow decreases with time when there is no time change of the electrocardiographic potential in the period after the start of probability acquisition.
- FIG. 6 shows that the probability of unconsciousness increases in proportion to time when there is no time change in the electrocardiographic potential.
- FIG. 6 shows that cardiac arrest occurred at time t3.
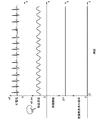
- FIG. 7 is a second explanatory diagram illustrating the relationship between the probability of unconsciousness and the cerebral blood flow correlation amount time series in the first embodiment.
- FIG. 7 is a graph showing a time series of electrocardiogram, a graph of changes in cerebral blood flow, period information, and a graph of the probability of unconsciousness on the same time axis.
- the horizontal axis of FIG. 7 indicates the time. Therefore, the horizontal axis of FIG. 7 shows the passage of time from the time of the origin when the time of the origin is set to 0.
- the time of origin in FIG. 7 is an example of the estimation start time.
- the period information indicates whether or not each time on the horizontal axis is a time after the probability acquisition start time.
- the time t4 in FIG. 7 is an example of the probability acquisition start time.
- FIG. 7 shows an example of an electrocardiographic time series in which the heartbeat interval is no longer included in the reference frequency range with the passage of time.
- FIG. 7 shows that the probability of unconsciousness increases in proportion to time from the start of probability acquisition until time t5.
- the time t5 is the time when the unconsciousness probability reaches a predetermined upper limit of the unconsciousness probability.
- FIG. 8 is a third explanatory diagram illustrating the relationship between the probability of unconsciousness and the cerebral blood flow correlation amount time series in the first embodiment.
- FIG. 8 is a graph showing the electrocardiographic time series, the graph of changes in cerebral blood flow, the period information, and the graph of the probability of unconsciousness on the same time axis.
- the horizontal axis of FIG. 8 indicates the time. Therefore, the horizontal axis of FIG. 8 indicates the passage of time from the time of the origin when the time of the origin is set to 0.
- the time of the origin in FIG. 8 is an example of the estimation start time.
- the period information indicates whether or not each time on the horizontal axis is a time after the probability acquisition start time.
- the time t6 in FIG. 8 is an example of the time when the probability acquisition starts.
- T7 in FIG. 8 is a time when the ventricular state of the estimation target 901 is determined to be normal by the ventricular state estimation unit due to the occurrence of the heartbeat. Therefore, at t7 in FIG. 8, the probability of losing consciousness decreases.
- FIG. 9 is a fourth explanatory diagram illustrating the relationship between the probability of unconsciousness and the cerebral blood flow correlation amount time series in the first embodiment.
- FIG. 9 is a graph showing the electrocardiographic time series, the graph of changes in cerebral blood flow, the period information, and the graph of the probability of unconsciousness on the same time axis.
- the horizontal axis of FIG. 9 indicates the time. Therefore, the horizontal axis of FIG. 9 shows the passage of time from the time of the origin when the time of the origin is set to 0.
- the time of origin in FIG. 9 is an example of the estimation start time.
- the period information indicates whether or not each time on the horizontal axis is a time after the probability acquisition start time.
- FIG. 9 shows that since the movement of the heart is stable, the electrocardiographic potential is not disturbed and the cerebral blood flow is also stable. That is, FIG. 9 shows that the state of the ventricles of the estimation target 901 indicated by the electrocardiographic time series continues to be normal. FIG. 9 shows that the period information remains OFF because the state of the ventricle of the estimation target 901 continues to be normal, and the probability of unconsciousness has not been acquired.
- the unconsciousness estimation system 100 of the first embodiment configured in this way is based on the data within a predetermined period including the position of each data in the cerebral blood flow correlation amount time series in the time axis direction, and the time of each data.
- the threshold area is determined according to the position in the axial direction. Then, the unconsciousness estimation system 100 estimates the probability of being unconscious based on the determined threshold area. Therefore, the unconsciousness estimation system 100 can improve the accuracy of estimating the possibility of unconsciousness of the estimation target 901. Therefore, the unconsciousness estimation system 100 of the first embodiment configured in this way can reduce the risk caused by the unconsciousness.
- the unconsciousness estimation system 100 of the first embodiment configured in this way outputs the possibility of unconsciousness of the estimation result by the output unit 24. Since the probability of being unconscious is already output, the presumed target 901 can take actions to reduce the risk caused by the loss of consciousness before the loss of consciousness occurs. Therefore, the unconsciousness estimation system 100 of the first embodiment configured in this way can reduce the risk caused by the unconsciousness.
- the normal ventricular state estimation unit 234 estimates whether or not the ventricular state of the estimation target 901 is normal based on the processing results of the second division unit 231 and the time integration unit 232 and the peak period determination unit 233. You don't have to.
- the normal ventricular state estimation unit 234 may estimate whether or not the state of the ventricle of the estimation target 901 is normal by any method as long as it is possible to estimate whether or not the state of the ventricle of the estimation target 901 is normal. For example, the normal ventricular state estimation unit 234 may estimate whether or not the ventricular state is normal based only on the frequency of occurrence of extreme values of the electrocardiographic potential.
- the extreme values caused by some disturbance of the waveform are also counted in the number of times, and the estimation result is calculated. You may make a mistake.
- the unique vibration having symmetry which is a characteristic of the abnormal signal at the time of ventricular fibrillation derived from the heart. Continuous waves with numbers can be selectively extracted. Therefore, the probability of erroneous estimation is lower than that of estimating whether or not the state of the ventricle is normal based only on the frequency of occurrence of extreme values of the electrocardiographic potential.
- the ventricular state estimation unit 230 estimates whether or not the ventricular state of the estimation target 901 is normal based on the processing results of the second division unit 231 and the time integration unit 232 and the peak period determination unit 233. It is desirable to include an estimation unit 234.
- FIG. 10 is a diagram showing an example of the system configuration of the unconsciousness estimation system 100a of the second embodiment.
- the consciousness loss estimation system 100a differs from the consciousness loss estimation system 100 in that the consciousness loss estimation device 2a is provided in place of the consciousness loss estimation device 2.
- the unconsciousness estimation device 2a is different from the unconsciousness estimation device 2 in that the control unit 20a is provided instead of the control unit 20.
- the control unit 20a is different from the control unit 20 in that it further executes a grayout determination process in addition to the out-of-range data determination process, the ventricular state estimation process, the consciousness loss completed probability acquisition process, and the consciousness loss determination process.
- the grayout determination process is executed before the execution of the ventricular state estimation process.
- the grayout determination process may be executed before the execution of the out-of-range data determination process, or may be executed after the execution of the out-of-range data determination process.
- the grayout determination process is a process for determining whether or not the condition related to grayout (hereinafter referred to as "grayout condition”) is satisfied based on the cerebral blood flow correlation amount time series.
- the grayout condition is a condition that the probability of grayout occurring in the estimation target 901 exceeds a predetermined probability.
- Grayout is a phenomenon that signals loss of consciousness that occurs before loss of consciousness occurs. More specifically, the grayout condition is a condition that there is data in which the cerebral blood flow correlation amount is less than a predetermined threshold value among the cerebral blood flow correlation amount point data.
- the unconsciousness estimation system 100 transmits information indicating that there is a high probability that grayout will occur (hereinafter referred to as “grayout warning”) to the transmission destination when the grayout condition is satisfied.
- FIG. 11 is a diagram showing an example of the functional configuration of the control unit 20a in the second embodiment.
- the control unit 20a differs from the control unit 20 in that it includes a grayout determination unit 310.
- the grayout determination unit 310 executes the grayout determination process.
- the determination result of the grayout determination process is output by the output unit 24 under the control of the output control unit 290.
- the same functions as those provided in the control unit 20 will be designated by the same reference numerals as those in FIG. 4, and the description thereof will be omitted.
- FIGS. 12 and 13 an example of the flow of processing executed by the unconsciousness estimation system 100a will be shown with reference to FIGS. 12 and 13.
- the same processing as that shown in the flowchart of FIG. 5 will be designated by the same reference numerals as those in FIG. 5, and the description thereof will be omitted.
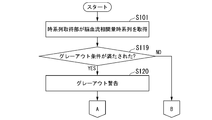
- FIG. 12 is a first flowchart showing an example of a processing flow executed by the unconsciousness estimation system 100a of the second embodiment.
- FIG. 13 is a second flowchart showing an example of the flow of processing executed by the unconsciousness estimation system 100a of the second embodiment.
- step S101 the grayout determination unit 310 executes the grayout determination process (step S119). Specifically, the grayout determination unit 310 determines whether or not the grayout condition is satisfied based on the cerebral blood flow correlation amount time series acquired in step S101.
- step S119 YES
- the output control unit 290 causes the output unit 24 to output a grayout warning (step S120).
- step S120 the process of step S102 is executed.
- step S119: NO the processing in the unit period ends.
- the consciousness loss estimation system 100a of the second embodiment configured in this way has a function of determining the probability of grayout occurring in addition to the function of the consciousness loss estimation system 100. Therefore, the unconsciousness estimation system 100a of the second embodiment configured in this way can reduce the risk caused by the unconsciousness.
- FIG. 14 is a diagram showing an example of the system configuration of the unconsciousness estimation system 100b of the third embodiment.
- the consciousness loss estimation system 100b is different from the consciousness loss estimation system 100a in that it includes a respiratory information acquisition sensor 3 and that it includes a consciousness loss estimation device 2b instead of the consciousness loss estimation device 2a.
- the breathing information acquisition sensor 3 acquires information related to the breathing of the estimation target 901 (hereinafter referred to as "breathing information").
- the respiratory information is, for example, information indicating whether the respiratory state of the estimation target 901 is in the expiratory phase or the inspiratory phase.
- the respiratory information acquisition sensor 3 is, for example, a device that measures oxygen saturation.
- the breathing information acquisition sensor 3 may be a device that measures the ventilation volume.
- the respiratory information acquisition sensor 3 may be a device that measures the carbon dioxide concentration in the exhaled breath.
- the unconsciousness estimation device 2b is different from the unconsciousness estimation device 2a in that the control unit 20b is provided in place of the control unit 20a.
- the control unit 20b is different from the control unit 20a in that it further executes a grayout condition determination process in addition to a grayout determination process, an out-of-range data determination process, a ventricular state estimation process, a consciousness loss completed probability acquisition process, and a consciousness loss determination process. ..
- the grayout condition determination process is a process of determining the grayout condition based on the respiratory information.
- the storage unit 23 in the third embodiment stores in advance information indicating the correspondence relationship between the respiratory information and the grayout condition (hereinafter referred to as “grayout condition correspondence information").
- the grayout condition indicated by the grayout condition correspondence information is any condition as long as the condition that the cerebral blood flow correlation amount is less than a predetermined value (hereinafter referred to as “grayout threshold value”) exists. It may be.
- the correspondence relationship indicated by the grayout condition correspondence information is, for example, a relationship in which the grayout threshold is increased when the respiratory information indicates a decrease in respiratory function such as a decrease in oxygen saturation, a low ventilation volume, and a decrease in exhaled carbon dioxide concentration.
- the communication unit 21 in the third embodiment includes a communication interface for connecting to the breathing information acquisition sensor 3 in addition to the communication interface included in the communication unit 21 in the second embodiment.
- the communication unit 21 in the third embodiment communicates with the respiratory information acquisition sensor 3 via, for example, a network.
- the communication unit 21 in the third embodiment acquires respiration information from the respiration information acquisition sensor 3 by communicating with the respiration information acquisition sensor 3.
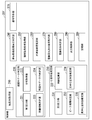
- FIG. 15 is a diagram showing an example of the functional configuration of the control unit 20b according to the third embodiment.
- the control unit 20b is different from the control unit 20a in that it includes a grayout condition determination unit 320.
- those having the same functions as the control unit 20a are designated by the same reference numerals as those in FIG. 11, and the description thereof will be omitted.
- the grayout condition determination unit 320 executes the grayout condition determination process. More specifically, the grayout condition determination process is a process of acquiring the grayout condition corresponding to the acquired respiratory information using the grayout condition correspondence information and determining the acquired grayout condition as the grayout condition used for the grayout determination process. ..
- the grayout condition determination process is executed before the grayout determination process is executed in each unit period. Therefore, the grayout condition determination process is executed, for example, after the process of step S101 in FIG. 12 and before the process of step S119 is executed.
- the unconsciousness estimation system 100b of the third embodiment configured in this way determines the grayout condition based on the respiratory information. Therefore, the unconsciousness estimation system 100b can further improve the accuracy of determining the grayout as compared with the unconsciousness estimation system 100a. Therefore, the unconsciousness estimation system 100b of the third embodiment configured in this way can further reduce the risk caused by the unconsciousness.
- FIG. 16 is a diagram showing an example of the system configuration of the unconsciousness estimation system 100c of the fourth embodiment.
- the consciousness loss estimation system 100c is different from the consciousness loss estimation system 100b in that the consciousness loss estimation device 2c is provided in place of the consciousness loss estimation device 2b.
- the unconsciousness estimation device 2c is different from the unconsciousness estimation device 2b in that the control unit 20c is provided instead of the control unit 20b.
- the control unit 20c further executes a probability determination condition candidate acquisition process in addition to the grayout condition determination process, the grayout determination process, the out-of-range data determination process, the ventricular state estimation process, the unconsciousness loss probability acquisition process, and the consciousness loss determination process. It differs from the control unit 20b in that it is different from the control unit 20b.
- the probability determination condition candidate acquisition process is a process of determining a probability determination condition candidate based on respiratory information.
- the candidate for the probability determination condition is, specifically, information indicating the relationship between the ventricular state and the probability determination condition.
- the storage unit 23 in the fourth embodiment stores in advance information indicating the correspondence relationship between the respiratory information and the candidate of the probability determination condition (hereinafter referred to as "probability determination condition candidate correspondence information").
- the correspondence shown by the probability determination condition candidate correspondence information is that, for example, when the respiratory information shows a decrease in respiratory function, the amount of change per unit time in the amount of change depending on the elapsed time of the unconsciousness probability is larger than usual. It is a relationship.
- the communication unit 21 in the fourth embodiment is the same as the communication unit 21 in the third embodiment.
- FIG. 17 is a diagram showing an example of the functional configuration of the control unit 20c according to the fourth embodiment.
- the control unit 20c differs from the control unit 20b in that the control unit 20c includes a probability determination condition candidate acquisition unit 330.
- the control unit 20c includes a probability determination condition candidate acquisition unit 330.
- those having the same functions as the control unit 20b will be designated by the same reference numerals as those in FIG. 15, and the description thereof will be omitted.
- the probability determination condition candidate acquisition unit 330 executes the probability determination condition candidate acquisition process. More specifically, the probability determination condition candidate acquisition process is a process of acquiring a probability determination condition candidate corresponding to the acquired respiratory information by using the probability determination condition candidate correspondence information. From the acquired probability determination condition candidates, the probability acquisition condition acquisition unit 250 acquires the probability determination condition in the unconscious probability acquisition process based on the estimation result of the ventricular state estimation unit 230.
- the probability determination condition candidate acquisition process is executed before the probability acquisition condition acquisition unit 250 acquires the probability acquisition condition in each unit period. Therefore, the probability determination condition candidate acquisition process may be executed at any timing as long as it is executed after the execution of step S101 in FIG. 12 and before the execution of the process of step S112 in FIG.
- the consciousness loss estimation system 100c of the fourth embodiment configured in this way is an estimation target 901 based on respiratory information in addition to the information used by the consciousness loss estimation system 100b for estimating the consciousness loss probability. Estimate the unconsciousness probability of. Therefore, the consciousness loss estimation system 100c can further improve the accuracy of estimating the possibility of consciousness loss of the estimation target 901 than the consciousness loss estimation system 100b. Therefore, the consciousness loss estimation system 100c of the fourth embodiment configured in this way can further reduce the risk caused by the consciousness loss as compared with the consciousness loss estimation system 100b.
- FIG. 18 is a diagram showing an example of the system configuration of the unconsciousness estimation system 100d according to the fifth embodiment.
- the consciousness loss estimation system 100d differs from the consciousness loss estimation system 100c in that the consciousness loss estimation device 2d is provided in place of the consciousness loss estimation device 2c.
- the unconsciousness estimation device 2d is different from the unconsciousness estimation device 2c in that the control unit 20d is provided instead of the control unit 20c.
- the control unit 20d is different from the control unit 20c in that the control unit 20d further executes the ventricular state estimation condition determination process in addition to the process executed by the control unit 20c.
- the processes executed by the control unit 20c are grayout condition determination processing, grayout determination processing, out-of-range data determination processing, ventricular state estimation processing, probability determination condition candidate acquisition processing, consciousness loss completed probability acquisition processing, and consciousness loss determination. It is a process.
- the ventricular state estimation condition determination process is a process of determining the condition used for the ventricular state estimation process (hereinafter referred to as "ventricular state estimation condition") based on the respiratory information.
- the ventricular state estimation conditions are, for example, the first length and the threshold area upper limit value and the threshold value area lower limit value at each time.
- the ventricular state estimation condition determination process is a process of changing the first length and the threshold area upper limit value and the threshold value area lower limit value at each time according to the respiratory information. That is, an example of the ventricular state estimation condition determination process is a process of determining the first length according to the respiratory information and the threshold area upper limit value and the threshold value area lower limit value at each time.
- the ventricular state estimation condition is, for example, information indicating the first reference frequency or the second reference frequency.
- the ventricular state estimation condition determination process is, for example, a process of changing the first reference frequency or the second reference frequency according to the respiratory information. That is, an example of the ventricular state estimation condition determination process is a process of determining the first reference frequency or the second reference frequency according to the respiratory information.
- the first reference frequency and the second reference frequency may be adjusted according to the respiratory condition such as a decrease in respiratory function or respiratory arrest.
- the storage unit 23 in the fifth embodiment stores in advance information indicating the correspondence between the respiratory information and the ventricular state estimation condition (hereinafter referred to as "ventricular state estimation condition correspondence information").
- the correspondence indicated by the ventricular state estimation condition correspondence information is, for example, a relationship in which a significant ventricular abnormality, ventricular fibrillation or cardiac arrest, or an imminent situation thereof is obtained when the respiratory information indicates a respiratory arrest state for 20 seconds or more continuously. Is.
- the communication unit 21 in the fifth embodiment is the same as the communication unit 21 in the third embodiment.
- FIG. 19 is a diagram showing an example of the functional configuration of the control unit 20d according to the fifth embodiment.
- the control unit 20d differs from the control unit 20c in that it includes a ventricular state estimation condition determination unit 340.
- a ventricular state estimation condition determination unit 340 executes the ventricular state estimation condition determination process.
- the ventricular state estimation condition determination unit 340 determines the ventricular state estimation condition corresponding to the acquired respiratory information based on the ventricular state estimation condition correspondence information and the acquired respiratory information by executing the ventricular state estimation condition determination process.
- the ventricular state estimation condition determination process is executed before the ventricular state estimation unit 230 starts estimating the ventricular state in each unit period. Therefore, the ventricular state estimation condition determination process may be executed at any timing as long as it is executed after the execution of step S101 in FIG. 12 and before the execution of the process of step S103 in FIG.
- the unconsciousness estimation system 100d of the fifth embodiment configured in this way determines the ventricular state estimation condition based on the respiratory information. Therefore, the consciousness loss estimation system 100d can further improve the accuracy of estimating the possibility of consciousness loss of the estimation target 901 than the consciousness loss estimation system 100c. Therefore, the consciousness loss estimation system 100d of the fifth embodiment configured in this way can further reduce the risk caused by the consciousness loss as compared with the consciousness loss estimation system 100c.
- FIG. 20 is a diagram showing an example of the system configuration of the unconsciousness estimation system 100e of the sixth embodiment.
- the consciousness loss estimation system 100e is different from the consciousness loss estimation system 100d in that the consciousness loss estimation device 2e is provided in place of the consciousness loss estimation device 2d.
- the unconsciousness estimation device 2e is different from the unconsciousness estimation device 2d in that the control unit 20e is provided in place of the control unit 20d.
- the control unit 20e is different from the control unit 20d in that the learning update process is further executed in addition to the process executed by the control unit 20d.
- the processes executed by the control unit 20e are grayout condition determination processing, grayout determination processing, out-of-range data determination processing, ventricular state estimation condition determination processing, ventricular state estimation processing, probability determination condition candidate acquisition processing, and unconsciousness. It is a probability acquisition process and a loss of consciousness determination process.
- the learning update process includes a learning process and an update process.
- the learning process is a process of learning conditions used for estimation such as grayout conditions, ventricular state estimation conditions, probability determination conditions, and reference probabilities by machine learning based on the user's response to the output estimation result.
- the update process is a process of updating the conditions used for estimation based on the learning result of the learning process.
- the output estimation result is information output from the output unit 24 and indicates the estimation result of the consciousness loss estimation device 2e regarding the loss of consciousness.
- the output estimation result is, for example, a grayout warning, a first warning, a loss of consciousness probability, or a second warning.
- the user's response to the output estimation result means that the user inputs the certainty of the output estimation result to the unconsciousness estimation device 2e.
- the user's response is input via, for example, the input unit 22.
- the user's response may be input via the communication unit 21.
- the user is an estimation target 901 or an administrator 902.
- FIG. 21 is a diagram showing an example of the functional configuration of the control unit 20e according to the sixth embodiment.
- the control unit 20e is different from the control unit 20d in that it includes a response acquisition unit 350 and a learning update unit 360.
- those having the same functions as the control unit 20d will be designated by the same reference numerals as those in FIG. 19, and the description thereof will be omitted.
- the response acquisition unit 350 acquires the user's response input via the input unit 22 or the communication unit 21.
- the learning update unit 360 executes the learning update process. Specifically, the learning update unit 360 first learns the conditions used for estimation based on the user's response acquired by the response acquisition unit 350, and then updates the conditions used for estimation based on the learning result.
- the learning update process may be executed at any timing as long as the storage unit 23 stores the correspondence between the output estimation result and the user's response.
- the unconsciousness estimation system 100e of the sixth embodiment configured in this way updates the conditions used for estimation based on the user's response to the output estimation result. Therefore, the consciousness loss estimation system 100e can further improve the accuracy of estimating the possibility of consciousness loss of the estimation target 901 than the consciousness loss estimation system 100d. Therefore, the consciousness loss estimation system 100e of the fifth embodiment configured in this way can further reduce the risk caused by the consciousness loss as compared with the consciousness loss estimation system 100d.
- the threshold region may have only one of the lower threshold value and the upper threshold value as long as the ventricular state estimation unit 230 can determine whether or not the state of the ventricle of the estimation target 901 is an abnormal ventricular state. For example, if the abnormal ventricular state is ventricular extrasystole, the electrode lead for measuring the electrocardiographic potential is fixed, and the method of excitatory propagation of the extrasystole is constant, the threshold region is, for example, only the upper threshold. May have.
- the threshold region having only the upper threshold means that the range indicated by the threshold region includes all the values below the upper threshold.
- the threshold region having only the lower threshold means that the range indicated by the threshold region is a range including all values equal to or higher than the lower threshold.
- the ventricular state estimation unit 230 can determine whether or not the ventricular state of the estimation target 901 is a ventricular extrasystole.
- the out-of-range data determination unit 224 determines whether the cerebral blood flow correlation amount exceeds the upper threshold for each cerebral blood flow correlation amount point data of the cerebral blood flow correlation amount time series. Whether or not it is judged and whether or not the cerebral blood flow correlation amount is less than the lower threshold is not judged. In such a case, the out-of-range data includes the cerebral blood flow correlation amount point data in which the cerebral blood flow correlation amount exceeds the upper threshold value and does not include the cerebral blood flow correlation amount point data in which the cerebral blood flow correlation amount is less than the lower threshold value.
- the out-of-range data determination unit 224 determines whether or not the cerebral blood flow correlation amount is less than the lower threshold for each cerebral blood flow correlation amount point data of the cerebral blood flow correlation amount time series. It is determined whether or not the cerebral blood flow correlation amount exceeds the upper threshold. In such a case, the out-of-range data includes the cerebral blood flow correlation amount point data in which the cerebral blood flow correlation amount is less than the lower threshold value and does not include the cerebral blood flow correlation amount point data in which the cerebral blood flow correlation amount exceeds the upper threshold value.
- the out-of-range data determination unit 224 Does not necessarily have to determine out-of-range data using the lower and upper thresholds.
- the out-of-range data determination unit 224 determines out-of-range data using only the upper threshold value, for example. You may. In such a case, the out-of-range data determination unit 224 determines whether or not the cerebral blood flow correlation amount exceeds the upper threshold for each cerebral blood flow correlation amount point data of the cerebral blood flow correlation amount time series, and cerebral blood. It is not determined whether the flow correlation amount is less than the lower threshold.
- the cerebral blood flow correlation amount point data in which the cerebral blood flow correlation amount exceeds the upper threshold is the cerebral blood flow correlation amount point data outside the range of the threshold region, and the brain in which the cerebral blood flow correlation amount is less than the lower threshold.
- the blood flow correlation amount point data is cerebral blood flow correlation amount point data within the range of the threshold region.
- the out-of-range data determination unit 224 determines out-of-range data using only the lower threshold value, for example. You may. In such a case, the out-of-range data determination unit 224 determines whether or not the cerebral blood flow correlation amount is less than the lower threshold value for each cerebral blood flow correlation amount point data of the cerebral blood flow correlation amount time series, and cerebral blood flow. It is not determined whether the amount of correlation exceeds the upper threshold.
- the cerebral blood flow correlation amount point data whose cerebral blood flow correlation amount is less than the lower threshold is the cerebral blood flow correlation amount point data outside the range of the threshold region, and the brain whose cerebral blood flow correlation amount exceeds the upper threshold.
- the blood flow correlation amount point data is cerebral blood flow correlation amount point data within the range of the threshold region.
- the out-of-range data determination unit 224 does not necessarily use both the upper threshold value and the lower threshold value. There is no need to determine out-of-range data.
- the unconsciousness estimation systems 100, 100a to 100e of the first modified example configured in this way are based on the data within a predetermined period including the position of each data in the cerebral blood flow correlation amount time series in the time axis direction. , Determine the threshold area according to the position of each data in the time axis direction. Then, the unconsciousness estimation systems 100, 100a to 100e estimate the unconsciousness completed probability based on the determined threshold value region. Therefore, the unconsciousness estimation systems 100, 100a to 100e can improve the accuracy of estimating the possibility of unconsciousness of the estimation target 901. Therefore, the unconsciousness estimation systems 100, 100a to 100e can improve the accuracy of estimating the probability of being unconscious.
- the unconsciousness estimation systems 100, 100a to 100e of the first modified example configured in this way output the unconsciousness completed probability of the estimation result by the output unit 24. Since the unconsciousness probability is output, the estimation target 901 can take an action to reduce the risk caused by the unconsciousness before the unconsciousness occurs. Therefore, the unconsciousness estimation systems 100, 100a to 100e of the first modification configured in this way can reduce the risk caused by the unconsciousness.
- the control units 20, 20a to 20e may execute the signal shaping process before executing either of the out-of-range data determination process and the grayout determination process, which is executed first.
- the signal shaping process is a process of shaping the cerebral blood flow correlation amount time series so as to be suitable for the subsequent processing. Shaping to be suitable means shaping to be a series that satisfies a predetermined predetermined condition.
- the signal shaping process is, for example, a process (high-pass process) for removing high-frequency components included in the cerebral blood flow correlation amount time series such as noise generated when a biological signal is acquired from the cerebral blood flow correlation amount time series.
- the signal shaping process may be, for example, a process of suppressing the fluctuation of the baseline of the biological signal.
- the signal shaping process may be, for example, a process for normalizing the potential width of the biological signal.
- FIG. 22 is a diagram showing an example of the electrocardiographic time series before shaping in the second modification.
- the horizontal axis of the graph in FIG. 22 indicates the elapsed time from the time of the origin.
- the vertical axis of FIG. 22 shows the electrocardiographic potential.
- fluctuations in the electrocardiographic potential are observed. Therefore, when the probability of unconsciousness is acquired using the data as it is, the accuracy of the acquisition result may be low.
- FIG. 23 is a diagram showing an example of the electrocardiographic time series after shaping by the high-pass filter processing in the second modification.
- the horizontal axis of the graph in FIG. 23 indicates the elapsed time from the time of the origin.
- the vertical axis of FIG. 23 shows the electrocardiographic potential.
- the graph of FIG. 23 is the execution result of the signal shaping process for the electrocardiographic time series shown in FIG.
- the fluctuation of the baseline of the electrocardiographic potential is suppressed as compared with the time series of the electrocardiographic potential of FIG. Therefore, when the unconsciousness has been acquired using the electrocardiographic time series of FIG. 23, the accuracy of the acquisition result is higher than that of the case of acquiring the unconsciousness has been acquired using the electrocardiographic time series of FIG.
- FIG. 24 is an example of the functional configuration of the control unit 20 (hereinafter referred to as “control unit 20f”) that executes the signal shaping process as an example of the control units 20 and 20a to 20e that execute the signal shaping process in the second modification. It is a figure which shows.
- the control unit 20f is different from the control unit 20 in that it includes a signal shaping unit 370.
- the signal shaping unit 370 executes the signal shaping process on the cerebral blood flow correlation amount time series acquired by the time series acquisition unit 210.
- the cerebral blood flow correlation amount time series used in each process executed after the execution of signal shaping processes such as out-of-range data determination process, ventricular state estimation process, unconsciousness probability acquisition process, and consciousness loss determination process. Is a time series of cerebral blood flow correlation after shaping.
- each process executed after the signal shaping process is executed includes the grayout determination process.
- the signal shaping process is executed after the process of step S101 is executed and before the process of step S119 is executed. If the process of step S119 is not executed, the signal shaping process is executed after the process of step S101 is executed and before the process of step S102 is executed.
- the unconsciousness estimation systems 100, 100a to 100e of the second modified example configured in this way execute the unconsciousness completed probability acquisition process based on the cerebral blood flow correlation amount time series after shaping. Therefore, the unconsciousness estimation systems 100, 100a to 100e of the second modification can improve the accuracy of estimating the possibility of unconsciousness of the estimation target 901. Therefore, the unconsciousness estimation systems 100, 100a to 100e of the second modification configured in this way can reduce the risk caused by the unconsciousness.
- the unconsciousness estimation systems 100a to 100e of the second modified example configured in this way include out-of-range data determination processing, ventricular state estimation processing, and unconsciousness loss based on the time series of cerebral blood flow correlation after shaping.
- the completed probability acquisition process, the unconsciousness determination process, and the grayout determination process are executed. Therefore, the unconsciousness estimation systems 100a to 100e of the second modification configured in this way can reduce the risk caused by the unconsciousness.
- the control units 20, 20a to 20e may execute the signal modeling process before executing either the out-of-range data determination process or the grayout determination process, which is executed first.
- the signal modeling process is a waveform based on a predetermined theory regarding the cerebral blood flow correlation amount based on the cerebral blood flow correlation amount time series acquired by the time series acquisition unit 210, and the difference from the cerebral blood flow correlation amount time series is predetermined. Acquire a waveform (hereinafter referred to as "model waveform") that is less than the difference between.
- model waveform Cerebral Blood Flow Correlation Time Series
- a given theory of cerebral blood flow correlation is, for example, Frank-Starling's law, a nonlinear finite element model of cardiac circulation.
- FIGS. 25 to 30 show the correspondence between the electrocardiographic time series and the model waveform.
- 29 and 30 show the correspondence between the aortic blood flow time series and the model waveform.
- the aortic blood flow time series is a time series of aortic blood flow.
- FIG. 25 is a first diagram showing the correspondence between the electrocardiographic time series and the model waveform in the third modification.
- the horizontal axis of the graph in FIG. 25 indicates the elapsed time from the time of the origin.
- the vertical axis on the left side of FIG. 25 shows the electrocardiographic potential before executing the signal modeling process.
- the vertical axis on the right side of FIG. 25 shows the electrocardiographic potential of the model waveform.
- the electrocardiographic time series before the execution of the signal modeling process of FIG. 25 is a graph of the electrocardiographic potential of the heart with normal movement.
- the model waveform of FIG. 25 is a model waveform acquired by executing the signal modeling process based on the electrocardiographic time series before the signal modeling process of FIG. 25 is executed.
- FIG. 26 is a second diagram showing the correspondence between the electrocardiographic time series and the model waveform in the third modification.
- the horizontal axis of the graph in FIG. 26 indicates the elapsed time from the time of the origin.
- the vertical axis on the left side of FIG. 26 shows the electrocardiographic potential before executing the signal modeling process.
- the vertical axis on the right side of FIG. 26 shows the electrocardiographic potential of the model waveform.
- the electrocardiographic time series before the execution of the signal modeling process in FIG. 26 is a graph of the electrocardiographic potential of the heart in which stagnation (bradyarrhythmia) is occurring.
- the model waveform of FIG. 26 is a model waveform acquired by executing the signal modeling process based on the electrocardiographic time series before the signal modeling process of FIG. 26 is executed.
- FIG. 26 shows that the stagnation occurs during the period from time t8 to time t9.
- FIG. 27 is a third diagram showing the correspondence between the electrocardiographic time series and the model waveform in the third modification.
- the horizontal axis of the graph in FIG. 27 indicates the elapsed time from the time of the origin.
- the vertical axis on the left side of FIG. 27 shows the electrocardiographic potential before executing the signal modeling process.
- the vertical axis on the right side of FIG. 27 shows the electrocardiographic potential of the model waveform.
- the electrocardiographic time series before the execution of the signal modeling process in FIG. 27 is a graph of the electrocardiographic potential of the heart in which the ventricular extrasystole is occurring.
- the model waveform of FIG. 27 is a model waveform acquired by executing the signal modeling process based on the electrocardiographic time series before the signal modeling process of FIG. 27 is executed.
- FIG. 27 shows that premature ventricular contractions occur during the period from time t10 to time t11.
- FIG. 28 is a fourth diagram showing the correspondence between the electrocardiographic time series and the model waveform in the third modification.
- the horizontal axis of the graph of FIG. 28 indicates the elapsed time from the time of the origin.
- the vertical axis on the left side of FIG. 28 shows the electrocardiographic potential before executing the signal modeling process.
- the vertical axis on the right side of FIG. 28 shows the electrocardiographic potential of the model waveform.
- the electrocardiographic time series before the execution of the signal modeling process in FIG. 28 is a graph of the electrocardiographic potential of the heart in which the heart with ventricular tachycardia is occurring.
- the model waveform of FIG. 28 is a model waveform acquired by executing the signal modeling process based on the electrocardiographic time series before the signal modeling process of FIG. 28 is executed.
- FIG. 28 shows that ventricular tachycardia occurs after time t12.
- FIG. 29 is a first diagram showing the correspondence between the aortic blood flow time series and the model waveform in the third modified example.
- the horizontal axis of the graph in FIG. 29 indicates the elapsed time from the time of the origin.
- the vertical axis on the left side of FIG. 29 shows the aortic blood flow rate per unit time before executing the signal modeling process.
- the vertical axis on the right side of FIG. 29 shows the aortic blood flow rate per unit time indicated by the model waveform.
- the time series of aortic blood flow before executing the signal modeling process in FIG. 29 is a graph of aortic blood flow with normal movement.
- the model waveform of FIG. 29 is a model waveform acquired by executing the signal modeling process based on the aortic blood flow time series before the signal modeling process of FIG. 29 is executed.
- FIG. 30 is a second diagram showing the correspondence between the aortic blood flow time series and the model waveform in the third modified example.
- the horizontal axis of the graph in FIG. 30 indicates the elapsed time from the time of the origin.
- the vertical axis on the left side of FIG. 30 shows the aortic blood flow rate per unit time before executing the signal modeling process.
- the vertical axis on the right side of FIG. 30 shows the aortic blood flow rate per unit time indicated by the model waveform.
- the time series of aortic blood flow before executing the signal modeling process in FIG. 30 is a graph of the aortic blood flow in which stagnation occurs.
- FIG. 30 is a model waveform acquired by executing the signal modeling process based on the aortic blood flow time series before the signal modeling process of FIG. 29 is executed.
- FIG. 30 shows that the stagnation occurs during the period from time t13 to time t14.
- the estimation target 901 has a high probability of losing consciousness after time t14.
- FIG. 31 is an example of the functional configuration of the control unit 20 (hereinafter referred to as “control unit 20g”) that executes the signal modeling process as an example of the control units 20 and 20a to 20f that execute the signal modeling process in the third modification. It is a figure which shows.
- the control unit 20g is different from the control unit 20 in that it includes a signal modeling unit 380.
- the signal modeling unit 380 executes signal modeling processing on the cerebral blood flow correlation amount time series acquired by the time series acquisition unit 210.
- the cerebral blood flow correlation amount time series used in each process executed after the execution of signal shaping processes such as out-of-range data determination process, ventricular state estimation process, unconsciousness probability acquisition process, and consciousness loss determination process.
- each process executed after the execution of the signal modeling process also includes the grayout determination process.
- the unconsciousness estimation systems 100, 100a to 100e of the third modified example configured in this way execute the unconsciousness presumed probability acquisition process based on the cerebral blood flow correlation amount time series modeled based on the theory. .. Therefore, the consciousness loss estimation systems 100, 100a to 100e of the third modification can improve the accuracy of estimating the possibility of consciousness loss of the estimation target 901. Therefore, the unconsciousness estimation systems 100, 100a to 100e of the third modification configured in this way can reduce the risk caused by the unconsciousness.
- the unconsciousness estimation systems 100a to 100e of the third modified example configured in this way are out-of-range data determination processing and ventricular state estimation based on the cerebral blood flow correlation amount time series modeled based on the theory.
- the process, the loss of consciousness probability acquisition process, the loss of consciousness determination process, and the grayout determination process are executed. Therefore, the unconsciousness estimation systems 100a to 100e of the third modification configured in this way can reduce the risk caused by the unconsciousness.
- the conditions used for estimating the grayout condition, the ventricular state estimation condition, the probability determination condition, the reference probability, and the like may be conditions based on the personal information of the estimation target 901.
- the storage unit 23 stores in advance the conditions used for estimating the grayout condition, the ventricular state estimation condition, the probability determination condition, the reference probability, and the like, which have been adjusted in advance according to the estimation target 901.
- the personal information may be, for example, the age of the estimated target 901, the gender, the taste of food, the height, or the weight. However, it may be the body fat percentage, or the presence or absence of an underlying disease such as arteriosclerosis or carotid artery stenosis.
- step S113 does not necessarily have to be executed after step S112.
- the process of step S113 may be executed at any timing as long as it is before the execution of the process of step S114 and after the execution of the process of step S109.
- the process of step S113 may be executed before the process of step S111 is executed.
- the unit period is an example of one cycle.
- the unconsciousness estimation devices 2, 2a to 2e may be implemented by using a plurality of information processing devices that are communicably connected via a network.
- each functional unit included in the unconsciousness estimation devices 2 and 2a to 2e may be distributed and mounted in a plurality of information processing devices.
- All or part of the functions of the unconsciousness estimation devices 2 and 2a to 2e are performed by using hardware such as ASIC (Application Specific Integrated Circuit), PLD (Programmable Logic Device), and FPGA (Field Programmable Gate Array). It may be realized.
- the program may be recorded on a computer-readable recording medium.
- the computer-readable recording medium is, for example, a flexible disk, a magneto-optical disk, a portable medium such as a ROM or a CD-ROM, or a storage device such as a hard disk built in a computer system.
- the program may be transmitted over a telecommunication line.
Landscapes
- Health & Medical Sciences (AREA)
- Life Sciences & Earth Sciences (AREA)
- Cardiology (AREA)
- Engineering & Computer Science (AREA)
- Public Health (AREA)
- Surgery (AREA)
- Veterinary Medicine (AREA)
- Physics & Mathematics (AREA)
- General Health & Medical Sciences (AREA)
- Biophysics (AREA)
- Pathology (AREA)
- Biomedical Technology (AREA)
- Heart & Thoracic Surgery (AREA)
- Medical Informatics (AREA)
- Molecular Biology (AREA)
- Animal Behavior & Ethology (AREA)
- Physiology (AREA)
- Psychiatry (AREA)
- Computer Vision & Pattern Recognition (AREA)
- Signal Processing (AREA)
- Artificial Intelligence (AREA)
- Hematology (AREA)
- Anesthesiology (AREA)
- Measuring Pulse, Heart Rate, Blood Pressure Or Blood Flow (AREA)
- Measurement And Recording Of Electrical Phenomena And Electrical Characteristics Of The Living Body (AREA)
Abstract
本発明の一態様は、推定対象の脳血流量に相関を持つ量の時系列である脳血流相関量時系列に基づき前記推定対象の心室の状態が正常か否かを所定の繰り返し周期で推定する心室状態推定部と、前記脳血流相関量時系列の信頼度を推定する計測信頼度推定部と、前記信頼度と、前記心室状態推定部の推定結果と、前記繰り返し周期の開始の時点である推定開始時点以降に初めて前記心室状態推定部によって正常では無いと判定された時点である確率取得開始時点以降の経過時間とに基づき、前記推定対象が既に意識喪失である確率を示す意識喪失済み確率を取得する意識喪失済み確率取得部と、を備える意識喪失推定装置である。
Description
本発明は、意識喪失推定装置、意識喪失推定方法及びプログラムに関する。
作業中に意図せず意識を喪失することは、本人にとっても周りの人にとっても危険なことである。例えば、運転時にドライバーが意識を喪失した場合、本人を含め同乗者も車の周囲にいる人も危険にさらされてしまう(非特許文献1)。
篠原 一彰, 駒場 智美, 橋本 克彦, 伊藤 文人, 岡田 恵, 石田 時也, 横山 秀之, 松本 昭憲,「運転中に意識障害発作を発症した症例の検討」、自動車技術会論文集/ 45 巻 (2014) 6 号 p. 1105-1110
このような意識の喪失(以下「意識喪失」という。)が起きる前に、意識喪失が起きる可能性が高まっていることを本人や周囲の人が知ることができれば、意識喪失によって引き起こされる危険を減らすことができる。そのため、意識喪失の可能性を推定する精度を高めることが求められている。
上記事情に鑑み、本発明は、意識喪失の可能性を推定する精度を高める技術を提供することを目的としている。
本発明の一態様は、推定対象の脳血流量に相関を持つ量の時系列である脳血流相関量時系列に基づき前記推定対象の心室の状態が正常か否かを所定の繰り返し周期で推定する心室状態推定部と、前記脳血流相関量時系列の信頼度を推定する計測信頼度推定部と、前記信頼度と、前記心室状態推定部の推定結果と、前記繰り返し周期の開始の時点である推定開始時点以降に初めて前記心室状態推定部によって正常では無いと判定された時点である確率取得開始時点以降の経過時間とに基づき、前記推定対象が既に意識喪失である確率を示す意識喪失済み確率を取得する意識喪失済み確率取得部と、を備える意識喪失推定装置である。
本発明により、意識喪失の可能性を推定する精度を高めることが可能となる。
(第1実施形態)
図1は、第1実施形態の意識喪失推定システム100の概要を説明する説明図である。意識喪失推定システム100は、推定対象901が既に意識喪失である確率を推定する。推定対象901は人であってもよいし動物であってもよい。以下、説明の簡単のため推定対象901が人である場合を例に意識喪失推定システム100を説明する。
図1は、第1実施形態の意識喪失推定システム100の概要を説明する説明図である。意識喪失推定システム100は、推定対象901が既に意識喪失である確率を推定する。推定対象901は人であってもよいし動物であってもよい。以下、説明の簡単のため推定対象901が人である場合を例に意識喪失推定システム100を説明する。
意識喪失推定システム100は、生体センサ1を備える。生体センサ1は、測定対象である推定対象901の脳血流量に相関を持つ量(以下「脳血流相関量」という。)を測定する。意識喪失推定システム100は生体センサ1を用いて推定対象901の脳血流相関量の時系列(以下「脳血流相関量時系列」という。)を取得する。生体センサ1の詳細は後述する。
脳血流相関量は、推定対象901の脳血流量に相関を持つ量であればどのような量であってもよい。脳血流相関量は、例えば、心臓の電気的な活動の様子を示す量であってもよい。心臓の電気的な活動の様子を示す量は、例えば、心電図のグラフが示す電位(心電位)の時間変化である。すなわち、心臓の電気的な活動の様子を示す量は、心電位の時系列(以下「心電位時系列」という。)である。このような場合、脳血流相関量時系列は、心電図のグラフである。
脳血流相関量は、例えば、頸動脈や大動脈の血流量であってもよい。このような場合、脳血流相関量時系列は、大動脈血流量の時系列である。以下、説明の簡単のため脳血流相関量時系列が、心電位時系列である場合を例に、意識喪失推定システム100を説明する。
意識喪失推定システム100は、所定のタイミングで推定対象901の脳血流相関量時系列の取得を開始して以降は、所定の繰り返し周期(以下「推定周期」という。)で推定対象901の脳血流相関量時系列を繰り返し取得する。以下、推定対象901の脳血流相関量時系列を推定周期で繰り返し取得する処理が開始された時点を推定開始時点という。以下、脳血流相関量時系列が取得されてから次に脳血流相関量時系列が取得されるまでの期間を単位期間という。
意識喪失推定システム100は、推定開始時点以降、脳血流相関量時系列を取得するたびに、後述する範囲外データ判定処理及び心室状態推定処理をそれぞれ1回実行する。
意識喪失推定システム100は、確率取得開始時点以降は、脳血流相関量時系列を取得するたびに範囲外データ判定処理及び心室状態推定処理にくわえて更に後述する意識喪失済み確率取得処理及び意識喪失判定処理をそれぞれ1回実行する。
確率取得開始時点は、意識喪失推定システム100が推定対象901の脳相関量時系列の取得を開始して以降初めて、推定対象901の心室の状態が正常では無いと判定された時点である。
また、意識喪失推定システム100は、遅くとも確率取得開始時点以降は、後述する計測信頼度推定処理を実行する。
以下、図1を用いて、意識喪失推定システム100の概要の説明とともに、範囲外データ判定処理、心室状態推定処理、計測信頼度推定処理、意識喪失済み確率取得処理及び意識喪失判定処理を説明する。
意識喪失推定システム100は、推定開始時点以降、範囲外データ判定処理を推定周期で繰り返し実行する。範囲外データ判定処理は、脳血流相関量時系列に基づき、脳血流相関量時系列の各データの示す脳血流相関量が各データの時刻位置に応じた範囲(以下「閾値領域」という。)の範囲外か否かを判定する処理である。時刻位置とは、脳血流相関量時系列の各データ(以下「脳血流相関量点データ」という。)の時間軸方向の位置である。
意識喪失推定システム100は、範囲外データ判定処理の実行により、各脳血流相関量点データについて、それぞれ範囲外データか否かを判定する。範囲外データは、閾値領域の範囲外の脳血流相関量点データである。
閾値領域は、少なくとも上限値及び下限値を有する範囲である。閾値領域の上限値を以下、上閾値という。閾値領域の下限値を以下、下閾値という。
閾値領域は、閾値領域が決定される時刻位置を含む第1の長さの期間内における脳血流相関量点データの分布に応じて決定される。以下、第1の長さの期間を第1期間という。第1の長さ(すなわち第1期間の長さ)は、第1期間内に複数の予め定められた所定の数以上の脳血流相関量点データを有する時間であればよい。第1の長さは、例えば、3秒である。
上閾値は、例えば、閾値領域が決定される時刻位置を含む第1期間内の脳血流相関量点データが示す脳血流相関量の平均値をMとし標準偏差をVとした場合に、(M+V)である。下閾値は、例えば、閾値領域が決定される時刻位置を含む第1期間内の脳血流相関量点データが示す脳血流相関量の平均値をMとし標準偏差をVとした場合に、(M-V)である。
なお、閾値領域上限値及び閾値領域下限値の算出は必ずしも平均値Mと標準偏差Vに限定されず、標準偏差Vに定数(補正値)を掛けて検出感度を調整しても良く、関数で変換しても良い。また(脳血流相関量の)分散や勾配を基に算出しても良く、生体信号以外の機器や環境データ、連続性(観測値の欠損の有無)により調整しても良い。
閾値領域の範囲外であるとは、値が下閾値未満であるか、又は、上閾値より大きいかのいずれか一方であることを意味する。
図2は、第1実施形態における上閾値と、下閾値と、閾値領域と範囲外データとを示す図である。図2は、脳血流相関量時系列の一例として心電位時系列を示す。図2の横軸は原点の時刻からの経過時間を示す。図2の縦軸は心電位を示す。図2は、上閾値と下閾値とを示す。図2に示すように、上閾値及び下閾値は、全ての時刻で必ずしも同一では無い。
図2において、D1、D2及びD3が示す心電位の範囲は、それぞれ時刻T1、時刻T2及び時刻T3における閾値領域である。図2に示すように、閾値領域が示す心電位の範囲は、全ての時刻で必ずしも同一では無い。図2は、範囲外データと判定された脳血流相関量点データの集合を示す。
図1の説明に戻る。意識喪失推定システム100は、推定開始時点以降、心室状態推定処理を推定周期で実行する。心室状態推定処理は、単位期間中に範囲外データ判定処理の実行後に実行される。心室状態推定処理は、正常心室状態推定処理と異常心室状態推定処理とを含む。心室状態推定処理においては、まず正常心室状態推定処理が実行され、正常心室状態推定処理の結果に応じて異常心室状態推定処理が実行される。
正常心室状態推定処理では、まず、範囲外データ判定処理の判定結果に基づいて、推定対象901の心室の状態が正常か否か、が判定される。正常心室状態推定処理では、推定対象901の心室の状態が正常であると判定された場合に、推定対象901の心室の状態が正常であると推定される。
異常心室状態推定処理は、正常心室状態推定処理によって正常では無い(すなわち異常)と推定された場合に実行される。異常心室状態推定処理は、脳血流相関量時系列に基づいて、推定対象901の心室の状態が予め定められた所定の異常心室状態のいずれの心室の状態であるかを推定する処理である。
異常心室状態は、意識喪失に係る心室の状態である。予め定められた異常心室状態は、意識喪失に係る心室の状態であればどのような心室の状態であってもよい。異常心室状態は、例えば、心室性頻拍が生じている心室の状態である。異常心室状態は、例えば、心室細動が生じている心室の状態であってもよい。以下、説明の簡単のため、予め定められた異常心室状態が、心室性頻拍である場合と心室細動である場合とを例に意識喪失推定システム100を説明する。
意識喪失推定システム100は、このように、心室状態推定処理の実行によって、推定対象901の心室の状態を推定する。
推定開始時点以降に初めて心室状態推定処理の実行によって心室の状態が正常では無いと推定された場合、意識喪失推定システム100は警告を伝達先に伝達する。以下、心室状態推定処理によって心室の状態が異常であると判定された場合に伝達先に伝達される警告を第1警告という。第1警告は、具体的には、推定対象901が意識喪失である確率が高いことを示す情報である。
伝達先は、例えば、管理者902や、推定対象901自身である。伝達先は管理者902や推定対象901だけでなく、自動停止装置や自動操縦システムなどの安全装置であっても良い。
推定開始時点以降に正常心室状態推定処理によって心室の状態が正常では無いと初めて推定されて以降、意識喪失推定システム100は意識喪失済み確率取得処理を推定周期で繰り返し実行することを開始する。そのため、推定開始時点以降に正常心室状態推定処理によって心室の状態が正常では無いと初めて推定された時点が、確率取得開始時点である。意識喪失済み確率取得処理は、意識喪失済み確率を取得する処理である。
意識喪失済み確率は、推定対象901が既に意識喪失の状態である確率であって、確率取得開始時点からの経過時間と測定環境の変化と意識喪失推定システム100が取得する脳血流相関時系列の変化として現れる推定対象901の状態の変化とに応じた確率である。意識喪失済み確率は、意識喪失の可能性を示す指標である。
以下、意識喪失推定システム100が取得する脳血流相関時系列の変化として現れる推定対象901の状態を、意識喪失関連状態という。意識喪失関連状態の変化が生じたか否かは具体的には、心室状態推定処理によって推定される。
測定環境とは具体的には、生体センサ1等の推定対象901の脳血流相関量時系列の取得に係る装置(以下「取得関連装置」という。)の状態である。取得関連装置は、例えば意識喪失推定システム100において生体センサ1の情報が通信路を使って伝送先に伝送される場合には通信路を含む。
測定環境の変化とは、取得関連装置の状態が変化することである。測定環境の変化は例えば、取得関連装置の動作の正常な動作から異常な動作への変化である。異常な動作は、例えば取得関連装置が壊れた場合に生じる。取得環境の変化は例えば、生体センサ1が推定対象901に取り付いた電極を用いて脳血流相関量を測定する装置である場合に、生体センサ1の電極が推定対象901から外れるという変化であってもよい。
取得関連装置の動作が異常である場合には、取得関連装置が出力した脳血流相関量時系列の信頼度(以下「計測信頼度」という。)は取得関連装置の動作が正常である場合よりも低い。意識喪失済み確率は推定対象901が既に意識喪失の状態である確率であるので、推定対象901の意識喪失関連状態に変化はないものの取得関連装置の動作が正常から異常に変化した場合には意識喪失済み確率は下がる。
また、意識喪失済み確率は推定対象901が既に意識喪失の状態である確率であるので、測定環境の変化は無いものの意識喪失関連状態が異常な状態から正常な状態に変化した場合には意識喪失済み確率は下がる。意識喪失関連状態が異常な状態とは例えば、推定対象901の心臓の動きが異常である状態である。
ところで、確率取得開始時点以降に測定環境及び推定対象901の状態に変化が無い場合、推定対象901に意識喪失が生じる確率は時間が経過するごとに高まる。そのため、測定環境と推定対象901の意識喪失関連状態とに変化が無い場合、意識喪失済み確率は時間が経過するごとに増大する。
意識喪失済み確率は、心室状態推定処理の推定結果の信頼度を示す値でもある。例えば、確率取得開始時点以降に測定環境と推定対象901の心室の状態とに変化が無い場合、表示される意識喪失済み確率は時間の経過とともに高まる確率を示す。
意識喪失済み確率の表示の具体例の1つは、図1におけるグラフG1である。グラフG1の横軸は時間を示す。グラフG1の縦軸は意識喪失済み確率を示す。グラフG1における時間t1は、確率取得開始時点である。そのため、グラフG1における時間t1は、意識喪失済み確率取得処理が開始された時点の一例である。グラフG1の時間軸上の原点は、推定開始時点の一例である。
なお、意識喪失済み確率は、あくまで確率である。そのため、意識喪失済み確率が高かったとしても、推定対象901は意識喪失していない場合もある。
確率取得開始時点以降に、意識喪失推定システム100は意識喪失判定処理を推定周期で繰り返し実行する。意識喪失判定処理は、意識喪失済み確率が予め定められた所定の確率(以下「基準確率」という。)以上か否かを判定する処理である。
意識喪失済み確率が基準確率以上である場合、意識喪失推定システム100は警告を伝達先に伝達する。以下、意識喪失済み確率が基準確率以上である場合に伝達先に伝達される警告を第2警告という。第2警告は、具体的には、推定対象901が意識喪失である確率が高いことを示す情報である。
意識喪失済み確率が基準確率以上である場合、意識喪失推定システム100は第2警告だけでなく、意識喪失済み確率そのものを伝達先に伝達してもよい。
伝達先は、例えば、管理者902や、推定対象901自身である。伝達先は管理者902や推定対象901だけでなく、自動停止装置や自動操縦システムなどの安全装置であっても良い。
意識喪失済み確率が基準確率未満である場合、意識喪失推定システム100は、警告を伝達先に伝達することなく、意識喪失済み確率取得処理を実行する。ただし、意識喪失済み確率が一度でも基準確率以上になって以降は、例え、意識喪失済み確率が基準確率未満であっても、意識喪失推定システム100は第2警告を伝達してもよい。
意識喪失推定システム100は、遅くとも確率取得開始時点以降には、計測信頼度推定処理を実行する。計測信頼度推定処理は、脳血流相関量時系列に基づき計測信頼度を推定する処理である。計測信頼度推定処理は、例えば、脳血流相関量時系列の示す所定の指標の値が取得関連装置の故障時の値である場合に、取得関連装置が故障していない場合よりも計測信頼度は低いと推定する処理である。
脳血流相関量時系列の示す所定の指標は、例えば、心電位時系列が示す心電位である。例えば心電位が装置の測定限界以上の値である場合に、計測信頼度推定処理では、取得関連装置が故障していると推定される。
図3は、第1実施形態の意識喪失推定システム100のシステム構成の一例を示す図である。意識喪失推定システム100は、生体センサ1及び意識喪失推定装置2を備える。
生体センサ1は、測定対象の脳血流相関量を推定周期よりも短い所定の時間間隔で繰り返し測定する。生体センサ1の測定結果は、脳血流相関量時系列である。生体センサ1は、測定結果を意識喪失推定装置2に出力する。生体センサ1は、例えば、心拍センサである。
意識喪失推定装置2は、生体センサ1が取得した脳血流相関量時系列を推定周期で繰り返し取得する。意識喪失推定装置2は、脳血流相関量時系列に基づき、範囲外データ判定処理、心室状態推定処理、意識喪失済み確率取得処理及び意識喪失判定処理を実行する。
意識喪失推定装置2は、バスで接続されたCPU(Central Processing Unit)等のプロセッサ91とメモリ92とを備える制御部20を備え、プログラムを実行する。意識喪失推定装置2は、プログラムの実行によって制御部20、通信部21、入力部22、記憶部23及び出力部24を備える装置として機能する。
より具体的には、意識喪失推定装置2は、プロセッサ91が記憶部23に記憶されているプログラムを読み出し、読み出したプログラムをメモリ92に記憶させる。プロセッサ91が、メモリ92に記憶させたプログラムを実行することによって、意識喪失推定装置2は、制御部20、通信部21、入力部22、記憶部23及び出力部24を備える装置として機能する。
制御部20は、自装置(意識喪失推定装置2)が備える各機能部の動作を制御する。制御部20は、例えば、推定周期で脳血流相関量時系列を取得する。推定周期の逆数(すなわちサンプリングレート)は、例えば1kHzである。制御部20は、例えば、範囲外データ判定処理、心室状態推定処理、意識喪失済み確率取得処理及び意識喪失判定処理を実行する。
通信部21は、自装置を生体センサ1に接続するための通信インタフェースを含んで構成される。通信部21は、例えばネットワークを介して生体センサ1と通信する。通信部21は、生体センサ1との通信によって、生体センサ1から脳血流相関量時系列を取得する。
入力部22は、マウスやキーボード、タッチパネル等の入力装置を含んで構成される。入力部22は、これらの入力装置を自装置に接続するインタフェースとして構成されてもよい。
記憶部23は、磁気ハードディスク装置や半導体記憶装置などの記憶装置を用いて構成される。記憶部23は意識喪失推定装置2に関する各種情報を記憶する。記憶部23は、例えば、生体センサ1が出力した脳血流相関量時系列の履歴を記憶する。記憶部23は、例えば、意識喪失推定装置2の動作を制御するプログラムを予め記憶する。
記憶部23は、例えば、推定開始時点を示す情報を記憶する。記憶部23は、例えば、確率取得開始時点を示す情報を記憶する。記憶部23は、例えば、意識喪失済み確率の履歴を記憶する。
出力部24は、CRT(Cathode Ray Tube)ディスプレイ、液晶ディスプレイ、有機EL(Electro-Luminescence)ディスプレイ等の表示装置や、スピーカー等の音声出力装置等の情報の出力装置を含んで構成される。出力部24は、これらの出力装置を自装置に接続するインタフェースとして構成されてもよい。出力部24は、意識喪失推定装置2に関する情報を出力する。出力部24は、例えば、入力部22に入力された情報を出力する。出力部24は、例えば、第1警告を出力する。出力部24は、例えば、第2警告を出力する。出力部24は、例えば、意識喪失済み確率を出力する。出力部24は、例えば、計測信頼度を出力する。出力部24が出力する情報は、管理者902や、推定対象901自身等の伝達先が取得する。
図4は、第1実施形態における制御部20の機能構成の一例を示す図である。制御部20は、時系列取得部210、範囲外データ判定部220、心室状態推定部230、確率取得処理実行判定部240、確率取得条件取得部250、計測信頼度推定部260、意識喪失済み確率取得部270、意識喪失判定部280、出力制御部290及び記録部300を備える。
時系列取得部210は、通信部21を介して脳血流相関量時系列を推定周期で繰り返し取得する。
範囲外データ判定部220は、時系列取得部210が取得した脳血流相関量時系列に対して範囲外データ判定処理を実行する。範囲外データ判定部220は、範囲外データ判定処理の一部の処理として、閾値領域決定処理を実行する。閾値領域決定処理は、各時刻位置の閾値領域を決定する処理である。閾値領域決定処理は、より具体的には、閾値領域が決定される時刻位置を含む第1期間内における脳血流相関量点データ分布に応じて決定対象の閾値領域を決定する処理である。
範囲外データ判定部220は、第1区分部221、分布取得部222、閾値領域決定部223及び範囲外データ内判定部224を備える。
第1区分部221は、脳血流相関量時系列を複数の第1期間によって時間軸方向に区分する。
分布取得部222は、脳血流相関量点データ統計量を第1期間ごとに取得する。脳血流相関量点データ統計量は、第1期間ごとの量であって各第1期間に属する脳血流相関量点データが示す脳血流相関量の分布に関する統計量である。分布に関する統計量は、分布を表すことができればどのような統計量であってもよい。
分布に関する統計量は、例えば、平均値及び偏差である。偏差は、平均値からのずれを示す統計量であればどのような統計量であってもよく、例えば、標準偏差であってもよい。以下、説明の簡単のため脳血流相関量点データ統計量が平均値及び標準偏差である場合を例に意識喪失推定システム100を説明する。
閾値領域決定部223は、脳血流相関量点データ統計量に基づいて第1期間ごとに閾値領域を決定する。
第1区分部221、分布取得部222及び閾値領域決定部223が実行する一連の処理によって、各第1期間における閾値領域が決定される処理が、閾値領域決定処理である。
範囲外データ内判定部224は、閾値領域決定処理によって決定された閾値領域を用いて、各脳血流相関量点データがそれぞれ範囲外データか否かを判定する。
閾値領域決定処理と範囲外データ内判定部224が実行する処理とによって、各脳血流相関量点データがそれぞれ範囲外データか否かを判定する処理が範囲外データ判定処理である。
心室状態推定部230は、心室状態推定処理を実行する。心室状態推定部230は、第2区分部231、時間積算部232、ピーク期間判定部233、正常心室状態推定部234及び異常心室状態推定部235を備える。
第2区分部231は、複数の第2期間によって脳血流相関量時系列を区分する。第2期間の長さは、一部又は全部の時間位置を共有する第1期間の長さよりも短い。第2期間の長さは、例えば、200ミリ秒である。
時間積算部232は、第2期間ごとに、範囲外データのみを含む期間の長さを積算する。以下、範囲外データのみを含む期間の長さの合計値(すなわち積算時間)を、範囲外時間という。
ピーク期間判定部233は、第2期間ごとに範囲外時間が所定の時間(以下「閾値時間」という。)を超えているか否かを判定する。閾値時間は、第2期間の長さよりも短い時間である。第2期間の長さが200ミリ秒である場合、閾値時間は、例えば、50ミリ秒である。以下、ピーク期間判定部233によって、範囲外時間が閾値時間よりも長いと判定された第2期間をピーク期間という。
正常心室状態推定部234は、正常心室状態推定処理を実行する。具体的には、正常心室状態推定部234は、ピーク期間の脳血流相関量時系列における出現の仕方に基づいて、推定対象901の心室の状態が正常か異常かを判定する。
具体的には、正常心室状態推定部234は、例えば、時間軸方向の隣接する所定数の第2期間がピーク期間である場合に、推定対象901の心室の状態が正常では無いと判定する。すなわち、正常心室状態推定部234は、ピーク期間が時間軸方向に所定数連続する、という条件が満たされた場合に推定対象901の心室の状態が正常では無いと判定する。
所定数は、例えば、5回である。例えば第2期間の長さが200ミリ秒であり閾値時間が50ミリ秒である場合であって時間軸方向の隣接する5つの第2期間がピーク期間である場合、正常心室状態推定部234は、推定対象901の心室の状態は正常では無いと判定する。
なお、医学的には、第2期間の長さが200ミリ秒であり閾値時間が50ミリ秒である場合であって時間軸方向の隣接する5つの第2期間がピーク期間である場合、推定対象901の心室の状態は、心室性頻拍又は心室細動が生じた状態である。すなわち、第2期間の長さが200ミリ秒であり閾値時間が50ミリ秒である場合であって時間軸方向の隣接する5つの第2期間がピーク期間であるという条件は、医学的な観点で見て推定対象901の心室の状態が正常では無い条件である。
ところで推定対象901の心室の状態が正常である状態は医学的な観点で見て、心拍間隔が医学的に知られた所定の範囲(以下「基準頻度範囲」という。)内にあるという条件に同値である。
そのため、正常心室状態推定部234による推定対象901の心室の状態が正常か異常かを判定する処理は、心拍間隔が基準頻度範囲内から否かを判定する処理に同値である。
正常心室状態推定部234は、推定対象901の心室の状態が正常であると判定した場合に、推定対象901の心室の状態が正常であると推定する。
異常心室状態推定部235は、正常心室状態推定部234によって推定対象901の心室の状態が異常であると判定された場合に、異常心室状態推定処理を実行する。
具体的には、異常心室状態推定部235は異常心室状態推定処理において、まず、脳血流相関量時系列に基づき脳血流相関量時系列が示す心拍間隔に関する値(以下「心拍間隔関連値」という。)を取得する。異常心室状態推定部235は異常心室状態推定処理において、次に、取得した心拍間隔関連値に基づき推定対象901の異常心室状態を推定する。
心拍間隔関連値は例えば、心拍間隔そのものである。心拍間隔関連値が心拍間隔である場合、異常心室状態推定部235は、ピーク期間の出現の頻度が第1基準頻度より高い場合に、推定対象901の心室の状態が心室細動の状態であると推定する。第1基準頻度は、基準頻度範囲内の値の最高値である。また、心拍間隔関連値が心拍間隔である場合、異常心室状態推定部235は、ピーク期間の出現の頻度が、第2基準頻度未満である場合に、推定対象901の心室の状態が心室性頻拍の状態であると推定する。第2基準頻度は、基準頻度範囲内の値の最小値である。
心拍間隔関連値は例えば、心拍出量であってもよい。心拍間隔関連値は例えば、臓器血流量であってもよい。
なお、心拍間隔は、例えば、閾値と変曲点の組み合わせから取得したR棘ピーク点を取得し、次のR棘ピーク点との時間間隔を計測する方法によって取得される。
なお、時間当たりの心拍出量は、例えば、心拍出量計によって観測したヒトの一回心拍出量標準値と、フランクスターリングの法則により補正した一回拍出量に心拍数を乗算した値に基づき推定される。
なお、臓器血流量は、深部血流量計と連続血圧計と姿勢や環境センサとを用いて観測された血圧と臓器の標準血流量との関係を示す予め記憶部23に記憶済みの情報(以下「臓器血流量関係情報」という。)を用いて推定される。より具体的には、臓器血流量は、臓器血流量関係情報に基づき脳血流とそれ以外の臓器の血流との比率を推定することで推定される。臓器血流量は、脳や心臓等の意識喪失に密接に係る臓器を流れる血流量および血液分布に関する量である。脳や心臓等の意識喪失に密接に係るとは脳神経組織の血液循環に関与する臓器及び循環調節機能を指し、具体的には脳、心臓、頭頚部及び胸部血管、肺、ならびにこれらの循環調節機能を意味する。
第2区分部231から異常心室状態推定部235までの心室状態推定部230が備える各機能部による一連の処理は、心室状態推定処理の一例である。
確率取得処理実行判定部240は、意識喪失済み確率取得処理を実行するか否かを判定する。具体的には、確率取得処理実行判定部240は、意識喪失済み確率取得処理を実行するか否かを判定するタイミングが確率取得開始時点以降である場合に、意識喪失済み確率取得処理を実行すると判定する。確率取得処理実行判定部240は、意識喪失済み確率取得処理を実行するか否かを判定するタイミングが確率取得開始時点以降では無い場合に、意識喪失済み確率取得処理を実行しないと判定する。
確率取得条件取得部250は、心室状態推定部230の推定結果と、予め記憶部23に記憶された心室状態と確率決定条件との関係を示す情報とに基づいて、確率決定条件を示す情報を取得する。確率決定条件は、確率取得開始時点からの経過時間と測定環境の変化と脳血流相関時系列の変化として現れる推定対象901の状態の変化との組合せごとの条件であって意識喪失済み確率の変化量を与える条件を含む。
確率決定条件は、例えば、確率取得開始時点からの経過時間が単位時間変化した場合における意識喪失済み確率の変化量を与える条件である。確率決定条件は、意識喪失済み確率の初期値を示す条件も含む。意識喪失済み確率の初期値とは、確率取得開始時点の直後の意識喪失済み確率である。
計測信頼度推定部260は、計測信頼度推定処理を実行する。計測信頼度推定部260は、計測信頼度推定処理の実行により計測信頼度を推定する。
意識喪失済み確率取得部270は、意識喪失済み確率取得処理を実行する。具体的には、意識喪失済み確率取得部270は、確率取得条件取得部250が取得した確率取得条件と、計測信頼度推定部260が推定した計測信頼度と、確率取得開始時点からの経過時間と、確率取得開始時点以降の心室状態推定部230の推定結果とに基づき意識喪失済み確率を取得する。
例えば、計測信頼度が基準信頼度以上の場合であり心室状態推定部230が推定対象901の心室の状態が異常であると判定した場合に意識喪失済み確率取得部270が取得する意識喪失済み確率は、直前の単位期間において取得された意識喪失済み確率よりも高い。基準信頼度は予め定められた値である。
例えば、計測信頼度が基準信頼以上の場合であり心室状態推定部230が推定対象901の心室の状態が正常であると判定した場合に意識喪失済み確率取得部270が取得する意識喪失済み確率は、直前の単位期間において取得された意識喪失済み確率よりも低い。
例えば、計測信頼度が基準信頼未満の場合に意識喪失済み確率取得部270が取得する意識喪失済み確率は、直前の単位期間において取得された意識喪失済み確率よりも低い。
意識喪失判定部280は、意識喪失判定処理を実行する。
出力制御部290は、出力部24の動作を制御する。出力制御部290は、例えば、出力部24の動作を制御して出力部24に第1警告を出力させる。出力制御部290は、例えば、出力部24の動作を制御して出力部24に第2警告を出力させる。出力制御部290は、例えば、出力部24の動作を制御して出力部24に意識喪失済み確率を出力させる。出力制御部290は、例えば、出力部24の動作を制御して出力部24に計測信頼度を出力させる。
記録部300は、各種情報を記憶部23に記録する。記録部300は例えば、推定開始時点を示す情報を記憶部23に記録する。記録部300は例えば、確率取得開始時点を示す情報を記憶部23に記録する。記録部300は例えば、心室状態推定部230の推定結果を記憶部23に記録する。記録部300は例えば、確率取得条件取得部250が取得した確率条件を記憶部23に記録する。
記録部300は例えば、計測信頼度推定部260が推定した計測信頼度を記憶部23に記録する。記録部300は例えば、意識喪失済み確率取得部270が取得した意識喪失済み確率を記憶部23に記録する。記録部300は例えば、意識喪失判定部280の判定結果を記憶部23に記録する。
図5は、第1実施形態における意識喪失推定システム100が実行する処理の流れの一例を示すフローチャートである。図5は、1つの単位期間において実行される処理の流れを示すフローチャートである。そのため、意識喪失推定システム100では図5に示すフローチャートが推定周期で繰り返し実行される。
また、意識喪失推定システム100による図5に示すフローチャートの実行中には、生体センサ1が脳血流相関量時系列を取得する処理が所定のタイミングで繰り返し実行されている。
また、意識喪失推定システム100による図5に示すフローチャートの実行中には、時系列取得部210が脳血流相関量時系列を取得する処理も所定の時間間隔で繰り返し実行されている。また、図5に示すフローチャートの各処理の実行後には、各処理の実行結果を示す情報を記録部300が記憶部23に記録している。例えば、記録部300は、確率取得開始時点を示す情報を確率取得開始時点において記憶部23に記録する。
時系列取得部210が、生体センサ1が取得した脳血流相関量時系列を取得する(ステップS101)。ステップS101の処理の実行によって、単位期間の処理が開始される。
ステップS101の次に、第1区分部221が、脳血流相関量時系列を複数の第1期間によって時間軸方向に区分する(ステップS102)。次に、分布取得部222が、脳血流相関量点データ統計量を第1期間ごとに取得する(ステップS103)。次に、閾値領域決定部223が脳血流相関量点データ統計量に基づき各第1期間ごとに閾値領域を決定する(ステップS104)。
次に、範囲外データ内判定部224が、脳血流相関量時系列の各脳血流相関量点データについて、範囲外データであるか否かを判定する(ステップS105)。ステップS102~ステップS104の処理が閾値領域決定処理であり、ステップS102~ステップS105の処理が範囲外データ判定処理である。ステップS102~ステップS105の流れが示すように、閾値領域決定処理は、ステップS105の実行前に実行される。
次に、第2区分部231が、複数の第2期間によって脳血流相関量時系列を区分する(ステップS106)。次に、時間積算部232が、第2期間ごとに、範囲外時間を取得する(ステップS107)。次に、ピーク期間判定部233が、各第2期間について、ピーク期間であるか否かを判定する(ステップS108)。
次に、正常心室状態推定部234が推定対象901の心室の状態が正常か異常かを判定する(ステップS109)。推定対象901の心室の状態が正常では無い場合(ステップS109:NO)、出力制御部290は、出力部24の動作を制御して出力部24に第1警告を出力させる(ステップS110)。次に、異常心室状態推定部235が異常心室状態推定処理を実行する(ステップS111)。異常心室状態推定部235は、異常心室状態推定処理の実行により推定対象901の心室の状態がいずれの異常心室状態であるかを推定する。
ステップS106~ステップS111の一連の処理が、心室状態推定処理の一例である。
ステップS111の次に、確率取得条件取得部250が異常心室状態推定部235の推定結果に基づき確率取得条件を取得する(ステップS112)。次に計測信頼度推定部260が、脳血流相関量時系列に基づき計測信頼度を推定する(ステップS113)。次に、意識喪失済み確率取得部270が、意識喪失済み確率を取得する(ステップS114)。
次に、出力部24の動作を制御して出力部24に意識喪失済み確率を表示等により出力させる(ステップS115)。次に、意識喪失判定部280が、意識喪失済み確率が基準確率以上か否かを判定する(ステップS116)。
意識喪失済み確率が基準確率以上である場合(ステップS116:YES)、出力制御部290は、出力部24の動作を制御して出力部24に第2警告を出力させる(ステップS117)。一方、意識喪失済み確率が基準確率未満である場合(ステップS116:NO)、第2警告が出力されることなく単位期間における処理が終了する。
一方、推定対象901の心室の状態が正常である場合(ステップS109:YES)、確率取得処理実行判定部240が、意識喪失済み確率取得処理を実行するか否かを判定する(ステップS118)。具体的には、確率取得処理実行判定部240は、意識喪失済み確率取得処理を実行するか否かを判定するタイミングが確率取得開始時点以降か否かを判定する。
意識喪失済み確率取得処理を実行するか否かを判定するタイミングが確率取得開始時点以降である場合(ステップS118:YES)、ステップS114の処理が実行される。一方、意識喪失済み確率取得処理を実行するか否かを判定するタイミングが確率取得開始時点以降では無い場合(ステップS118:NO)、意識喪失済み確率が取得されることなく単位期間における処理が終了する。
なお、ステップS109において、推定対象901の心室の状態が正常であると判定された場合、出力制御部290は、出力部24の動作を制御して出力部24に推定対象901の心室の状態が正常であることを示す情報を出力させてもよい。
<意識喪失済み確率と脳血流相関量時系列との関係について>
ここで意識喪失済み確率と脳血流相関量時系列との関係を図6~図9を用いて説明する。なお、図6~図9における意識喪失済み確率のグラフは、ステップS115の処理において出力部24が出力する意識喪失済み確率の一例である。図6~図9における心電位時系列と脳血流量の変化のグラフとはそれぞれ脳血流相関量時系列の一例である。
図6は、第1実施形態における意識喪失済み確率と脳血流相関量時系列との関係を説明する第1の説明図である。
図6は、心電位時系列と、脳血流量の変化のグラフと、確率取得開始時点以降か否かを示す情報(以下「期間情報」という。)と、意識喪失済み確率のグラフとを同一時間軸上に表した図である。図6の横軸は、時刻を示す。そのため、図6の横軸は、原点の時刻を0とした場合における原点の時刻からの時間経過を示す。図6の原点の時刻は、推定開始時点の一例である。期間情報は、横軸の各時刻が確率取得開始時点以降の時刻か否かを示す。図6においてONは、時刻が確率取得開始時点以降の時刻であることを示す。図6においてOFFは、時刻が確率取得開始時点より前の時刻であることを示す。
図6の時刻t2は、確率取得開始時点の一例である。図6は、確率取得開始時点以降の期間に心電位の時間変化が無い場合、脳血流量は時間とともに下がることを示す。図6は、心電位の時間変化が無い場合、意識喪失済み確率が時間に比例して上昇することを示す。図6は、時刻t3に心停止が起きたことを示す。
図7は、第1実施形態における意識喪失済み確率と脳血流相関量時系列との関係を説明する第2の説明図である。
図7は、心電位時系列と、脳血流量の変化のグラフと、期間情報と、意識喪失済み確率のグラフとを同一時間軸上に表した図である。図7の横軸は、時刻を示す。そのため、図7の横軸は、原点の時刻を0とした場合における原点の時刻からの時間経過を示す。図7の原点の時刻は、推定開始時点の一例である。期間情報は、横軸の各時刻が確率取得開始時点以降の時刻か否かを示す。
図7の時刻t4は、確率取得開始時点の一例である。図7は、時間経過とともに心拍間隔が基準頻度範囲に含まれなくなる心電位時系列の一例を示す。図7は、意識喪失済み確率は、確率取得開始時点以降、時刻t5まで時間に比例して上昇することを示す。時刻t5は、予め定められた意識喪失済み確率の上限値に意識喪失済み確率が達した時刻である。
図8は、第1実施形態における意識喪失済み確率と脳血流相関量時系列との関係を説明する第3の説明図である。
図8は、心電位時系列と、脳血流量の変化のグラフと、期間情報と、意識喪失済み確率のグラフとを同一時間軸上に表した図である。図8の横軸は、時刻を示す。そのため、図8の横軸は、原点の時刻を0とした場合における原点の時刻からの時間経過を示す。図8の原点の時刻は、推定開始時点の一例である。期間情報は、横軸の各時刻が確率取得開始時点以降の時刻か否かを示す。
図8の時刻t6は、確率取得開始時点の一例である。図8のt7は、心拍が生じたために、心室状態推定部によって推定対象901の心室の状態が正常であると判定された時刻である。そのため、図8のt7においては、意識喪失済み確率が下がる。
図9は、第1実施形態における意識喪失済み確率と脳血流相関量時系列との関係を説明する第4の説明図である。
図9は、心電位時系列と、脳血流量の変化のグラフと、期間情報と、意識喪失済み確率のグラフとを同一時間軸上に表した図である。図9の横軸は、時刻を示す。そのため、図9の横軸は、原点の時刻を0とした場合における原点の時刻からの時間経過を示す。図9の原点の時刻は、推定開始時点の一例である。期間情報は、横軸の各時刻が確率取得開始時点以降の時刻か否かを示す。
図9は、心臓の動きが安定しているため心電位に乱れはなく、脳血流量も安定していることを示す。すなわち、図9は、心電位時系列の示す推定対象901の心室の状態が正常であり続けていることを示す。図9は、推定対象901の心室の状態が正常であり続けているため期間情報がOFFのままであり、意識喪失済み確率が取得されていないことを示す。
ここまでで意識喪失済み確率と脳血流相関量時系列との関係の説明を終了する。
このように構成された第1実施形態の意識喪失推定システム100は、脳血流相関量時系列の各データの時間軸方向の位置を含む所定の期間内のデータに基づいて、各データの時間軸方向の位置に応じた閾値領域を決定する。そして、意識喪失推定システム100は、決定した閾値領域に基づいて既に意識喪失である確率を推定する。そのため、意識喪失推定システム100は、推定対象901の意識喪失の可能性を推定する精度を高めることができる。そのため、このように構成された第1実施形態の意識喪失推定システム100は、意識喪失によって引き起こされる危険を減らすことができる。
また、このように構成された第1実施形態の意識喪失推定システム100は、推定結果の意識喪失の可能性を出力部24によって出力する。既に意識喪失である確率が出力されるため、推定対象901は意識喪失が起きる前に意識喪失によって引き起こされる危険を減らす行動をとることができる。そのため、このように構成された第1実施形態の意識喪失推定システム100は、意識喪失によって引き起こされる危険を減らすことができる。
なお、正常心室状態推定部234は、必ずしも、第2区分部231、時間積算部232及びピーク期間判定部233の処理の結果に基づいて、推定対象901の心室の状態が正常か否かを推定する必要は無い。正常心室状態推定部234は、推定対象901の心室の状態が正常か否かを推定可能であればどのような方法で推定対象901の心室の状態が正常か否かを推定してもよい。例えば、正常心室状態推定部234は、心電位の極値の出現頻度のみに基づいて心室の状態が正常か否かを推定してもよい。
しかしながら、心電位の極値の出現頻度のみに基づいて心室の状態が正常か否かを推定する場合には、波形の多少の乱れによって生じた極値も回数にカウントしてしまい、推定結果を誤る場合がある。一方、第2区分部231、時間積算部232及びピーク期間判定部233の処理の結果に基づく方法では、心臓由来の心室細動の時の異常信号の特徴である、対称性を有する固有の振動数を持った連続波を選択的に抽出できる。このため、心電位の極値の出現頻度のみに基づいて心室の状態が正常か否かを推定する場合よりも推定を誤る確率が低い。
そのため、心室状態推定部230は、第2区分部231、時間積算部232及びピーク期間判定部233の処理の結果に基づいて推定対象901の心室の状態が正常か否かを推定する正常心室状態推定部234を備えることが望ましい。
(第2実施形態)
図10は、第2実施形態の意識喪失推定システム100aのシステム構成の一例を示す図である。意識喪失推定システム100aは、意識喪失推定装置2に代えて意識喪失推定装置2aを備える点で意識喪失推定システム100と異なる。意識喪失推定装置2aは、制御部20に代えて制御部20aを備える点で意識喪失推定装置2と異なる。
図10は、第2実施形態の意識喪失推定システム100aのシステム構成の一例を示す図である。意識喪失推定システム100aは、意識喪失推定装置2に代えて意識喪失推定装置2aを備える点で意識喪失推定システム100と異なる。意識喪失推定装置2aは、制御部20に代えて制御部20aを備える点で意識喪失推定装置2と異なる。
制御部20aは、範囲外データ判定処理、心室状態推定処理、意識喪失済み確率取得処理及び意識喪失判定処理にくわえて更に、グレーアウト判定処理を実行する点で制御部20と異なる。グレーアウト判定処理は、心室状態推定処理の実行前に実行される。グレーアウト判定処理は範囲外データ判定処理の実行前に実行されてもよいし、範囲外データ判定処理の実行後に実行されてもよい。
グレーアウト判定処理は、脳血流相関量時系列に基づき、グレーアウトに関する条件(以下「グレーアウト条件」という。)が満たされたか否かを判定する処理である。
グレーアウト条件は、推定対象901にグレーアウトが起きる確率が所定の確率を超えたという条件である。グレーアウトは、意識喪失が起きる前に生じる意識喪失の前兆となる現象である。グレーアウト条件は、より具体的には、各脳血流相関量点データのうち脳血流相関量が所定の閾値未満であるデータが存在する、という条件である。意識喪失推定システム100は、グレーアウト条件が満たされた場合に、グレーアウトが起きる確率が高いことを示す情報(以下「グレーアウト警告」という。)を伝達先に伝達する。
以下、説明の簡単のため意識喪失推定システム100が備える各機能部と同様の機能を備えるものについては、図3と同じ符号を付すことで説明を省略する。
図11は、第2実施形態における制御部20aの機能構成の一例を示す図である。制御部20aは、グレーアウト判定部310を備える点で制御部20と異なる。グレーアウト判定部310は、グレーアウト判定処理を実行する。グレーアウト判定処理の判定結果は、出力制御部290の制御により出力部24によって出力される。以下、説明の簡単のため制御部20が備える機能部と同様のものについては図4と同じ符号を付すことで説明を省略する。
以下、図12及び図13を用いて、意識喪失推定システム100aが実行する処理の流れの一例を示す。以下、説明の簡単のため図5のフローチャートに記載の処理と同様の処理については図5と同じ符号を付すことで説明を省略する。
図12は、第2実施形態の意識喪失推定システム100aが実行する処理の流れの一例を示す第1のフローチャートである。図13は、第2実施形態の意識喪失推定システム100aが実行する処理の流れの一例を示す第2のフローチャートである。
ステップS101の次に、グレーアウト判定部310がグレーアウト判定処理を実行する(ステップS119)。具体的には、グレーアウト判定部310が、グレーアウト条件が満たされるか否かをステップS101で取得された脳血流相関量時系列に基づいて判定する。
グレーアウト判定条件が満たされる場合(ステップS119:YES)、出力制御部290は出力部24にグレーアウト警告を出力させる(ステップS120)。次に、ステップS102の処理が実行される。一方、グレーアウト判定条件が満たされない場合(ステップS119:NO)、単位期間における処理が終了する。
このように構成された第2実施形態の意識喪失推定システム100aは、意識喪失推定システム100が有する機能にくわえて、さらにグレーアウトが起きる確率を判定する機能を有する。そのため、このように構成された第2実施形態の意識喪失推定システム100aは、意識喪失によって引き起こされる危険を減らすことができる。
(第3実施形態)
図14は、第3実施形態の意識喪失推定システム100bのシステム構成の一例を示す図である。意識喪失推定システム100bは、呼吸情報取得センサ3を備える点と、意識喪失推定装置2aに代えて意識喪失推定装置2bを備える点とで意識喪失推定システム100aと異なる。
図14は、第3実施形態の意識喪失推定システム100bのシステム構成の一例を示す図である。意識喪失推定システム100bは、呼吸情報取得センサ3を備える点と、意識喪失推定装置2aに代えて意識喪失推定装置2bを備える点とで意識喪失推定システム100aと異なる。
呼吸情報取得センサ3は、推定対象901の呼吸に関する情報(以下「呼吸情報」という。)を取得する。呼吸情報は、例えば、推定対象901の呼吸の状態が呼気相にあるのか吸気相にあるのかを示す情報である。呼吸情報取得センサ3は、例えば酸素飽和度の測定を行う装置である。呼吸情報取得センサ3は、換気量の測定を行う装置であってもよい。呼吸情報取得センサ3は、呼気中の二酸化炭素濃度の測定を行う装置であってもよい。
意識喪失推定装置2bは、制御部20aに代えて制御部20bを備える点で意識喪失推定装置2aと異なる。制御部20bは、グレーアウト判定処理、範囲外データ判定処理、心室状態推定処理、意識喪失済み確率取得処理及び意識喪失判定処理にくわえて、さらにグレーアウト条件決定処理を実行する点で制御部20aと異なる。グレーアウト条件決定処理は、呼吸情報に基づきグレーアウト条件を決定する処理である。
第3実施形態における記憶部23は、呼吸情報とグレーアウト条件との対応関係を示す情報(以下「グレーアウト条件対応情報」という。)を予め記憶する。グレーアウト条件対応情報が示すグレーアウト条件は、脳血流相関量が所定の値(以下「グレーアウト閾値」という。)未満の脳血流相関量点データが存在する、という条件を満たせばどのような条件であってもよい。
グレーアウト条件対応情報が示す対応関係は、例えば、呼吸情報が酸素飽和度低下、低換気量、呼気二酸化炭素濃度低下などの呼吸機能の低下を示す場合に、グレーアウト閾値を高くするという関係である。
第3実施形態における通信部21は、第2実施形態における通信部21が有する通信インタフェースにくわえて更に呼吸情報取得センサ3に接続するための通信インタフェースも含んで構成される。第3実施形態における通信部21は、例えばネットワークを介して呼吸情報取得センサ3と通信する。第3実施形態における通信部21は、呼吸情報取得センサ3との通信によって呼吸情報取得センサ3から呼吸情報を取得する。
以下、説明の簡単のため意識喪失推定システム100aが備える各機能部と同様の機能を備えるものについては、図10と同じ符号を付すことで説明を省略する。
図15は、第3実施形態における制御部20bの機能構成の一例を示す図である。制御部20bは、グレーアウト条件決定部320を備える点で制御部20aと異なる。以下、制御部20aと同様の機能を備えるものについては図11と同じ符号を付すことで説明を省略する。
グレーアウト条件決定部320はグレーアウト条件決定処理を実行する。グレーアウト条件決定処理はより詳細には、取得された呼吸情報に対応するグレーアウト条件を、グレーアウト条件対応情報を用いて取得し、取得したグレーアウト条件をグレーアウト判定処理に用いるグレーアウト条件に決定する処理である。
グレーアウト条件決定処理は各単位期間においてグレーアウト判定処理の実行前に実行される。そのためグレーアウト条件決定処理は、例えば、図12におけるステップS101の処理の次であってステップS119の処理の実行前に実行される。
このように構成された第3実施形態の意識喪失推定システム100bは、グレーアウト条件を呼吸情報に基づいて決定する。そのため、意識喪失推定システム100bは、意識喪失推定システム100aよりも一層、グレーアウトを判定する精度を高めることができる。そのため、このように構成された第3実施形態の意識喪失推定システム100bは、意識喪失によって引き起こされる危険をより一層減らすことができる。
(第4実施形態)
図16は、第4実施形態の意識喪失推定システム100cのシステム構成の一例を示す図である。意識喪失推定システム100cは、意識喪失推定装置2bに代えて意識喪失推定装置2cを備える点で意識喪失推定システム100bと異なる。
図16は、第4実施形態の意識喪失推定システム100cのシステム構成の一例を示す図である。意識喪失推定システム100cは、意識喪失推定装置2bに代えて意識喪失推定装置2cを備える点で意識喪失推定システム100bと異なる。
意識喪失推定装置2cは、制御部20bに代えて制御部20cを備える点で意識喪失推定装置2bと異なる。制御部20cは、グレーアウト条件決定処理、グレーアウト判定処理、範囲外データ判定処理、心室状態推定処理、意識喪失済み確率取得処理及び意識喪失判定処理にくわえて、さらに確率決定条件候補取得処理を実行する点で制御部20bと異なる。
確率決定条件候補取得処理は、呼吸情報に基づき確率決定条件の候補を決定する処理である。確率決定条件の候補とは、具体的には、心室状態と確率決定条件との関係を示す情報である。
第4実施形態における記憶部23は、呼吸情報と確率決定条件の候補との対応関係を示す情報(以下「確率決定条件候補対応情報」という。)を予め記憶する。
確率決定条件候補対応情報が示す対応関係は、例えば、呼吸情報が呼吸機能低下を示す場合に通常よりも意識喪失済み確率の経過時間に依存する変化量における単位時間当たりの変化量を大きくするという関係である。
第4実施形態における通信部21は、第3実施形態における通信部21と同一である。
以下、説明の簡単のため意識喪失推定システム100bが備える各機能部と同様の機能を備えるものについては、図14と同じ符号を付すことで説明を省略する。
図17は、第4実施形態における制御部20cの機能構成の一例を示す図である。制御部20cは、確率決定条件候補取得部330を備える点で制御部20bと異なる。以下、制御部20bと同様の機能を備えるものについては図15と同じ符号を付すことで説明を省略する。
確率決定条件候補取得部330は確率決定条件候補取得処理を実行する。確率決定条件候補取得処理はより詳細には、取得された呼吸情報に対応する確率決定条件の候補を、確率決定条件候補対応情報を用いて取得する処理である。取得された確率決定条件の候補の中から、確率取得条件取得部250が、心室状態推定部230の推定結果に基づき、意識喪失済み確率取得処理における確率決定条件を取得する。
確率決定条件候補取得処理は各単位期間において確率取得条件取得部250が確率取得条件を取得する前に実行される。そのため確率決定条件候補取得処理は、例えば、図12におけるステップS101の実行後であって図13におけるステップS112の処理の実行前に実行されればどのようなタイミングで実行されてもよい。
このように構成された第4実施形態の意識喪失推定システム100cは、意識喪失済み確率の推定のために意識喪失推定システム100bが用いた情報に加えてさらに、呼吸情報にも基づいて推定対象901の意識喪失済み確率を推定する。そのため、意識喪失推定システム100cは、意識喪失推定システム100bよりも一層、推定対象901の意識喪失の可能性を推定する精度を高めることができる。そのため、このように構成された第4実施形態の意識喪失推定システム100cは、意識喪失によって引き起こされる危険を意識喪失推定システム100bよりもより一層減らすことができる。
(第5実施形態)
図18は、第5実施形態の意識喪失推定システム100dのシステム構成の一例を示す図である。意識喪失推定システム100dは、意識喪失推定装置2cに代えて意識喪失推定装置2dを備える点で意識喪失推定システム100cと異なる。
図18は、第5実施形態の意識喪失推定システム100dのシステム構成の一例を示す図である。意識喪失推定システム100dは、意識喪失推定装置2cに代えて意識喪失推定装置2dを備える点で意識喪失推定システム100cと異なる。
意識喪失推定装置2dは、制御部20cに代えて制御部20dを備える点で意識喪失推定装置2cと異なる。制御部20dは、制御部20cが実行する処理にくわえて更にさらに、心室状態推定条件決定処理を実行する点で制御部20cと異なる。制御部20cが実行する処理は具体的には、グレーアウト条件決定処理、グレーアウト判定処理、範囲外データ判定処理、心室状態推定処理、確率決定条件候補取得処理、意識喪失済み確率取得処理及び意識喪失判定処理である。
心室状態推定条件決定処理は、呼吸情報に基づき心室状態推定処理に用いられる条件(以下「心室状態推定条件」という。)を決定する処理である。
心室状態推定条件は、例えば、第1の長さと各時刻における閾値領域上限値及び閾値領域下限値とである。このような場合、心室状態推定条件決定処理は、呼吸情報に応じて第1の長さと各時刻における閾値領域上限値及び閾値領域下限値とを変更する処理である。すなわち心室状態推定条件決定処理の一例は、呼吸情報に応じた第1の長さと各時刻における閾値領域上限値及び閾値領域下限値とを決定する処理である。
心室状態推定条件は、例えば、第1基準頻度又は第2基準頻度を示す情報である。このような場合、心室状態推定条件決定処理は、例えば、呼吸情報に応じて第1基準頻度又は第2基準頻度を変更する処理である。すなわち心室状態推定条件決定処理の一例は、呼吸情報に応じた第1基準頻度又は第2基準頻度を決定する処理である。心室状態推定条件決定処理は、例えば、呼吸機能の低下や呼吸停止などの呼吸の状態により、第1基準頻度及び第2基準頻度を調整してもよい。
第5実施形態における記憶部23は、呼吸情報と心室状態推定条件との対応関係を示す情報(以下「心室状態推定条件対応情報」という。)を予め記憶する。
心室状態推定条件対応情報が示す対応関係は、例えば、呼吸情報が呼吸停止状態を連続20秒以上示す場合に著しい心室の異常、心室細動もしくは心停止、もしくはそれらの差し迫った状況であるという関係である。
第5実施形態における通信部21は、第3実施形態における通信部21と同一である。
以下、説明の簡単のため意識喪失推定システム100dが備える各機能部と同様の機能を備えるものについては、図17と同じ符号を付すことで説明を省略する。
図19は、第5実施形態における制御部20dの機能構成の一例を示す図である。制御部20dは、心室状態推定条件決定部340を備える点で制御部20cと異なる。以下、制御部20cと同様の機能を備えるものについては図17と同じ符号を付すことで説明を省略する。心室状態推定条件決定部340は心室状態推定条件決定処理を実行する。心室状態推定条件決定部340は心室状態推定条件決定処理の実行により、心室状態推定条件対応情報と取得された呼吸情報とに基づき取得された呼吸情報に対応する心室状態推定条件を決定する。
心室状態推定条件決定処理は各単位期間において心室状態推定部230が心室状態の推定を開始する前に実行される。そのため心室状態推定条件決定処理は、例えば、図12におけるステップS101の実行後であって図13におけるステップS103の処理の実行前に実行されればどのようなタイミングで実行されてもよい。
このように構成された第5実施形態の意識喪失推定システム100dは、呼吸情報に基づいて心室状態推定条件を決定する。そのため、意識喪失推定システム100dは、意識喪失推定システム100cよりも一層、推定対象901の意識喪失の可能性を推定する精度を高めることができる。そのため、このように構成された第5実施形態の意識喪失推定システム100dは、意識喪失によって引き起こされる危険を意識喪失推定システム100cよりもより一層減らすことができる。
(第6実施形態)
図20は、第6実施形態の意識喪失推定システム100eのシステム構成の一例を示す図である。意識喪失推定システム100eは、意識喪失推定装置2dに代えて意識喪失推定装置2eを備える点で意識喪失推定システム100dと異なる。
図20は、第6実施形態の意識喪失推定システム100eのシステム構成の一例を示す図である。意識喪失推定システム100eは、意識喪失推定装置2dに代えて意識喪失推定装置2eを備える点で意識喪失推定システム100dと異なる。
意識喪失推定装置2eは、制御部20dに代えて制御部20eを備える点で意識喪失推定装置2dと異なる。制御部20eは、制御部20dが実行する処理にくわえて更に学習更新処理を実行する点で制御部20dと異なる。
制御部20eが実行する処理は具体的には、グレーアウト条件決定処理、グレーアウト判定処理、範囲外データ判定処理、心室状態推定条件決定処理、心室状態推定処理、確率決定条件候補取得処理、意識喪失済み確率取得処理及び意識喪失判定処理である。
学習更新処理は、学習処理と更新処理とを含む。学習処理は、被出力推定結果に対するユーザの応答に基づき、グレーアウト条件、心室状態推定条件、確率決定条件、基準確率等の推定に用いる条件を、機械学習によって学習する処理である。更新処理は、学習処理の学習結果に基づいて推定に用いる条件を更新する処理である。
被出力推定結果は、出力部24から出力される情報であって意識喪失に関する意識喪失推定装置2eの推定結果を示す情報である。被出力推定結果は、例えば、グレーアウト警告、第1警告、意識喪失済み確率又は第2警告である。
被出力推定結果に対するユーザの応答とは、被出力推定結果の確からしさをユーザが意識喪失推定装置2eに入力することを意味する。ユーザの応答は、例えば、入力部22を介して入力される。ユーザの応答は、通信部21を介して入力されてもよい。なお、ユーザは、推定対象901又は管理者902である。
以下、説明の簡単のため意識喪失推定システム100dが備える各機能部と同様の機能を備えるものについては、図18と同じ符号を付すことで説明を省略する。
図21は、第6実施形態における制御部20eの機能構成の一例を示す図である。制御部20eは、応答取得部350及び学習更新部360を備える点で制御部20dと異なる。以下、制御部20dと同様の機能を備えるものについては図19と同じ符号を付すことで説明を省略する。
応答取得部350は、入力部22又は通信部21を介して入力されたユーザの応答を取得する。学習更新部360は学習更新処理を実行する。具体的には、学習更新部360は、まず応答取得部350が取得したユーザの応答に基づいて推定に用いる条件を学習し、次に学習結果に基づいて推定に用いる条件を更新する。
学習更新処理は、被出力推定結果とユーザの応答との対応関係を記憶部23が記憶していれば、どのようなタイミングで実行されてもよい。
このように構成された第6実施形態の意識喪失推定システム100eは、被出力推定結果に対するユーザの応答に基づいて推定に用いる条件を更新する。そのため、意識喪失推定システム100eは、意識喪失推定システム100dよりも一層、推定対象901の意識喪失の可能性を推定する精度を高めることができる。そのため、このように構成された第5実施形態の意識喪失推定システム100eは、意識喪失によって引き起こされる危険を意識喪失推定システム100dよりもより一層減らすことができる。
(第1の変形例)
閾値領域は、推定対象901の心室の状態が異常心室状態か否かを心室状態推定部230が判定可能であれば、下閾値又は上閾値のどちらか一方のみを有してもよい。例えば、異常心室状態が、心室性期外収縮であって、心電位を計測する電極誘導が定まっており、期外収縮の興奮伝搬の方法が一定であれば、閾値領域は、例えば上閾値のみを有してもよい。
閾値領域は、推定対象901の心室の状態が異常心室状態か否かを心室状態推定部230が判定可能であれば、下閾値又は上閾値のどちらか一方のみを有してもよい。例えば、異常心室状態が、心室性期外収縮であって、心電位を計測する電極誘導が定まっており、期外収縮の興奮伝搬の方法が一定であれば、閾値領域は、例えば上閾値のみを有してもよい。
なお、閾値領域が上閾値のみを有するとは、閾値領域の示す範囲が上閾値以下の値を全て含む範囲であることを意味する。なお、閾値領域が下閾値のみを有するとは、閾値領域の示す範囲が下閾値以上の値を全て含む範囲であることを意味する。
異常心室状態が心室性期外収縮である場合、心室の脱分極時間が正常よりも延長する。そのため、電位が閾値外に留まる時間が長くなることと、心電位を計測する電極誘導が一定の位置に定まっており期外収縮の興奮伝搬の方向が一定であることとが多い。このため、閾値領域が上閾値のみもしくは下閾値のみを有しても、心室状態推定部230は推定対象901の心室の状態が心室性期外収縮であるか否かを判定可能である。
例えば、閾値領域が上閾値のみを有する場合、範囲外データ内判定部224は、脳血流相関量時系列の各脳血流相関量点データについて、脳血流相関量が上閾値を超えるか否かを判定し脳血流相関量が下閾値未満か否かを判定しない。このような場合、範囲外データは、脳血流相関量が上閾値を超える脳血流相関量点データを含み脳血流相関量が下閾値未満の脳血流相関量点データを含まない。
例えば、閾値領域が下閾値のみを有する場合、範囲外データ内判定部224は、脳血流相関量時系列の各脳血流相関量点データについて、脳血流相関量が下閾値未満か否かを判定し、脳血流相関量が上閾値を超えるか否かを判定しない。このような場合、範囲外データは、脳血流相関量が下閾値未満の脳血流相関量点データを含み脳血流相関量が上閾値を超える脳血流相関量点データを含まない。
閾値領域が下閾値及び上閾値を有する場合であっても、推定対象901の心室の状態が異常心室状態か否かを心室状態推定部230が推定可能であれば、範囲外データ内判定部224は必ずしも下閾値及び上閾値を用いて範囲外データを判定する必要は無い。
推定対象901の心室の状態が異常心室状態か否かを心室状態推定部230が推定可能であれば、範囲外データ内判定部224は、例えば、上閾値だけを用いて範囲外データを判定してもよい。このような場合、範囲外データ内判定部224は、脳血流相関量時系列の各脳血流相関量点データについて脳血流相関量が上閾値を超えるか否かを判定し、脳血流相関量が下閾値未満か否かを判定しない。このような場合、脳血流相関量が上閾値を超える脳血流相関量点データは閾値領域の範囲外の脳血流相関量点データであり、脳血流相関量が下閾値未満の脳血流相関量点データは閾値領域の範囲内の脳血流相関量点データである。
推定対象901の心室の状態が異常心室状態か否かを心室状態推定部230が判定可能であれば、範囲外データ内判定部224は、例えば、下閾値だけを用いて範囲外データを判定してもよい。このような場合、範囲外データ内判定部224は、脳血流相関量時系列の各脳血流相関量点データについて脳血流相関量が下閾値未満か否かを判定し、脳血流相関量が上閾値を超えるか否かを判定しない。このような場合、脳血流相関量が下閾値未満の脳血流相関量点データは閾値領域の範囲外の脳血流相関量点データであり、脳血流相関量が上閾値を超える脳血流相関量点データは閾値領域の範囲内の脳血流相関量点データである。
このように、推定対象901の心室の状態が異常心室状態か否かを心室状態推定部230が推定可能であれば、範囲外データ内判定部224は必ずしも、上閾値及び下閾値の両方を用いて範囲外データを判定する必要は無い。
このように構成された第1の変形例の意識喪失推定システム100、100a~100eは、脳血流相関量時系列の各データの時間軸方向の位置を含む所定の期間内のデータに基づいて、各データの時間軸方向の位置に応じた閾値領域を決定する。そして、意識喪失推定システム100、100a~100eは、決定した閾値領域に基づいて意識喪失済み確率を推定する。そのため、意識喪失推定システム100、100a~100eは、推定対象901の意識喪失の可能性を推定する精度を高めることができる。また、そのため、意識喪失推定システム100、100a~100eは、既に意識喪失である確率を推定する精度を高めることができる。
また、このように構成された第1の変形例の意識喪失推定システム100、100a~100eは、推定結果の意識喪失済み確率を出力部24によって出力する。意識喪失済み確率が出力されるため、推定対象901は意識喪失が起きる前に意識喪失によって引き起こされる危険を減らす行動をとることができる。そのため、このように構成された第1の変形例の意識喪失推定システム100、100a~100eは、意識喪失によって引き起こされる危険を減らすことができる。
(第2の変形例)
制御部20、20a~20eは、範囲外データ判定処理又はグレーアウト判定処理のうち先に実行されるいずれか一方の処理の実行前に信号整形処理を実行してもよい。信号整形処理は、後段の処理に好適であるように脳血流相関量時系列を整形する処理である。好適であるように整形するとは、予め定められた所定の条件を満たす系列であるように整形することを意味する。信号整形処理は、例えば、生体信号の取得の際に生じるノイズ等の脳血流相関量時系列に含まれる高周波成分を脳血流相関量時系列から除去する処理(ハイパス処理)である。信号整形処理は、例えば、生体信号の基線の動揺を抑制する処理であってもよい。信号整形処理は、例えば、生体信号の電位幅を正規化する処理であってもよい。
制御部20、20a~20eは、範囲外データ判定処理又はグレーアウト判定処理のうち先に実行されるいずれか一方の処理の実行前に信号整形処理を実行してもよい。信号整形処理は、後段の処理に好適であるように脳血流相関量時系列を整形する処理である。好適であるように整形するとは、予め定められた所定の条件を満たす系列であるように整形することを意味する。信号整形処理は、例えば、生体信号の取得の際に生じるノイズ等の脳血流相関量時系列に含まれる高周波成分を脳血流相関量時系列から除去する処理(ハイパス処理)である。信号整形処理は、例えば、生体信号の基線の動揺を抑制する処理であってもよい。信号整形処理は、例えば、生体信号の電位幅を正規化する処理であってもよい。
図22は、第2の変形例における整形前の心電位時系列の一例を示す図である。図22のグラフの横軸は原点の時刻からの経過時間を示す。図22の縦軸は心電位の電位を示す。図22に示す心電位時系列には心電位に動揺が認められる。そのため、このままのデータを用いて意識喪失済み確率を取得した場合、取得結果の精度が低い場合がある。
図23は、第2の変形例におけるハイパスフィルタ処理による整形後の心電位時系列の一例を示す図である。図23のグラフの横軸は原点の時刻からの経過時間を示す。図23の縦軸は心電位の電位を示す。図23のグラフは、図22に示す心電位時系列に対する信号整形処理の実行結果である。図23は、心電位の基線の動揺が図22の心電位時系列よりも抑制されている。そのため、図23の心電位時系列を用いて意識喪失済み確率を取得した場合、取得結果の精度は、図22の心電位時系列を用いて意識喪失済み確率を取得する場合よりも高い。
図24は、第2の変形例における信号整形処理を実行する制御部20、20a~20eの一例として信号整形処理を実行する制御部20(以下「制御部20f」という。)の機能構成の一例を示す図である。
制御部20fは、信号整形部370を備える点で制御部20と異なる。信号整形部370は、時系列取得部210が取得した脳血流相関量時系列に対して信号整形処理を実行する。このような場合、範囲外データ判定処理、心室状態推定処理、意識喪失済み確率取得処理及び意識喪失判定処理等の信号整形処理の実行後に実行される各処理で用いられる脳血流相関量時系列は整形後の脳血流相関量時系列である。制御部20fがグレーアウト判定処理を実行する場合、信号整形処理の実行後に実行される各処理にはグレーアウト判定処理も含まれる。
信号整形処理は、具体的には、ステップS101の処理の実行後であってステップS119の処理の実行前に実行される。また、信号整形処理は、ステップS119の処理が実行されない場合には、ステップS101の処理の実行後であってステップS102の処理の実行前に実行される。
このように構成された第2の変形例の意識喪失推定システム100、100a~100eは、整形後の脳血流相関量時系列に基づいて、意識喪失済み確率取得処理を実行する。そのため、第2の変形例の意識喪失推定システム100、100a~100eは、推定対象901の意識喪失の可能性を推定する精度を高めることができる。そのため、このように構成された第2の変形例の意識喪失推定システム100、100a~100eは、意識喪失によって引き起こされる危険を減らすことができる。
また、このように構成された第2の変形例の意識喪失推定システム100a~100eは、整形後の脳血流相関量時系列に基づいて、範囲外データ判定処理、心室状態推定処理、意識喪失済み確率取得処理、意識喪失判定処理及びグレーアウト判定処理を実行する。そのため、このように構成された第2の変形例の意識喪失推定システム100a~100eは、意識喪失によって引き起こされる危険を減らすことができる。
(第3の変形例)
制御部20、20a~20eは、範囲外データ判定処理又はグレーアウト判定処理のうち先に実行されるいずれか一方の処理の実行前に信号モデリング処理を実行してもよい。信号モデリング処理は、時系列取得部210が取得した脳血流相関量時系列に基づき、脳血流相関量に関する所定の理論に基づく波形であって脳血流相関量時系列との違いが所定の違い未満の波形(以下「モデル波形」という。)を取得する。脳血流相関量時系列を脳血流相関量に関する所定の理論は、例えば、フランクスターリングの法則、心臓循環の非線形有限要素モデルである。
制御部20、20a~20eは、範囲外データ判定処理又はグレーアウト判定処理のうち先に実行されるいずれか一方の処理の実行前に信号モデリング処理を実行してもよい。信号モデリング処理は、時系列取得部210が取得した脳血流相関量時系列に基づき、脳血流相関量に関する所定の理論に基づく波形であって脳血流相関量時系列との違いが所定の違い未満の波形(以下「モデル波形」という。)を取得する。脳血流相関量時系列を脳血流相関量に関する所定の理論は、例えば、フランクスターリングの法則、心臓循環の非線形有限要素モデルである。
ここで図25~図30を用いて脳血流相関量時系列とモデル波形との対応の例を、2軸グラフを用いて示す。具体的には、図25~図28は心電位時系列とモデル波形との対応を示す。図29及び図30は、大動脈血流量時系列とモデル波形との対応を示す。大動脈血流量時系列は、大動脈血流量の時系列である。
図25は、第3の変形例における心電位時系列とモデル波形との対応を示す第1の図である。図25のグラフの横軸は原点の時刻からの経過時間を示す。図25の左側の縦軸は信号モデリング処理実行前の心電位を示す。図25の右側の縦軸は、モデル波形の心電位を示す。図25の信号モデリング処理実行前の心電位時系列は、動きが正常な心臓の心電位のグラフである。図25のモデル波形は、図25の信号モデルリング処理実行前の心電位時系列に基づき信号モデリング処理の実行によって取得されたモデル波形である。
図26は、第3の変形例における心電位時系列とモデル波形との対応を示す第2の図である。図26のグラフの横軸は原点の時刻からの経過時間を示す。図26の左側の縦軸は信号モデリング処理実行前の心電位を示す。図26の右側の縦軸は、モデル波形の心電位を示す。図26の信号モデリング処理実行前の心電位時系列は、結滞(徐脈性不整脈)が起きている心臓の心電位のグラフである。図26のモデル波形は、図26の信号モデルリング処理実行前の心電位時系列に基づき信号モデリング処理の実行によって取得されたモデル波形である。図26は、時刻t8から時刻t9の期間に結滞が起きていることを示す。
図27は、第3の変形例における心電位時系列とモデル波形との対応を示す第3の図である。図27のグラフの横軸は原点の時刻からの経過時間を示す。図27の左側の縦軸は信号モデリング処理実行前の心電位を示す。図27の右側の縦軸は、モデル波形の心電位を示す。図27の信号モデリング処理実行前の心電位時系列は、心室性期外収縮が起きている心臓が起きている心臓の心電位のグラフである。図27のモデル波形は、図27の信号モデルリング処理実行前の心電位時系列に基づき信号モデリング処理の実行によって取得されたモデル波形である。図27は、時刻t10から時刻t11の期間に心室性期外収縮が起きていることを示す。
図28は、第3の変形例における心電位時系列とモデル波形との対応を示す第4の図である。図28のグラフの横軸は原点の時刻からの経過時間を示す。図28の左側の縦軸は信号モデリング処理実行前の心電位を示す。図28の右側の縦軸は、モデル波形の心電位を示す。図28の信号モデリング処理実行前の心電位時系列は、心室性頻拍が起きている心臓が起きている心臓の心電位のグラフである。図28のモデル波形は、図28の信号モデルリング処理実行前の心電位時系列に基づき信号モデリング処理の実行によって取得されたモデル波形である。図28は、時刻t12以降に心室性頻拍が起きていることを示す。
図29は、第3の変形例における大動脈血流量時系列とモデル波形との対応を示す第1の図である。図29のグラフの横軸は原点の時刻からの経過時間を示す。図29の左側の縦軸は信号モデリング処理実行前の単位時間当たりの大動脈血流量を示す。図29の右側の縦軸は、モデル波形が示す単位時間当たりの大動脈血流量を示す。図29の信号モデリング処理実行前の大動脈血流量時系列は、動きが正常な大動脈血流量のグラフである。図29のモデル波形は、図29の信号モデルリング処理実行前の大動脈血流量時系列に基づき信号モデリング処理の実行によって取得されたモデル波形である。
図30は、第3の変形例における大動脈血流量時系列とモデル波形との対応を示す第2の図である。図30のグラフの横軸は原点の時刻からの経過時間を示す。図30の左側の縦軸は信号モデリング処理実行前の単位時間当たりの大動脈血流量を示す。図30の右側の縦軸は、モデル波形が示す単位時間当たりの大動脈血流量を示す。図30の信号モデリング処理実行前の大動脈血流量時系列は、結滞が起きている大動脈血流量のグラフである。図30のモデル波形は、図29の信号モデルリング処理実行前の大動脈血流量時系列に基づき信号モデリング処理の実行によって取得されたモデル波形である。図30は、時刻t13から時刻t14の期間に結滞が起きていることを示す。図30に示す大動脈血流量時系列の場合、推定対象901は、時刻t14以降に意識喪失が起きる確率が高い。
図31は、第3の変形例における信号モデリング処理を実行する制御部20、20a~20fの一例として信号モデリング処理を実行する制御部20(以下「制御部20g」という。)の機能構成の一例を示す図である。
制御部20gは、信号モデリング部380を備える点で制御部20と異なる。信号モデリング部380は、時系列取得部210が取得した脳血流相関量時系列に対して信号モデリング処理を実行する。このような場合、範囲外データ判定処理、心室状態推定処理、意識喪失済み確率取得処理及び意識喪失判定処理等の信号整形処理の実行後に実行される各処理で用いられる脳血流相関量時系列は信号モデリング処理の実行後の脳血流相関量時系列である。制御部20gがグレーアウト判定処理を実行する場合、信号モデルリング処理の実行後に実行される各処理にはグレーアウト判定処理も含まれる。
このように構成された第3の変形例の意識喪失推定システム100、100a~100eは、理論に基づいてモデリングされた脳血流相関量時系列に基づいて、意識喪失済み確率取得処理を実行する。そのため、第3の変形例の意識喪失推定システム100、100a~100eは、推定対象901の意識喪失の可能性を推定する精度を高めることができる。そのため、このように構成された第3の変形例の意識喪失推定システム100、100a~100eは、意識喪失によって引き起こされる危険を減らすことができる。
また、このように構成された第3の変形例の意識喪失推定システム100a~100eは、理論に基づいてモデリングされた脳血流相関量時系列に基づいて、範囲外データ判定処理、心室状態推定処理、意識喪失済み確率取得処理、意識喪失判定処理及びグレーアウト判定処理を実行する。そのため、このように構成された第3の変形例の意識喪失推定システム100a~100eは、意識喪失によって引き起こされる危険を減らすことができる。
(第4の変形例)
グレーアウト条件、心室状態推定条件、確率決定条件、基準確率等の推定に用いる条件は、推定対象901の個人情報にも基づいた条件であってもよい。このような場合、グレーアウト条件、心室状態推定条件、確率決定条件、基準確率等の推定に用いる条件であって予め推定対象901に合わせて調整済みの条件を予め記憶部23が記憶する。個人情報は、例えば、推定対象901の年齢であってもよいし、性別であってもよいし、食の好みであってもよいし、身長であってもよいし、体重であってもよいし、体脂肪率であってもよいし、動脈硬化や頸動脈の狭窄などの基礎疾患の有無であってもよい。
グレーアウト条件、心室状態推定条件、確率決定条件、基準確率等の推定に用いる条件は、推定対象901の個人情報にも基づいた条件であってもよい。このような場合、グレーアウト条件、心室状態推定条件、確率決定条件、基準確率等の推定に用いる条件であって予め推定対象901に合わせて調整済みの条件を予め記憶部23が記憶する。個人情報は、例えば、推定対象901の年齢であってもよいし、性別であってもよいし、食の好みであってもよいし、身長であってもよいし、体重であってもよいし、体脂肪率であってもよいし、動脈硬化や頸動脈の狭窄などの基礎疾患の有無であってもよい。
(第5の変形例)
なお、実施形態及び第1の変形例及び第2の変形例の意識喪失推定システム100において、ステップS113の処理は必ずしもステップS112の次に実行される必要は無い。ステップS113の処理は、ステップS114の処理の実行前であってステップS109の処理の実行後であれば、どのようなタイミングで実行されてもよい。例えば、ステップS113の処理は、ステップS111の処理の実行前に実行されてもよい。
なお、実施形態及び第1の変形例及び第2の変形例の意識喪失推定システム100において、ステップS113の処理は必ずしもステップS112の次に実行される必要は無い。ステップS113の処理は、ステップS114の処理の実行前であってステップS109の処理の実行後であれば、どのようなタイミングで実行されてもよい。例えば、ステップS113の処理は、ステップS111の処理の実行前に実行されてもよい。
なお、単位期間は1周期の一例である。
意識喪失推定装置2、2a~2eは、ネットワークを介して通信可能に接続された複数台の情報処理装置を用いて実装されてもよい。この場合、意識喪失推定装置2、2a~2eが備える各機能部は、複数の情報処理装置に分散して実装されてもよい。
なお、意識喪失推定装置2、2a~2eの各機能の全て又は一部は、ASIC(Application Specific Integrated Circuit)やPLD(Programmable Logic Device)やFPGA(Field Programmable Gate Array)等のハードウェアを用いて実現されてもよい。プログラムは、コンピュータ読み取り可能な記録媒体に記録されてもよい。コンピュータ読み取り可能な記録媒体とは、例えばフレキシブルディスク、光磁気ディスク、ROM、CD-ROM等の可搬媒体、コンピュータシステムに内蔵されるハードディスク等の記憶装置である。プログラムは、電気通信回線を介して送信されてもよい。
以上、この発明の実施形態について図面を参照して詳述してきたが、具体的な構成はこの実施形態に限られるものではなく、この発明の要旨を逸脱しない範囲の設計等も含まれる。
100、100a、100b、100c、100d、100e…意識喪失推定システム、 1…生体センサ、 2、2a、2b、2c、2d、2e…意識喪失推定装置、 3…呼吸情報取得センサ、 20、20a、20b、20c、20d、20e、20f、20g…制御部、 21…通信部、 22…入力部、 23…記憶部、 24…出力部、 210…時系列取得部、 220…範囲外データ判定部、 221…第1区分部、 222…分布取得部、 223…閾値領域決定部、 224…範囲外データ内判定部、 230…心室状態推定部、 231…第2区分部、 232…時間積算部、 233…ピーク期間判定部、 234…正常心室状態推定部、 235…異常心室状態推定部、 240…確率取得処理実行判定部、 250…確率取得条件取得部、 260…計測信頼度推定部、 270…意識喪失済み確率取得部、 280…意識喪失判定部、 290…出力制御部、 300…記録部、 310…グレーアウト判定部、 320…グレーアウト条件決定部、 330…確率決定条件候補取得部、 340…心室状態推定条件決定部、 350…応答取得部、 360…学習更新部、 370…信号整形部、 380…信号モデリング部
Claims (6)
- 推定対象の脳血流量に相関を持つ量の時系列である脳血流相関量時系列に基づき前記推定対象の心室の状態が正常か否かを所定の繰り返し周期で推定する心室状態推定部と、
前記脳血流相関量時系列の信頼度を推定する計測信頼度推定部と、
前記信頼度と、前記心室状態推定部の推定結果と、前記繰り返し周期の開始の時点である推定開始時点以降に初めて前記心室状態推定部によって正常では無いと判定された時点である確率取得開始時点以降の経過時間とに基づき、前記推定対象が既に意識喪失である確率を示す意識喪失済み確率を取得する意識喪失済み確率取得部と、
を備える意識喪失推定装置。 - 前記意識喪失済み確率が予め定められた所定の確率である基準確率を超えるか否かを判定する意識喪失判定部、
をさらに備える請求項1に記載の意識喪失推定装置。 - 前記意識喪失済み確率取得部は、前記信頼度が所定の値以上の場合であり前記心室状態推定部が推定対象の心室の状態が異常であると判定した場合には直前の1周期において取得された意識喪失済み確率よりも高い意識喪失済み確率を取得し、前記信頼度が所定の値以上の場合であり前記心室状態推定部が推定対象の心室の状態が正常であると判定した場合には直前の1周期において取得された意識喪失済み確率よりも低い意識喪失済み確率を取得し、前記信頼度が所定の値未満の場合には直前の1周期において取得された意識喪失済み確率よりも低い意識喪失済み確率を取得する、
請求項1又は2に記載の意識喪失推定装置。 - 前記脳血流相関量時系列に基づき、前記推定対象がグレーアウトであるか否かを判定するグレーアウト判定部、
を備える請求項1から3のいずれか一項に記載の意識喪失推定装置。 - 推定対象の脳血流量に相関を持つ量の時系列である脳血流相関量時系列に基づき前記推定対象の心室の状態が正常か否かを所定の繰り返し周期で推定する心室状態推定ステップと、
前記脳血流相関量時系列の信頼度を推定する計測信頼度推定ステップと、
前記信頼度と、前記心室状態推定ステップにおける推定結果と、前記繰り返し周期の開始の時点である推定開始時点以降に初めて前記心室状態推定ステップにおいて正常では無いと判定された時点である確率取得開始時点以降の経過時間とに基づき、前記推定対象が既に意識喪失である確率を示す意識喪失済み確率を取得する意識喪失済み確率取得ステップと、
を有する意識喪失推定方法。 - 請求項1から4のいずれか一項に記載の意識喪失推定装置としてコンピュータを機能させるためのプログラム。
Priority Applications (3)
| Application Number | Priority Date | Filing Date | Title |
|---|---|---|---|
| US17/912,174 US20230131150A1 (en) | 2020-03-19 | 2020-03-19 | Unconsciousness estimation apparatus, unconsciousness estimation method and program |
| JP2022507996A JP7280543B2 (ja) | 2020-03-19 | 2020-03-19 | 意識喪失推定装置、意識喪失推定方法及びプログラム |
| PCT/JP2020/012440 WO2021186711A1 (ja) | 2020-03-19 | 2020-03-19 | 意識喪失推定装置、意識喪失推定方法及びプログラム |
Applications Claiming Priority (1)
| Application Number | Priority Date | Filing Date | Title |
|---|---|---|---|
| PCT/JP2020/012440 WO2021186711A1 (ja) | 2020-03-19 | 2020-03-19 | 意識喪失推定装置、意識喪失推定方法及びプログラム |
Publications (1)
| Publication Number | Publication Date |
|---|---|
| WO2021186711A1 true WO2021186711A1 (ja) | 2021-09-23 |
Family
ID=77769179
Family Applications (1)
| Application Number | Title | Priority Date | Filing Date |
|---|---|---|---|
| PCT/JP2020/012440 WO2021186711A1 (ja) | 2020-03-19 | 2020-03-19 | 意識喪失推定装置、意識喪失推定方法及びプログラム |
Country Status (3)
| Country | Link |
|---|---|
| US (1) | US20230131150A1 (ja) |
| JP (1) | JP7280543B2 (ja) |
| WO (1) | WO2021186711A1 (ja) |
Citations (7)
| Publication number | Priority date | Publication date | Assignee | Title |
|---|---|---|---|---|
| US20070135852A1 (en) * | 2005-12-13 | 2007-06-14 | Cardiac Pacemakers, Inc. | Tachyarrhythmia sudden onset detection with hysteresis |
| WO2009131865A1 (en) * | 2008-04-24 | 2009-10-29 | Medtronic, Inc. | A system to monitor ejection time and qt interval to alert patients before syncopal events |
| WO2013181607A1 (en) * | 2012-05-31 | 2013-12-05 | Zoll Medical Corporation | Systems and methods for detecting health disorders |
| JP2016067481A (ja) * | 2014-09-29 | 2016-05-09 | セイコーエプソン株式会社 | 生体情報検出装置 |
| WO2017176714A1 (en) * | 2016-04-06 | 2017-10-12 | Cardiac Pacemakers, Inc. | Confidence of arrhythmia detection |
| JP2017225744A (ja) * | 2016-06-24 | 2017-12-28 | 日本光電工業株式会社 | 生体情報表示装置、生体情報表示方法、プログラム及び記憶媒体 |
| WO2018048992A1 (en) * | 2016-09-07 | 2018-03-15 | Cardiac Pacemakers, Inc. | Brady pause detection for implantable cardiac monitors |
-
2020
- 2020-03-19 US US17/912,174 patent/US20230131150A1/en active Pending
- 2020-03-19 WO PCT/JP2020/012440 patent/WO2021186711A1/ja active Application Filing
- 2020-03-19 JP JP2022507996A patent/JP7280543B2/ja active Active
Patent Citations (7)
| Publication number | Priority date | Publication date | Assignee | Title |
|---|---|---|---|---|
| US20070135852A1 (en) * | 2005-12-13 | 2007-06-14 | Cardiac Pacemakers, Inc. | Tachyarrhythmia sudden onset detection with hysteresis |
| WO2009131865A1 (en) * | 2008-04-24 | 2009-10-29 | Medtronic, Inc. | A system to monitor ejection time and qt interval to alert patients before syncopal events |
| WO2013181607A1 (en) * | 2012-05-31 | 2013-12-05 | Zoll Medical Corporation | Systems and methods for detecting health disorders |
| JP2016067481A (ja) * | 2014-09-29 | 2016-05-09 | セイコーエプソン株式会社 | 生体情報検出装置 |
| WO2017176714A1 (en) * | 2016-04-06 | 2017-10-12 | Cardiac Pacemakers, Inc. | Confidence of arrhythmia detection |
| JP2017225744A (ja) * | 2016-06-24 | 2017-12-28 | 日本光電工業株式会社 | 生体情報表示装置、生体情報表示方法、プログラム及び記憶媒体 |
| WO2018048992A1 (en) * | 2016-09-07 | 2018-03-15 | Cardiac Pacemakers, Inc. | Brady pause detection for implantable cardiac monitors |
Also Published As
| Publication number | Publication date |
|---|---|
| JPWO2021186711A1 (ja) | 2021-09-23 |
| JP7280543B2 (ja) | 2023-05-24 |
| US20230131150A1 (en) | 2023-04-27 |
Similar Documents
| Publication | Publication Date | Title |
|---|---|---|
| US20230038223A1 (en) | Haemodynamic monitor with improved filtering | |
| US7318808B2 (en) | Combining measurements from breathing rate sensors | |
| US11224379B2 (en) | Enhancement of respiratory parameter estimation and asynchrony detection algorithms via the use of central venous pressure manometry | |
| US8668649B2 (en) | System for cardiac status determination | |
| EP2408354B1 (en) | Systems and methods for monitoring heart rate and blood pressure correlation | |
| US9706952B2 (en) | System for ventricular arrhythmia detection and characterization | |
| US9049993B2 (en) | Apparatus for biological signal measurement at point of end-tidal | |
| EP2759257B1 (en) | Method, logic unit and system for determining a parameter representative for the patient's volume responsiveness | |
| US11406305B2 (en) | Signal quality metric for cardiovascular time series | |
| US8551005B2 (en) | Monitoring respiratory variation of pulse pressure | |
| US20120150003A1 (en) | System Non-invasive Cardiac Output Determination | |
| US20150157271A1 (en) | Analysis and Characterization of Patient Signals | |
| US10791942B2 (en) | Pulse wave analyzing apparatus | |
| US20220218928A1 (en) | Method for evaluating volume responsiveness and medical device | |
| US20200237240A1 (en) | Vital-sign estimation apparatus and calibration method for vital-sign estimator | |
| US20120296225A1 (en) | System for Cardiac Condition Detection Responsive to Blood Pressure Analysis | |
| WO2021186711A1 (ja) | 意識喪失推定装置、意識喪失推定方法及びプログラム | |
| WO2021186705A1 (ja) | 意識喪失推定装置、意識喪失推定方法及びプログラム | |
| WO2019171921A1 (ja) | 疲労度推定方法、疲労度推定装置およびプログラム | |
| JP2022019602A (ja) | 生体情報取得装置、処理装置、およびコンピュータプログラム | |
| US11589824B2 (en) | System and method for estimating the brain blood volume and/or brain blood flow and/or depth of anesthesia of a patient | |
| Vistisen et al. | Variations in the pre-ejection period induced by deep breathing do not predict the hemodynamic response to early haemorrhage in healthy volunteers | |
| KR102453428B1 (ko) | 맥박산소측정법 기반의 생체 데이터를 이용한 호흡수 산출방법, 장치 및 컴퓨터프로그램 | |
| JP6639185B2 (ja) | 脈波解析装置 | |
| EP3939499A1 (en) | Physiological information acquisition device, processing device, and computer program |
Legal Events
| Date | Code | Title | Description |
|---|---|---|---|
| 121 | Ep: the epo has been informed by wipo that ep was designated in this application |
Ref document number: 20925730 Country of ref document: EP Kind code of ref document: A1 |
|
| ENP | Entry into the national phase |
Ref document number: 2022507996 Country of ref document: JP Kind code of ref document: A |
|
| NENP | Non-entry into the national phase |
Ref country code: DE |
|
| 122 | Ep: pct application non-entry in european phase |
Ref document number: 20925730 Country of ref document: EP Kind code of ref document: A1 |