WO2021149192A1 - 電柱劣化検出システム、電柱劣化検出方法、及び電柱劣化検出装置 - Google Patents
電柱劣化検出システム、電柱劣化検出方法、及び電柱劣化検出装置 Download PDFInfo
- Publication number
- WO2021149192A1 WO2021149192A1 PCT/JP2020/002132 JP2020002132W WO2021149192A1 WO 2021149192 A1 WO2021149192 A1 WO 2021149192A1 JP 2020002132 W JP2020002132 W JP 2020002132W WO 2021149192 A1 WO2021149192 A1 WO 2021149192A1
- Authority
- WO
- WIPO (PCT)
- Prior art keywords
- utility pole
- utility
- poles
- utility poles
- natural frequency
- Prior art date
Links
- 238000001514 detection method Methods 0.000 title claims abstract description 88
- 230000015556 catabolic process Effects 0.000 title abstract 5
- 238000006731 degradation reaction Methods 0.000 title abstract 5
- 239000013307 optical fiber Substances 0.000 claims abstract description 64
- 230000006866 deterioration Effects 0.000 claims description 152
- 238000004458 analytical method Methods 0.000 claims description 60
- 238000004364 calculation method Methods 0.000 description 38
- 238000000034 method Methods 0.000 description 15
- 238000004891 communication Methods 0.000 description 13
- 230000005856 abnormality Effects 0.000 description 7
- 238000012545 processing Methods 0.000 description 6
- 230000003287 optical effect Effects 0.000 description 5
- 230000008859 change Effects 0.000 description 3
- 238000005259 measurement Methods 0.000 description 3
- 238000000253 optical time-domain reflectometry Methods 0.000 description 3
- 238000010586 diagram Methods 0.000 description 2
- 230000006870 function Effects 0.000 description 2
- 238000009434 installation Methods 0.000 description 2
- 239000000463 material Substances 0.000 description 2
- 238000012544 monitoring process Methods 0.000 description 2
- 230000008569 process Effects 0.000 description 2
- 230000001902 propagating effect Effects 0.000 description 2
- 238000000611 regression analysis Methods 0.000 description 2
- 230000002238 attenuated effect Effects 0.000 description 1
- 238000005452 bending Methods 0.000 description 1
- 230000005540 biological transmission Effects 0.000 description 1
- 230000007797 corrosion Effects 0.000 description 1
- 238000005260 corrosion Methods 0.000 description 1
- 230000007423 decrease Effects 0.000 description 1
- 230000003111 delayed effect Effects 0.000 description 1
- 230000000694 effects Effects 0.000 description 1
- 238000005516 engineering process Methods 0.000 description 1
- 230000007613 environmental effect Effects 0.000 description 1
- 239000004973 liquid crystal related substance Substances 0.000 description 1
- 238000012423 maintenance Methods 0.000 description 1
- 230000001151 other effect Effects 0.000 description 1
- 230000000717 retained effect Effects 0.000 description 1
- 239000004065 semiconductor Substances 0.000 description 1
- 239000007787 solid Substances 0.000 description 1
- 230000001052 transient effect Effects 0.000 description 1
- 230000007704 transition Effects 0.000 description 1
Images


Classifications
-
- G—PHYSICS
- G01—MEASURING; TESTING
- G01D—MEASURING NOT SPECIALLY ADAPTED FOR A SPECIFIC VARIABLE; ARRANGEMENTS FOR MEASURING TWO OR MORE VARIABLES NOT COVERED IN A SINGLE OTHER SUBCLASS; TARIFF METERING APPARATUS; MEASURING OR TESTING NOT OTHERWISE PROVIDED FOR
- G01D5/00—Mechanical means for transferring the output of a sensing member; Means for converting the output of a sensing member to another variable where the form or nature of the sensing member does not constrain the means for converting; Transducers not specially adapted for a specific variable
- G01D5/26—Mechanical means for transferring the output of a sensing member; Means for converting the output of a sensing member to another variable where the form or nature of the sensing member does not constrain the means for converting; Transducers not specially adapted for a specific variable characterised by optical transfer means, i.e. using infrared, visible, or ultraviolet light
- G01D5/32—Mechanical means for transferring the output of a sensing member; Means for converting the output of a sensing member to another variable where the form or nature of the sensing member does not constrain the means for converting; Transducers not specially adapted for a specific variable characterised by optical transfer means, i.e. using infrared, visible, or ultraviolet light with attenuation or whole or partial obturation of beams of light
- G01D5/34—Mechanical means for transferring the output of a sensing member; Means for converting the output of a sensing member to another variable where the form or nature of the sensing member does not constrain the means for converting; Transducers not specially adapted for a specific variable characterised by optical transfer means, i.e. using infrared, visible, or ultraviolet light with attenuation or whole or partial obturation of beams of light the beams of light being detected by photocells
- G01D5/353—Mechanical means for transferring the output of a sensing member; Means for converting the output of a sensing member to another variable where the form or nature of the sensing member does not constrain the means for converting; Transducers not specially adapted for a specific variable characterised by optical transfer means, i.e. using infrared, visible, or ultraviolet light with attenuation or whole or partial obturation of beams of light the beams of light being detected by photocells influencing the transmission properties of an optical fibre
- G01D5/35338—Mechanical means for transferring the output of a sensing member; Means for converting the output of a sensing member to another variable where the form or nature of the sensing member does not constrain the means for converting; Transducers not specially adapted for a specific variable characterised by optical transfer means, i.e. using infrared, visible, or ultraviolet light with attenuation or whole or partial obturation of beams of light the beams of light being detected by photocells influencing the transmission properties of an optical fibre using other arrangements than interferometer arrangements
- G01D5/35354—Sensor working in reflection
- G01D5/35358—Sensor working in reflection using backscattering to detect the measured quantity
-
- G—PHYSICS
- G01—MEASURING; TESTING
- G01D—MEASURING NOT SPECIALLY ADAPTED FOR A SPECIFIC VARIABLE; ARRANGEMENTS FOR MEASURING TWO OR MORE VARIABLES NOT COVERED IN A SINGLE OTHER SUBCLASS; TARIFF METERING APPARATUS; MEASURING OR TESTING NOT OTHERWISE PROVIDED FOR
- G01D5/00—Mechanical means for transferring the output of a sensing member; Means for converting the output of a sensing member to another variable where the form or nature of the sensing member does not constrain the means for converting; Transducers not specially adapted for a specific variable
- G01D5/26—Mechanical means for transferring the output of a sensing member; Means for converting the output of a sensing member to another variable where the form or nature of the sensing member does not constrain the means for converting; Transducers not specially adapted for a specific variable characterised by optical transfer means, i.e. using infrared, visible, or ultraviolet light
- G01D5/32—Mechanical means for transferring the output of a sensing member; Means for converting the output of a sensing member to another variable where the form or nature of the sensing member does not constrain the means for converting; Transducers not specially adapted for a specific variable characterised by optical transfer means, i.e. using infrared, visible, or ultraviolet light with attenuation or whole or partial obturation of beams of light
- G01D5/34—Mechanical means for transferring the output of a sensing member; Means for converting the output of a sensing member to another variable where the form or nature of the sensing member does not constrain the means for converting; Transducers not specially adapted for a specific variable characterised by optical transfer means, i.e. using infrared, visible, or ultraviolet light with attenuation or whole or partial obturation of beams of light the beams of light being detected by photocells
- G01D5/353—Mechanical means for transferring the output of a sensing member; Means for converting the output of a sensing member to another variable where the form or nature of the sensing member does not constrain the means for converting; Transducers not specially adapted for a specific variable characterised by optical transfer means, i.e. using infrared, visible, or ultraviolet light with attenuation or whole or partial obturation of beams of light the beams of light being detected by photocells influencing the transmission properties of an optical fibre
- G01D5/35338—Mechanical means for transferring the output of a sensing member; Means for converting the output of a sensing member to another variable where the form or nature of the sensing member does not constrain the means for converting; Transducers not specially adapted for a specific variable characterised by optical transfer means, i.e. using infrared, visible, or ultraviolet light with attenuation or whole or partial obturation of beams of light the beams of light being detected by photocells influencing the transmission properties of an optical fibre using other arrangements than interferometer arrangements
- G01D5/35341—Sensor working in transmission
-
- G—PHYSICS
- G01—MEASURING; TESTING
- G01H—MEASUREMENT OF MECHANICAL VIBRATIONS OR ULTRASONIC, SONIC OR INFRASONIC WAVES
- G01H9/00—Measuring mechanical vibrations or ultrasonic, sonic or infrasonic waves by using radiation-sensitive means, e.g. optical means
- G01H9/004—Measuring mechanical vibrations or ultrasonic, sonic or infrasonic waves by using radiation-sensitive means, e.g. optical means using fibre optic sensors
-
- G—PHYSICS
- G02—OPTICS
- G02B—OPTICAL ELEMENTS, SYSTEMS OR APPARATUS
- G02B6/00—Light guides; Structural details of arrangements comprising light guides and other optical elements, e.g. couplings
- G02B6/46—Processes or apparatus adapted for installing or repairing optical fibres or optical cables
- G02B6/48—Overhead installation
-
- H—ELECTRICITY
- H02—GENERATION; CONVERSION OR DISTRIBUTION OF ELECTRIC POWER
- H02G—INSTALLATION OF ELECTRIC CABLES OR LINES, OR OF COMBINED OPTICAL AND ELECTRIC CABLES OR LINES
- H02G1/00—Methods or apparatus specially adapted for installing, maintaining, repairing or dismantling electric cables or lines
- H02G1/02—Methods or apparatus specially adapted for installing, maintaining, repairing or dismantling electric cables or lines for overhead lines or cables
Definitions
- This disclosure relates to a utility pole deterioration detection system, a utility pole deterioration detection method, and a utility pole deterioration detection device.
- the abnormality detection of the utility pole is often performed manually. For example, the worker judges the abnormality only visually, or judges the abnormality by the sound of hitting the utility pole.
- the abnormality of the utility pole is detected manually, it takes a lot of cost and time, and the detection and countermeasure of the abnormality may be delayed. Therefore, recently, a system for monitoring an abnormality of a utility pole using an optical fiber has been proposed (for example, Patent Documents 1 and 2).
- a nesting detection core wire which is an optical fiber for detecting nesting on a utility pole.
- the nesting detection core wire bends due to nesting on a utility pole, the nesting detection core wire is distorted by bending or pulling, and the strength of the optical signal propagating inside the nesting detection core wire is attenuated. Therefore, by detecting the amount of loss due to this attenuation by OTDR measurement, it is detected that the utility pole has been nested.
- an object of the present disclosure is to provide a utility pole deterioration detection system, a utility pole deterioration detection method, and a utility pole deterioration detection device capable of solving the above-mentioned problems and detecting the deterioration state of the utility pole with high accuracy.
- the utility pole deterioration detection system is Optical fibers for sensing laid on multiple utility poles, A receiving unit that receives vibration information detected by the sensing optical fiber, and Based on the vibration information, a specific unit that specifies the natural frequency of each of the plurality of utility poles, and An analysis unit that analyzes the deterioration state of at least one of the plurality of utility poles based on the natural frequency of each of the plurality of utility poles. To be equipped.
- the utility pole deterioration detection method is It is a utility pole deterioration detection method using a utility pole deterioration detection system.
- a reception step that receives vibration information detected by sensing optical fibers laid on multiple utility poles, Based on the vibration information, a specific step of specifying the natural frequency of each of the plurality of utility poles, and
- An analysis step for analyzing the deterioration state of at least one utility pole among the plurality of utility poles based on the natural frequency of each of the plurality of utility poles. including.
- the utility pole deterioration detection device is A receiver that receives vibration information detected by sensing optical fibers laid on multiple utility poles, Based on the vibration information, a specific unit that specifies the natural frequency of each of the plurality of utility poles, and An analysis unit that analyzes the deterioration state of at least one of the plurality of utility poles based on the natural frequency of each of the plurality of utility poles. To be equipped.
- an electric pole deterioration detection system capable of detecting a deterioration state of a utility pole with high accuracy, a utility pole deterioration detection method, and a utility pole deterioration detection device.
- FIG. It is a figure which shows the configuration example of the utility pole deterioration detection system which concerns on Embodiment 1.
- FIG. It is a figure which shows the example of the content of the correspondence table held by the specific part which concerns on Embodiment 1.
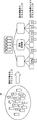
- FIG. It is a flow chart which shows the example of the flow of the whole operation of the utility pole deterioration detection system which concerns on Embodiment 1.
- FIG. It is a block diagram which shows the structural example of the utility pole deterioration detection apparatus which concerns on Embodiment 2.
- FIG. It is a figure which shows the example of the clustering operation by the clustering part which concerns on Embodiment 2.
- FIG. 5 is a flow chart showing an example of an operation flow for calculating a feature having a high contribution rate to a natural frequency in the utility pole deterioration detection system according to the second embodiment.
- FIG. 5 is a flow chart showing an example of an operation flow for calculating a standard natural frequency for each cluster in the utility pole deterioration detection system according to the second embodiment.
- FIG. 5 is a flow chart showing an example of an operation flow for analyzing a deterioration state of a utility pole to be analyzed in the utility pole deterioration detection system according to the second embodiment.
- FIG. 1 a configuration example of the utility pole deterioration detection system according to the first embodiment will be described with reference to FIG.
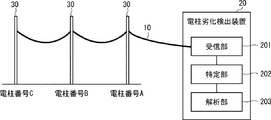
- three utility poles 30 are shown for the sake of simplification of the description, but the number of utility poles 30 may be two or more. Further, it is assumed that the utility pole numbers of the three utility poles 30 shown in FIG. 1 are A, B, and C, respectively.
- the utility pole deterioration detection system includes a sensing optical fiber 10 and a utility pole deterioration detection device 20. Further, the utility pole deterioration detection device 20 includes a receiving unit 201, a specific unit 202, and an analysis unit 203.
- the sensing optical fiber 10 is laid on a plurality of utility poles 30 (three utility poles 30 in FIG. 1).
- the sensing optical fiber 10 may be laid on the utility pole 30 in the form of a cable formed by covering one or more sensing optical fibers 10. Further, the sensing optical fiber 10 may be an existing communication optical fiber or a newly installed optical fiber.
- the receiving unit 201 incidents pulsed light on the sensing optical fiber 10 and transmits the reflected light or scattered light generated by the pulsed light being transmitted through the sensing optical fiber 10 via the sensing optical fiber 10. , Received as return light (optical signal).
- the utility pole 30 is vibrating not a little due to the influence of natural vibration of the ground, automobiles running in the vicinity, wind, and the like.
- the vibration of the utility pole 30 is transmitted to the sensing optical fiber 10, and the characteristics (for example, wavelength) of the return light transmitted through the sensing optical fiber 10 are changed. Therefore, the sensing optical fiber 10 can detect vibration information indicating vibration generated on the utility pole 30. Further, since the characteristics of the return light transmitted through the sensing optical fiber 10 change according to the vibration information of the utility pole 30 detected by the sensing optical fiber 10, the vibration of the utility pole 30 detected by the sensing optical fiber 10 Contains information.
- the vibration information of the utility pole 30 is a pattern that dynamically fluctuates, and shows a unique vibration pattern in which the strength of vibration, the vibration position, the transition of fluctuation of the frequency, and the like are different. Therefore, the specifying unit 202 can specify the natural frequency of the utility pole 30 by analyzing the dynamic change of the vibration pattern of the utility pole 30 indicated by the vibration information.
- the specific unit 202 holds in advance a corresponding table in which the utility pole number of the utility pole 30 and the position information (position information indicating the distance from the utility pole deterioration detection device 20) are associated with each of the plurality of utility poles 30. ..
- FIG. 2 shows an example of the contents of the corresponding table.
- the specific unit 202 is based on, for example, the time difference between the reception unit 201 transmitting the pulsed light to the sensing optical fiber 10 and the reception of the return light, the intensity of the return light received by the reception unit 201, and the like. It is possible to specify at which position (distance from the utility pole deterioration detection device 20) the return light is generated on the sensing optical fiber 10.
- the identification unit 202 collates the position on the sensing optical fiber 10 in which the return light is generated with the corresponding table shown in FIG. 2, and determines which electric pole 30 the return light is generated in. It is possible to identify.
- the identification unit 202 identifies the return light generated by each of the plurality of utility poles 30 from the return light received by the reception unit 201, and based on the vibration information included in the specified return light, the plurality of utility poles.
- Each of the 30 natural frequencies is specified.
- the analysis unit 203 can analyze the deterioration state of at least one utility pole 30 among the plurality of utility poles 30 based on the natural frequencies of the plurality of utility poles 30.
- the analysis unit 203 may analyze the deterioration state of at least one utility pole 30 among the plurality of utility poles 30 based on the distribution information showing the distribution of the natural frequencies of the plurality of utility poles 30. For example, the analysis unit 203 can analyze that if there is a utility pole 30 whose natural frequency is lower than that of the other utility pole 30, the utility pole 30 is deteriorated.
- each of the plurality of utility poles 30 has unique characteristics (for example, the type of the installation road surface on which the utility pole 30 is installed, the material, density, thickness, length, and overburden depth of the utility pole 30, and the utility pole 30. It has the type, thickness, and number of supporting wires). Therefore, it is considered that the natural frequency of the utility pole 30 also differs depending on the characteristics of the utility pole 30.
- the analysis unit 203 clusters the plurality of utility poles 30 into clusters based on the characteristics of the plurality of utility poles 30, and based on the distribution information of the natural frequencies of one or more utility poles 30 belonging to the same cluster.
- the deterioration state of at least one utility pole 30 belonging to the cluster may be analyzed.
- the deterioration state of the utility pole 30 belonging to the cluster can be analyzed based on the distribution of the natural frequency of the utility pole 30 after eliminating the influence of the characteristics of the utility pole 30, so that the analysis accuracy of the deterioration state of the utility pole 30 is improved. Can be planned.
- each feature of the utility pole 30 includes a feature having a high contribution rate to the natural frequency and a feature having a low contribution rate. Therefore, by performing clustering so that the utility poles 30 having similar characteristics having a high contribution rate to the natural frequency belong to the same cluster, it is possible to further improve the analysis accuracy of the deterioration state of the utility pole 30. it is conceivable that.
- the analysis unit 203 identifies a feature having a high contribution rate to the natural frequency from each feature of the utility pole 30, and clusters a plurality of utility poles 30 into a cluster based on the specified feature of each of the plurality of utility poles 30. You may. As a result, the accuracy of analysis of the deteriorated state of the utility pole 30 can be further improved.
- a method of identifying a feature having a high contribution rate to the natural frequency from each feature of the utility pole 30, for example a multiple regression analysis is performed to calculate the contribution rate of each feature of the utility pole 30 to the natural frequency. Methods and the like can be considered, but the method is not limited to this.
- the analysis unit 203 may hold soundness information indicating the soundness of each of the plurality of utility poles 30. Then, the analysis unit 203 may analyze the deterioration state of at least one utility pole 30 belonging to the cluster based on the distribution information of the natural frequencies of each of the sound one or more utility poles 30 belonging to the same cluster. .. More specifically, the analysis unit 203 bases on the distribution information of the natural frequencies of one or more healthy electric columns 30 belonging to the same cluster, and the standard natural vibration of the healthy electric columns 30 belonging to the cluster.
- the standard natural frequency which is a number, is calculated, and the deterioration state of the electric column 30 to be analyzed is analyzed based on the standard natural frequency of the cluster and the natural frequency of the electric column 30 to be analyzed belonging to the cluster. Is also good. As a result, the accuracy of analysis of the deteriorated state of the utility pole 30 can be further improved.
- the receiving unit 201 receives the return light including the vibration information detected by the sensing optical fiber 10 from the sensing optical fiber 10 (step S101).
- the specifying unit 202 specifies the natural frequencies of the plurality of utility poles 30 based on the vibration information included in the return light received by the receiving unit 201 (step S102).
- the analysis unit 203 analyzes the deterioration state of at least one utility pole 30 among the plurality of utility poles 30 based on the natural frequencies of the plurality of utility poles 30 specified by the specific unit 202 (step S103).
- the receiving unit 201 receives the vibration information detected by the sensing optical fiber 10, and the specific unit 202 is unique to each of the plurality of utility poles 30 based on the vibration information.
- the frequency is specified, and the analysis unit 203 analyzes the deterioration state of at least one utility pole 30 among the plurality of utility poles 30 based on the natural frequencies of the plurality of utility poles 30. Therefore, the deteriorated state of the utility pole 30 can be detected with high accuracy.
- the deterioration state of a plurality of utility poles 30 can be analyzed simultaneously and remotely by using the sensing optical fiber 10, it becomes easy to grasp the deterioration state of the utility pole 30. At the same time, the cost for grasping the deteriorated state of the utility pole 30 can be reduced.
- an existing communication optical fiber can be used as the sensing optical fiber 10.
- an existing optical fiber for communication may be used, and as in Patent Document 1, the optical fiber may be laid linearly or spirally in the vertical direction of the utility pole. Unlike Patent Document 2, it is not necessary to lay a core wire for detecting nesting. Therefore, since a dedicated structure for detecting the deterioration state of the utility pole 30 is not required, the utility pole deterioration detection system can be constructed at low cost.
- the optical fiber sensing technology using the sensing optical fiber 10 as a sensor is used. Therefore, advantages such as being unaffected by electromagnetic noise, eliminating the need for power supply to the sensor, being excellent in environmental resistance, and facilitating maintenance can be obtained.
- the utility pole deterioration detection system according to the second embodiment is a more specific version of the utility pole deterioration detection system according to the first embodiment described above. Specifically, the utility pole deterioration detection system according to the second embodiment replaces the utility pole deterioration detection device 20 of the first embodiment described above with the utility pole deterioration detection device 20A, and has an external system configuration. , The same as the above-described first embodiment.
- the utility pole deterioration detection device 20A includes a receiving unit 211, a collecting unit 212, a natural frequency calculation unit 213, a contribution rate analysis unit 214, and a utility pole DB (Database) 215. It includes a clustering unit 216, a standard natural frequency calculation unit 217, a standard natural frequency DB 218, and a deterioration degree calculation unit 219.
- the receiving unit 211 corresponds to the receiving unit 201 of FIG.
- the combination of the collecting unit 212 and the natural frequency calculation unit 213 corresponds to the specific unit 202 of FIG.
- the combination of the contribution rate analysis unit 214, the utility pole DB 215, the clustering unit 216, the standard natural frequency calculation unit 217, the standard natural frequency DB 218, and the deterioration degree calculation unit 219 corresponds to the analysis unit 203 of FIG.
- the receiving unit 211 incidents pulsed light on the sensing optical fiber 10 and transmits the reflected light or scattered light generated by the pulsed light being transmitted through the sensing optical fiber 10 via the sensing optical fiber 10. , Received as return light.
- the return light received by the receiving unit 211 includes the return light generated in each of the plurality of utility poles 30.
- each return light includes vibration information indicating vibration generated in the corresponding utility pole 30.
- the utility pole DB 215 has, for each of the plurality of utility poles 30 on which the sensing optical fiber 10 is laid, the utility pole number of the utility pole 30, the soundness information indicating the soundness of the utility pole 30, and the position information of the utility pole 30 (the utility pole deterioration detection device). Position information indicating the distance from 20A) and the characteristics of the utility pole 30 (for example, the type of the installation road surface on which the utility pole 30 is installed, the material, density, thickness, length, and overburden depth of the utility pole 30). , The type, thickness, number, etc. of the electric wires supported by the utility pole 30) are registered in this database.
- FIG. 5 shows an example of the contents of the utility pole DB 215.
- the collecting unit 212 collects vibration information included in the return light received by the receiving unit 211.
- the collection unit 212 returns, for example, based on the time difference between the reception unit 211 transmitting the pulsed light to the sensing optical fiber 10 and the reception of the return light, the intensity of the return light received by the reception unit 211, and the like. It is possible to specify at which position (distance from the utility pole deterioration detection device 20A) the light is generated on the sensing optical fiber 10. Further, in the utility pole DB 215, as described above, the utility pole number and the position information of the utility pole 30 are registered for each of the plurality of utility poles 30.
- the collecting unit 212 can identify which utility pole 30 the return light is generated by by collating the position on the sensing optical fiber 10 where the return light is generated with the utility pole DB 215. Is. Therefore, the collecting unit 212 can collect the vibration information of the specific utility pole 30.
- the collecting unit 212 is not limited to using the utility pole DB 215.
- the collecting unit 212 holds a corresponding table as shown in FIG. 2 according to the first embodiment described above, and uses the corresponding table to specify which utility pole 30 the return light is generated from. You may.
- the natural frequency calculation unit 213 calculates the natural frequency of the utility pole 30 based on the vibration information of the utility pole 30 collected by the collection unit 212.
- the vibration information of the utility pole 30 collected by the collecting unit 212 is a vibration pattern peculiar to the utility pole 30, and shows a dynamically fluctuating vibration pattern. Therefore, the natural frequency calculation unit 213 can calculate the natural frequency of the utility pole 30 by analyzing the dynamic change of the vibration pattern of the utility pole 30.
- the contribution rate analysis unit 214 calculates a feature Top K having a high contribution rate to the natural frequency from each feature of the utility pole 30 registered in the utility pole DB 215, and holds the calculated feature Top K.
- Feature Top K may include only one feature or may include a plurality of features.
- a method of calculating the feature Top K in the contribution rate analysis unit 214 for example, a method of performing multiple regression analysis to calculate the contribution rate of each feature of the utility pole 30 to the natural frequency can be considered.
- the calculation method of the feature Top K is not limited to this.
- the clustering unit 216 clusters one or more sound utility poles 30 out of a plurality of utility poles 30 on which the sensing optical fiber 10 is laid into a cluster.
- the concept of this clustering operation is shown in FIG.
- the clustering unit 216 first clusters one or more healthy utility poles 30 into a cluster based on the natural frequency calculated by the natural frequency calculation unit 213, and further clusters the contribution rate analysis. Clustering is performed in a cluster based on the feature Top K calculated by the unit 214.
- the standard natural frequency calculation unit 217 statistically divides each cluster clustered by the clustering unit 216 into the cluster based on the distribution information of the natural frequencies of one or more sound poles 30 belonging to the cluster.
- the standard natural frequency which is the standard natural frequency of the sound electric column 30 to which the electric column 30 belongs, is calculated.
- the standard natural frequency of a cluster in the standard natural frequency calculation unit 217 for example, the average value, the median value, and the mode of the natural frequencies of one or more sound electric columns 30 belonging to the cluster are used.
- a method of calculating the value or the like as the standard natural frequency can be considered.
- the calculation method of the standard natural frequency is not limited to this.
- the standard natural frequency DB 218 is a database in which the utility pole number of the utility pole 30 belonging to the cluster, the standard natural frequency of the cluster, etc. are registered for each cluster clustered by the clustering unit 216.
- FIG. 7 shows an example of the contents of the standard natural frequency DB 218.
- the clustering unit 216 determines the cluster to which the utility pole 30 to be analyzed belongs based on the feature Top K of the utility pole 30 to be analyzed registered in the utility pole DB 215.
- the deterioration degree calculation unit 219 analyzes based on the standard natural frequency of the cluster to which the utility pole 30 to be analyzed belongs and the natural frequency of the utility pole 30 to be analyzed. The degree of deterioration of the target utility pole 30 is calculated. For example, the deterioration degree calculation unit 219 calculates the deterioration degree of the utility pole 30 to be analyzed by using the following mathematical formula 1.
- the deterioration degree calculation unit 219 holds in advance a threshold value used for analyzing the deterioration state of the utility pole 30 belonging to the cluster for each cluster clustered by the clustering unit 216. Then, the deterioration degree calculation unit 219 compares the deterioration degree of the utility pole 30 to be analyzed with the threshold value of the cluster to which the utility pole 30 to be analyzed belongs by using the following mathematical formula 2. When the degree of deterioration exceeds the threshold value, the degree of deterioration calculation unit 219 analyzes that the utility pole 30 to be analyzed is deteriorated.
- the threshold value for each cluster may be set statistically based on the distribution information of the natural frequency of the utility pole 30 belonging to the cluster. Further, the analyst may analyze the actual utility pole 30 analyzed by the deterioration degree calculation unit 219 to measure the actual deterioration degree, and reflect the actual measurement result in the threshold setting. ..
- the deterioration degree calculation unit 219 may notify an alert.
- the alert notification destination may be, for example, a terminal possessed by an observer who monitors the utility pole 30 to be analyzed, a terminal installed in the monitoring center, or the like.
- the alert notification method may be, for example, a method of displaying a GUI (Graphical User Interface) screen on the display or monitor of the notification destination terminal, or a method of outputting a message by voice from the speaker of the notification destination terminal. ..
- GUI Graphic User Interface
- the collecting unit 212 selects a sound utility pole 30 from a plurality of utility poles 30 on which the sensing optical fiber 10 is laid, based on the soundness information registered in the utility pole DB 215. Identify. Here, it is assumed that one or more sound utility poles 30 have been identified. Then, the collecting unit 212 collects the vibration information included in the return light generated by each of one or more sound utility poles 30 among the return lights received by the receiving unit 211 (step S201).
- the natural frequency calculation unit 213 calculates the natural frequency of each of the sound one or more utility poles 30 based on the vibration information of each of the sound one or more utility poles 30 collected by the collection unit 212. (Step S202).
- the contribution rate analysis unit 214 includes the natural frequencies of each of the sound one or more utility poles 30 calculated by the natural frequency calculation unit 213, and the sound one or more utility poles 30 registered in the utility pole DB 215. Based on each of the features of the above, the contribution ratio of each feature of the utility pole 30 registered in the utility pole DB 215 to the natural frequency is analyzed (step S203).
- the contribution rate analysis unit 214 determines the contribution rate to the natural frequency from each feature of the utility pole 30 based on the analysis result of the contribution rate of each feature of the utility pole 30 registered in the utility pole DB 215 to the natural frequency.
- the characteristic Top K having a high value is calculated, and the calculated characteristic Top K is retained (step S204).
- Feature Top K may include only one feature or may include a plurality of features.
- steps S301 and S302 similar to steps S201 and S202 of FIG. 8 are performed.
- the clustering unit 216 clusters one or more sound utility poles 30 into a cluster based on the natural frequency calculated by the natural frequency calculation unit 213, and further, the contribution rate analysis unit 214 calculates it. Clustering into clusters based on feature Top K (step S303). At this time, the clustering unit 216 does not need to target all of the sound utility poles 30 specified by the collecting unit 212 as clustering targets, and may target only a part of them.
- the standard natural frequency calculation unit 217 belongs to each cluster clustered by the clustering unit 216, based on the distribution information of the natural frequencies of one or more sound utility poles 30 belonging to the cluster.
- the standard natural frequency of a sound utility pole 30 is calculated (step S304).
- the clustering unit 216 registers each utility pole number of one or more sound utility poles 30 belonging to the cluster in the standard natural frequency DB 218 for each cluster clustered by the clustering unit 216. Further, the standard natural frequency calculation unit 217 registers the standard natural frequency of the cluster in the standard natural frequency DB 218 for each cluster clustered by the clustering unit 216 (step S305).
- FIG. 10 an example of an operation flow for analyzing the deterioration state of the utility pole 30 to be analyzed will be described.
- an arbitrary number (or all of them) of utility poles 30 among a plurality of utility poles 30 on which the sensing optical fiber 10 is laid are sequentially analyzed one by one, and one utility pole 30 is analyzed. Will be described in order, assuming that the processing of FIG. 10 is performed.
- the collecting unit 212 collects vibration information included in the return light generated in the utility pole 30 to be analyzed among the return light received by the receiving unit 211 (step S401).
- the natural frequency calculation unit 213 calculates the natural frequency of the utility pole 30 to be analyzed based on the vibration information of the utility pole 30 to be analyzed collected by the collection unit 212 (step S402).
- the clustering unit 216 determines the cluster to which the utility pole 30 to be analyzed belongs based on the feature Top K of the utility pole 30 to be analyzed registered in the utility pole DB 215 (step S403).
- the process of step S403 can be omitted.
- the deterioration degree calculation unit 219 includes the standard natural frequency of the cluster to which the utility pole 30 to be analyzed belongs, which is registered in the standard natural frequency DB 218, and the utility pole 30 to be analyzed calculated by the natural frequency calculation unit 213.
- the degree of deterioration of the utility pole 30 to be analyzed is calculated based on the natural frequency of (step S404).
- the deterioration degree calculation unit 219 determines whether or not the deterioration degree of the utility pole 30 to be analyzed exceeds the threshold value of the cluster to which the utility pole 30 to be analyzed belongs (step S405).
- step S405 when the degree of deterioration of the utility pole 30 to be analyzed exceeds the threshold value (Yes in step S405), the deterioration degree calculation unit 219 analyzes that the utility pole 30 to be analyzed is deteriorated and notifies an alert. (Step S406).
- the deterioration state of any number of utility poles 30 may be analyzed at regular intervals, or when requested by an observer or a monitoring center. Further, an arbitrary number of utility poles 30 to be analyzed may be set in advance, or may be designated by an observer or a monitoring center.
- the utility pole 30 to be analyzed preferably belongs to one cluster, but may belong to a plurality of clusters.
- the cluster to which the utility pole 30 to be analyzed belongs is determined to be a plurality of clusters.
- the processes of steps S404 to S406 may be performed for each of the plurality of clusters thereafter.
- the natural frequency calculation unit 213 calculates the natural frequency of the sound electric column 30 based on the vibration information of the sound electric column 30, and the clustering unit 216 calculates the natural frequency of the sound electric column 30.
- the electric poles 30 are clustered in a cluster, and the standard natural frequency calculation unit 217 standardizes the sound electric poles 30 belonging to the cluster based on the distribution information of the natural frequencies of the sound electric poles 30 belonging to the cluster for each cluster. Calculate the natural frequency. Therefore, the standard natural frequency can be calculated from the vibration information of the utility pole 30.
- the natural frequency calculation unit 213 calculates the natural frequency of the utility pole 30 to be analyzed based on the vibration information of the utility pole 30 to be analyzed, and the clustering unit 216 is the analysis target.
- the deterioration degree calculation unit 219 determines the cluster to which the utility pole 30 belongs, and the deterioration degree calculation unit 219 determines the utility pole to be analyzed based on the standard natural frequency of the cluster to which the utility pole 30 to be analyzed belongs and the natural frequency of the utility pole 30 to be analyzed.
- the degree of deterioration of 30 is calculated. Therefore, the deteriorated state of the utility pole 30 can be detected with high accuracy.
- Other effects are the same as those in the first embodiment described above.
- the computer 40 includes a processor 401, a memory 402, a storage 403, an input / output interface (input / output I / F) 404, a communication interface (communication I / F) 405, and the like.
- the processor 401, the memory 402, the storage 403, the input / output interface 404, and the communication interface 405 are connected by a data transmission line for transmitting and receiving data to and from each other.
- the processor 401 is, for example, an arithmetic processing unit such as a CPU (Central Processing Unit) or a GPU (Graphics Processing Unit).
- the memory 402 is, for example, a memory such as a RAM (Random Access Memory) or a ROM (Read Only Memory).
- the storage 403 is, for example, a storage device such as an HDD (Hard Disk Drive), an SSD (Solid State Drive), or a memory card. Further, the storage 403 may be a memory such as a RAM or a ROM.
- the storage 403 stores a program that realizes the functions of the components included in the utility pole deterioration detection devices 20 and 20A. By executing each of these programs, the processor 401 realizes the functions of the components included in the utility pole deterioration detection devices 20 and 20A, respectively. Here, when executing each of the above programs, the processor 401 may read these programs onto the memory 402 and then execute the programs, or may execute the programs without reading them onto the memory 402. The memory 402 and the storage 403 also play a role of storing information and data held by the components included in the utility pole deterioration detection devices 20 and 20A.
- Non-temporary computer-readable media include various types of tangible storage media.
- Examples of non-temporary computer-readable media include magnetic recording media (eg, flexible disks, magnetic tapes, hard disk drives), photomagnetic recording media (eg, photomagnetic discs), CD-ROMs (Compact Disc-ROMs), CDs. -R (CD-Recordable), CD-R / W (CD-ReWritable), semiconductor memory (for example, mask ROM, PROM (Programmable ROM), EPROM (Erasable PROM), flash ROM, RAM.
- the program also includes.
- the computer-readable medium can supply the program to the computer via a wired communication path such as an electric wire and an optical fiber, or a wireless communication path.
- the input / output interface 404 is connected to a display device 4041, an input device 4042, a sound output device 4043, and the like.
- the display device 4041 is a device that displays a screen corresponding to drawing data processed by the processor 401, such as an LCD (Liquid Crystal Display), a CRT (Cathode Ray Tube) display, and a monitor.
- the input device 4042 is a device that receives an operator's operation input, and is, for example, a keyboard, a mouse, a touch sensor, and the like.
- the display device 4041 and the input device 4042 may be integrated and realized as a touch panel.
- the sound output device 4043 is a device such as a speaker that acoustically outputs sound corresponding to acoustic data processed by the processor 401.
- the communication interface 405 sends and receives data to and from an external device.
- the communication interface 405 communicates with an external device via a wired communication path or a wireless communication path.
- the utility pole deterioration detection devices 20 and 20A are provided with a plurality of components, but the present invention is not limited to this.
- the components provided in the utility pole deterioration detection devices 20 and 20A are not limited to being provided in one device, and may be distributed in a plurality of devices.
- the analysis target may be a structure such as a bridge, a tunnel, a pipe, or a dam.
- these structures are targeted for analysis, by laying the sensing optical fibers 10 at a plurality of locations of these structures, it is possible to analyze the deterioration state of each of the plurality of locations.
- Appendix 1 Optical fibers for sensing laid on multiple utility poles, A receiving unit that receives vibration information detected by the sensing optical fiber, and Based on the vibration information, a specific unit that specifies the natural frequency of each of the plurality of utility poles, and An analysis unit that analyzes the deterioration state of at least one of the plurality of utility poles based on the natural frequency of each of the plurality of utility poles.
- a utility pole deterioration detection system Optical fibers for sensing laid on multiple utility poles.
- the analysis unit Holds soundness information indicating the soundness of each of the plurality of utility poles, Based on the soundness information, a sound utility pole is identified from the plurality of utility poles, and the utility pole is identified. Based on the distribution information of the natural frequencies of each of one or more healthy utility poles belonging to the same cluster, the deterioration state of at least one utility pole belonging to the cluster is analyzed.
- the utility pole deterioration detection system according to Appendix 3. (Appendix 5)
- the analysis unit Based on the distribution information of the natural frequencies of each of one or more healthy utility poles belonging to the same cluster, the standard natural frequency, which is the standard natural frequency of the healthy utility poles belonging to the cluster, is calculated.
- the utility pole deterioration detection system according to Appendix 4.
- the analysis unit Among the characteristics of the utility pole, the feature having a high contribution rate to the natural frequency of the utility pole was identified.
- the utility pole deterioration detection system according to any one of Appendix 3 to 5.
- Appendix 7) It is a utility pole deterioration detection method using a utility pole deterioration detection system.
- a reception step that receives vibration information detected by sensing optical fibers laid on multiple utility poles, Based on the vibration information, a specific step of specifying the natural frequency of each of the plurality of utility poles, and An analysis step for analyzing the deterioration state of at least one utility pole among the plurality of utility poles based on the natural frequency of each of the plurality of utility poles.
- Utility pole deterioration detection method including. (Appendix 8) In the analysis step, Based on the distribution information showing the distribution of the natural frequencies of each of the plurality of utility poles, the deterioration state of at least one of the plurality of utility poles is analyzed.
- the utility pole deterioration detection method according to Appendix 7.
- the deterioration state of at least one utility pole belonging to the cluster is analyzed.
- the utility pole deterioration detection method according to Appendix 9. (Appendix 11)
- the standard natural frequency which is the standard natural frequency of the healthy utility poles belonging to the cluster, is calculated.
- the deterioration state of the utility pole to be analyzed is analyzed.
Landscapes
- Physics & Mathematics (AREA)
- General Physics & Mathematics (AREA)
- Optics & Photonics (AREA)
- Measurement Of Mechanical Vibrations Or Ultrasonic Waves (AREA)
Abstract
本開示に係る電柱劣化検出システムは、複数の電柱(30)に敷設されたセンシング用光ファイバ(10)と、センシング用光ファイバ(10)が検知した振動情報を受信する受信部(201)と、振動情報に基づき、複数の電柱(30)のそれぞれの固有振動数を特定する特定部(202)と、複数の電柱(30)のそれぞれの固有振動数に基づき、複数の電柱(30)のうち少なくとも1つの電柱(30)の劣化状態を解析する解析部(203)と、を備える。
Description
本開示は、電柱劣化検出システム、電柱劣化検出方法、及び電柱劣化検出装置に関する。
従来、電柱の異常検出は、人手によって行われていることが多く、例えば、作業員が目視のみで異常を判断したり、電柱を叩いた音等で異常を判断したりしていた。しかし、人手によって電柱の異常検出を行う場合、コスト・時間が多大にかかり、異常の発見や対処が遅れてしまうことがある。
そのため、最近は、電柱の異常を、光ファイバを用いて監視するシステムが提案されている(例えば、特許文献1,2)。
そのため、最近は、電柱の異常を、光ファイバを用いて監視するシステムが提案されている(例えば、特許文献1,2)。
特許文献1に記載の技術においては、電柱の上下方向に直線状又は螺旋状に光ファイバを敷設する。自動車の衝突で電柱が折損すると、光ファイバに強い曲りが生じ、光ファイバの内部を伝搬される光信号に損失が発生する。そのため、この損失による損失量をOTDR(Optical Time-Domain Reflectometry)測定により検出することで、複数の電柱のいずれかに折損が発生したことを検出する。
また、特許文献2に記載の技術においては、電柱への営巣の検出用の光ファイバである営巣検出用心線を敷設する。電柱への営巣により営巣検出用心線がたわむと、営巣検出用心線に曲げや引っ張り等の歪みが生じ、営巣検出用心線の内部を伝搬される光信号の強度が減衰する。そのため、この減衰による損失量をOTDR測定により検出することで、電柱に営巣がなされたことを検出する。
ところで、特許文献1,2に記載の技術においては、光ファイバに強い応力がかかった場合の光信号の損失量を監視することで電柱の異常検出を行っている。
したがって、電柱への営巣や折損等の極端な状態は検出することができるものの、電柱の劣化のような、光ファイバへの応力にほとんど影響しないような状態の検出は困難であるという課題がある。
したがって、電柱への営巣や折損等の極端な状態は検出することができるものの、電柱の劣化のような、光ファイバへの応力にほとんど影響しないような状態の検出は困難であるという課題がある。
そこで本開示の目的は、上述した課題を解決し、電柱の劣化状態を高精度に検出することができる電柱劣化検出システム、電柱劣化検出方法、及び電柱劣化検出装置を提供することにある。
一態様による電柱劣化検出システムは、
複数の電柱に敷設されたセンシング用光ファイバと、
前記センシング用光ファイバが検知した振動情報を受信する受信部と、
前記振動情報に基づき、前記複数の電柱のそれぞれの固有振動数を特定する特定部と、
前記複数の電柱のそれぞれの固有振動数に基づき、前記複数の電柱のうち少なくとも1つの電柱の劣化状態を解析する解析部と、
を備える。
複数の電柱に敷設されたセンシング用光ファイバと、
前記センシング用光ファイバが検知した振動情報を受信する受信部と、
前記振動情報に基づき、前記複数の電柱のそれぞれの固有振動数を特定する特定部と、
前記複数の電柱のそれぞれの固有振動数に基づき、前記複数の電柱のうち少なくとも1つの電柱の劣化状態を解析する解析部と、
を備える。
一態様による電柱劣化検出方法は、
電柱劣化検出システムによる電柱劣化検出方法であって、
複数の電柱に敷設されたセンシング用光ファイバが検知した振動情報を受信する受信ステップと、
前記振動情報に基づき、前記複数の電柱のそれぞれの固有振動数を特定する特定ステップと、
前記複数の電柱のそれぞれの固有振動数に基づき、前記複数の電柱のうち少なくとも1つの電柱の劣化状態を解析する解析ステップと、
を含む。
電柱劣化検出システムによる電柱劣化検出方法であって、
複数の電柱に敷設されたセンシング用光ファイバが検知した振動情報を受信する受信ステップと、
前記振動情報に基づき、前記複数の電柱のそれぞれの固有振動数を特定する特定ステップと、
前記複数の電柱のそれぞれの固有振動数に基づき、前記複数の電柱のうち少なくとも1つの電柱の劣化状態を解析する解析ステップと、
を含む。
一態様による電柱劣化検出装置は、
複数の電柱に敷設されたセンシング用光ファイバが検知した振動情報を受信する受信部と、
前記振動情報に基づき、前記複数の電柱のそれぞれの固有振動数を特定する特定部と、
前記複数の電柱のそれぞれの固有振動数に基づき、前記複数の電柱のうち少なくとも1つの電柱の劣化状態を解析する解析部と、
を備える。
複数の電柱に敷設されたセンシング用光ファイバが検知した振動情報を受信する受信部と、
前記振動情報に基づき、前記複数の電柱のそれぞれの固有振動数を特定する特定部と、
前記複数の電柱のそれぞれの固有振動数に基づき、前記複数の電柱のうち少なくとも1つの電柱の劣化状態を解析する解析部と、
を備える。
上述の態様によれば、電柱の劣化状態を高精度に検出することができる電柱劣化検出システム、電柱劣化検出方法、及び電柱劣化検出装置を提供できるという効果が得られる。
以下、図面を参照して本開示の実施の形態について説明する。なお、以下の記載及び図面は、説明の明確化のため、適宜、省略及び簡略化がなされている。また、以下の各図面において、同一の要素には同一の符号が付されており、必要に応じて重複説明は省略されている。
<実施の形態1>
まず、図1を参照して、本実施の形態1に係る電柱劣化検出システムの構成例について説明する。なお、図1においては、説明の簡略化のため、3つの電柱30を示しているが、電柱30の数は2つ以上であれば良い。また、図1に示される3つの電柱30は、それぞれ電柱番号がA,B,Cであるとする。
まず、図1を参照して、本実施の形態1に係る電柱劣化検出システムの構成例について説明する。なお、図1においては、説明の簡略化のため、3つの電柱30を示しているが、電柱30の数は2つ以上であれば良い。また、図1に示される3つの電柱30は、それぞれ電柱番号がA,B,Cであるとする。
図1に示されるように、本実施の形態1に係る電柱劣化検出システムは、センシング用光ファイバ10及び電柱劣化検出装置20を備えている。また、電柱劣化検出装置20は、受信部201、特定部202、及び解析部203を備えている。
センシング用光ファイバ10は、複数の電柱30(図1では3つの電柱30)に敷設されている。センシング用光ファイバ10は、1以上のセンシング用光ファイバ10を被覆して構成されるケーブルの態様で電柱30に敷設されても良い。また、センシング用光ファイバ10は、既存の通信用光ファイバであっても良いし、新設した光ファイバであっても良い。
受信部201は、センシング用光ファイバ10にパルス光を入射し、パルス光がセンシング用光ファイバ10を伝送されることに伴い発生した反射光や散乱光を、センシング用光ファイバ10を経由して、戻り光(光信号)として受信する。
ここで、電柱30は、地面の自然振動、近隣を走る自動車、風等の影響を受けて、少なからず振動している。電柱30の振動は、センシング用光ファイバ10に伝達され、センシング用光ファイバ10を伝送される戻り光の特性(例えば、波長)が変化する。そのため、センシング用光ファイバ10は、電柱30に発生した振動を示す振動情報を検知可能である。また、センシング用光ファイバ10を伝送される戻り光は、センシング用光ファイバ10が検知した電柱30の振動情報に応じて特性が変化することから、センシング用光ファイバ10が検知した電柱30の振動情報を含んでいる。
また、電柱30の振動情報は、動的に変動するパターンであって、振動の強弱、振動位置、振動数の変動の推移等が異なる固有の振動パターンを示している。そのため、特定部202は、振動情報が示す電柱30の振動パターンの動的変化を分析することにより、その電柱30の固有振動数を特定することが可能となる。
また、特定部202は、複数の電柱30毎に、その電柱30の電柱番号と位置情報(電柱劣化検出装置20からの距離を示す位置情報)とを対応付けた対応テーブルを予め保持しておく。図2に対応テーブルの内容の例を示す。
また、特定部202は、例えば、受信部201がセンシング用光ファイバ10にパルス光を送信してから戻り光を受信するまでの時間差や、受信部201が受信した戻り光の強度等に基づき、その戻り光がセンシング用光ファイバ10上のどの位置(電柱劣化検出装置20からの距離)で発生したかを特定することが可能である。
そのため、特定部202は、戻り光が発生したセンシング用光ファイバ10上の位置を、図2に示される対応テーブルと照合することで、その戻り光がどの電柱30で発生したものであるかを特定することが可能である。
そこで、特定部202は、受信部201が受信した戻り光の中から、複数の電柱30のそれぞれにて発生した戻り光を特定し、特定した戻り光に含まれる振動情報に基づき、複数の電柱30のそれぞれの固有振動数を特定する。
ここで、電柱30は、クラック、内部腐食等の発生により劣化すると、固有振動数が低下する。そのため、解析部203は、複数の電柱30のそれぞれの固有振動数に基づき、複数の電柱30のうちの少なくとも1つの電柱30の劣化状態を解析することが可能となる。
このとき、解析部203は、複数の電柱30のそれぞれの固有振動数の分布を示す分布情報に基づき、複数の電柱30のうちの少なくとも1つの電柱30の劣化状態を解析しても良い。例えば、解析部203は、他の電柱30と比較して、固有振動数が低下している電柱30があれば、その電柱30は劣化していると解析することができる。
また、複数の電柱30のそれぞれは、固有の特徴(例えば、電柱30が設置されている設置路面の種類、電柱30の材質、密度、太さ、長さ、及び土被り深さ、電柱30が支えている電線の種類、太さ、及び数等)を有している。そのため、電柱30の固有振動数は、電柱30の特徴によっても異なると考えられる。
そこで、解析部203は、複数の電柱30のそれぞれの特徴に基づき、複数の電柱30をクラスタにクラスタリングし、同一のクラスタに属する1つ以上の電柱30のそれぞれの固有振動数の分布情報に基づき、そのクラスタに属する少なくとも1つの電柱30の劣化状態を解析しても良い。これにより、電柱30の特徴の影響を排除した上で、電柱30の固有振動数の分布に基づき、そのクラスタに属する電柱30の劣化状態を解析できるため、電柱30の劣化状態の解析精度の向上を図ることができる。
ただし、電柱30の各特徴の中には、固有振動数に対する寄与率が高い特徴と寄与率が低い特徴とが含まれると考えられる。そのため、固有振動数に対する寄与率が高い特徴が互いに類似する電柱30同士が、同一のクラスタに属するように、クラスタリングを行うことで、電柱30の劣化状態の解析精度のさらなる向上を図ることができると考えられる。
そこで、解析部203は、電柱30の各特徴の中から固有振動数に対する寄与率が高い特徴を特定し、複数の電柱30のそれぞれの、特定した特徴に基づき、複数の電柱30をクラスタにクラスタリングしても良い。これにより、電柱30の劣化状態の解析精度のさらなる向上を図ることができる。なお、電柱30の各特徴の中から固有振動数に対する寄与率が高い特徴を特定する方法としては、例えば、重回帰分析を行って、電柱30の各特徴の固有振動数に対する寄与率を算出する方法等が考えられるが、これには限定されない。
また、電柱30の劣化状態を解析する場合には、健全な電柱30(例えば、新設された電柱30等)と固有振動数を比較することにより、劣化状態を解析することが好適であると考えられる。
そこで、解析部203は、複数の電柱30のそれぞれの健全性を示す健全性情報を保持しても良い。そして、解析部203は、同一のクラスタに属する健全な1つ以上の電柱30のそれぞれの固有振動数の分布情報に基づき、そのクラスタに属する少なくとも1つの電柱30の劣化状態を解析しても良い。より具体的には、解析部203は、同一のクラスタに属する健全な1つ以上の電柱30のそれぞれの固有振動数の分布情報に基づき、そのクラスタに属する健全な電柱30の標準的な固有振動数である標準固有振動数を算出し、そのクラスタの標準固有振動数と、そのクラスタに属する解析対象の電柱30の固有振動数と、に基づき、解析対象の電柱30の劣化状態を解析しても良い。これにより、電柱30の劣化状態の解析精度のさらなる向上を図ることができる。
続いて、図3を参照して、本実施の形態1に係る電柱劣化検出システムの全体動作の流れの例について説明する。
図3に示されるように、受信部201は、センシング用光ファイバ10から、センシング用光ファイバ10が検知した振動情報を含む戻り光を受信する(ステップS101)。
図3に示されるように、受信部201は、センシング用光ファイバ10から、センシング用光ファイバ10が検知した振動情報を含む戻り光を受信する(ステップS101)。
続いて、特定部202は、受信部201が受信した戻り光に含まれる振動情報に基づき、複数の電柱30のそれぞれの固有振動数を特定する(ステップS102)。
その後、解析部203は、特定部202が特定した複数の電柱30のそれぞれの固有振動数に基づき、複数の電柱30のうちの少なくとも1つの電柱30の劣化状態を解析する(ステップS103)。
その後、解析部203は、特定部202が特定した複数の電柱30のそれぞれの固有振動数に基づき、複数の電柱30のうちの少なくとも1つの電柱30の劣化状態を解析する(ステップS103)。
上述したように本実施の形態1によれば、受信部201は、センシング用光ファイバ10が検知した振動情報を受信し、特定部202は、振動情報に基づき、複数の電柱30のそれぞれの固有振動数を特定し、解析部203は、複数の電柱30のそれぞれの固有振動数に基づき、複数の電柱30のうちの少なくとも1つの電柱30の劣化状態を解析する。そのため、電柱30の劣化状態を高精度に検出することができる。
また、本実施の形態1によれば、センシング用光ファイバ10を用いて、一斉かつリモートで複数の電柱30の劣化状態を解析することができるため、電柱30の劣化状態の把握が容易となると共に、電柱30の劣化状態の把握のためのコストも低減することができる。
また、本実施の形態1によれば、センシング用光ファイバ10として、既存の通信用光ファイバを用いることができる。その場合、電柱30の劣化状態を検出するには、既存の通信用光ファイバがあれば良く、特許文献1のように、電柱の上下方向に直線状又は螺旋状に光ファイバを敷設したり、特許文献2のように、営巣検出用心線を敷設したりする必要はない。したがって、電柱30の劣化状態を検出するための専用構造を必要としないため、電柱劣化検出システムを安価に構築することができる。
また、本実施の形態1によれば、センシング用光ファイバ10をセンサとして用いる光ファイバセンシング技術を利用する。そのため、電磁ノイズの影響を受けない、センサへの給電が不要になる、環境耐性に優れる、メンテナンスが容易になる等の利点が得られる。
<実施の形態2>
本実施の形態2に係る電柱劣化検出システムは、上述した実施の形態1に係る電柱劣化検出システムをより具体化したものである。具体的には、本実施の形態2に係る電柱劣化検出システムは、上述した実施の形態1の電柱劣化検出装置20を、電柱劣化検出装置20Aに置き換えたものであり、外観的なシステム構成は、上述した実施の形態1と同様である。
本実施の形態2に係る電柱劣化検出システムは、上述した実施の形態1に係る電柱劣化検出システムをより具体化したものである。具体的には、本実施の形態2に係る電柱劣化検出システムは、上述した実施の形態1の電柱劣化検出装置20を、電柱劣化検出装置20Aに置き換えたものであり、外観的なシステム構成は、上述した実施の形態1と同様である。
そこで、以下では、図4を参照して、本実施の形態2に係る電柱劣化検出装置20Aの構成例について説明する。なお、図4に示されるセンシング用光ファイバ10は、上述した実施の形態1と同様に、複数の電柱30に敷設されているものとする。
図4に示されるように、本実施の形態2に係る電柱劣化検出装置20Aは、受信部211、収集部212、固有振動数算出部213、寄与率解析部214、電柱DB(Database)215、クラスタリング部216、標準固有振動数算出部217、標準固有振動数DB218、及び、劣化度算出部219を備えている。
ここで、受信部211が、図1の受信部201に対応する。また、収集部212及び固有振動数算出部213の組み合わせが、図1の特定部202に対応する。また、寄与率解析部214、電柱DB215、クラスタリング部216、標準固有振動数算出部217、標準固有振動数DB218、及び、劣化度算出部219の組み合わせが、図1の解析部203に対応する。
受信部211は、センシング用光ファイバ10にパルス光を入射し、パルス光がセンシング用光ファイバ10を伝送されることに伴い発生した反射光や散乱光を、センシング用光ファイバ10を経由して、戻り光として受信する。受信部211が受信した戻り光は、複数の電柱30のそれぞれで発生した戻り光を含んでいる。また、それぞれの戻り光は、対応する電柱30で発生した振動を示す振動情報を含んでいる。
電柱DB215は、センシング用光ファイバ10が敷設された複数の電柱30毎に、その電柱30の電柱番号、その電柱30の健全性を示す健全性情報、その電柱30の位置情報(電柱劣化検出装置20Aからの距離を示す位置情報)、及び、その電柱30の特徴(例えば、電柱30が設置されている設置路面の種類、電柱30の材質、密度、太さ、長さ、及び土被り深さ、電柱30が支えている電線の種類、太さ、及び数等)等が登録されたデータベースである。図5に電柱DB215の内容の例を示す。
収集部212は、受信部211が受信した戻り光に含まれる振動情報を収集する。
収集部212は、例えば、受信部211がセンシング用光ファイバ10にパルス光を送信してから戻り光を受信するまでの時間差や、受信部211が受信した戻り光の強度等に基づき、その戻り光がセンシング用光ファイバ10上のどの位置(電柱劣化検出装置20Aからの距離)で発生したかを特定することが可能である。
また、電柱DB215には、上述のように、複数の電柱30毎に、その電柱30の電柱番号及び位置情報が登録されている。
収集部212は、例えば、受信部211がセンシング用光ファイバ10にパルス光を送信してから戻り光を受信するまでの時間差や、受信部211が受信した戻り光の強度等に基づき、その戻り光がセンシング用光ファイバ10上のどの位置(電柱劣化検出装置20Aからの距離)で発生したかを特定することが可能である。
また、電柱DB215には、上述のように、複数の電柱30毎に、その電柱30の電柱番号及び位置情報が登録されている。
そのため、収集部212は、戻り光が発生したセンシング用光ファイバ10上の位置を、電柱DB215と照合することで、その戻り光がどの電柱30で発生したものであるかを特定することが可能である。従って、収集部212は、特定の電柱30の振動情報を収集することが可能である。
なお、収集部212は、電柱DB215を用いることに限定されない。例えば、収集部212は、上述した実施の形態1に係る図2のような対応テーブルを自身が保持し、その対応テーブルを用いて、戻り光がどの電柱30で発生したものであるかを特定しても良い。
固有振動数算出部213は、収集部212が収集した電柱30の振動情報に基づき、その電柱30の固有振動数を算出する。収集部212が収集した電柱30の振動情報は、その電柱30に固有の振動パターンであって、動的に変動する振動パターンを示している。そのため、固有振動数算出部213は、電柱30の振動パターンの動的変化を分析することにより、その電柱30の固有振動数を算出することが可能である。
寄与率解析部214は、電柱DB215に登録されている電柱30の各特徴の中から、固有振動数に対する寄与率が高い特徴Top Kを算出し、算出した特徴Top Kを保持する。特徴Top Kは、1つの特徴のみを含んでも良いし、複数の特徴を含んでも良い。寄与率解析部214において、特徴Top Kを算出する方法としては、例えば、重回帰分析を行って、電柱30の各特徴の、固有振動数に対する寄与率を算出する方法等が考えられる。ただし、特徴Top Kの算出方法は、これには限定されない。
クラスタリング部216は、センシング用光ファイバ10が敷設されている複数の電柱30のうちの健全な1つ以上の電柱30を、クラスタにクラスタリングする。このクラスタリング動作の概念を図6に示す。図6に示されるように、クラスタリング部216は、健全な1つ以上の電柱30を、まず、固有振動数算出部213が算出した固有振動数に基づき、クラスタにクラスタリングし、さらに、寄与率解析部214が算出した特徴Top Kに基づき、クラスタにクラスタリングする。
標準固有振動数算出部217は、クラスタリング部216がクラスタリングしたクラスタ毎に、そのクラスタに属する健全な1つ以上の電柱30のそれぞれの固有振動数の分布情報に基づき、統計的に、そのクラスタに属する健全な電柱30の標準的な固有振動数である標準固有振動数を算出する。標準固有振動数算出部217において、あるクラスタの標準固有振動数を算出する方法としては、例えば、そのクラスタに属する健全な1つ以上の電柱30の固有振動数の平均値、中央値、最頻値等を、標準固有振動数として算出する方法等が考えられる。ただし、標準固有振動数の算出方法は、これには限定されない。
標準固有振動数DB218は、クラスタリング部216がクラスタリングしたクラスタ毎に、そのクラスタに属する電柱30の電柱番号、そのクラスタの標準固有振動数等が登録されたデータベースである。図7に標準固有振動数DB218の内容の例を示す。
クラスタリング部216は、解析対象の電柱30の劣化状態を解析する場合、電柱DB215に登録されている解析対象の電柱30の特徴Top Kに基づき、解析対象の電柱30が属するクラスタを判定する。
劣化度算出部219は、解析対象の電柱30の劣化状態を解析する場合、解析対象の電柱30が属するクラスタの標準固有振動数と、解析対象の電柱30の固有振動数と、に基づき、解析対象の電柱30の劣化度を算出する。例えば、劣化度算出部219は、以下の数式1を用いて、解析対象の電柱30の劣化度を算出する。

また、劣化度算出部219は、クラスタリング部216がクラスタリングしたクラスタ毎に、そのクラスタに属する電柱30の劣化状態の解析に用いる閾値を予め保持しておく。そして、劣化度算出部219は、以下の数式2を用いて、解析対象の電柱30の劣化度を、解析対象の電柱30が属するクラスタの閾値と比較する。劣化度が閾値を超えている場合には、劣化度算出部219は、解析対象の電柱30が劣化していると解析する。

ここで、クラスタ毎の閾値は、そのクラスタに属する電柱30の固有振動数の分布情報に基づき、統計的に設定すれば良い。また、分析者が、劣化度算出部219により劣化していると解析された電柱30の現物を分析して、実際の劣化度を実測し、その実測結果を閾値の設定に反映させても良い。
また、劣化度算出部219は、解析対象の電柱30が劣化していると解析した場合、アラートを報知しても良い。アラートの報知先は、例えば、解析対象の電柱30を監視する監視員が所持する端末や、監視センターに設置された端末等で良い。また、アラートの報知方法は、例えば、報知先の端末のディスプレイやモニタ等にGUI(Graphical User Interface)画面を表示する方法でも良いし、報知先の端末のスピーカからメッセージを音声出力する方法でも良い。
続いて、本実施の形態2に係る電柱劣化検出システムの動作について説明する。
まず、図8を参照して、固有振動数に対する寄与率の高い特徴Top Kを算出する動作の流れの例について説明する。
まず、図8を参照して、固有振動数に対する寄与率の高い特徴Top Kを算出する動作の流れの例について説明する。
図8に示されるように、まず、収集部212は、電柱DB215に登録されている健全性情報に基づき、センシング用光ファイバ10が敷設された複数の電柱30の中から、健全な電柱30を特定する。ここでは、健全な1つ以上の電柱30を特定したとする。そして、収集部212は、受信部211が受信した戻り光のうち、健全な1つ以上の電柱30でそれぞれ発生した戻り光に含まれる振動情報を収集する(ステップS201)。
続いて、固有振動数算出部213は、収集部212が収集した健全な1つ以上の電柱30のそれぞれの振動情報に基づき、健全な1つ以上の電柱30のそれぞれの固有振動数を算出する(ステップS202)。
続いて、寄与率解析部214は、固有振動数算出部213が算出した健全な1つ以上の電柱30のそれぞれの固有振動数と、電柱DB215に登録されている健全な1つ以上の電柱30のそれぞれの各特徴と、に基づき、電柱DB215に登録されている電柱30の各特徴の、固有振動数に対する寄与率を解析する(ステップS203)。
その後、寄与率解析部214は、電柱DB215に登録されている電柱30の各特徴の、固有振動数に対する寄与率の解析結果に基づき、電柱30の各特徴の中から、固有振動数に対する寄与率が高い特徴Top Kを算出し、算出した特徴Top Kを保持する(ステップS204)。特徴Top Kは、1つの特徴のみを含んでも良いし、複数の特徴を含んでも良い。
続いて、図9を参照して、クラスタ毎の標準固有振動数を算出する動作の流れの例について説明する。
図9に示されるように、まず、図8のステップS201,S202と同様のステップS301,S302が行われる。
図9に示されるように、まず、図8のステップS201,S202と同様のステップS301,S302が行われる。
続いて、クラスタリング部216は、健全な1つ以上の電柱30を、まず、固有振動数算出部213が算出した固有振動数に基づき、クラスタにクラスタリングし、さらに、寄与率解析部214が算出した特徴Top Kに基づき、クラスタにクラスタリングする(ステップS303)。このとき、クラスタリング部216は、収集部212が特定した健全な電柱30の全数をクラスタリング対象にする必要はなく、一部のみをクラスタリング対象にしても良い。
続いて、標準固有振動数算出部217は、クラスタリング部216がクラスタリングしたクラスタ毎に、そのクラスタに属する健全な1つ以上の電柱30のそれぞれの固有振動数の分布情報に基づき、そのクラスタに属する健全な電柱30の標準固有振動数を算出する(ステップS304)。
その後、クラスタリング部216は、クラスタリング部216がクラスタリングしたクラスタ毎に、そのクラスタに属する健全な1つ以上の電柱30のそれぞれの電柱番号を標準固有振動数DB218に登録する。また、標準固有振動数算出部217は、クラスタリング部216がクラスタリングしたクラスタ毎に、そのクラスタの標準固有振動数を標準固有振動数DB218に登録する(ステップS305)。
続いて、図10を参照して、解析対象の電柱30の劣化状態を解析する動作の流れの例について説明する。ここでは、センシング用光ファイバ10が敷設されている複数の電柱30のうちの任意数(全数でも良い)の電柱30を、1つずつ順番に解析対象とし、解析対象となった1つの電柱30について、順番に、図10の処理を行うものとして説明する。
図10に示されるように、まず、収集部212は、受信部211が受信した戻り光のうち、解析対象の電柱30で発生した戻り光に含まれる振動情報を収集する(ステップS401)。
続いて、固有振動数算出部213は、収集部212が収集した解析対象の電柱30の振動情報に基づき、解析対象の電柱30の固有振動数を算出する(ステップS402)。
続いて、クラスタリング部216は、電柱DB215に登録されている解析対象の電柱30の特徴Top Kに基づき、解析対象の電柱30が属するクラスタを判定する(ステップS403)。ただし、例えば、図9の動作の中で、解析対象の電柱30のクラスタリングが完了していれば、ステップS403の処理は省略できる。
続いて、クラスタリング部216は、電柱DB215に登録されている解析対象の電柱30の特徴Top Kに基づき、解析対象の電柱30が属するクラスタを判定する(ステップS403)。ただし、例えば、図9の動作の中で、解析対象の電柱30のクラスタリングが完了していれば、ステップS403の処理は省略できる。
続いて、劣化度算出部219は、標準固有振動数DB218に登録されている、解析対象の電柱30が属するクラスタの標準固有振動数と、固有振動数算出部213が算出した解析対象の電柱30の固有振動数と、に基づき、解析対象の電柱30の劣化度を算出する(ステップS404)。
続いて、劣化度算出部219は、解析対象の電柱30の劣化度が、解析対象の電柱30が属するクラスタの閾値を超えているか否かを判定する(ステップS405)。
ステップS405において、解析対象の電柱30の劣化度が閾値を超えている場合(ステップS405のYes)、劣化度算出部219は、解析対象の電柱30が劣化していると解析し、アラートを報知する(ステップS406)。
ステップS405において、解析対象の電柱30の劣化度が閾値を超えている場合(ステップS405のYes)、劣化度算出部219は、解析対象の電柱30が劣化していると解析し、アラートを報知する(ステップS406)。
以上により、解析対象となった電柱30について、図10の処理が終了する。続いて、解析対象とする電柱30を変更し、変更した電柱30について、図10の処理を行う。この動作を、解析対象とする任意数の電柱30のそれぞれについて、繰り返し行う。
なお、任意数の電柱30の劣化状態の解析は、一定期間毎に行っても良いし、監視員や監視センターから要求されたときに行っても良い。また、解析対象とする任意数の電柱30は、予め設定されていても良いし、監視員や監視センターが指定しても良い。
また、解析対象の電柱30は、1つのクラスタに属することが好適であるが、複数のクラスタに属しても良い。解析対象の電柱30が複数のクラスタに属する場合、ステップS403においては、解析対象の電柱30が属するクラスタは、複数のクラスタと判定されることになる。この場合には、以降、複数のクラスタ毎に、ステップS404~S406の処理を行えば良い。
上述したように本実施の形態2によれば、固有振動数算出部213は、健全な電柱30の振動情報に基づき、健全な電柱30の固有振動数を算出し、クラスタリング部216は、健全な電柱30を、クラスタにクラスタリングし、標準固有振動数算出部217は、クラスタ毎に、そのクラスタに属する健全な電柱30の固有振動数の分布情報に基づき、そのクラスタに属する健全な電柱30の標準固有振動数を算出する。そのため、電柱30の振動情報から、標準固有振動数を算出することができる。
また、本実施の形態2によれば、固有振動数算出部213は、解析対象の電柱30の振動情報に基づき、解析対象の電柱30の固有振動数を算出し、クラスタリング部216は、解析対象の電柱30が属するクラスタを判定し、劣化度算出部219は、解析対象の電柱30が属するクラスタの標準固有振動数と、解析対象の電柱30の固有振動数と、に基づき、解析対象の電柱30の劣化度を算出する。そのため、電柱30の劣化状態を高精度に検出することができる。
その他の効果は、上述した実施の形態1と同様である。
その他の効果は、上述した実施の形態1と同様である。
<実施の形態1,2に係る電柱劣化検出装置のハードウェア構成>
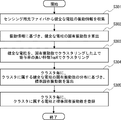
続いて、図11を参照して、上述した実施の形態1,2に係る電柱劣化検出装置20,20Aを実現するコンピュータ40のハードウェア構成について説明する。
続いて、図11を参照して、上述した実施の形態1,2に係る電柱劣化検出装置20,20Aを実現するコンピュータ40のハードウェア構成について説明する。
図11に示されるように、コンピュータ40は、プロセッサ401、メモリ402、ストレージ403、入出力インタフェース(入出力I/F)404、及び通信インタフェース(通信I/F)405等を備える。プロセッサ401、メモリ402、ストレージ403、入出力インタフェース404、及び通信インタフェース405は、相互にデータを送受信するためのデータ伝送路で接続されている。
プロセッサ401は、例えばCPU(Central Processing Unit)やGPU(Graphics Processing Unit)等の演算処理装置である。メモリ402は、例えばRAM(Random Access Memory)やROM(Read Only Memory)等のメモリである。ストレージ403は、例えばHDD(Hard Disk Drive)、SSD(Solid State Drive)、またはメモリカード等の記憶装置である。また、ストレージ403は、RAMやROM等のメモリであっても良い。
ストレージ403は、電柱劣化検出装置20,20Aが備える構成要素の機能を実現するプログラムを記憶している。プロセッサ401は、これら各プログラムを実行することで、電柱劣化検出装置20,20Aが備える構成要素の機能をそれぞれ実現する。ここで、プロセッサ401は、上記各プログラムを実行する際、これらのプログラムをメモリ402上に読み出してから実行しても良いし、メモリ402上に読み出さずに実行しても良い。また、メモリ402やストレージ403は、電柱劣化検出装置20,20Aが備える構成要素が保持する情報やデータを記憶する役割も果たす。
また、上述したプログラムは、様々なタイプの非一時的なコンピュータ可読媒体(non-transitory computer readable medium)を用いて格納され、コンピュータ(コンピュータ40を含む)に供給することができる。非一時的なコンピュータ可読媒体は、様々なタイプの実体のある記録媒体(tangible storage medium)を含む。非一時的なコンピュータ可読媒体の例は、磁気記録媒体(例えば、フレキシブルディスク、磁気テープ、ハードディスクドライブ)、光磁気記録媒体(例えば、光磁気ディスク)、CD-ROM(Compact Disc-ROM)、CD-R(CD-Recordable)、CD-R/W(CD-ReWritable)、半導体メモリ(例えば、マスクROM、PROM(Programmable ROM)、EPROM(Erasable PROM)、フラッシュROM、RAMを含む。また、プログラムは、様々なタイプの一時的なコンピュータ可読媒体(transitory computer readable medium)によってコンピュータに供給されても良い。一時的なコンピュータ可読媒体の例は、電気信号、光信号、及び電磁波を含む。一時的なコンピュータ可読媒体は、電線及び光ファイバ等の有線通信路、又は無線通信路を介して、プログラムをコンピュータに供給できる。
入出力インタフェース404は、表示装置4041、入力装置4042、音出力装置4043等と接続される。表示装置4041は、LCD(Liquid Crystal Display)、CRT(Cathode Ray Tube)ディスプレイ、モニタのような、プロセッサ401により処理された描画データに対応する画面を表示する装置である。入力装置4042は、オペレータの操作入力を受け付ける装置であり、例えば、キーボード、マウス、及びタッチセンサ等である。表示装置4041及び入力装置4042は一体化され、タッチパネルとして実現されていても良い。音出力装置4043は、スピーカのような、プロセッサ401により処理された音響データに対応する音を音響出力する装置である。
通信インタフェース405は、外部の装置との間でデータを送受信する。例えば、通信インタフェース405は、有線通信路または無線通信路を介して外部装置と通信する。
以上、実施の形態を参照して本開示を説明したが、本開示は上述した実施の形態に限定されるものではない。本開示の構成や詳細には、本開示のスコープ内で当業者が理解し得る様々な変更をすることができる。
例えば、上述した実施の形態1,2では、電柱劣化検出装置20,20Aに複数の構成要素が設けられているが、これには限定されない。電柱劣化検出装置20,20Aに設けられていた構成要素は、1つの装置に設けることには限定されず、複数の装置に分散して設けられていても良い。
また、上述した実施の形態1,2では、解析対象が電柱30である場合を例に挙げて説明したが、これには限定されない。解析対象は、橋梁、トンネル、配管、ダム等の構造物であっても良い。これら構造物を解析対象にする場合、これら構造物の複数の箇所にセンシング用光ファイバ10に敷設することで、複数の箇所のそれぞれの劣化状態を解析することが可能となる。
また、上記の実施の形態の一部又は全部は、以下の付記のようにも記載されうるが、以下には限られない。
(付記1)
複数の電柱に敷設されたセンシング用光ファイバと、
前記センシング用光ファイバが検知した振動情報を受信する受信部と、
前記振動情報に基づき、前記複数の電柱のそれぞれの固有振動数を特定する特定部と、
前記複数の電柱のそれぞれの固有振動数に基づき、前記複数の電柱のうち少なくとも1つの電柱の劣化状態を解析する解析部と、
を備える、電柱劣化検出システム。
(付記2)
前記解析部は、
前記複数の電柱のそれぞれの固有振動数の分布を示す分布情報に基づき、前記複数の電柱のうち少なくとも1つの電柱の劣化状態を解析する、
付記1に記載の電柱劣化検出システム。
(付記3)
前記解析部は、
前記複数の電柱のそれぞれの特徴に基づき、前記複数の電柱をクラスタにクラスタリングし、
同一のクラスタに属する1つ以上の電柱のそれぞれの固有振動数の前記分布情報に基づき、当該クラスタに属する少なくとも1つの電柱の劣化状態を解析する、
付記2に記載の電柱劣化検出システム。
(付記4)
前記解析部は、
前記複数の電柱のそれぞれの健全性を示す健全性情報を保持し、
前記健全性情報に基づき、前記複数の電柱の中から健全な電柱を特定し、
同一のクラスタに属する健全な1つ以上の電柱のそれぞれの固有振動数の前記分布情報に基づき、当該クラスタに属する少なくとも1つの電柱の劣化状態を解析する、
付記3に記載の電柱劣化検出システム。
(付記5)
前記解析部は、
同一のクラスタに属する健全な1つ以上の電柱のそれぞれの固有振動数の前記分布情報に基づき、当該クラスタに属する健全な電柱の標準的な固有振動数である標準固有振動数を算出し、
当該クラスタの前記標準固有振動数と、当該クラスタに属する解析対象の電柱の固有振動数と、に基づき、当該解析対象の電柱の劣化状態を解析する、
付記4に記載の電柱劣化検出システム。
(付記6)
前記解析部は、
前記電柱の特徴のうち、前記電柱の固有振動数に対する寄与率が高い特徴を特定し、
前記複数の電柱のそれぞれの前記特定した特徴に基づき、前記複数の電柱をクラスタにクラスタリングする、
付記3から5のいずれか1項に記載の電柱劣化検出システム。
(付記7)
電柱劣化検出システムによる電柱劣化検出方法であって、
複数の電柱に敷設されたセンシング用光ファイバが検知した振動情報を受信する受信ステップと、
前記振動情報に基づき、前記複数の電柱のそれぞれの固有振動数を特定する特定ステップと、
前記複数の電柱のそれぞれの固有振動数に基づき、前記複数の電柱のうち少なくとも1つの電柱の劣化状態を解析する解析ステップと、
を含む、電柱劣化検出方法。
(付記8)
前記解析ステップでは、
前記複数の電柱のそれぞれの固有振動数の分布を示す分布情報に基づき、前記複数の電柱のうち少なくとも1つの電柱の劣化状態を解析する、
付記7に記載の電柱劣化検出方法。
(付記9)
前記解析ステップでは、
前記複数の電柱のそれぞれの特徴に基づき、前記複数の電柱をクラスタにクラスタリングし、
同一のクラスタに属する1つ以上の電柱のそれぞれの固有振動数の前記分布情報に基づき、当該クラスタに属する少なくとも1つの電柱の劣化状態を解析する、
付記8に記載の電柱劣化検出方法。
(付記10)
前記解析ステップでは、
前記複数の電柱のそれぞれの健全性を示す健全性情報を保持し、
前記健全性情報に基づき、前記複数の電柱の中から健全な電柱を特定し、
同一のクラスタに属する健全な1つ以上の電柱のそれぞれの固有振動数の前記分布情報に基づき、当該クラスタに属する少なくとも1つの電柱の劣化状態を解析する、
付記9に記載の電柱劣化検出方法。
(付記11)
前記解析ステップでは、
同一のクラスタに属する健全な1つ以上の電柱のそれぞれの固有振動数の前記分布情報に基づき、当該クラスタに属する健全な電柱の標準的な固有振動数である標準固有振動数を算出し、
当該クラスタの前記標準固有振動数と、当該クラスタに属する解析対象の電柱の固有振動数と、に基づき、当該解析対象の電柱の劣化状態を解析する、
付記10に記載の電柱劣化検出方法。
(付記12)
前記解析ステップでは、
前記電柱の特徴のうち、前記電柱の固有振動数に対する寄与率が高い特徴を特定し、
前記複数の電柱のそれぞれの前記特定した特徴に基づき、前記複数の電柱をクラスタにクラスタリングする、
付記9から11のいずれか1項に記載の電柱劣化検出方法。
(付記13)
複数の電柱に敷設されたセンシング用光ファイバが検知した振動情報を受信する受信部と、
前記振動情報に基づき、前記複数の電柱のそれぞれの固有振動数を特定する特定部と、
前記複数の電柱のそれぞれの固有振動数に基づき、前記複数の電柱のうち少なくとも1つの電柱の劣化状態を解析する解析部と、
を備える、電柱劣化検出装置。
10 センシング用光ファイバ
20,20A 電柱劣化検出装置
201 受信部
202 特定部
203 解析部
211 受信部
212 収集部
213 固有振動数算出部
214 寄与率解析部
215 電柱DB
216 クラスタリング部
217 標準固有振動数算出部
218 標準固有振動数DB
219 劣化度算出部
30 電柱
40 コンピュータ
401 プロセッサ
402 メモリ
403 ストレージ
404 入出力インタフェース
4041 表示装置
4042 入力装置
4043 音出力装置
405 通信インタフェース
20,20A 電柱劣化検出装置
201 受信部
202 特定部
203 解析部
211 受信部
212 収集部
213 固有振動数算出部
214 寄与率解析部
215 電柱DB
216 クラスタリング部
217 標準固有振動数算出部
218 標準固有振動数DB
219 劣化度算出部
30 電柱
40 コンピュータ
401 プロセッサ
402 メモリ
403 ストレージ
404 入出力インタフェース
4041 表示装置
4042 入力装置
4043 音出力装置
405 通信インタフェース
Claims (13)
- 複数の電柱に敷設されたセンシング用光ファイバと、
前記センシング用光ファイバが検知した振動情報を受信する受信部と、
前記振動情報に基づき、前記複数の電柱のそれぞれの固有振動数を特定する特定部と、
前記複数の電柱のそれぞれの固有振動数に基づき、前記複数の電柱のうち少なくとも1つの電柱の劣化状態を解析する解析部と、
を備える、電柱劣化検出システム。 - 前記解析部は、
前記複数の電柱のそれぞれの固有振動数の分布を示す分布情報に基づき、前記複数の電柱のうち少なくとも1つの電柱の劣化状態を解析する、
請求項1に記載の電柱劣化検出システム。 - 前記解析部は、
前記複数の電柱のそれぞれの特徴に基づき、前記複数の電柱をクラスタにクラスタリングし、
同一のクラスタに属する1つ以上の電柱のそれぞれの固有振動数の前記分布情報に基づき、当該クラスタに属する少なくとも1つの電柱の劣化状態を解析する、
請求項2に記載の電柱劣化検出システム。 - 前記解析部は、
前記複数の電柱のそれぞれの健全性を示す健全性情報を保持し、
前記健全性情報に基づき、前記複数の電柱の中から健全な電柱を特定し、
同一のクラスタに属する健全な1つ以上の電柱のそれぞれの固有振動数の前記分布情報に基づき、当該クラスタに属する少なくとも1つの電柱の劣化状態を解析する、
請求項3に記載の電柱劣化検出システム。 - 前記解析部は、
同一のクラスタに属する健全な1つ以上の電柱のそれぞれの固有振動数の前記分布情報に基づき、当該クラスタに属する健全な電柱の標準的な固有振動数である標準固有振動数を算出し、
当該クラスタの前記標準固有振動数と、当該クラスタに属する解析対象の電柱の固有振動数と、に基づき、当該解析対象の電柱の劣化状態を解析する、
請求項4に記載の電柱劣化検出システム。 - 前記解析部は、
前記電柱の特徴のうち、前記電柱の固有振動数に対する寄与率が高い特徴を特定し、
前記複数の電柱のそれぞれの前記特定した特徴に基づき、前記複数の電柱をクラスタにクラスタリングする、
請求項3から5のいずれか1項に記載の電柱劣化検出システム。 - 電柱劣化検出システムによる電柱劣化検出方法であって、
複数の電柱に敷設されたセンシング用光ファイバが検知した振動情報を受信する受信ステップと、
前記振動情報に基づき、前記複数の電柱のそれぞれの固有振動数を特定する特定ステップと、
前記複数の電柱のそれぞれの固有振動数に基づき、前記複数の電柱のうち少なくとも1つの電柱の劣化状態を解析する解析ステップと、
を含む、電柱劣化検出方法。 - 前記解析ステップでは、
前記複数の電柱のそれぞれの固有振動数の分布を示す分布情報に基づき、前記複数の電柱のうち少なくとも1つの電柱の劣化状態を解析する、
請求項7に記載の電柱劣化検出方法。 - 前記解析ステップでは、
前記複数の電柱のそれぞれの特徴に基づき、前記複数の電柱をクラスタにクラスタリングし、
同一のクラスタに属する1つ以上の電柱のそれぞれの固有振動数の前記分布情報に基づき、当該クラスタに属する少なくとも1つの電柱の劣化状態を解析する、
請求項8に記載の電柱劣化検出方法。 - 前記解析ステップでは、
前記複数の電柱のそれぞれの健全性を示す健全性情報を保持し、
前記健全性情報に基づき、前記複数の電柱の中から健全な電柱を特定し、
同一のクラスタに属する健全な1つ以上の電柱のそれぞれの固有振動数の前記分布情報に基づき、当該クラスタに属する少なくとも1つの電柱の劣化状態を解析する、
請求項9に記載の電柱劣化検出方法。 - 前記解析ステップでは、
同一のクラスタに属する健全な1つ以上の電柱のそれぞれの固有振動数の前記分布情報に基づき、当該クラスタに属する健全な電柱の標準的な固有振動数である標準固有振動数を算出し、
当該クラスタの前記標準固有振動数と、当該クラスタに属する解析対象の電柱の固有振動数と、に基づき、当該解析対象の電柱の劣化状態を解析する、
請求項10に記載の電柱劣化検出方法。 - 前記解析ステップでは、
前記電柱の特徴のうち、前記電柱の固有振動数に対する寄与率が高い特徴を特定し、
前記複数の電柱のそれぞれの前記特定した特徴に基づき、前記複数の電柱をクラスタにクラスタリングする、
請求項9から11のいずれか1項に記載の電柱劣化検出方法。 - 複数の電柱に敷設されたセンシング用光ファイバが検知した振動情報を受信する受信部と、
前記振動情報に基づき、前記複数の電柱のそれぞれの固有振動数を特定する特定部と、
前記複数の電柱のそれぞれの固有振動数に基づき、前記複数の電柱のうち少なくとも1つの電柱の劣化状態を解析する解析部と、
を備える、電柱劣化検出装置。
Priority Applications (3)
| Application Number | Priority Date | Filing Date | Title |
|---|---|---|---|
| JP2021572193A JP7327522B2 (ja) | 2020-01-22 | 2020-01-22 | 電柱劣化検出システム、電柱劣化検出方法、及び電柱劣化検出装置 |
| PCT/JP2020/002132 WO2021149192A1 (ja) | 2020-01-22 | 2020-01-22 | 電柱劣化検出システム、電柱劣化検出方法、及び電柱劣化検出装置 |
| US17/790,904 US20230024381A1 (en) | 2020-01-22 | 2020-01-22 | Utility pole degradation detection system, utility pole degradation detection method, and utility pole degradation detection device |
Applications Claiming Priority (1)
| Application Number | Priority Date | Filing Date | Title |
|---|---|---|---|
| PCT/JP2020/002132 WO2021149192A1 (ja) | 2020-01-22 | 2020-01-22 | 電柱劣化検出システム、電柱劣化検出方法、及び電柱劣化検出装置 |
Publications (1)
| Publication Number | Publication Date |
|---|---|
| WO2021149192A1 true WO2021149192A1 (ja) | 2021-07-29 |
Family
ID=76991825
Family Applications (1)
| Application Number | Title | Priority Date | Filing Date |
|---|---|---|---|
| PCT/JP2020/002132 WO2021149192A1 (ja) | 2020-01-22 | 2020-01-22 | 電柱劣化検出システム、電柱劣化検出方法、及び電柱劣化検出装置 |
Country Status (3)
| Country | Link |
|---|---|
| US (1) | US20230024381A1 (ja) |
| JP (1) | JP7327522B2 (ja) |
| WO (1) | WO2021149192A1 (ja) |
Cited By (1)
| Publication number | Priority date | Publication date | Assignee | Title |
|---|---|---|---|---|
| WO2023021598A1 (ja) * | 2021-08-18 | 2023-02-23 | 日本電気株式会社 | 情報処理装置、情報処理方法、コンピュータ可読媒体、及び点検システム |
Citations (7)
| Publication number | Priority date | Publication date | Assignee | Title |
|---|---|---|---|---|
| JP2007183166A (ja) * | 2006-01-06 | 2007-07-19 | Chugoku Electric Power Co Inc:The | 電柱応力評価装置、電柱応力評価システム、電柱応力評価方法及び電柱 |
| JP2008067467A (ja) * | 2006-09-06 | 2008-03-21 | Chugoku Electric Power Co Inc:The | 電柱折損状況監視システム及び該電柱折損状況監視システムで使用される電柱 |
| JP2008107309A (ja) * | 2006-09-29 | 2008-05-08 | Furukawa Electric Co Ltd:The | 衝撃振動検知装置 |
| JP2015053832A (ja) * | 2013-09-09 | 2015-03-19 | 中国電力株式会社 | 営巣検出システム及び営巣検出方法 |
| JP2018096866A (ja) * | 2016-12-14 | 2018-06-21 | 日本電信電話株式会社 | 構造物劣化判定装置とその方法 |
| JP2018124205A (ja) * | 2017-02-02 | 2018-08-09 | 株式会社東芝 | 劣化診断方法、劣化診断システム及びセンサ |
| JP2020010419A (ja) * | 2018-07-03 | 2020-01-16 | 東北電力株式会社 | 電柱劣化度推定方法、電柱劣化度推定装置、電柱、電柱荷重推定方法、及び、電柱荷重推定装置 |
Family Cites Families (1)
| Publication number | Priority date | Publication date | Assignee | Title |
|---|---|---|---|---|
| US9267925B2 (en) * | 2012-09-07 | 2016-02-23 | Polexpert, Llc | Pole integrity meter and method of determining pole integrity |
-
2020
- 2020-01-22 JP JP2021572193A patent/JP7327522B2/ja active Active
- 2020-01-22 WO PCT/JP2020/002132 patent/WO2021149192A1/ja active Application Filing
- 2020-01-22 US US17/790,904 patent/US20230024381A1/en active Pending
Patent Citations (7)
| Publication number | Priority date | Publication date | Assignee | Title |
|---|---|---|---|---|
| JP2007183166A (ja) * | 2006-01-06 | 2007-07-19 | Chugoku Electric Power Co Inc:The | 電柱応力評価装置、電柱応力評価システム、電柱応力評価方法及び電柱 |
| JP2008067467A (ja) * | 2006-09-06 | 2008-03-21 | Chugoku Electric Power Co Inc:The | 電柱折損状況監視システム及び該電柱折損状況監視システムで使用される電柱 |
| JP2008107309A (ja) * | 2006-09-29 | 2008-05-08 | Furukawa Electric Co Ltd:The | 衝撃振動検知装置 |
| JP2015053832A (ja) * | 2013-09-09 | 2015-03-19 | 中国電力株式会社 | 営巣検出システム及び営巣検出方法 |
| JP2018096866A (ja) * | 2016-12-14 | 2018-06-21 | 日本電信電話株式会社 | 構造物劣化判定装置とその方法 |
| JP2018124205A (ja) * | 2017-02-02 | 2018-08-09 | 株式会社東芝 | 劣化診断方法、劣化診断システム及びセンサ |
| JP2020010419A (ja) * | 2018-07-03 | 2020-01-16 | 東北電力株式会社 | 電柱劣化度推定方法、電柱劣化度推定装置、電柱、電柱荷重推定方法、及び、電柱荷重推定装置 |
Cited By (1)
| Publication number | Priority date | Publication date | Assignee | Title |
|---|---|---|---|---|
| WO2023021598A1 (ja) * | 2021-08-18 | 2023-02-23 | 日本電気株式会社 | 情報処理装置、情報処理方法、コンピュータ可読媒体、及び点検システム |
Also Published As
| Publication number | Publication date |
|---|---|
| JP7327522B2 (ja) | 2023-08-16 |
| US20230024381A1 (en) | 2023-01-26 |
| JPWO2021149192A1 (ja) | 2021-07-29 |
Similar Documents
| Publication | Publication Date | Title |
|---|---|---|
| CN112567581B (zh) | 电线杆位置指定系统、装置、方法和计算机可读介质 | |
| JP7124876B2 (ja) | 状態特定システム、状態特定装置、状態特定方法、及びプログラム | |
| US20240271969A1 (en) | Utility pole deterioration detection system, utility pole deterioration detection apparatus, utility pole deterioration detection method, and non-transitory computer readable medium | |
| CN109547910B (zh) | 电子设备声学组件性能测试方法、装置、设备及存储介质 | |
| US20220044552A1 (en) | Road monitoring system, road monitoring device, road monitoring method, and non-transitory computer-readable medium | |
| JPWO2017064855A1 (ja) | 構造物異常検知システム、構造物異常検知方法及び記録した記録媒体 | |
| US12092514B2 (en) | Optical fiber sensing system, optical fiber sensing device, and method for detecting pipe deterioration | |
| JP7546850B2 (ja) | 打音検査についての情報処理方法及び装置 | |
| JPWO2017064854A1 (ja) | 構造物異常検知装置、構造物異常検知方法、記録媒体及び構造物異常検知システム | |
| WO2021149192A1 (ja) | 電柱劣化検出システム、電柱劣化検出方法、及び電柱劣化検出装置 | |
| CN117686021B (zh) | 一种基于数据分析的智能化管道线缆管控系统 | |
| US20230349750A1 (en) | Structure deterioration detection system, structure deterioration detection method, and structure deterioration detection device | |
| JP7174437B2 (ja) | 状態解析プログラム、装置、及びシステム | |
| US20220032981A1 (en) | Railroad monitoring system, railroad monitoring device, railroad monitoring method, and non-transitory computer-readable medium | |
| US20210372828A1 (en) | Civil engineering structure monitoring system, civil engineering structure monitoring apparatus, civil engineering structure monitoring method, and non-transitory computer-readable medium | |
| JP2024059436A (ja) | 評価装置、評価方法、及びプログラム | |
| WO2024004119A1 (ja) | センシングシステム、センシング機器、及びセンシング方法 | |
| CN118584269A (zh) | 碳纤维导线放电监测方法及装置 | |
| JP2024043302A (ja) | 位置評価装置、位置評価方法、及びプログラム | |
| CN116964424A (zh) | 线缆试验系统、分析装置、线缆试验方法以及程序 |
Legal Events
| Date | Code | Title | Description |
|---|---|---|---|
| 121 | Ep: the epo has been informed by wipo that ep was designated in this application |
Ref document number: 20915965 Country of ref document: EP Kind code of ref document: A1 |
|
| ENP | Entry into the national phase |
Ref document number: 2021572193 Country of ref document: JP Kind code of ref document: A |
|
| NENP | Non-entry into the national phase |
Ref country code: DE |
|
| 122 | Ep: pct application non-entry in european phase |
Ref document number: 20915965 Country of ref document: EP Kind code of ref document: A1 |