WO2021145375A1 - Dispositif et procédé de mesure de la lipidémie - Google Patents
Dispositif et procédé de mesure de la lipidémie Download PDFInfo
- Publication number
- WO2021145375A1 WO2021145375A1 PCT/JP2021/001038 JP2021001038W WO2021145375A1 WO 2021145375 A1 WO2021145375 A1 WO 2021145375A1 JP 2021001038 W JP2021001038 W JP 2021001038W WO 2021145375 A1 WO2021145375 A1 WO 2021145375A1
- Authority
- WO
- WIPO (PCT)
- Prior art keywords
- wavelength
- blood vessel
- light
- attenuation coefficient
- blood
- Prior art date
Links
Images


Classifications
-
- A—HUMAN NECESSITIES
- A61—MEDICAL OR VETERINARY SCIENCE; HYGIENE
- A61B—DIAGNOSIS; SURGERY; IDENTIFICATION
- A61B5/00—Measuring for diagnostic purposes; Identification of persons
- A61B5/145—Measuring characteristics of blood in vivo, e.g. gas concentration, pH value; Measuring characteristics of body fluids or tissues, e.g. interstitial fluid, cerebral tissue
- A61B5/1455—Measuring characteristics of blood in vivo, e.g. gas concentration, pH value; Measuring characteristics of body fluids or tissues, e.g. interstitial fluid, cerebral tissue using optical sensors, e.g. spectral photometrical oximeters
-
- G—PHYSICS
- G01—MEASURING; TESTING
- G01N—INVESTIGATING OR ANALYSING MATERIALS BY DETERMINING THEIR CHEMICAL OR PHYSICAL PROPERTIES
- G01N21/00—Investigating or analysing materials by the use of optical means, i.e. using sub-millimetre waves, infrared, visible or ultraviolet light
- G01N21/17—Systems in which incident light is modified in accordance with the properties of the material investigated
- G01N21/47—Scattering, i.e. diffuse reflection
- G01N21/49—Scattering, i.e. diffuse reflection within a body or fluid
Definitions
- the present invention relates to a blood lipid concentration measuring device and a method thereof.
- blood sampling can be eliminated by non-invasive lipid measurement. This makes it possible to measure blood lipids not only at medical institutions but also at home. By enabling immediate data acquisition, it becomes possible to measure blood lipids continuously over time.
- the conventional non-invasive lipid measurement method was based on the premise that the measurement target was a uniform scattering medium.
- the living body includes blood vessels and general tissues, and cannot be said to be a uniform scattering medium, and the measured values may fluctuate depending on the measurement position and individual differences.
- the present invention has been made to solve such a conventional problem, and by providing a blood lipid concentration measuring device and a method capable of stabilizing the measurement of non-invasive blood components. be.
- the blood lipid concentration measuring device of the present invention irradiates an irradiation unit that irradiates a predetermined position of a subject with light having a first wavelength and light having a second wavelength that is absorbed by hemoglobin more than the first wavelength.
- a light intensity detection unit that detects the light intensity at a plurality of positions emitted from the subject at a predetermined interval from the light irradiation position by the unit or at a continuous position, and a light intensity of the second wavelength.
- the blood vessel depth and blood vessel thickness are calculated from, the amount of change in the first effective attenuation coefficient is calculated from the light intensity of the first wavelength, and the amount of change in the first effective attenuation coefficient is calculated from the blood vessel depth and blood vessel thickness. It has a control unit for calculating the lipid concentration.
- the blood lipid concentration measuring method of the present invention light of the first wavelength and light of the second wavelength, which is absorbed by hemoglobin more than the first wavelength, are irradiated to a predetermined position of the subject, and the irradiation position of the light is applied.
- the light intensity at multiple positions emitted from the subject is detected at predetermined intervals or at continuous positions, and the blood vessel depth and blood vessel thickness are calculated from the light intensity of the second wavelength.
- the amount of change in the first effective attenuation coefficient is calculated from the light intensity of the first wavelength
- the lipid concentration is calculated from the amount of change in the first effective attenuation coefficient, the blood vessel depth, and the blood vessel thickness.
- the blood lipid concentration measuring device and method of the present invention it is possible to stabilize the measurement of non-invasive blood components.
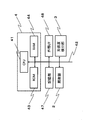
- FIG. 1 is a diagram showing the configuration of the blood lipid concentration measuring device of the embodiment.
- FIG. 2 is a block diagram showing a configuration of a control system of the blood lipid concentration measuring device of the embodiment.
- the blood lipid concentration measuring device 1 of the embodiment includes an irradiation unit 2, a light intensity detection unit 3, and a control unit 4.
- the irradiation unit 2 has a light source 22 for irradiating a predetermined irradiation position 21 with light from outside the living body to the inside of the living body at a predetermined part of the living body.
- the light source 22 can adjust the wavelength of the emitted light by the control unit 4.
- the irradiation intensity of the light source 22 can be adjusted by the control unit 4.
- the length of time for irradiating light such as continuous irradiation of light or pulsed irradiation of light is arbitrary according to the calculation method of the effective attenuation coefficient ⁇ eff by the control unit 4 described later. Can be adjusted to.
- the irradiation unit 2 may use a light source 22 having a fixed wavelength.
- the irradiation unit 2 may be a mixture of a plurality of light sources having different wavelengths or light having a plurality of wavelengths.
- the irradiation unit 2 is, for example, a fluorescent lamp, an LED, a laser, an incandescent lamp, a HID, a halogen lamp, or the like.
- the illuminance of the irradiation unit 2 is controlled by the control unit 4.
- the light source 22 is an LED (Light Emitting Diode).
- the light source 22 of the embodiment irradiates different first wavelength light and second wavelength light.
- the light of the first wavelength is a wavelength at which absorption by hemoglobin is small, and is light for measuring the lipid concentration in blood.
- the light of the second wavelength is a wavelength that is largely absorbed by hemoglobin, and is light for measuring the depth and diameter of veins.
- the first wavelength light is preferably a wavelength that is less absorbed by hemoglobin, and is preferably light in the wavelength range of 800 nm ⁇ 50 nm (that is, 750 nm or more and 850 nm or less).
- the light of the second wavelength is preferably a wavelength at which absorption by hemoglobin is strong, and is preferably light of 500 nm or more and 600 nm or less.
- the light intensity detection unit 3 receives the light emitted from the living body to the outside of the living body and detects the light intensity.
- the light intensity detecting units 3 (31, 32) are installed at different distances from the irradiation position 21.
- the first light intensity detecting unit 31 and the second light intensity detecting unit 32 are arranged in order on the same surface and linearly from the irradiation position 21 at predetermined intervals.
- the light intensity detection unit 3 may be a photodiode, a CCD, or a CMOS.
- the light received by the light intensity detection unit 3 is converted into a photocurrent, and this photocurrent is processed by the CPU 41.
- the distance from the irradiation position 21 to the first detection position 331 by the first light intensity detection unit 31 is set to the first distance ⁇ 1
- the distance from the irradiation position 21 to the second light intensity detection unit 32 is set.
- the first distance ⁇ 1 between the first detection position 331 by the first light intensity detection unit 31 and the irradiation position 21 of the irradiation unit 2 is preferably 3 to 8 mm.
- the second distance ⁇ 2 between the second detection position 332 by the second light intensity detection unit 32 and the irradiation position 21 of the irradiation unit 2 is preferably 10 to 15 mm.
- the entry / exit distance is as long as 10 to 15 mm, measurement results can be obtained in which the surrounding tissue outside the vein is dominant.
- a predetermined distance ⁇ is provided between the irradiation position 21 for irradiating the living body with light and the detection position 33 for detecting the light intensity emitted from the blood (E in the figure) in the living body. ..
- the effect of the irradiated light (A in the figure) reflected by the scattering body on the surface of the living body and the scattering body near the surface and directly emitted from the living body (B in the figure) is suppressed. do.
- the irradiated light After the irradiated light reaches the depth at which blood exists, the light is reflected by the lipid in the blood (D in the figure).
- the arrangement when a plurality of detection positions 331, 332, etc. are provided is not limited to a linear shape as long as they are arranged at different distances from the irradiation position 21, but may be circular, wavy, zigzag, or the like. It can be selected as appropriate. Further, the intervals between the first distance ⁇ 1 and the second distance ⁇ 2 from the irradiation position 21 to the detection positions 331, 332, etc., and the detection positions 331 and 332 are not limited to a fixed interval, and may be continuous. good.
- FIG. 2 is a block diagram of the blood vessel detection device 1 of the embodiment.
- CPU Central Processing Unit
- ROM Read Only Memory
- RAM Random Access Memory
- storage unit 47 external I / F (Interface) 48
- irradiation unit 2 irradiation unit 2
- the light intensity detection unit 3 is connected.
- the control unit (controller) 4 is composed of the CPU 41, the ROM 43, and the RAM 44.
- the ROM 43 stores in advance the programs and thresholds executed by the CPU 41.
- the RAM 44 has various memory areas such as an area for developing a program executed by the CPU 41 and a work area for data processing by the program.
- the RAM 44 has a storage area for storing calibration data (first calibration data) of the vein depth / diameter estimation map shown in FIG. 4, which will be described later.
- the RAM 44 has a storage area for storing calibration data (second calibration data) of the blood lipid concentration calibration curve group shown in FIG. 5, which will be described later.
- the storage unit 47 stores data such as the detected / calculated light intensity and ⁇ eff.
- the storage unit 47 may be an internal memory such as an HDD (Hard Disk Drive), a flash memory, or an SSD (Solid State Drive) that stores non-volatilely.
- the storage unit 47 may store the first calibration data and the second calibration data, which will be described later.
- the external I / F48 is an interface for communicating with an external device such as a client terminal (PC).
- the external I / F48 may be an interface for data communication with an external device, for example, a device (USB memory or the like) locally connected to the external device, or a network for communication via a network. It may be an interface.
- the control unit 4 calculates the blood vessel depth and diameter information (blood vessel thickness) from the light intensity of the second wavelength based on the light intensity detected by the light detection intensity unit 3 (31, 32), and the light of the first wavelength.
- the amount of change in the effective attenuation coefficient is calculated from the intensity
- the blood lipid concentration is calculated from the amount of change in the effective attenuation coefficient, the blood vessel depth, and the diameter information.
- the embodiment is a non-invasive blood lipid concentration measuring device and method based on spatial decomposition measurement of backscattered light, targeting veins.
- An embodiment is a blood lipid concentration measuring device and method in which the depth and diameter of a vein are simultaneously estimated by measuring two wavelengths.
- the diameter of the vein is estimated, but the present invention is not limited to this, and the thickness of the vein such as the radius of the vein may be estimated.
- the blood vessel to be measured is not limited to a vein, and may be, for example, an artery at a shallow position.
- control unit 4 calculates the effective attenuation coefficient ⁇ eff from the light intensity obtained at a wavelength (first wavelength) where the absorption of hemoglobin is small. Next, the control unit 4 corrects the effective attenuation coefficient ⁇ eff with the estimated values of the depth and diameter of the vein obtained by the measurement at the wavelength (second wavelength) where the absorption of hemoglobin is large, and the corrected effective attenuation coefficient ⁇ . Calculate the lipid concentration from eff.
- control unit 4 calculates the effective attenuation coefficient ⁇ eff from the light intensity obtained at a wavelength (first wavelength) in which hemoglobin absorption is small.
- first wavelength a wavelength in which hemoglobin absorption is small.
- S 0 represents the light source intensity
- ⁇ a represents the absorption coefficient
- ⁇ eff represents the effective attenuation coefficient.
- ⁇ eff is a coefficient that depends on the scattering coefficient and the absorption coefficient. Normally, the red blood cell concentration is relatively stable, so the absorption coefficient does not change significantly. In that case, ⁇ eff depends largely only on the scattering coefficient. Therefore, the lipid concentration can be calculated by calculating ⁇ eff from the light intensity with respect to ⁇ . Further, in the embodiment, it may be expressed by turbidity or the like instead of the lipid concentration.
- the distance ⁇ between entry and exit here is the first distance ⁇ 1 described later.
- the effective attenuation coefficient ⁇ eff calculated from the light intensity obtained at the first wavelength is defined as ⁇ eff_1 (first effective attenuation coefficient).
- control unit 4 calculates an estimated value of the depth and diameter of the vein from the effective attenuation coefficient ⁇ eff obtained by the measurement at the wavelength (second wavelength) where the hemoglobin is absorbed greatly.
- Lipid concentration calculation largely depends on the depth and diameter of the vein.
- the absorption in the vein is dominant, so the light entering the vein is almost attenuated, and even if the scattering, that is, the lipid concentration changes, it is measured.
- the change in ⁇ eff that is made is small. Therefore, at the second wavelength, the depth and diameter of the vein can be estimated independently of the lipid concentration.
- the effective attenuation coefficient ⁇ eff when the distance between entry and exit is short is dominated by the characteristics of venous blood, and when the distance is long, the surrounding tissue outside the vein is dominant. Therefore, the control unit 4 calculates ⁇ eff_n (second effective attenuation coefficient) from the light intensity detected by the first light intensity detection unit 31 at a short distance, for example, 3 to 8 mm (first distance ⁇ 1).
- ⁇ eff_f third effective attenuation coefficient
- the first distance ⁇ 1 is not limited to 3 to 8 mm, but the range is narrowed to about 4 to 7 mm, and when a shallow vein is assumed, it is approached to about 2 to 5 mm, and deep veins are targeted. In that case, the distance may be as far as 6 to 9 mm, and a suitable distance is determined according to the measurement at a fixed place of one individual to be measured. The same applies to the second distance ⁇ 2.
- FIG. 4 is a vein depth / diameter estimation map. 4, in the absorption of hemoglobin is large wavelength 600 nm (the second wavelength), ⁇ eff_n / ⁇ eff_f ⁇ eff_n for (second effective attenuation coefficient and the ratio of the third effective attenuation coefficient) (second effective attenuation coefficient) This is the first calibration data created / acquired in advance by changing the depth (blood vessel depth) and the diameter (blood vessel thickness) of the vein.
- FIG. 4 three calibration lines (A, B, C in the figure) are shown.
- the second effective attenuation coefficient ⁇ eff_n is dominated by the effective attenuation coefficient ⁇ eff of venous blood and largely depends on the diameter of the vein. Therefore, in FIG. 4, when the diameter of the vein increases to 1,2,3 mm, the calibration line shifts from A to B and from B to C in the vertical axis direction.
- the ratio ⁇ eff_n / ⁇ eff_f between the second effective attenuation coefficient and the third effective attenuation coefficient is the ratio of venous blood to the surrounding medium and largely depends on the depth of the vein. If the vein is deep, it will be buried in the surrounding medium and the ratio will be small, and if it is shallow, the opposite will be true. This is a premise that the ⁇ eff of venous blood is large with respect to the surrounding medium, and it holds without any problem at the second wavelength. Thus, veins if ⁇ eff_n / ⁇ eff_f the horizontal axis is small deeply when ⁇ eff_n / ⁇ eff_f the horizontal axis is large becomes veins shallow calibration line in FIG.
- the horizontal axis depends only on the thickness of the vein and the vertical axis depends only on the depth of the vein, it is not necessary to create the map shown in FIG. 4, but in the case of an actual vein.
- the measured effective damping coefficient is affected by the mutual influence of thickness and depth, and it is not preferable to treat them independently.
- the distortion of the map in FIG. 4 represents their mutual influence.
- the estimation map of FIG. 4 can be created in advance by obtaining ⁇ eff_n and ⁇ eff_f by numerical simulation while changing the diameter and depth of veins within the assumed range and plotting them in FIG. In principle, it can be created in advance for an actual human body by measuring the diameter and depth of veins in advance with a phantom model or an ultrasonic diagnostic apparatus, not by simulation but experimentally.
- the control unit 4 calibrates the diameter and depth of the vein prepared in advance by changing the blood vessel depth and the blood vessel thickness with respect to the second effective attenuation coefficient with respect to the ratio of the second effective attenuation coefficient and the third effective attenuation coefficient.
- the first calibration data of the curve is stored, and the depth and diameter of the vein are calculated from ⁇ eff_n / ⁇ eff_f and ⁇ eff_n based on the first calibration data.
- the diameter and depth of veins can be estimated in mm units from the estimation map in FIG. 4, but since the map in FIG. 4 is rough, linear interpolation (nonlinear interpolation is also possible) and diameter and depth to fill the roughness are possible.
- the diameter and depth may be obtained with an accuracy of about 1 to 2 digits after the decimal point in mm units by simulating by finely changing the interpolation value.
- the estimation map (first calibration data) of FIG. 4 is created for each vein diameter and stored in the RAM 44.
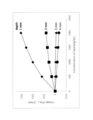
- FIG. 5 shows an example of a calibration curve of lipid concentration at a wavelength of 810 nm (first wavelength).
- the vertical axis of FIG. 5 shows the amount of change in ⁇ eff_1 (first effective attenuation coefficient), and the horizontal axis shows the lipid concentration.
- FIG. 5 is a graph showing the state in which there is no lipid on each of the vertical and horizontal axes as the initial value and the amount of change thereafter. It is also possible to obtain the calibration line as an absolute value. This makes it possible to estimate the venous blood lipid concentration from the calibration curve corresponding to the previously obtained vein depth and diameter.
- FIG. 5 is a group of blood lipid concentration calibration curves.
- FIG. 5 is the second calibration data prepared and acquired in advance for the lipid concentration with respect to the amount of change in the first effective attenuation coefficient by changing the blood vessel depth and the blood vessel thickness. The method of deriving the calibration line of FIG. 5 will be described.
- a calibration graph as shown in FIG. 5 obtained by changing the blood scattering coefficient corresponding to the lipid concentration on the horizontal axis for ⁇ eff_1 (first effective attenuation coefficient) of the first wavelength in which the absorption of hemoglobin at the first distance is small.
- FIG. 5 shows the calibration lines in which the diameter of the vein is fixed at 2 mm and the depth (depth in the figure) is changed.
- a graph of the calibration line group as shown in FIG. 5 is created for each diameter of veins such as 1 mm and 3 mm in diameter (not shown).
- the graph of the calibration line group of FIG. 5 (second calibration data) is created for each vein diameter and stored in the RAM 44.
- the calibration group of FIG. 5 according to the vein diameter previously estimated by the vein depth / diameter estimation map of FIG. 4 is selected.
- the calibration line of the vein depth (depth in the figure) previously estimated by the vein depth / diameter estimation map of FIG. 4, and select the first calibration line at that time. It can be converted to lipid concentration by ⁇ eff_1 (first effective attenuation coefficient) obtained from the measured value of wavelength.
- the control unit 4 stores the second calibration data of the blood lipid concentration prepared in advance by changing the blood vessel depth and the blood vessel thickness for the lipid concentration with respect to the amount of change in the first effective attenuation coefficient, and the second calibration is performed. Based on the data, the lipid concentration is calculated from the depth and diameter of the vein and ⁇ eff_1 (first effective attenuation coefficient) obtained from the measured values of the first wavelength.
- the blood lipid concentration calibration curve group in FIG. 5 is rough, it may be interpolated by linear interpolation or detailed simulation as in the explanation of the calibration map in FIG.
- FIG. 6 is a flowchart of the blood lipid concentration measurement process of the embodiment.
- the irradiation unit irradiates the irradiation position 21 with continuous light (step 101).
- the irradiation unit 2 irradiates light having a first wavelength that is less absorbed by hemoglobin and light having a second wavelength that is more absorbed by hemoglobin.
- the first light intensity detection unit 31 detects the light intensity at the first detection position 331, and the second light intensity detection unit 32 detects the light intensity at the second detection position 332 (step 102).
- the first distance ⁇ 1 between the irradiation position 21 and the first detection position 331 is the distance at which the characteristics of venous blood dominate
- the second distance ⁇ 2 between the irradiation position 21 and the second detection position 332 is the first. It is a distance longer than 1 distance ⁇ 1 and a measurement result can be obtained in which the surrounding tissue outside the vein is dominant.
- the control unit 4 calculates ⁇ eff_1 from the intensity of the first wavelength (for example, 810 nm) at the first distance (for example, 3 to 8 mm).
- the control unit 4 calculates ⁇ eff_n from the intensity of the second wavelength (for example, 600 nm) at the first distance ⁇ 1 (for example, 3 to 8 mm).
- the control unit 4 calculates ⁇ eff_f from the intensity of the second wavelength (for example, 600 nm) at the second distance ⁇ 2 (for example, 10 to 15 mm) (step 103).
- the calculation method of ⁇ eff is described above.
- the control unit 4 has the vein depth and diameter from ⁇ eff_n / ⁇ eff_f and ⁇ eff_n at the second wavelength calculated based on the vein depth / diameter calibration data created and stored in advance as shown in FIG. Is estimated (step 104).
- the control unit 4 uses the calculated vein depth and diameter and the amount of change in ⁇ eff_1 at the first wavelength based on the blood lipid concentration calibration data prepared and stored in advance as shown in FIG. Calculate the concentration (step 105).
- the blood lipid concentration measuring device and its method of the present embodiment it is possible to stably measure the blood lipid concentration.
Landscapes
- Physics & Mathematics (AREA)
- Health & Medical Sciences (AREA)
- Life Sciences & Earth Sciences (AREA)
- Pathology (AREA)
- General Health & Medical Sciences (AREA)
- Medical Informatics (AREA)
- Spectroscopy & Molecular Physics (AREA)
- Engineering & Computer Science (AREA)
- Biomedical Technology (AREA)
- Heart & Thoracic Surgery (AREA)
- Optics & Photonics (AREA)
- Molecular Biology (AREA)
- Surgery (AREA)
- Animal Behavior & Ethology (AREA)
- Biophysics (AREA)
- Public Health (AREA)
- Veterinary Medicine (AREA)
- Chemical & Material Sciences (AREA)
- Analytical Chemistry (AREA)
- Biochemistry (AREA)
- General Physics & Mathematics (AREA)
- Immunology (AREA)
- Measurement Of The Respiration, Hearing Ability, Form, And Blood Characteristics Of Living Organisms (AREA)
Abstract
Le problème décrit par la présente invention est de fournir un dispositif et un procédé par lesquels la lipidémie peut être mesurée de manière stable. La solution selon l'invention porte sur un dispositif de mesure de la lipidémie qui comprend : une unité d'irradiation qui irradie une position spécifique d'une cible avec de la lumière d'une première longueur d'onde et avec de la lumière d'une seconde longueur d'onde, ladite seconde longueur d'onde conduisant à une absorption supérieure par l'hémoglobine que la première longueur d'onde ; une unité de détection d'intensité de lumière qui est placée soit au niveau d'une position à l'écart d'une distance prédéfinie depuis la position d'irradiation de lumière de l'unité d'irradiation soit à une position continue et qui détecte l'intensité de la lumière émise depuis la cible à de multiples positions ; et une unité de commande qui calcule la profondeur du vaisseau sanguin et la taille du vaisseau sanguin sur la base de l'intensité de la lumière de la seconde longueur d'onde, calcule la variation d'un premier coefficient d'atténuation efficace sur la base de l'intensité de la lumière de la première longueur d'onde, et ensuite calcule la lipidémie sur la base de la variation dans le premier coefficient d'atténuation efficace, la profondeur du vaisseau sanguin et la taille du vaisseau sanguin.
Priority Applications (1)
| Application Number | Priority Date | Filing Date | Title |
|---|---|---|---|
| JP2021571228A JPWO2021145375A1 (fr) | 2020-01-17 | 2021-01-14 |
Applications Claiming Priority (2)
| Application Number | Priority Date | Filing Date | Title |
|---|---|---|---|
| JP2020-005791 | 2020-01-17 | ||
| JP2020005791 | 2020-01-17 |
Publications (1)
| Publication Number | Publication Date |
|---|---|
| WO2021145375A1 true WO2021145375A1 (fr) | 2021-07-22 |
Family
ID=76864401
Family Applications (1)
| Application Number | Title | Priority Date | Filing Date |
|---|---|---|---|
| PCT/JP2021/001038 WO2021145375A1 (fr) | 2020-01-17 | 2021-01-14 | Dispositif et procédé de mesure de la lipidémie |
Country Status (2)
| Country | Link |
|---|---|
| JP (1) | JPWO2021145375A1 (fr) |
| WO (1) | WO2021145375A1 (fr) |
Citations (7)
| Publication number | Priority date | Publication date | Assignee | Title |
|---|---|---|---|---|
| JP2002107291A (ja) * | 2000-10-03 | 2002-04-10 | Sysmex Corp | 非侵襲生体計測装置とその方法 |
| JP2014124454A (ja) * | 2012-12-27 | 2014-07-07 | Seiko Epson Corp | 血液成分測定方法、血液成分測定装置及び医療機器 |
| JP2015521282A (ja) * | 2012-04-30 | 2015-07-27 | メイヨ フォンデーシヨン フォー メディカル エジュケーション アンド リサーチ | 時間および空間変動測定値のフォーカス位置特定を改善するための分光システムおよび方法 |
| JP2017205264A (ja) * | 2016-05-18 | 2017-11-24 | メディカルフォトニクス株式会社 | 血中脂質濃度計測装置及びその作動方法 |
| WO2019123559A1 (fr) * | 2017-12-20 | 2019-06-27 | メディカルフォトニクス株式会社 | Dispositif de mesure de lipides et procédé associé |
| US20190257759A1 (en) * | 2018-02-21 | 2019-08-22 | Olive Healthcare Inc. | Signal processing device of analyzing bio-signal and bio-signal analyzing apparatus using the same |
| JP2019201760A (ja) * | 2018-05-22 | 2019-11-28 | メディカルフォトニクス株式会社 | 血管検知装置及びその方法 |
-
2021
- 2021-01-14 JP JP2021571228A patent/JPWO2021145375A1/ja active Pending
- 2021-01-14 WO PCT/JP2021/001038 patent/WO2021145375A1/fr active Application Filing
Patent Citations (7)
| Publication number | Priority date | Publication date | Assignee | Title |
|---|---|---|---|---|
| JP2002107291A (ja) * | 2000-10-03 | 2002-04-10 | Sysmex Corp | 非侵襲生体計測装置とその方法 |
| JP2015521282A (ja) * | 2012-04-30 | 2015-07-27 | メイヨ フォンデーシヨン フォー メディカル エジュケーション アンド リサーチ | 時間および空間変動測定値のフォーカス位置特定を改善するための分光システムおよび方法 |
| JP2014124454A (ja) * | 2012-12-27 | 2014-07-07 | Seiko Epson Corp | 血液成分測定方法、血液成分測定装置及び医療機器 |
| JP2017205264A (ja) * | 2016-05-18 | 2017-11-24 | メディカルフォトニクス株式会社 | 血中脂質濃度計測装置及びその作動方法 |
| WO2019123559A1 (fr) * | 2017-12-20 | 2019-06-27 | メディカルフォトニクス株式会社 | Dispositif de mesure de lipides et procédé associé |
| US20190257759A1 (en) * | 2018-02-21 | 2019-08-22 | Olive Healthcare Inc. | Signal processing device of analyzing bio-signal and bio-signal analyzing apparatus using the same |
| JP2019201760A (ja) * | 2018-05-22 | 2019-11-28 | メディカルフォトニクス株式会社 | 血管検知装置及びその方法 |
Also Published As
| Publication number | Publication date |
|---|---|
| JPWO2021145375A1 (fr) | 2021-07-22 |
Similar Documents
| Publication | Publication Date | Title |
|---|---|---|
| JP4156373B2 (ja) | 多層組織の光学的性質の測定のための集成装置 | |
| US5920390A (en) | Fiberoptic interferometer and associated method for analyzing tissue | |
| JP5271700B2 (ja) | 光反射率測定値を補正するためのシステム及び方法 | |
| JP5463545B2 (ja) | 濃度定量装置、濃度定量方法及びプログラム | |
| JP5186044B2 (ja) | 血糖値推定装置 | |
| JP4872536B2 (ja) | 生体成分濃度測定方法 | |
| JP2013052227A (ja) | 被検体情報取得装置、および、被検体情報取得方法 | |
| JP5773578B2 (ja) | 被検体情報取得装置、被検体情報取得装置の制御方法およびプログラム | |
| KR20190038513A (ko) | 주파수 도메인 기반의 다파장 생체신호 분석 장치 및 그 방법 | |
| JP2017518792A (ja) | 対象のヘマトクリット値を非侵襲的に決定するデバイス及び方法 | |
| WO2019225612A1 (fr) | Dispositif de détection de vaisseau sanguin et son procédé | |
| JP6894088B2 (ja) | 散乱体濃度計測装置及びその方法 | |
| WO2021145375A1 (fr) | Dispositif et procédé de mesure de la lipidémie | |
| CN105686800B (zh) | 被检体信息获取装置及其控制方法 | |
| JP2008155011A (ja) | 密度計測装置およびその方法 | |
| CN111631681A (zh) | 一种基于红外傅里叶光谱探测口腔癌的诊断系统 | |
| TWI773713B (zh) | 脂質測量裝置及其方法 | |
| JP6894087B2 (ja) | 脂質計測装置及びその方法 | |
| Vogt et al. | Measurement and thermal dependence of biological tissue optical properties | |
| WO2022220209A1 (fr) | Dispositif, programme et procédé de mesure de concentration de lipides | |
| WO2020246455A1 (fr) | Dispositif, procédé et programme de mesure non invasive | |
| WO2021153490A1 (fr) | Dispositif de détection de vaisseau sanguin et son procédé | |
| JP2014102087A (ja) | 光学的測定方法 | |
| KR20210076015A (ko) | 입자농도 계측장치, 입자농도 계측 프로그램 및 입자농도 계측방법 | |
| RU2545814C1 (ru) | Способ определения физико-биологических параметров кожи и концентраций производных гемоглобина в крови |
Legal Events
| Date | Code | Title | Description |
|---|---|---|---|
| 121 | Ep: the epo has been informed by wipo that ep was designated in this application |
Ref document number: 21740925 Country of ref document: EP Kind code of ref document: A1 |
|
| ENP | Entry into the national phase |
Ref document number: 2021571228 Country of ref document: JP Kind code of ref document: A |
|
| NENP | Non-entry into the national phase |
Ref country code: DE |
|
| 122 | Ep: pct application non-entry in european phase |
Ref document number: 21740925 Country of ref document: EP Kind code of ref document: A1 |