WO2020259368A1 - 物品剂量分布检测方法及装置 - Google Patents
物品剂量分布检测方法及装置 Download PDFInfo
- Publication number
- WO2020259368A1 WO2020259368A1 PCT/CN2020/096606 CN2020096606W WO2020259368A1 WO 2020259368 A1 WO2020259368 A1 WO 2020259368A1 CN 2020096606 W CN2020096606 W CN 2020096606W WO 2020259368 A1 WO2020259368 A1 WO 2020259368A1
- Authority
- WO
- WIPO (PCT)
- Prior art keywords
- dose distribution
- data
- article
- mass thickness
- dose
- Prior art date
- Legal status (The legal status is an assumption and is not a legal conclusion. Google has not performed a legal analysis and makes no representation as to the accuracy of the status listed.)
- Ceased
Links
Images




Classifications
-
- A—HUMAN NECESSITIES
- A61—MEDICAL OR VETERINARY SCIENCE; HYGIENE
- A61B—DIAGNOSIS; SURGERY; IDENTIFICATION
- A61B6/00—Apparatus or devices for radiation diagnosis; Apparatus or devices for radiation diagnosis combined with radiation therapy equipment
- A61B6/54—Control of apparatus or devices for radiation diagnosis
- A61B6/542—Control of apparatus or devices for radiation diagnosis involving control of exposure
-
- A—HUMAN NECESSITIES
- A61—MEDICAL OR VETERINARY SCIENCE; HYGIENE
- A61B—DIAGNOSIS; SURGERY; IDENTIFICATION
- A61B6/00—Apparatus or devices for radiation diagnosis; Apparatus or devices for radiation diagnosis combined with radiation therapy equipment
- A61B6/54—Control of apparatus or devices for radiation diagnosis
- A61B6/542—Control of apparatus or devices for radiation diagnosis involving control of exposure
- A61B6/544—Control of apparatus or devices for radiation diagnosis involving control of exposure dependent on patient size
-
- A—HUMAN NECESSITIES
- A61—MEDICAL OR VETERINARY SCIENCE; HYGIENE
- A61B—DIAGNOSIS; SURGERY; IDENTIFICATION
- A61B6/00—Apparatus or devices for radiation diagnosis; Apparatus or devices for radiation diagnosis combined with radiation therapy equipment
- A61B6/02—Arrangements for diagnosis sequentially in different planes; Stereoscopic radiation diagnosis
- A61B6/022—Stereoscopic imaging
-
- A—HUMAN NECESSITIES
- A61—MEDICAL OR VETERINARY SCIENCE; HYGIENE
- A61B—DIAGNOSIS; SURGERY; IDENTIFICATION
- A61B6/00—Apparatus or devices for radiation diagnosis; Apparatus or devices for radiation diagnosis combined with radiation therapy equipment
- A61B6/46—Arrangements for interfacing with the operator or the patient
- A61B6/461—Displaying means of special interest
-
- A—HUMAN NECESSITIES
- A61—MEDICAL OR VETERINARY SCIENCE; HYGIENE
- A61B—DIAGNOSIS; SURGERY; IDENTIFICATION
- A61B6/00—Apparatus or devices for radiation diagnosis; Apparatus or devices for radiation diagnosis combined with radiation therapy equipment
- A61B6/48—Diagnostic techniques
- A61B6/486—Diagnostic techniques involving generating temporal series of image data
- A61B6/487—Diagnostic techniques involving generating temporal series of image data involving fluoroscopy
-
- A—HUMAN NECESSITIES
- A61—MEDICAL OR VETERINARY SCIENCE; HYGIENE
- A61B—DIAGNOSIS; SURGERY; IDENTIFICATION
- A61B6/00—Apparatus or devices for radiation diagnosis; Apparatus or devices for radiation diagnosis combined with radiation therapy equipment
- A61B6/52—Devices using data or image processing specially adapted for radiation diagnosis
- A61B6/5205—Devices using data or image processing specially adapted for radiation diagnosis involving processing of raw data to produce diagnostic data
-
- A—HUMAN NECESSITIES
- A61—MEDICAL OR VETERINARY SCIENCE; HYGIENE
- A61B—DIAGNOSIS; SURGERY; IDENTIFICATION
- A61B6/00—Apparatus or devices for radiation diagnosis; Apparatus or devices for radiation diagnosis combined with radiation therapy equipment
- A61B6/52—Devices using data or image processing specially adapted for radiation diagnosis
- A61B6/5288—Devices using data or image processing specially adapted for radiation diagnosis involving retrospective matching to a physiological signal
Definitions
- the present disclosure relates to the technical field of irradiation processing, and in particular to a method and device for detecting dose distribution of an article.
- Irradiation processing is the use of the physical, chemical and biological effects of radiation on substances to achieve a predetermined target effect. It can be used for food preservation, sterilization of medical and health products, sterilization of packaging materials, sterilization of cosmetics, And material modification. Irradiation processing involves a wide range of fields. It is an important processing link in industries related to the national economy and people's livelihoods such as food processing, medical and pharmaceutical processing, and has become an important component of the national economy.
- the distribution of the dose field inside the cargo is particularly important for the goods with considerable thickness.
- the packaging size and loading method of the goods do not match the penetration ability of the electron beam , It is prone to radiation quality accidents such as impermeability and substandard dose field. Therefore, the actual dose distribution in the cargo is the key to the irradiation processing technology, production plan, and quality control.
- the current commonly used detection method is to inspect the goods by unpacking the dosimeter and embed the dosimeter in the object to be tested for testing, which has low efficiency, high cost and high technical requirements.
- the embodiments of the present disclosure provide an article dose distribution detection method and device, which can visually display the dose distribution data of each point of the object to be tested, and facilitate the reasonable configuration of various parameters in the irradiation process.
- an embodiment of the present disclosure provides a method for detecting the dose distribution of an article, which includes: performing a fluoroscopy scan of the object to be measured to obtain mass data per unit area or unit volume of each point on the object to be measured; according to the mass per unit area or unit volume Data and a preset mapping model to obtain corresponding dose distribution data, where the preset mapping model includes the mapping relationship between the mass per unit area or unit volume of the article and the dose distribution under the energy irradiation of the predetermined magnitude; and The dose distribution data is matched with the fluoroscopic image of the object to be tested, and the radiation image is generated and displayed.
- the radiation image is a plane image
- the method for detecting the dose distribution of the object includes: acquiring mass thickness data of the object to be detected under the irradiation energy corresponding to the X-ray when the object to be detected is scanned by X-ray;
- the mass thickness classification condition corresponding to the object to be detected is used to classify each mass thickness value in the mass thickness data; wherein the mass thickness classification condition is based on the mapping relationship data between the mass thickness value of the object to be detected and the electron beam radiation dose distribution data Determine;
- the electron beam radiation dose distribution data According to each mass thickness value and its classification, the electron beam radiation dose distribution data, generate a radiation image used to display the mass thickness of the object to be detected and the electron beam radiation dose distribution data.
- the method for determining mass thickness classification conditions includes: determining the dose unevenness value corresponding to each mass thickness value according to the mapping relationship data; according to each mass thickness value and its corresponding dose unevenness value The uniformity value is used to establish a mapping relationship curve; multiple critical points are determined in the mapping relationship curve, and the mass thickness values are divided into multiple categories according to the multiple critical points.
- determining multiple critical points in the mapping relationship curve includes: if it is single-sided irradiation, determining multiple critical points in the mapping relationship curve according to a preset maximum value of unevenness Point; if it is double-sided irradiation, according to the preset maximum unevenness and the valley value of the mapping relationship curve, multiple critical points are determined in the mapping relationship curve.
- the radiation used to display the mass thickness of the object to be detected and the electron beam radiation dose distribution data is generated
- the image includes: assigning display patterns corresponding to each quality thickness value according to each quality thickness value and its classification; generating a radiation image of the object to be detected according to the display pattern corresponding to each quality thickness value.
- the radiation used to display the mass thickness of the object to be detected and the electron beam radiation dose distribution data is generated
- the image also includes: obtaining the mass thickness value corresponding to the target pixel or target area in the radiation image; querying the electron beam radiation dose distribution data corresponding to the mass thickness value in the mapping relationship data; displaying the electron beam radiation dose in the target area Distribution data.
- the radiation used to display the mass thickness of the object to be detected and the electron beam radiation dose distribution data is generated
- the image also includes: determining the dose unevenness value corresponding to the target pixel or target area according to the electron beam radiation dose distribution data corresponding to the mass thickness value; according to the dose unevenness value and the preset maximum unevenness value Compare the results to determine the irradiation effect; display the dose unevenness value and the irradiation effect in the target area.
- the radiation image is a stereo image
- the method for detecting the dose distribution of the article includes: constructing a standard dose distribution model, which includes the dose distribution data of the article under a preset amount of energy irradiation and Standard mapping relationship of density values; fluoroscopy scan of the object to be tested to obtain the three-dimensional fluoroscopic image of the object to be tested and the detection density value of each space point of the object to be tested; according to the detection density value and dose distribution standard model of each space point of the object to be tested Obtain the dose distribution data of each spatial point of the object to be tested based on the standard mapping relationship; and match and display the dose distribution data of each spatial point of the object to be tested with the stereoscopic image.
- constructing a standard dose distribution model includes: constructing an initial dose distribution model, which includes a theoretical mapping between dose distribution data and theoretical density values of the article under energy irradiation of a preset size Relationship; Obtain a calibration model; Correct the initial model of dose distribution through the calibration model to obtain a standard model of dose distribution.
- obtaining a calibration model includes: providing a calibration component matching the object to be measured, the calibration component including a plurality of calibration blocks of various sizes; performing a perspective scan on the calibration component to obtain the calibration component Theoretical density value; measuring the quality and size of a plurality of calibration blocks, and calculating a plurality of actual density values corresponding to the plurality of calibration blocks; fitting a plurality of actual density values with theoretical density values to obtain a calibration model.
- fitting a plurality of actual density values to a theoretical density value includes performing polynomial fitting of the plurality of actual density values to the theoretical density value.
- the correction block is a cube correction block
- the side length of the cube correction block is 0.1 mm to 30 mm
- a plurality of cube correction blocks of various sizes can be spliced to form a correction component in a rectangular parallelepiped shape.
- the dose distribution data includes at least any of the following: the ratio data of the maximum dose to the surface dose; the ratio data of the minimum dose to the surface dose; and the dose unevenness data.
- the predetermined amount of energy is 1 MeV to 20 MeV.
- an embodiment of the present disclosure provides an article dose distribution detection device, including: a fluoroscopy unit configured to perform a fluoroscopy scan of an object to be measured to obtain mass data per unit area or unit volume of each point on the object to be measured;
- the data processing unit is configured to obtain corresponding dose distribution data according to the mass data per unit area or unit volume and a preset mapping model, wherein the preset mapping model includes the item's performance under the energy irradiation of a preset amount The mapping relationship between the mass per unit area or unit volume and the dose distribution; and the image processing unit is configured to match the dose distribution data with the fluoroscopic image of the object to be measured to generate and display a radiation image.
- the fluoroscopy unit includes a data acquisition unit configured to acquire an X-ray scan of the object under X-ray radiation energy Mass thickness data
- the data processing unit includes a data classification unit, the data classification unit is configured to classify each mass thickness value in the mass thickness data according to the mass thickness classification condition corresponding to the object to be detected; wherein the mass thickness classification condition is based on the The mapping relationship data between the mass thickness value corresponding to the detected object and the electron beam irradiation dose distribution data is determined
- the image processing unit includes an image generation unit, and the image generation unit is configured to according to each mass thickness value and its classification, the electron beam irradiation dose
- the distribution data generates a radiation image for displaying the mass thickness of the object to be inspected and the distribution data of the electron beam radiation dose.
- the article dose distribution detection device further includes: a model processing device for constructing a standard dose distribution model, the dose distribution standard model including the dose distribution of the article under energy irradiation of a preset size The standard mapping relationship between the data and the density value;
- the perspective unit includes a three-dimensional perspective device, the three-dimensional perspective device is used for perspective scanning of the object to be measured to obtain the three-dimensional image of the object to be measured and the detection density value of each spatial point of the object;
- the processing unit includes a calculation device, which is connected with the model processing device and the stereoscopic perspective device.
- the calculation device obtains the dose distribution of each space point of the test object according to the detection density value of each space point of the test object and the standard mapping relationship of the dose distribution standard model Data;
- the image processing unit includes a display device, the display device is connected with the computing device, the display device matches and displays the dose distribution data of each spatial point of the object to be measured with the stereoscopic image.
- the article dose distribution detection device further includes: a correction component for obtaining a correction model through fluoroscopy scanning of the stereoscopic fluoroscopy device, wherein the model processing device can construct an initial dose distribution model, and The initial model of dose distribution is corrected according to the correction model, and the standard model of dose distribution is obtained.
- the correction component includes a plurality of correction blocks of various sizes, the correction block is a cube correction block, the side length of the cube correction block is 0.1 mm to 30 mm, and the correction block has multiple sizes.
- a cube correction block can be spliced to form a correction component in the shape of a rectangular parallelepiped.
- the dose distribution data of each point of the object to be measured is matched with the perspective image to obtain and display the radiation image, so that the dose distribution data of each point of the object to be measured is more intuitive and accurate.
- the article dose distribution detection method makes the internal dose distribution of the article clear at a glance, and can improve the work efficiency of the irradiation processing site.
- FIG. 1 is a flowchart of a method for detecting a dose distribution of an article according to an embodiment of the present disclosure
- FIG. 2 is a schematic flowchart of a radiation imaging method according to an embodiment of the present disclosure
- FIG. 3 is a schematic flowchart of a method for acquiring mapping relationship data provided by an embodiment of the present disclosure
- FIG. 4 is a schematic flowchart of a method for determining mass thickness classification conditions according to an embodiment of the present disclosure
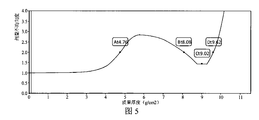
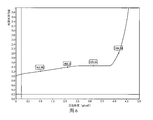
- Fig. 6 is a graph of the mapping relationship of single-sided irradiation in an embodiment of the present disclosure
- FIG. 7 is a schematic flowchart of a method for generating a radiation image of an object to be detected according to an embodiment of the present disclosure
- FIG. 8 is a schematic flowchart of a method for generating a radiation image of an object to be detected according to another embodiment of the present disclosure
- FIG. 9 is a diagram of the positional relationship between a radiation image and a target area according to an embodiment of the present disclosure.
- FIG. 10 is a schematic flowchart of a method for generating a radiation image of an object to be detected according to another embodiment of the present disclosure
- FIG. 11 shows a flowchart of a method for detecting a spatial dose distribution of an article according to an embodiment of the present disclosure
- FIG. 12 is a flowchart of the steps of constructing a dose distribution standard model in a method for detecting spatial dose distribution of an article according to an embodiment of the present disclosure
- FIG. 13 is a flowchart of the steps of obtaining a correction model in the method for detecting the spatial dose distribution of an article according to an embodiment of the present disclosure
- FIG. 14 is a structural block diagram of an article dose distribution detection device provided by an embodiment of the present disclosure.
- 15 is a schematic structural diagram of a radiation imaging device provided by an embodiment of the present disclosure.
- 16 is a structural block diagram of an article space dose distribution detection device provided by an embodiment of the present disclosure.
- 17 to 20 are schematic diagrams of interfaces displayed by the display device in the article space dose distribution detection device provided by an embodiment of the present disclosure.
- the embodiments of the present disclosure provide a method for detecting the dose distribution of an article, which can well guide the formulation of the irradiation processing technology.
- Fig. 1 is a flowchart of a method for detecting a dose distribution of an article according to an embodiment of the present disclosure.
- the method for detecting a dose distribution of an article includes steps S1 to S3.
- step S1 a perspective scan is performed on the object to be measured, and the mass data per unit area or unit volume of each point on the object to be measured is obtained.
- step S2 corresponding dose distribution data is obtained according to the mass data per unit area or unit volume and a preset mapping model.
- the preset mapping model includes the mapping relationship between the mass per unit area or unit volume of the object and the dose distribution under the energy irradiation of the preset size.
- step S3 the dose distribution data is matched with the fluoroscopic image of the object to be measured, and a radiation image is generated and displayed.
- the dose distribution data of each point of the test object is matched with the fluoroscopy image, and the radiation image is obtained and displayed, so that the dose distribution data of each point of the test object is more intuitive and accurate, and is convenient for radiation. According to the reasonable configuration of various parameters in the process.
- the article dose distribution detection method makes the internal dose distribution of the article clear at a glance, and can improve the work efficiency of the irradiation processing site.
- the mass data per unit area or unit volume can be the mass per unit area, that is, the mass thickness, or the mass per unit volume, that is, the (volume) density.
- mass thickness will be used to refer to the mass data per unit area
- density to refer to the mass data per unit volume.
- the perspective image of the object to be measured may be a plane image or a stereo image.
- the dose distribution data can be matched with the planar perspective image to obtain a planar (two-dimensional) radiation image.
- the dose distribution data can be matched with a stereoscopic image to obtain a stereoscopic (three-dimensional) radiation image.
- the radiation image is a planar image
- the method for detecting the dose distribution of the article may be a radiation imaging method based on dose field detection.
- Fig. 2 shows a schematic flow chart of a radiation imaging method provided by an embodiment of the present disclosure. As shown in Figure 2, the radiation imaging method includes:
- S120 Classify each mass thickness value in the mass thickness data according to the mass thickness classification condition corresponding to the object to be detected; wherein the mass thickness classification condition is based on the mass thickness value of the object to be detected and the electron beam radiation dose distribution data The mapping relationship data is determined;
- S130 Generate a radiation image for displaying the mass thickness of the object to be detected and the electron beam radiation dose distribution data according to each mass thickness value and its classification, and the electron beam radiation dose distribution data.
- the embodiments of the present disclosure can obtain the mass thickness data of the object to be inspected, and directly use the mass thickness classification conditions related to the electron beam radiation dose distribution data to classify the mass thickness data of the object to be inspected, and then classify the mass thickness data of the object to be inspected according to the respective mass thickness values and Its classification and electron beam radiation dose distribution data generate radiation images, allowing testers to intuitively determine whether the dose unevenness meets the requirements based on the radiation images, improving test efficiency and reducing test costs.
- the radiation image includes, for example, a mass thickness distribution map of the object to be detected.
- an X-ray device may be used as a scanning device.
- the X-ray device emits X-rays with the same irradiation energy as the electron beam used for irradiation processing to scan the object to be inspected to obtain radiation imaging conversion data.
- the mass thickness data of the object to be detected is calculated.
- the mass thickness data includes the mass thickness value corresponding to each position of the X-ray irradiation surface of the object to be inspected.
- FIG. 3 is a schematic flowchart of a method for acquiring mapping relationship data provided by an embodiment of the present disclosure. As shown in FIG. 3, the method for obtaining the mapping relationship data may include:
- S220 Correct the theoretical data by using the measurement data of the mass thickness value corresponding to the object to be detected and the electron beam radiation dose distribution data to obtain the mapping relationship data.
- the Monte Carlo algorithm can be used to obtain the quality of the object to be detected when the simulated material corresponding to the object to be detected is irradiated with an electron beam having the same irradiation energy as the electron beam for irradiation processing.
- the irradiation energy of the electron beam for irradiation processing can be in the range of 1-20 MeV.
- the electron beam radiation dose distribution data may include data such as the ratio of the maximum dose to the surface dose, the ratio of the minimum dose to the surface dose, and the degree of unevenness of the dose.
- step S220 of the embodiment of the present disclosure when the actual product corresponding to the object to be detected is irradiated with an electron beam having the same irradiation energy as the electron beam for irradiation processing, the mass thickness value and the electron beam radiation value corresponding to the object to be detected are obtained.
- the measurement data of the radiation dose distribution data Then, the theoretical data and the measured data are fitted using Excel or MATLAB data processing software to obtain the fitting formula, and the theoretical data is corrected by the fitting formula.
- the corrected data is the mapping relationship data.
- the fitting formula may be polynomial fitting, such as linear fitting, exponential fitting, power fitting, and logarithmic fitting.
- FIG. 4 is a schematic flowchart of a method for determining mass thickness classification conditions according to an embodiment of the present disclosure. As shown in Figure 4, the methods for determining the quality and thickness classification conditions include:
- S330 Determine multiple critical points in the mapping relationship curve, and divide the mass thickness values into multiple categories according to the multiple critical points.
- step S310 of the embodiment of the present disclosure the ratio of the maximum dose to the surface dose in the electron beam radiation dose distribution data corresponding to each mass thickness value can be divided by the ratio of the minimum dose to the surface dose to obtain each mass thickness.
- the value corresponds to the dose unevenness value.
- the mass thickness value can be used as the abscissa, and the dose unevenness value can be used as the ordinate, and the mapping relationship curve (mass thickness value and its corresponding dose unevenness value can be obtained by fitting Thickness-dose unevenness curve).
- the mapping relationship curve mass thickness value and its corresponding dose unevenness value can be obtained by fitting Thickness-dose unevenness curve.
- it is the mapping relationship curve during double-sided irradiation.
- Figure 6 it is the mapping relationship curve when single-sided irradiation.
- determining multiple critical points in the mapping relationship curve includes:
- mapping relationship curve If it is double-sided irradiation, according to the preset maximum unevenness and the valley value of the mapping relationship curve, multiple critical points are determined in the mapping relationship curve.
- the first case double-sided irradiation
- the specific location of the critical point Ct is: after the mapping relationship curve rises from monotonously to the highest point, it begins to monotonously decline. After falling to the lowest point, there is a small area before and after the lowest point with little change in value. The end of this segment corresponds to The mass thickness can be selected as the critical point Ct. After the critical point Ct, the mapping relationship curve shows a rapid and monotonous rise again. Therefore, the specific method for determining the critical point Ct is: after finding the minimum value of the monotonically decreasing dose unevenness value in the mapping relationship curve, the dose unevenness values of the subsequent adjacent points are subtracted from each other, and when there is a difference When the absolute value is ⁇ 0.01, the mass thickness value corresponding to the dose unevenness value is the critical point Ct.
- the second case (single-side irradiation)
- the mass thickness value corresponding to the preset maximum unevenness can be determined as the critical point Dt respectively, and then the mass thickness value before the critical point Dt can be divided into three equal points.
- the two equal points are the critical points At, Bt, and Ct.
- the mass thickness values can be classified into five types of mass thickness A, B, C, D, and E according to the critical points At, Bt, Ct, and Dt.
- the A-type mass thickness includes the mass thickness value between 0 and the critical point At
- the B-type mass thickness includes the mass thickness value between the critical point At and the critical point Bt
- the C-type mass thickness includes the critical point Bt to the critical point Ct
- the D-type mass thickness includes the mass thickness value between the critical point Ct and the critical point Dt
- the E-type mass thickness includes the mass thickness value greater than the critical point Dt.
- the A-type mass thickness can be used for double-sided irradiation and can reduce the irradiation of a single surface dose.
- the B-type mass thickness can be double-sided irradiated but the dose unevenness is high,
- C Class quality thickness is the better quality thickness range for double-sided irradiation;
- Class D quality thickness is the feasible quality thickness range for double-sided irradiation;
- Class E quality thickness is that the dose unevenness value does not meet the requirements, and the electron beam cannot be irradiated. Detect objects.
- FIG. 7 is a schematic flowchart of a method for generating a radiation image of an object to be detected according to an embodiment of the present disclosure.
- step S130 generate a radiation image for displaying the mass thickness of the object to be inspected and the electron beam irradiation dose distribution data according to each mass thickness value and its classification, and electron beam irradiation dose distribution data, including :
- S132 Generate a radiation image of the object to be detected according to the display pattern corresponding to each mass thickness value.
- the color and color depth corresponding to each quality thickness value may be assigned according to each quality thickness value and its classification. For example, the color of type A quality thickness is green, the color of type B quality thickness is blue, the color of type C quality thickness is yellow, the color of type D quality thickness is red, and the color of type E quality thickness is black.
- the color of type A quality thickness is green
- the color of type B quality thickness is blue
- the color of type C quality thickness is yellow
- the color of type D quality thickness is red
- the color of type E quality thickness is black.
- step S132 of the embodiment of the present disclosure according to the deeper the color and the color depth determined in step S131, the radiation image of the object to be detected is generated.
- FIG. 8 is a schematic flowchart of a method for generating a radiation image of an object to be detected according to another embodiment of the present disclosure.
- step S130 generate a radiation image for displaying the mass thickness of the object to be detected and the electron beam radiation dose distribution data according to each mass thickness value and its classification, and electron beam radiation dose distribution data, and include:
- S135 Display the electron beam radiation dose distribution data in the target area.
- the tester can select the target pixel or target area in the radiation image that wants to view detailed data. After determining the mass thickness value of the target pixel or target area, the tester can query the quality in the mapping relationship data.
- the electron beam radiation dose distribution data such as the ratio of the maximum dose to the surface dose corresponding to the thickness value, the ratio of the minimum dose to the surface dose, and the unevenness of the dose, are then displayed in the target area.
- the relative position of the target area and the radiation image may be as shown in FIG. 9, and the electron beam radiation dose distribution data is displayed in a table form.
- the target area can also be set at the edge of the radiation image and does not block the radiation image.
- the target area may also be set inside the radiation image.
- FIG. 10 is a schematic flowchart of a method for generating a radiation image of an object to be detected according to another embodiment of the present disclosure.
- step S130 generate a radiation image for displaying the mass thickness of the object to be detected and the electron beam radiation dose distribution data according to each mass thickness value and its classification, and the electron beam radiation dose distribution data, and include:
- the specific process of using the radiation imaging method to perform radiation imaging on goods includes:
- the first step prepare the goods, the goods can be containers or bulk goods;
- Step 2 Put the goods into the X-ray equipment for scanning
- the third step use radiation imaging methods to generate radiation images
- the fourth step display the radiation image
- Step 5 Display the electron beam radiation dose distribution data of the target pixel.
- the radiation image is a stereo image
- the article dose distribution detection method may be an article space dose distribution detection method.
- Fig. 11 shows a flow chart of a method for detecting an article spatial dose distribution according to an embodiment of the present disclosure.
- the method for detecting an article spatial dose distribution includes steps S410 to S400.
- a standard dose distribution model is constructed.
- the standard dose distribution model includes a standard mapping relationship between the dose distribution data and the density value of the article under energy irradiation of a preset size.
- the energy of the aforementioned preset magnitude may be 1 MeV to 20 MeV.
- the dose distribution data may include at least any of the following: data on the ratio of the maximum dose to the surface dose; data on the ratio of the minimum dose to the surface dose; and data on the unevenness of the dose. That is, the dose distribution standard model may include at least any of the following: the standard mapping relationship between the ratio data of the maximum dose and the surface dose and the density value; the standard mapping relationship between the ratio data of the minimum dose and the surface dose and the density value; The standard mapping relationship between uniformity data and density value.
- FIG. 12 is a flowchart of the steps of constructing a dose distribution standard model in a method for detecting an article spatial dose distribution of an embodiment of the present disclosure.
- the step of constructing a dose distribution standard model may include the following step S410 Go to step S130.
- step S410 an initial dose distribution model is constructed, and the initial dose distribution model includes the theoretical mapping relationship between the dose distribution data and the theoretical density value of the article under the energy irradiation of a preset size.
- Monte Carlo or simulation software can be used to simulate the correspondence between the theoretical density value of each spatial point and the dose distribution data of each energy section electron beam, and establish the dose distribution data and theory of different positions (spatial points) of the article Model of density value.
- a correction model is obtained.
- the correction model can be a correction factor or a correction formula.
- FIG. 13 is a flowchart of the step of obtaining a correction model in the method for detecting the spatial dose distribution of an article according to an embodiment of the present disclosure, wherein the step of obtaining the correction model may further include steps S4121 to S124.
- a calibration component matching the object to be measured is provided, and the calibration component includes a plurality of calibration blocks of various sizes.
- the correction component can be made of materials commonly used in irradiation processing. For example, in this embodiment, homogeneous organic glass is used to make the correction component.
- the correction block is a cube correction block
- the side length of the cube correction block is 0.1 mm to 30 mm
- multiple cube correction blocks of various sizes can be spliced to form a correction component in the shape of a rectangular parallelepiped.
- step S4122 a perspective scan is performed on the correction component to obtain the theoretical density value of the correction component.
- a dual-energy X-ray tube can be used to scan the correction component and obtain its image and theoretical density value at the same time.
- step S4123 the quality and size of the multiple correction blocks are measured, and multiple actual density values corresponding to the multiple correction blocks are calculated.
- step S4124 multiple actual density values are fitted with theoretical density values to obtain a correction model.
- fitting multiple actual density values to theoretical density values includes polynomial fitting of multiple actual density values to theoretical density values, such as linear fitting, exponential fitting, power fitting, logarithmic fitting, etc., to obtain
- the fitting formula of is the correction model in the form of the correction formula, and the value obtained is the correction model in the form of the correction factor.
- the correction component may be formed by splicing a plurality of cube correction blocks of various sizes, wherein the spliced correction component may be a rectangular parallelepiped with the same length and width.
- a plurality of spatial points corresponding to a plurality of calibration blocks are acquired inside the calibration component, for example, 22 points are acquired.
- X-ray technology is used for perspective scanning to obtain the theoretical density values of the multiple spatial points.
- multiple actual density values corresponding to multiple calibration blocks that is, multiple spatial points, are obtained.
- multiple actual density values are multiple scattered points that coincide with the theoretical density value or are distributed near the theoretical density value.
- multiple actual density values may be differentiated from the theoretical density value to obtain multiple After the difference, multiple differences are fitted to the corresponding scatter points, and polynomial fitting can be used, so that the fitted formula is a correction model in the form of a correction formula.
- the above is only an example of the process of obtaining the correction model.
- the shape and number of the correction blocks in the correction component can be set as needed, and the fitting method is not limited to the above-mentioned difference
- the polynomial fitting of, can also be a quotient, and other ways of fitting.
- step S413 the initial dose distribution model is calibrated through the calibration model to obtain a standard dose distribution model.
- the model correction is a correction model about the density value. Therefore, in the process of correcting the initial dose distribution model to the dose distribution standard model, the theoretical mapping relationship between the dose distribution data and the theoretical density value is corrected to obtain the dose distribution data and density The value correspondence is more in line with the actual standard mapping relationship.
- step S420 a perspective scan of the object to be measured is performed to obtain a stereoscopic image of the object to be measured and a detection density value of each spatial point of the object to be measured.
- the object to be tested receives X-rays of a certain energy for a comprehensive tomographic scan.
- the dual-energy X-ray tube rotates around the object to be tested for scanning and simultaneously obtains a stereoscopic image of the object to be tested.
- the detectors can be arranged in multiple columns along the vertical axis to form a two-dimensional detector array.
- the signals collected by the detectors are processed into data by a computer to obtain a stereoscopic image of the object to be measured and the detection density value of each spatial point of the object to be measured .
- step S430 the dose distribution data of each spatial point of the test object is obtained according to the detection density value of each spatial point of the test object and the standard mapping relationship of the dose distribution standard model. Because the dose distribution standard model is obtained by correcting the constructed initial dose distribution model, the mapping relationship between the dose distribution data and the density value in the dose distribution standard model is more accurate, and the dose distribution data obtained at each spatial point is more accurate.
- step S440 the dose distribution data of each spatial point of the object to be measured is matched with the stereoscopic image and displayed.
- other data such as the density value of each spatial point of the object to be measured and the stereoscopic image are matched and displayed.
- a suitable application interface can be developed to display ultra-high-definition three-dimensional images.
- the internal perspective image of the object can be viewed at any angle and the internal tomographic cross-sectional information of the object can be displayed.
- the results of the detected dose distribution information of the test object can be graphically displayed and data output, wherein the dose distribution information includes the test object and the information of each unit inside.
- the dose distribution data of each spatial point of the object to be measured is matched with the stereoscopic image to obtain the image information and dose distribution data of each spatial point of the object to be measured in a three-dimensional form.
- the dose distribution data of each three-dimensional space point of the object to be tested is more intuitive and accurate, and it is convenient to configure a variety of parameters in the irradiation process.
- the detection method for spatial dose distribution of the article has a shorter test period, is fast and efficient, and the test result has high accuracy.
- the internal situation of the article is clear at a glance, which can greatly improve the work efficiency of the irradiation processing site.
- the embodiment of the present disclosure also provides an article dose distribution detection device, which is used for detecting the dose distribution of the test object.
- FIG. 14 is a structural block diagram of an article dose distribution detection device provided by an embodiment of the present disclosure.
- the article dose distribution detection device includes a perspective unit 10, a data processing unit 20 and an image processing unit 30.
- the fluoroscopy unit 10 is configured to perform a fluoroscopy scan of the object to be measured to obtain the quality data per unit area or unit volume of each point on the object to be measured.
- the data processing unit 20 is configured to obtain corresponding dose distribution data according to the mass data per unit area or unit volume and a preset mapping model.
- the preset mapping model includes the mapping relationship between the mass per unit area or unit volume of the object and the dose distribution under the energy irradiation of the preset size.
- the image processing unit 30 is configured to match the dose distribution data with the fluoroscopic image of the object to be measured, generate and display a radiation image.
- the dose distribution data of each point of the object to be measured is matched with the perspective image to obtain and display the radiation image, so that the dose distribution data of each point of the object to be measured is more intuitive and accurate, and is convenient for radiation. According to the reasonable configuration of various parameters in the process.
- the article dose distribution detection device is used to detect the dose distribution of the article, so that the internal dose distribution of the article is clear at a glance, and the work efficiency of the irradiation processing site can be improved.
- the radiation image is a plane image
- the article dose distribution detection device may be a radiation imaging device based on dose field detection.
- FIG. 15 is a schematic structural diagram of a radiation imaging device provided by an embodiment of the present disclosure. As shown in Figure 15, the radiation imaging device includes:
- the data acquisition unit 410 is configured to acquire mass thickness data of the object to be detected under the irradiation energy corresponding to the X-ray when the object to be detected is scanned by X-ray;
- the data classification unit 420 is configured to classify each mass thickness value in the mass thickness data according to the mass thickness classification condition corresponding to the object to be detected; wherein the mass thickness classification condition is based on the mass thickness value and the electron beam corresponding to the object to be detected Confirm the mapping relationship data of the radiation dose distribution data;
- the image generating unit 430 is configured to generate a radiation image for displaying the mass thickness of the object to be detected and the electron beam irradiation dose distribution data according to each mass thickness value and its classification, and electron beam irradiation dose distribution data.
- the perspective unit of the article dose distribution detection device includes a data acquisition unit, the data processing unit includes a data classification unit, and the image processing unit includes an image generation unit.
- the embodiments of the present disclosure can obtain the mass thickness data of the object to be inspected, and directly use the mass thickness classification conditions related to the electron beam radiation dose distribution data to classify the mass thickness data of the object to be inspected, and then classify the mass thickness data of the object to be inspected according to the respective mass thickness values and Its classification and electron beam radiation dose distribution data generate radiation images, allowing testers to intuitively determine whether the dose unevenness meets the requirements based on the radiation images, improving test efficiency and reducing test costs.
- the radiation imaging device further includes a condition determining unit configured to determine the mass thickness classification condition according to the mapping relationship data between the mass thickness value corresponding to the object to be detected and the electron beam radiation dose distribution data.
- condition determination unit is further configured to obtain the theoretical data of the mass thickness value and the electron beam irradiation dose distribution data corresponding to the object to be detected, and use the mass thickness value and the electron beam irradiation dose corresponding to the object to be detected
- the measurement data of the distributed data amend the theoretical data to obtain the mapping relationship data.
- condition determining unit is further configured to determine the dose unevenness value corresponding to each mass thickness value according to the mapping relationship data, and establish the mapping relationship according to each mass thickness value and its corresponding dose unevenness value Curve, determine multiple critical points in the mapping relationship curve, and divide the mass thickness value into multiple categories according to the multiple critical points.
- the image generating unit 430 is further configured to assign the display patterns corresponding to the respective mass thickness values according to the respective mass thickness values and their classifications, and to generate the object to be detected according to the display patterns corresponding to the respective mass thickness values Radiation image.
- the image generation unit 430 is further configured to obtain the mass thickness value corresponding to the target pixel or the target area in the radiation image, and query the electron beam radiation dose distribution data corresponding to the mass thickness value in the mapping relationship data , To display the electron beam radiation dose distribution data in the target area.
- the image generating unit 430 is further configured to determine the dose unevenness value corresponding to the target pixel or the target area according to the electron beam irradiation dose distribution data corresponding to the mass thickness value, and according to the dose unevenness value
- the comparison result with the preset maximum value of unevenness determines the irradiation effect, and displays the dose unevenness value and the irradiation effect in the target area.
- the radiation image is a stereo image
- the article dose distribution detection device may be an article space dose distribution detection device.
- the article space dose distribution detection device includes a model processing device 110, a stereoscopic perspective device 120, a computing device 130, and a display device 140.
- the model processing device 110 is used to construct a standard dose distribution model, which includes a standard mapping relationship between the dose distribution data and the density value of the article under energy irradiation of a preset size.
- the stereoscopic device 120 is used to perform a perspective scan of the object 200 to obtain a stereoscopic image of the object 200 and the detection density value of each spatial point of the object 200.
- the calculation device 130 is connected with the model processing device 110 and the stereoscopic perspective device 120.
- the calculation device 130 obtains the dose distribution of each space point of the test object 200 according to the detection density value of each space point of the test object 200 and the standard mapping relationship of the dose distribution standard model data.
- the display device 140 is connected to the computing device 130, and the display device 140 matches and displays the dose distribution data of each spatial point of the object 200 and the stereoscopic image.
- the article dose distribution detection device further includes a model processing device
- the perspective unit includes a stereoscopic perspective device
- the data processing unit includes a computing device
- the image processing unit includes a display device.
- the device for detecting the spatial dose distribution of the article further includes a correction component 150 for obtaining a correction model through the perspective scanning of the stereoscopic device 120.
- the model processing device 110 can construct an initial model of the dose distribution, and correct the initial model of the dose distribution according to the correction model to obtain a standard model of the dose distribution.
- the mapping relationship between the dose distribution data and the density value in the dose distribution standard model is more accurate, and the dose distribution data obtained at each spatial point is more accurate.
- the correction component 150 may include multiple correction blocks of various sizes, the correction blocks may be cube correction blocks, the side length of the cube correction blocks is 0.1 mm to 30 mm, and multiple cube correction blocks of various sizes
- the correction component 150 can be spliced to form a rectangular parallelepiped shape.
- the result of the detected dose distribution information of the object to be measured can be graphically displayed and data output.
- a suitable application interface can be developed to display ultra-high-definition three-dimensional images on the display device 140.
- the internal perspective image of the object can be viewed at any angle and the internal tomographic section of the object can be displayed. information.
- Figures 17 to 20 respectively show schematic diagrams of the interface displayed by the display device in the article space dose distribution detection device according to an embodiment of the present disclosure.
- Figures 17 to 20 respectively show the detection of different types of test objects by the article space dose distribution detection device. Schematic diagram of the interface.
- Figures 17 and 18 are schematic diagrams of the interface when the object spatial dose distribution detection device detects pet food
- Figure 19 is the schematic diagram of the interface when the object spatial dose distribution detection device detects food chicken feet
- Figure 20 is the object spatial dose distribution detection device detects fruit carts Schematic diagram of the interface in centizi.
- the interface displayed on the display device 140 includes a plurality of areas, including a first area A1 located on the right side, a second area A2 located on the upper left side, and a third area A3 located on the lower left side.
- the first area A1 is used to display the three-dimensional image of the object under test
- the second area A2 can switch to display the six-view image of the object under test
- the third area A3 is used to display the image of a certain cross-section inside the object under test.
- the straight line in the second area A2 shows the cutting position of the cross-sectional image.
- the internal structure of the object to be measured and the corresponding data of each spatial point can be viewed from a full angle, and a certain internal section can be zoomed in.
- Figures 17 and 18 show different angles of the pet food interface.
- the dose distribution information includes information such as the ratio of the maximum dose to the surface dose of the test object and each unit inside, the ratio of the minimum dose to the surface dose, and the unevenness of the dose.
- the dose distribution data of each spatial point of the object to be measured is matched with the stereoscopic image, and the image information and dose distribution data of each spatial point of the object to be measured are obtained in a three-dimensional form and displayed
- the display on the device 140 makes the dose distribution data of each three-dimensional space point of the test object more intuitive and accurate, and facilitates the reasonable configuration of various parameters in the irradiation process.
- the detection method for spatial dose distribution of the article has a shorter test period, is fast and efficient, and the test result has high accuracy.
- the internal situation of the article is clear at a glance, which can greatly improve the work efficiency of the irradiation processing site.
- the functional blocks shown in the above-mentioned structural block diagram can be implemented as hardware, software, firmware, or a combination thereof.
- it can be, for example, an electronic circuit, an application specific integrated circuit (ASIC), appropriate firmware, a plug-in, a function card, and so on.
- ASIC application specific integrated circuit
- the elements of the present disclosure are programs or code segments used to perform required tasks.
- the program or code segment can be stored in a machine-readable medium, or transmitted over a transmission medium or communication link through a data signal carried in a carrier wave.
- "Machine-readable medium" may include any medium that can store or transmit information.
- machine-readable media examples include electronic circuits, semiconductor memory devices, ROM, flash memory, erasable ROM (EROM), floppy disks, CD-ROMs, optical disks, hard disks, fiber optic media, radio frequency (RF) links, and so on.
- the code segment can be downloaded via a computer network such as the Internet, an intranet, etc.
Landscapes
- Health & Medical Sciences (AREA)
- Life Sciences & Earth Sciences (AREA)
- Engineering & Computer Science (AREA)
- Medical Informatics (AREA)
- Radiology & Medical Imaging (AREA)
- Molecular Biology (AREA)
- Biophysics (AREA)
- Nuclear Medicine, Radiotherapy & Molecular Imaging (AREA)
- Optics & Photonics (AREA)
- Pathology (AREA)
- Physics & Mathematics (AREA)
- Biomedical Technology (AREA)
- Heart & Thoracic Surgery (AREA)
- High Energy & Nuclear Physics (AREA)
- Surgery (AREA)
- Animal Behavior & Ethology (AREA)
- General Health & Medical Sciences (AREA)
- Public Health (AREA)
- Veterinary Medicine (AREA)
- Computer Vision & Pattern Recognition (AREA)
- Human Computer Interaction (AREA)
- Physiology (AREA)
- Analysing Materials By The Use Of Radiation (AREA)
Abstract
一种物品剂量分布检测方法及装置,物品剂量分布检测方法包括:对待测物进行透视扫描,获取待测物上各点的单位面积或单位体积的质量数据(S1);根据单位面积或单位体积的质量数据与预设的映射模型,获得相应的剂量分布数据,其中,预设的映射模型包括物品在预设大小的能量辐照下物品的单位面积或单位体积的质量与剂量分布的映射关系(S2);以及将剂量分布数据与待测物的透视图像匹配,生成辐射图像并显示(S3)。
Description
相关申请的交叉引用
本申请要求2019年6月27日提交的、申请号为201910568018.4、发明名称为“基于剂量场检测的辐射成像方法及装置”的中国专利申请的优先权,以及要求2019年6月27日提交的、申请号为201910566051.3、发明名称为“物品空间剂量分布检测方法及装置”的中国专利申请的优先权,其全部内容通过引用结合在本申请中。
本公开涉及辐照加工技术领域,尤其涉及一种物品剂量分布检测方法及装置。
辐照加工是利用射线对物质所产生的物理效应、化学效应和生物效应,以达到预定的目标效果,可以用于食品保鲜、医疗保健品消毒灭菌、包装材料消毒灭菌、化妆品灭菌、及材料改性等。辐照加工涉及的领域广泛,是食品加工、医疗医药品加工等关系国计民生的产业的重要加工环节,成为国民经济的重要组成。
采用电子束进行辐照加工时,由于电子束穿透力有限,对于有相当厚度的货物而言,货物内部剂量场的分布尤为重要,一旦货物包装尺寸和装载方式与电子束穿透能力不匹配,很容易出现穿不透、剂量场不达标的辐照质量事故。因此货物中实际剂量的分布情况是辐照加工工艺、生产方案、质量控制的关键。
因此,在辐照加工前,需要知道货物的剂量分布数据,目前常用的检测方法是通过货物开箱检查,将剂量计埋入待测物内进行测试,效率低、成本高、技术要求高。
发明内容
本公开实施例提供物品剂量分布检测方法及装置,能够直观显示待测物各点的剂量分布数据,方便辐照工艺中多种参数的合理配置。
一方面,本公开实施例提供一种物品剂量分布检测方法,包括:对待测物进行透视扫描,获取待测物上各点的单位面积或单位体积的质量数据;根据单位面积或单位体积的质量数据与预设的映射模型,获得相应的剂量分布数据,其中,预设的映射模型包括物品在预设大小的能量辐照下物品的单位面积或单位体积的质量与剂量分布的映射关系;以及将剂量分布数据与待测物的透视图像匹配,生成辐射图像并显示。
根据本公开一方面的前述实施方式,辐射图像为平面图像,物品剂量分布检测方法包括:获取采用X射线扫描待检测物体时待检测物体在X射线对应的辐照能量下的质量厚度数据;根据待检测物体对应的质量厚度分类条件,对质量厚度数据中的各个质量厚度值进行分类;其中,质量厚度分类条件根据待检测物体对应的质量厚度值和电子束辐照剂量分布数据的映射关系数据确定;根据各个质量厚度值及其所属分类、电子束辐照剂量分布数据,生成用于显示待检测物体的质量厚度和电子束辐照剂量分布数据的辐射图像。
根据本公开一方面的前述任一实施方式,确定质量厚度分类条件的方法包括:根据映射关系数据,确定各个质量厚度值对应的剂量不均匀度值;根据各个质量厚度值及其对应的剂量不均匀度值,建立映射关系曲线;在映射关系曲线中确定多个临界点,并根据多个临界点将质量厚度值分为多类。
根据本公开一方面的前述任一实施方式,在映射关系曲线中确定多个临界点包括:若为单面辐照,根据预设的不均匀度最大值,在映射关系曲线中确定多个临界点;若为双面辐照,根据预设的不均匀度最大值和映射关系曲线的谷值,在映射关系曲线中确定多个临界点。
根据本公开一方面的前述任一实施方式,根据各个质量厚度值及其所属分类、电子束辐照剂量分布数据,生成用于显示待检测物体的质量厚度 和电子束辐照剂量分布数据的辐射图像,包括:根据各个质量厚度值及其所属分类,分别赋予各个质量厚度值对应的显示图案;根据各个质量厚度值对应的显示图案,生成待检测物体的辐射图像。
根据本公开一方面的前述任一实施方式,根据各个质量厚度值及其所属分类、电子束辐照剂量分布数据,生成用于显示待检测物体的质量厚度和电子束辐照剂量分布数据的辐射图像,还包括:获取辐射图像中的目标像素点或目标区域对应的质量厚度值;在映射关系数据中查询质量厚度值对应的电子束辐照剂量分布数据;在目标区域显示电子束辐照剂量分布数据。
根据本公开一方面的前述任一实施方式,根据各个质量厚度值及其所属分类、电子束辐照剂量分布数据,生成用于显示待检测物体的质量厚度和电子束辐照剂量分布数据的辐射图像,还包括:根据质量厚度值对应的电子束辐照剂量分布数据,确定目标像素点或目标区域对应的剂量不均匀度值;根据剂量不均匀度值与预设的不均匀度最大值的比较结果,确定辐照效果;在目标区域显示剂量不均匀度值和辐照效果。
根据本公开一方面的前述任一实施方式,辐射图像为立体图像,物品剂量分布检测方法包括:构建剂量分布标准模型,剂量分布标准模型包括物品在预设大小的能量辐照下剂量分布数据与密度值的标准映射关系;对待测物进行透视扫描,获得待测物的立体透视图像和待测物各空间点的检测密度值;根据待测物各空间点的检测密度值及剂量分布标准模型的标准映射关系得到待测物各空间点的剂量分布数据;以及将待测物各空间点的剂量分布数据与立体透视图像匹配并显示。
根据本公开一方面的前述任一实施方式,构建剂量分布标准模型包括:构建剂量分布初始模型,剂量分布初始模型包括物品在预设大小的能量辐照下剂量分布数据与理论密度值的理论映射关系;获得校正模型;通过校正模型对剂量分布初始模型校正,得到剂量分布标准模型。
根据本公开一方面的前述任一实施方式,获得校正模型包括:提供与待测物匹配的校正组件,校正组件包括多种尺寸的多个校正块;对校正组件进行透视扫描,获得校正组件的理论密度值;测量多个校正块的质量及 尺寸,计算得到与多个校正块对应的多个实际密度值;将多个实际密度值与理论密度值拟合,得到校正模型。
根据本公开一方面的前述任一实施方式,将多个实际密度值与理论密度值拟合包括将多个实际密度值与理论密度值进行多项式拟合。
根据本公开一方面的前述任一实施方式,校正块为正方体校正块,正方体校正块的边长为0.1毫米至30毫米,多种尺寸的多个正方体校正块能够拼接形成长方体形状的校正组件。
根据本公开一方面的前述任一实施方式,剂量分布数据包括以下中的至少任一:剂量最大值与表面剂量的比值数据;剂量最小值与表面剂量的比值数据;剂量不均匀度数据。
根据本公开一方面的前述任一实施方式,预设大小的能量为1MeV至20MeV的能量。
另一方面,本公开实施例提供一种物品剂量分布检测装置,包括:透视单元,被配置为对待测物进行透视扫描,以获取待测物上各点的单位面积或单位体积的质量数据;数据处理单元,被配置为根据单位面积或单位体积的质量数据与预设的映射模型,获得相应的剂量分布数据,其中,预设的映射模型包括物品在预设大小的能量辐照下物品的单位面积或单位体积的质量与剂量分布的映射关系;以及图像处理单元,被配置将剂量分布数据与待测物的透视图像匹配,生成辐射图像并显示。
根据本公开另一方面的前述任一实施方式,其中:透视单元包括数据获取单元,数据获取单元被配置为获取采用X射线扫描待检测物体时待检测物体在X射线对应的辐照能量下的质量厚度数据;数据处理单元包括数据分类单元,数据分类单元被配置为根据待检测物体对应的质量厚度分类条件,对质量厚度数据中的各个质量厚度值进行分类;其中,质量厚度分类条件根据待检测物体对应的质量厚度值和电子束辐照剂量分布数据的映射关系数据确定;图像处理单元包括图像生成单元,图像生成单元被配置为根据各个质量厚度值及其所属分类、电子束辐照剂量分布数据,生成用于显示待检测物体的质量厚度和电子束辐照剂量分布数据的辐射图像。
根据本公开另一方面的前述任一实施方式,物品剂量分布检测装置还 包括:模型处理装置,用于构建剂量分布标准模型,剂量分布标准模型包括物品在预设大小的能量辐照下剂量分布数据与密度值的标准映射关系;透视单元包括立体透视装置,立体透视装置用于对待测物进行透视扫描,以获得待测物的立体透视图像和待测物各空间点的检测密度值;数据处理单元包括计算装置,计算装置与模型处理装置、立体透视装置连接,计算装置根据待测物各空间点的检测密度值及剂量分布标准模型的标准映射关系得到待测物各空间点的剂量分布数据;图像处理单元包括显示装置,显示装置与计算装置连接,显示装置将待测物各空间点的剂量分布数据与立体透视图像匹配并显示。
根据本公开另一方面的前述任一实施方式,物品剂量分布检测装置还包括:校正组件,用于通过立体透视装置的透视扫描获取校正模型,其中,模型处理装置能够构建剂量分布初始模型,并根据校正模型对剂量分布初始模型校正,得到剂量分布标准模型。
根据本公开另一方面的前述任一实施方式,校正组件包括多种尺寸的多个校正块,校正块为正方体校正块,正方体校正块的边长为0.1毫米至30毫米,多种尺寸的多个正方体校正块能够拼接形成长方体形状的校正组件。
根据本公开实施例的物品剂量分布检测方法及装置,将待测物各点的剂量分布数据与透视图像匹配,得到辐射图像并进行显示,使得待测物各点的剂量分布数据更直观准确,方便辐照工艺中多种参数的合理配置。该物品剂量分布检测方法使得物品内部剂量分布情况一目了然,可以提高辐照加工现场的工作效率。
为了更清楚地说明本公开实施例的技术方案,下面将对本公开实施例中所需要使用的附图作简单的介绍,对于本领域普通技术人员来讲,在不付出创造性劳动的前提下,还可以根据这些附图获得其他的附图。
图1是本公开一种实施例提供的物品剂量分布检测方法的流程图;
图2是本公开一种实施例提供的辐射成像方法的流程示意图;
图3是本公开一种实施例提供的映射关系数据的获取方法的流程示意图;
图4是本公开一种实施例提供的确定质量厚度分类条件的方法的流程示意图;
图5是本公开实施例中双面辐照的映射关系曲线图;
图6是本公开实施例中单面辐照的映射关系曲线图;
图7是本公开一种实施例提供的生成待检测物体的辐射图像的方法的流程示意图;
图8是本公开另一种实施例提供的生成待检测物体的辐射图像的方法的流程示意图;
图9是本公开一种实施例的辐射图像和目标区域的位置关系图;
图10是本公开又一种实施例提供的生成待检测物体的辐射图像的方法的流程示意图;
图11示出根据本公开实施例的物品空间剂量分布检测方法的流程图;
图12是本公开一种实施例的物品空间剂量分布检测方法中构建剂量分布标准模型步骤的流程图;
图13是本公开一种实施例的物品空间剂量分布检测方法中获得校正模型步骤的流程图;
图14是本公开一种实施例提供的物品剂量分布检测装置的结构框图;
图15是本公开一种实施例提供的辐射成像装置的结构示意图;
图16是本公开一种实施例提供的物品空间剂量分布检测装置的结构框图;
图17至图20是本公开一种实施例提供的物品空间剂量分布检测装置中显示装置显示的界面示意图。
下面将详细描述本公开的各个方面的特征和示例性实施例,为了使本公开的目的、技术方案及优点更加清楚明白,以下结合附图及具体实施例,对本公开进行进一步详细描述。应理解,此处所描述的具体实施例仅被配 置为解释本公开,并不被配置为限定本公开。对于本领域技术人员来说,本公开可以在不需要这些具体细节中的一些细节的情况下实施。下面对实施例的描述仅仅是为了通过示出本公开的示例来提供对本公开更好的理解。
需要说明的是,在本文中,诸如第一和第二等之类的关系术语仅仅用来将一个实体或者操作与另一个实体或操作区分开来,而不一定要求或者暗示这些实体或操作之间存在任何这种实际的关系或者顺序。而且,术语“包括”、“包含”或者其任何其他变体意在涵盖非排他性的包含,从而使得包括一系列要素的过程、方法、物品或者设备不仅包括那些要素,而且还包括没有明确列出的其他要素,或者是还包括为这种过程、方法、物品或者设备所固有的要素。在没有更多限制的情况下,由语句“包括……”限定的要素,并不排除在包括所述要素的过程、方法、物品或者设备中还存在另外的相同要素。
本公开实施例提供一种物品剂量分布检测方法,可以很好地指导辐照加工工艺的制定。
图1是本公开一种实施例提供的物品剂量分布检测方法的流程图,该物品剂量分布检测方法包括步骤S1至步骤S3。
在步骤S1中,对待测物进行透视扫描,获取待测物上各点的单位面积或单位体积的质量数据。
在步骤S2中,根据单位面积或单位体积的质量数据与预设的映射模型,获得相应的剂量分布数据。其中,预设的映射模型包括物品在预设大小的能量辐照下物品的单位面积或单位体积的质量与剂量分布的映射关系。
在步骤S3中,将剂量分布数据与待测物的透视图像匹配,生成辐射图像并显示。
根据本公开实施例的物品剂量分布检测方法,将待测物各点的剂量分布数据与透视图像匹配,得到辐射图像并进行显示,使得待测物各点的剂量分布数据更直观准确,方便辐照工艺中多种参数的合理配置。该物品剂量分布检测方法使得物品内部剂量分布情况一目了然,可以提高辐照加工现场的工作效率。
在本公开实施例中,单位面积或单位体积的质量数据,可以是单位面 积的质量,即质量厚度,也可以是单位体积的质量,即(体)密度。为便于区分,下文中,将以“质量厚度”表示单位面积的质量数据,以“密度”表示单位体积的质量数据。
在本公开实施例中,待测物的透视图像可以是平面图像,也可以是立体图像。当获取的待测物上各点的单位面积或单位体积的质量数据为质量厚度时,剂量分布数据可以与平面的透视图像匹配,以得到平面(二维)的辐射图像。当获取的待测物上各点的单位面积或单位体积的质量数据为密度时,剂量分布数据可以与立体的透视图像匹配,以得到立体(三维)的辐射图像。
以下将对辐射图像为平面图像时的情形进行说明,在一些实施例中,辐射图像为平面图像,物品剂量分布检测方法可以是基于剂量场检测的辐射成像方法。
图2示出了本公开一种实施例提供的辐射成像方法的流程示意图。如图2所示,该辐射成像方法包括:
S110:获取采用X射线扫描待检测物体时待检测物体在X射线对应的辐照能量下的质量厚度数据;
S120:根据待检测物体对应的质量厚度分类条件,对质量厚度数据中的各个质量厚度值进行分类;其中,质量厚度分类条件根据待检测物体对应的质量厚度值和电子束辐照剂量分布数据的映射关系数据确定;
S130:根据各个质量厚度值及其所属分类、电子束辐照剂量分布数据,生成用于显示待检测物体的质量厚度和电子束辐照剂量分布数据的辐射图像。
因此,本公开实施例能够获取待检测物体的质量厚度数据,并且直接利用与电子束辐照剂量分布数据相关的质量厚度分类条件对待检测物体的质量厚度数据进行分类,然后根据各个质量厚度值及其所属分类、电子束辐照剂量分布数据生成辐射图像,使得测试人员能够直观地根据辐射图像确定剂量不均匀度是否符合要求,提高测试效率、降低测试成本。在本公开实施例中,辐射图像例如包括待检测物体的质量厚度分布图。
在本公开实施例的步骤S110中,可以采用X射线设备作为扫描装置, X射线设备发射与进行辐照加工的电子束具有相同辐照能量的X射线扫描待检测物体,得到辐射成像转化数据,并根据辐射成像转换数据与质量厚度数据的转化算法,计算到待检测物体的质量厚度数据。其中,质量厚度数据包括待检测物体的X射线照射面的各个位置对应的质量厚度值。
图3是本公开一种实施例提供的映射关系数据的获取方法的流程示意图。如图3所示,映射关系数据的获取方法可以包括:
S210:获取待检测物体对应的质量厚度值和电子束辐照剂量分布数据的理论数据;
S220:利用待检测物体对应的质量厚度值和电子束辐照剂量分布数据的测量数据修正理论数据,获得映射关系数据。
在本公开实施例的步骤S210中,可以采用蒙卡算法,获取利用与进行辐照加工的电子束具有相同辐照能量的电子束照射待检测物体对应的模拟材料时,待检测物体对应的质量厚度值和电子束辐照剂量分布数据的理论数据。其中,进行辐照加工的电子束的辐照能量可以在1~20MeV的范围之间。
在本公开实施例中,电子束辐照剂量分布数据可以包括剂量最大值与表面剂量的比值、剂量最小值与表面剂量的比值、剂量不均匀度等数据。
在本公开实施例的步骤S220中,获取利用与进行辐照加工的电子束具有相同辐照能量的电子束照射待检测物体对应的实际产品时,待检测物体对应的质量厚度值和电子束辐照剂量分布数据的测量数据。然后,将理论数据和测量数据采用Excel或者MATLAB数据处理软件中进行拟合,得出拟合公式,利用拟合公式修正理论数据,修正后的数据即为映射关系数据。具体地,拟合公式可以为多项式拟合,如线性拟合、指数拟合、幂拟合、对数拟合。
图4是本公开一种实施例提供的确定质量厚度分类条件的方法的流程示意图。如图4所示,确定质量厚度分类条件的方法包括:
S310:根据映射关系数据,确定各个质量厚度值对应的剂量不均匀度值;
S320:根据各个质量厚度值及其对应的剂量不均匀度值,建立映射关 系曲线;
S330:在映射关系曲线中确定多个临界点,并根据多个临界点将质量厚度值分为多类。
在本公开实施例的步骤S310中,可以利用各个质量厚度值对应的电子束辐照剂量分布数据中的剂量最大值与表面剂量的比值除以剂量最小值与表面剂量的比值,得到各个质量厚度值对应的剂量不均匀度值。
在本公开实施例的步骤S320中,可以将质量厚度值作为横坐标,剂量不均匀度值作为纵坐标,根据各个质量厚度值及其对应的剂量不均匀度值拟合得到映射关系曲线(质量厚度-剂量不均匀度曲线)。如图5所示,为在双面辐照时的映射关系曲线。如图6所示,为在单面辐照时的映射关系曲线。
在本公开实施例的步骤S330中,在映射关系曲线中确定多个临界点包括:
若为单面辐照,根据预设的不均匀度最大值,在映射关系曲线中确定多个临界点;
若为双面辐照,根据预设的不均匀度最大值和映射关系曲线的谷值,在映射关系曲线中确定多个临界点。
下面,将根据双面辐照和单面辐照两种情况对确定临界点的具体方法进行详细说明。
第一种情况(双面辐照)
在此种情况中,可以首先将预设的不均匀度最大值对应的质量厚度值分别确定为临界点At、Bt、Dt,然后确定临界点Bt和临界点Dt之间的谷值作为临界点Ct。
由于临界点Ct的具体位置为:映射关系曲线由单调上升到最高点后,开始单调下降,下降到最低点后,最低点前后有一小段数值变化不大的区域,该段区域的最末尾对应的质量厚度即可选为临界点Ct。在临界点Ct以后,映射关系曲线又呈现快速单调上升形态。因此,临界点Ct的具体确定方法为:找到映射关系曲线中单调下降的剂量不均匀度值的最小值后,其后的相邻各点的剂量不均匀度值互相作减法,当出现差值绝对值≧0.01时, 该剂量不均匀度值对应的质量厚度值就是临界点Ct。
第二种情况(单面辐照)
在此种情况中,可以首先将预设的不均匀度最大值对应的质量厚度值分别确定为临界点Dt,然后将临界点Dt之前的质量厚度值等分得到三个等分点,这三个等分点即为临界点At、Bt、Ct。
在本公开实施例的步骤S330中,可以根据临界点At、Bt、Ct、Dt将质量厚度值分为A、B、C、D、E五类质量厚度。其中,A类质量厚度包括0至临界点At之间的质量厚度值,B类质量厚度包括临界点At至临界点Bt之间的质量厚度值,C类质量厚度包括临界点Bt至临界点Ct之间的质量厚度值,D类质量厚度包括临界点Ct至临界点Dt之间的质量厚度值,E类质量厚度包括质量厚度值大于临界点Dt的质量厚度值。
当待检测物体接受单面辐照时,仅有E类质量厚度的剂量不均匀度值不符合要求,电子束无法照透待检测物体。当待检测物体接受双面辐照时,A类质量厚度可用于双面辐照且可以减少单次表面剂量的辐照,B类质量厚度可双面照透但剂量不均匀度偏高,C类质量厚度为双面辐照较佳的质量厚度范围;D类质量厚度为双面辐照可行的质量厚度范围,E类质量厚度为剂量不均匀度值不符合要求,电子束无法照透待检测物体。
图7是本公开一种实施例提供的生成待检测物体的辐射图像的方法的流程示意图。如图7所示,步骤S130:根据各个质量厚度值及其所属分类、电子束辐照剂量分布数据,生成用于显示待检测物体的质量厚度和电子束辐照剂量分布数据的辐射图像,包括:
S131:根据各个质量厚度值及其所属分类,分别赋予各个质量厚度值对应的显示图案;
S132:根据各个质量厚度值对应的显示图案,生成待检测物体的辐射图像。
在本公开实施例的步骤S131中,可以根据各个质量厚度值及其所属分类,分别赋予各个质量厚度值对应的颜色和色彩深度。例如,A类质量厚度的颜色为绿色,B类质量厚度的颜色为蓝色,C类质量厚度的颜色为黄色,D类质量厚度的颜色为红色,E类质量厚度的颜色为黑色。同时,在 每一类质量厚度中,数值越大的质量厚度值对应的色彩深度越深,数值越小的质量厚度值对应的色彩深度越浅。
在本公开实施例的步骤S132中,根据步骤S131中确定的颜色和色彩深度越深,生成待检测物体的辐射图像。
图8是本公开另一种实施例提供的生成待检测物体的辐射图像的方法的流程示意图。如图8所示,步骤S130:根据各个质量厚度值及其所属分类、电子束辐照剂量分布数据,生成用于显示待检测物体的质量厚度和电子束辐照剂量分布数据的辐射图像,还包括:
S133:获取辐射图像中的目标像素点或目标区域对应的质量厚度值;
S134:在映射关系数据中查询质量厚度值对应的电子束辐照剂量分布数据;
S135:在目标区域显示电子束辐照剂量分布数据。
在本公开实施例中,测试人员可以选择辐射图像中想要查看详细数据的目标像素点或目标区域,在确定了目标像素点或目标区域的质量厚度值后,可以在映射关系数据中查询质量厚度值对应的剂量最大值与表面剂量的比值、剂量最小值与表面剂量的比值、剂量不均匀度等电子束辐照剂量分布数据,然后在目标区域中显示。
在本公开实施例中,目标区域和辐射图像的相对位置可以如图9所示,且电子束辐照剂量分布数据以表格形式展示。在另一种实施例中,目标区域还可以设置于辐射图像的边缘,并且不遮挡辐射图像。在本公开其它实施例中,目标区域还可以设置于辐射图像内部。
图10是本公开又一种实施例提供的生成待检测物体的辐射图像的方法的流程示意图。如图10所示,步骤S130:根据各个质量厚度值及其所属分类、电子束辐照剂量分布数据,生成用于显示待检测物体的质量厚度和电子束辐照剂量分布数据的辐射图像,还包括:
S136:根据质量厚度值对应的电子束辐照剂量分布数据,确定目标像素点或目标区域对应的剂量不均匀度值;
S137:根据剂量不均匀度值与预设的不均匀度最大值的比较结果,确定辐照效果;
S138:在目标区域显示剂量不均匀度值和所述辐照效果。
在本公开实施例中,利用辐射成像方法对货物进行辐射成像的具体流程包括:
第一步:准备好货物,货物可以是货箱或散装物品;
第二步:将货物放入X射线设备内进行扫描;
第三步:利用辐射成像方法生成辐射图像;
第四步:显示辐射图像;
第五步:显示目标像素点的电子束辐照剂量分布数据。
以下将对辐射图像为立体图像时的情形进行说明,在一些实施例中,辐射图像为立体图像,物品剂量分布检测方法可以是物品空间剂量分布检测方法。
图11示出根据本公开实施例的物品空间剂量分布检测方法的流程图,该物品空间剂量分布检测方法包括步骤S410至步骤S400。
在步骤S410中,构建剂量分布标准模型,剂量分布标准模型包括物品在预设大小的能量辐照下剂量分布数据与密度值的标准映射关系。
其中,上述预设大小的能量可以为1MeV至20MeV的能量。剂量分布数据可以包括以下中的至少任一:剂量最大值与表面剂量的比值数据;剂量最小值与表面剂量的比值数据;剂量不均匀度数据。即剂量分布标准模型可以包括以下中的至少任一:剂量最大值与表面剂量的比值数据与密度值的标准映射关系;剂量最小值与表面剂量的比值数据与密度值的标准映射关系;剂量不均匀度数据与密度值的标准映射关系。
图12是本公开一种实施例的物品空间剂量分布检测方法中构建剂量分布标准模型步骤的流程图,在本实施例的步骤S410中,构建剂量分布标准模型的步骤又可以包括以下的步骤S410至步骤S130。
其中,在步骤S410中,构建剂量分布初始模型,剂量分布初始模型包括物品在预设大小的能量辐照下剂量分布数据与理论密度值的理论映射关系。
在一些实施例中,可以采用蒙卡或模拟软件,模拟各能量区段电子束对各空间点的理论密度值与剂量分布数据的对应关系,建立物品不同位置 (空间点)剂量分布数据与理论密度值的模型。
在步骤S412中,获得校正模型。校正模型可以是校正因子或校正公式。
图13是本公开一种实施例的物品空间剂量分布检测方法中获得校正模型步骤的流程图,其中,获得校正模型的步骤又可以包括步骤S4121至步骤S124。
在步骤S4121中,提供与待测物匹配的校正组件,该校正组件包括多种尺寸的多个校正块。校正组件可以采用辐照加工中的常用材料制成,例如在本实施例中选择使用匀质有机玻璃制作校正组件。
在一些实施例中,校正块为正方体校正块,正方体校正块的边长为0.1毫米至30毫米,多种尺寸的多个正方体校正块能够拼接形成长方体形状的校正组件。
在步骤S4122中,对校正组件进行透视扫描,获得校正组件的理论密度值。在一些实施例中,可以采用双能X射线球管扫描校正组件并同时获取其图像及理论密度值。
在步骤S4123中,测量多个校正块的质量及尺寸,计算得到与多个校正块对应的多个实际密度值。
在步骤S4124中,将多个实际密度值与理论密度值拟合,得到校正模型。
其中,将多个实际密度值与理论密度值拟合包括将多个实际密度值与理论密度值进行多项式拟合,例如线性拟合、指数拟合、幂拟合、对数拟合等,得到的拟合公式就是校正公式形式的校正模型,得到的数值即为校正因子形式的校正模型。
以下示例一种获得校正模型的过程。如前所述,校正组件可以通过多种尺寸的多个正方体校正块拼接形成,其中拼接形成的校正组件可以是长宽一致的长方体。在该校正组件内部获取与多个校正块分别对应的多个空间点,例如是获取22个点。采用X射线技术透视扫描得到该多个空间点的理论密度值。通过实际测量,获得与多个校正块对应即与多个空间点对应的多个实际密度值。
通常,多个实际密度值是与理论密度值重合或者分布在理论密度值附 近的多个散点,在一些实施例中,可以将多个实际密度值分别与理论密度值作差,得到多个差值,之后将多个差值与对应的散点进行拟合,可以采用多项式拟合,从而拟合后的公式即校正公式形式的校正模型。
可以理解的是,以上仅为一种获得校正模型过程的示例,在其它一些实施例中,校正组件中校正块的形状、数量可以根据需要设置,拟合的方式不限于上述的通过作差后的多项式拟合,也可以是作商,并进行其它方式的拟合。
经过上述步骤,得到校正模型。之后,在步骤S413中,通过校正模型对剂量分布初始模型校正,得到剂量分布标准模型。
其中模型校正为关于密度值的校正模型,因此,在将剂量分布初始模型校正为剂量分布标准模型的过程中,对剂量分布数据与理论密度值的理论映射关系进行校正,得到剂量分布数据与密度值对应更加符合实际的标准映射关系。
至此,得到剂量分布标准模型。
请继续参考图11,在步骤S420中,对待测物进行透视扫描,获得待测物的立体透视图像和待测物各空间点的检测密度值。
在步骤S420中,待测物接受确定能量的X射线进行全面的断层扫描,在一些实施例中,通过双能X射线球管绕待测物旋转一周扫描并同时获取待测物的立体透视图像。探测器可以在竖直轴方向上多列排列,组成二维探测器阵列,探测器采集的信号经计算机处理成数据,得到待测物的立体透视图像和待测物各空间点的检测密度值。
在步骤S430中,根据待测物各空间点的检测密度值及剂量分布标准模型的标准映射关系得到待测物各空间点的剂量分布数据。由于剂量分布标准模型通过对构建的剂量分布初始模型进行校正得到,使得剂量分布标准模型中剂量分布数据与密度值的映射关系更准确,进一步使得获得的各空间点的剂量分布数据更加准确。
在步骤S440中,将待测物各空间点的剂量分布数据与立体透视图像匹配并显示。在一些实施例中,还将待测物各空间点的密度值等其它数据与立体透视图像匹配并显示。
在一些实施例中,可以开发适用的应用界面,以显示超高清的三维图像,在该应用界面中,可以任意角度查看待测物内部透视图像并可显示待测物内部断层截面信息。
根据本公开实施例的物品空间剂量分布检测方法,能够将检测到的待测物的剂量分布信息的结果以图形化显示以及进行数据输出,其中剂量分布信息包括待测物及内部每一个单元的剂量最大值与表面剂量的比值、剂量最小值与表面剂量的比值、剂量不均匀度等信息。从而为后续待测物的辐照工艺提供工艺分析结果和工艺建议方案,例如提供待测物是否适合辐照的判断、剂量分布等级等建议。
根据本公开实施例的物品空间剂量分布检测方法,将待测物各空间点的剂量分布数据与立体透视图像匹配,得到三维立体形式对待测物各空间点的图像信息和剂量分布数据进行显示,使得待测物各立体空间点的剂量分布数据更直观准确,方便辐照工艺中多种参数的合理配置。该物品空间剂量分布检测方法相比常规技术测试周期短,快速高效,测试结果精度高,物品内部情况一目了然,可以极大提高了辐照加工现场的工作效率。
本公开实施例还提供一种物品剂量分布检测装置,用于对待测物的剂量分布进行检测。
图14是本公开一种实施例提供的物品剂量分布检测装置的结构框图。该物品剂量分布检测装置包括透视单元10、数据处理单元20以及图像处理单元30。
透视单元10被配置为对待测物进行透视扫描,以获取待测物上各点的单位面积或单位体积的质量数据。
数据处理单元20被配置为根据单位面积或单位体积的质量数据与预设的映射模型,获得相应的剂量分布数据。其中,预设的映射模型包括物品在预设大小的能量辐照下物品的单位面积或单位体积的质量与剂量分布的映射关系。
以及图像处理单元30被配置将剂量分布数据与待测物的透视图像匹配,生成辐射图像并显示。
根据本公开实施例的物品剂量分布检测装置,将待测物各点的剂量分 布数据与透视图像匹配,得到辐射图像并进行显示,使得待测物各点的剂量分布数据更直观准确,方便辐照工艺中多种参数的合理配置。利用该物品剂量分布检测装置对物品进行剂量分布检测,使得物品内部剂量分布情况一目了然,可以提高辐照加工现场的工作效率。
以下将对得到的辐射图像为平面图像时的情形进行说明,在一些实施例中,辐射图像为平面图像,物品剂量分布检测装置可以是基于剂量场检测的辐射成像装置。
图15是本公开一种实施例提供的辐射成像装置的结构示意图。如图15所示,该辐射成像装置包括:
数据获取单元410,其配置为获取采用X射线扫描待检测物体时待检测物体在X射线对应的辐照能量下的质量厚度数据;
数据分类单元420,其配置为根据待检测物体对应的质量厚度分类条件,对质量厚度数据中的各个质量厚度值进行分类;其中,质量厚度分类条件根据待检测物体对应的质量厚度值和电子束辐照剂量分布数据的映射关系数据确定;
图像生成单元430,其配置为根据各个质量厚度值及其所属分类、电子束辐照剂量分布数据,生成用于显示待检测物体的质量厚度和电子束辐照剂量分布数据的辐射图像。
即,物品剂量分布检测装置的透视单元包括数据获取单元,数据处理单元包括数据分类单元,图像处理单元包括图像生成单元。
因此,本公开实施例能够获取待检测物体的质量厚度数据,并且直接利用与电子束辐照剂量分布数据相关的质量厚度分类条件对待检测物体的质量厚度数据进行分类,然后根据各个质量厚度值及其所属分类、电子束辐照剂量分布数据生成辐射图像,使得测试人员能够直观地根据辐射图像确定剂量不均匀度是否符合要求,提高测试效率、降低测试成本。
在本公开实施例中,辐射成像装置还包括条件确定单元,条件确定单元被配置为根据待检测物体对应的质量厚度值和电子束辐照剂量分布数据的映射关系数据确定质量厚度分类条件。
在本公开实施例中,条件确定单元被进一步配置为获取待检测物体对 应的质量厚度值和电子束辐照剂量分布数据的理论数据,利用待检测物体对应的质量厚度值和电子束辐照剂量分布数据的测量数据修正理论数据,获得映射关系数据。
在本公开实施例中,条件确定单元被进一步配置为根据映射关系数据,确定各个质量厚度值对应的剂量不均匀度值,根据各个质量厚度值及其对应的剂量不均匀度值,建立映射关系曲线,在映射关系曲线中确定多个临界点,并根据多个临界点将质量厚度值分为多类。
在本公开实施例中,图像生成单元430被进一步配置为根据各个质量厚度值及其所属分类,分别赋予各个质量厚度值对应的显示图案,根据各个质量厚度值对应的显示图案,生成待检测物体的辐射图像。
在本公开实施例中,图像生成单元430被进一步配置为获取辐射图像中的目标像素点或目标区域对应的质量厚度值,在映射关系数据中查询质量厚度值对应的电子束辐照剂量分布数据,在目标区域显示电子束辐照剂量分布数据。
在本公开实施例中,图像生成单元430被进一步配置为根据质量厚度值对应的电子束辐照剂量分布数据,确定目标像素点或目标区域对应的剂量不均匀度值,根据剂量不均匀度值与预设的不均匀度最大值的比较结果,确定辐照效果,在目标区域显示剂量不均匀度值和所述辐照效果。
以下将对得到的辐射图像为立体图像时的情形进行说明,在一些实施例中,辐射图像为立体图像,物品剂量分布检测装置可以是物品空间剂量分布检测装置。
图16是本公开一种实施例提供的物品空间剂量分布检测装置的结构框图,该物品空间剂量分布检测装置包括模型处理装置110、立体透视装置120、计算装置130以及显示装置140。
模型处理装置110用于构建剂量分布标准模型,剂量分布标准模型包括物品在预设大小的能量辐照下剂量分布数据与密度值的标准映射关系。
立体透视装置120用于对待测物200进行透视扫描,以获得待测物200的立体透视图像和待测物200各空间点的检测密度值。
计算装置130与模型处理装置110、立体透视装置120连接,计算装置 130根据待测物200各空间点的检测密度值及剂量分布标准模型的标准映射关系得到待测物200各空间点的剂量分布数据。
显示装置140与计算装置130连接,显示装置140将待测物200各空间点的剂量分布数据与立体透视图像匹配并显示。
即,物品剂量分布检测装置还包括模型处理装置,透视单元包括立体透视装置,数据处理单元包括计算装置,图像处理单元包括显示装置。
在一些实施例中,物品空间剂量分布检测装置还包括校正组件150,校正组件150用于通过立体透视装置120的透视扫描获取校正模型。其中,模型处理装置110能够构建剂量分布初始模型,并根据校正模型对剂量分布初始模型校正,得到剂量分布标准模型。
由于剂量分布标准模型通过对构建的剂量分布初始模型进行校正得到,使得剂量分布标准模型中剂量分布数据与密度值的映射关系更准确,进一步使得获得的各空间点的剂量分布数据更加准确。
在一些实施例中,校正组件150可以包括多种尺寸的多个校正块,校正块可以为正方体校正块,正方体校正块的边长为0.1毫米至30毫米,多种尺寸的多个正方体校正块能够拼接形成长方体形状的校正组件150。
根据本公开实施例的物品空间剂量分布检测装置,能够将检测到的待测物的剂量分布信息的结果以图形化显示以及进行数据输出。在一些实施例中,可以开发适用的应用界面,在显示装置140上显示超高清的三维图像,在该应用界面中,可以任意角度查看待测物内部透视图像并可显示待测物内部断层截面信息。
图17至图20分别示出根据本公开实施例的物品空间剂量分布检测装置中显示装置显示的界面示意图,其中图17至图20分别示出物品空间剂量分布检测装置检测不同类型待测物的界面示意图。
图17和图18为物品空间剂量分布检测装置检测宠物食品时的界面示意图,图19为物品空间剂量分布检测装置检测食品鸡爪时的界面示意图,图20为物品空间剂量分布检测装置检测水果车厘子时的界面示意图。图17至图20中,显示装置140上显示的界面包括多个区域,分别为位于右侧的第一区域A1、位于左上侧的第二区域A2以及位于左下侧的第三区域A3。 其中,第一区域A1用于显示待测物的立体图像,第二区域A2可以切换显示待测物的六视图像,第三区域A3用于显示待测物内部某个截面的图像,其中第二区域A2内的直线示出截面图像的截取位置。
显示装置140上显示的界面中,待测物内部结构和各空间点对应数据可以全角度查看,针对内部某一截面可以进行放大查看。图17和图18分布示出宠物食品的不同角度的界面。
显示装置140上显示的界面中,不同穿透厚度区间可以采用不同颜色/色度区分,任意空间点或区域对应的剂量分布数据可以通过选择对应点、框选对应区域进行显示。其中剂量分布信息包括待测物及内部每一个单元的剂量最大值与表面剂量的比值、剂量最小值与表面剂量的比值、剂量不均匀度等信息。从而为后续待测物的辐照工艺提供工艺分析结果和工艺建议方案,例如提供待测物是否适合辐照的判断、剂量分布等级等建议。
根据本公开实施例的物品空间剂量分布检测装置,将待测物各空间点的剂量分布数据与立体透视图像匹配,得到三维立体形式对待测物各空间点的图像信息和剂量分布数据并在显示装置140上进行显示,使得待测物各立体空间点的剂量分布数据更直观准确,方便辐照工艺中多种参数的合理配置。该物品空间剂量分布检测方法相比常规技术测试周期短,快速高效,测试结果精度高,物品内部情况一目了然,可以极大提高了辐照加工现场的工作效率。
需要明确的是,本公开并不局限于上文所描述并在图中示出的特定配置和处理。为了简明起见,这里省略了对已知方法的详细描述。在上述实施例中,描述和示出了若干具体的步骤作为示例。但是,本公开的方法过程并不限于所描述和示出的具体步骤,本领域的技术人员可以在领会本公开的精神后,作出各种改变、修改和添加,或者改变步骤之间的顺序。
以上所述的结构框图中所示的功能块可以实现为硬件、软件、固件或者它们的组合。当以硬件方式实现时,其可以例如是电子电路、专用集成电路(ASIC)、适当的固件、插件、功能卡等等。当以软件方式实现时,本公开的元素是被用于执行所需任务的程序或者代码段。程序或者代码段可以存储在机器可读介质中,或者通过载波中携带的数据信号在传输介质 或者通信链路上传送。“机器可读介质”可以包括能够存储或传输信息的任何介质。机器可读介质的例子包括电子电路、半导体存储器设备、ROM、闪存、可擦除ROM(EROM)、软盘、CD-ROM、光盘、硬盘、光纤介质、射频(RF)链路,等等。代码段可以经由诸如因特网、内联网等的计算机网络被下载。
还需要说明的是,本公开中提及的示例性实施例,基于一系列的步骤或者装置描述一些方法或系统。但是,本公开不局限于上述步骤的顺序,也就是说,可以按照实施例中提及的顺序执行步骤,也可以不同于实施例中的顺序,或者若干步骤同时执行。
以上所述,仅为本公开的具体实施方式,所属领域的技术人员可以清楚地了解到,为了描述的方便和简洁,上述描述的系统、模块和单元的具体工作过程,可以参考前述方法实施例中的对应过程,在此不再赘述。应理解,本公开的保护范围并不局限于此,任何熟悉本技术领域的技术人员在本公开揭露的技术范围内,可轻易想到各种等效的修改或替换,这些修改或替换都应涵盖在本公开的保护范围之内。
Claims (19)
- 一种物品剂量分布检测方法,包括:对待测物进行透视扫描,获取所述待测物上各点的单位面积或单位体积的质量数据;根据所述单位面积或单位体积的质量数据与预设的映射模型,获得相应的剂量分布数据,其中,所述预设的映射模型包括物品在预设大小的能量辐照下物品的单位面积或单位体积的质量与剂量分布的映射关系;以及将所述剂量分布数据与所述待测物的透视图像匹配,生成辐射图像并显示。
- 根据权利要求1所述的物品剂量分布检测方法,其中,所述辐射图像为平面图像,所述物品剂量分布检测方法包括:获取采用X射线扫描待检测物体时所述待检测物体在所述X射线对应的辐照能量下的质量厚度数据;根据所述待检测物体对应的质量厚度分类条件,对所述质量厚度数据中的各个质量厚度值进行分类;其中,所述质量厚度分类条件根据所述待检测物体对应的质量厚度值和电子束辐照剂量分布数据的映射关系数据确定;根据各个质量厚度值及其所属分类、电子束辐照剂量分布数据,生成用于显示所述待检测物体的质量厚度和电子束辐照剂量分布数据的辐射图像。
- 根据权利要求2所述的物品剂量分布检测方法,其中,确定所述质量厚度分类条件的方法包括:根据所述映射关系数据,确定各个质量厚度值对应的剂量不均匀度值;根据各个质量厚度值及其对应的剂量不均匀度值,建立映射关系曲线;在所述映射关系曲线中确定多个临界点,并根据所述多个临界点将质量厚度值分为多类。
- 根据权利要求3所述的物品剂量分布检测方法,其中,所述在所述映射关系曲线中确定多个临界点包括:若为单面辐照,根据预设的不均匀度最大值,在所述映射关系曲线中确定多个临界点;若为双面辐照,根据预设的不均匀度最大值和所述映射关系曲线的谷值,在所述映射关系曲线中确定多个临界点。
- 根据权利要求2所述的物品剂量分布检测方法,其中,所述根据各个质量厚度值及其所属分类、电子束辐照剂量分布数据,生成用于显示所述待检测物体的质量厚度和电子束辐照剂量分布数据的辐射图像,包括:根据各个质量厚度值及其所属分类,分别赋予各个质量厚度值对应的显示图案;根据各个质量厚度值对应的显示图案,生成所述待检测物体的辐射图像。
- 根据权利要求5所述的物品剂量分布检测方法,其中,所述根据各个质量厚度值及其所属分类、电子束辐照剂量分布数据,生成用于显示所述待检测物体的质量厚度和电子束辐照剂量分布数据的辐射图像,还包括:获取所述辐射图像中的目标像素点或目标区域对应的质量厚度值;在所述映射关系数据中查询所述质量厚度值对应的电子束辐照剂量分布数据;在目标区域显示所述电子束辐照剂量分布数据。
- 根据权利要求6所述的物品剂量分布检测方法,其中,所述根据各个质量厚度值及其所属分类、电子束辐照剂量分布数据,生成用于显示所述待检测物体的质量厚度和电子束辐照剂量分布数据的辐射图像,还包括:根据所述质量厚度值对应的电子束辐照剂量分布数据,确定所述目标像素点或目标区域对应的剂量不均匀度值;根据所述剂量不均匀度值与预设的不均匀度最大值的比较结果,确定辐照效果;在所述目标区域显示所述剂量不均匀度值和所述辐照效果。
- 根据权利要求1所述的物品剂量分布检测方法,其中,所述辐射图像为立体图像,所述物品剂量分布检测方法包括:构建剂量分布标准模型,所述剂量分布标准模型包括物品在预设大小 的能量辐照下剂量分布数据与密度值的标准映射关系;对待测物进行透视扫描,获得所述待测物的立体透视图像和所述待测物各空间点的检测密度值;根据所述待测物各空间点的所述检测密度值及所述剂量分布标准模型的标准映射关系得到所述待测物各空间点的剂量分布数据;以及将所述待测物各空间点的所述剂量分布数据与所述立体透视图像匹配并显示。
- 根据权利要求8所述的物品剂量分布检测方法,其中,所述构建剂量分布标准模型包括:构建剂量分布初始模型,所述剂量分布初始模型包括物品在预设大小的能量辐照下剂量分布数据与理论密度值的理论映射关系;获得校正模型;通过所述校正模型对所述剂量分布初始模型校正,得到所述剂量分布标准模型。
- 根据权利要求9所述的物品剂量分布检测方法,其中,所述获得校正模型包括:提供与所述待测物匹配的校正组件,所述校正组件包括多种尺寸的多个校正块;对所述校正组件进行透视扫描,获得所述校正组件的理论密度值;测量多个所述校正块的质量及尺寸,计算得到与多个所述校正块对应的多个实际密度值;将多个所述实际密度值与所述理论密度值拟合,得到所述校正模型。
- 根据权利要求10所述的物品剂量分布检测方法,其中,所述将多个所述实际密度值与所述理论密度值拟合包括将多个所述实际密度值与所述理论密度值进行多项式拟合。
- 根据权利要求10所述的物品剂量分布检测方法,其中,所述校正块为正方体校正块,所述正方体校正块的边长为0.1毫米至30毫米,多种尺寸的多个所述正方体校正块能够拼接形成长方体形状的所述校正组件。
- 根据权利要求8所述的物品剂量分布检测方法,其中,所述剂量 分布数据包括以下中的至少任一:剂量最大值与表面剂量的比值数据;剂量最小值与表面剂量的比值数据;剂量不均匀度数据。
- 根据权利要求8所述的物品剂量分布检测方法,其中,所述预设大小的能量为1MeV至20MeV的能量。
- 一种物品剂量分布检测装置,包括:透视单元,被配置为对待测物进行透视扫描,以获取所述待测物上各点的单位面积或单位体积的质量数据;数据处理单元,被配置为根据所述单位面积或单位体积的质量数据与预设的映射模型,获得相应的剂量分布数据,其中,所述预设的映射模型包括物品在预设大小的能量辐照下物品的单位面积或单位体积的质量与剂量分布的映射关系;以及图像处理单元,被配置将所述剂量分布数据与所述待测物的透视图像匹配,生成辐射图像并显示。
- 根据权利要求15所述的物品剂量分布检测装置,其中:所述透视单元包括数据获取单元,所述数据获取单元被配置为获取采用X射线扫描待检测物体时所述待检测物体在所述X射线对应的辐照能量下的质量厚度数据;所述数据处理单元包括数据分类单元,所述数据分类单元被配置为根据所述待检测物体对应的质量厚度分类条件,对所述质量厚度数据中的各个质量厚度值进行分类;其中,所述质量厚度分类条件根据所述待检测物体对应的质量厚度值和电子束辐照剂量分布数据的映射关系数据确定;所述图像处理单元包括图像生成单元,所述图像生成单元被配置为根据各个质量厚度值及其所属分类、电子束辐照剂量分布数据,生成用于显示所述待检测物体的质量厚度和电子束辐照剂量分布数据的辐射图像。
- 根据权利要求15所述的物品剂量分布检测装置,还包括:模型处理装置,用于构建剂量分布标准模型,所述剂量分布标准模型包括物品在预设大小的能量辐照下剂量分布数据与密度值的标准映射关系;所述透视单元包括立体透视装置,所述立体透视装置用于对待测物进行透视扫描,以获得所述待测物的立体透视图像和所述待测物各空间点的检测密度值;所述数据处理单元包括计算装置,所述计算装置与所述模型处理装置、所述立体透视装置连接,所述计算装置根据所述待测物各空间点的所述检测密度值及所述剂量分布标准模型的标准映射关系得到所述待测物各空间点的剂量分布数据;所述图像处理单元包括显示装置,所述显示装置与所述计算装置连接,所述显示装置将所述待测物各空间点的所述剂量分布数据与所述立体透视图像匹配并显示。
- 根据权利要求17所述的物品剂量分布检测装置,还包括:校正组件,用于通过所述立体透视装置的透视扫描获取校正模型,其中,所述模型处理装置能够构建剂量分布初始模型,并根据所述校正模型对所述剂量分布初始模型校正,得到所述剂量分布标准模型。
- 根据权利要求18所述的物品剂量分布检测装置,其中,所述校正组件包括多种尺寸的多个校正块,所述校正块为正方体校正块,所述正方体校正块的边长为0.1毫米至30毫米,多种尺寸的多个所述正方体校正块能够拼接形成长方体形状的所述校正组件。
Applications Claiming Priority (4)
| Application Number | Priority Date | Filing Date | Title |
|---|---|---|---|
| CN201910566051.3 | 2019-06-27 | ||
| CN201910566051.3A CN112147664A (zh) | 2019-06-27 | 2019-06-27 | 物品空间剂量分布检测方法及装置 |
| CN201910568018.4 | 2019-06-27 | ||
| CN201910568018.4A CN112146601B (zh) | 2019-06-27 | 2019-06-27 | 基于剂量场检测的辐射成像方法及装置 |
Publications (1)
| Publication Number | Publication Date |
|---|---|
| WO2020259368A1 true WO2020259368A1 (zh) | 2020-12-30 |
Family
ID=74043464
Family Applications (1)
| Application Number | Title | Priority Date | Filing Date |
|---|---|---|---|
| PCT/CN2020/096606 Ceased WO2020259368A1 (zh) | 2019-06-27 | 2020-06-17 | 物品剂量分布检测方法及装置 |
Country Status (2)
| Country | Link |
|---|---|
| US (1) | US11369333B2 (zh) |
| WO (1) | WO2020259368A1 (zh) |
Families Citing this family (1)
| Publication number | Priority date | Publication date | Assignee | Title |
|---|---|---|---|---|
| US12347092B2 (en) * | 2021-06-25 | 2025-07-01 | Frito-Lay North America, Inc. | Devices, systems, and methods for virtual bulk density sensing |
Citations (5)
| Publication number | Priority date | Publication date | Assignee | Title |
|---|---|---|---|---|
| JP2001025501A (ja) * | 1999-07-13 | 2001-01-30 | Mitsubishi Electric Corp | 放射線照射装置 |
| US6396065B1 (en) * | 1998-12-01 | 2002-05-28 | Mitsubishi Denki Kabushiki Kaisha | Radioactive ray irradiating apparatus |
| CN100998497A (zh) * | 2006-12-29 | 2007-07-18 | 四川大学 | 确定电子束剂量分布的方法 |
| CN101937729A (zh) * | 2009-06-30 | 2011-01-05 | 同方威视技术股份有限公司 | 电子束辐照加工的方法和装置 |
| CN106772528A (zh) * | 2016-11-28 | 2017-05-31 | 江苏省农业科学院 | 一种产品辐照剂量分布及其不均匀度的测定方法 |
Family Cites Families (10)
| Publication number | Priority date | Publication date | Assignee | Title |
|---|---|---|---|---|
| JPH0866388A (ja) | 1994-08-31 | 1996-03-12 | Shimadzu Corp | 放射線撮像装置 |
| US7006862B2 (en) | 2001-07-17 | 2006-02-28 | Accuimage Diagnostics Corp. | Graphical user interfaces and methods for retrospectively gating a set of images |
| DE102004051171A1 (de) | 2004-10-20 | 2006-05-11 | Siemens Ag | Verfahren zum Betreiben eines Fachdetektors mit verringerten Umschaltartefakten |
| CN1995993B (zh) | 2005-12-31 | 2010-07-14 | 清华大学 | 一种利用多种能量辐射扫描物质的方法及其装置 |
| CN102023306B (zh) | 2009-09-11 | 2013-10-09 | 同方威视技术股份有限公司 | 加速器剂量监测装置及校正方法、加速器靶点p偏移监测方法 |
| CN102540233B (zh) | 2011-12-09 | 2013-10-09 | 江苏省农业科学院 | 电子束辐射有效射程的测定方法及带状剂量指示计 |
| CN105403581B (zh) | 2015-12-08 | 2017-11-07 | 四川大学 | 薄膜厚度分布及其均匀性的射线测量方法 |
| CN108169256B (zh) | 2016-12-07 | 2021-04-06 | 同方威视技术股份有限公司 | 多能谱x射线成像系统和用于利用多能谱x射线成像系统识别物品的方法 |
| US10682528B2 (en) | 2017-03-03 | 2020-06-16 | Varian Medical Systems International Ag | Systems, methods, and devices for radiation beam asymmetry measurements using electronic portal imaging devices |
| CN108508052B (zh) | 2018-06-11 | 2023-10-20 | 西北核技术研究所 | 基于参考元素的x射线荧光薄层质量厚度测量系统及方法 |
-
2020
- 2020-06-17 WO PCT/CN2020/096606 patent/WO2020259368A1/zh not_active Ceased
- 2020-06-24 US US16/946,508 patent/US11369333B2/en active Active
Patent Citations (5)
| Publication number | Priority date | Publication date | Assignee | Title |
|---|---|---|---|---|
| US6396065B1 (en) * | 1998-12-01 | 2002-05-28 | Mitsubishi Denki Kabushiki Kaisha | Radioactive ray irradiating apparatus |
| JP2001025501A (ja) * | 1999-07-13 | 2001-01-30 | Mitsubishi Electric Corp | 放射線照射装置 |
| CN100998497A (zh) * | 2006-12-29 | 2007-07-18 | 四川大学 | 确定电子束剂量分布的方法 |
| CN101937729A (zh) * | 2009-06-30 | 2011-01-05 | 同方威视技术股份有限公司 | 电子束辐照加工的方法和装置 |
| CN106772528A (zh) * | 2016-11-28 | 2017-05-31 | 江苏省农业科学院 | 一种产品辐照剂量分布及其不均匀度的测定方法 |
Non-Patent Citations (2)
| Title |
|---|
| HUAILI QIN ET AL.: "Concept development of X-ray mass thickness detection for irradiated items upon electron beam irradiation processing", RADIATION PHYSICS AND CHEMISTRY, vol. 143, 14 September 2017 (2017-09-14), XP085254662, DOI: 20200807090018X * |
| HUAILI QIN ET AL.: "Concept development of X-ray mass thickness detection for irradiated items upon electron beam irradiation processing", RADIATION PHYSICS AND CHEMISTRY, vol. 143, 14 September 2017 (2017-09-14), XP085254662, DOI: 20200807090029Y * |
Also Published As
| Publication number | Publication date |
|---|---|
| US20200405255A1 (en) | 2020-12-31 |
| US11369333B2 (en) | 2022-06-28 |
Similar Documents
| Publication | Publication Date | Title |
|---|---|---|
| US8320523B2 (en) | Method and device for inspection of liquid articles | |
| EP3242126B1 (en) | Dual-energy ray imaging method and system | |
| US8494114B2 (en) | Method and device for inspection of liquid articles | |
| US6694047B1 (en) | Method and apparatus for automated image quality evaluation of X-ray systems using any of multiple phantoms | |
| EP0873511A1 (en) | Apparatus and method for automatic recognition of concealed objects using multiple energy computed tomography | |
| JP7060446B2 (ja) | X線ラインセンサ及びそれを用いたx線異物検出装置 | |
| JP2002296022A (ja) | X線による質量測定方法及びx線質量測定装置 | |
| US20060098866A1 (en) | User interface for inspection system with isoluminant regions | |
| JP6462228B2 (ja) | X線検査装置 | |
| US11369333B2 (en) | Method and apparatus for detecting dose distribution of article | |
| CN107515431A (zh) | 一种被动式太赫兹人体安检仪的性能测试方法和装置 | |
| EP2366103A1 (en) | Measurement of position of center detector for geometric calibrating a ct scanner based on a complex phantom | |
| US9869631B2 (en) | Analysis device and method of determining mounted state of cartridge of the analysis device | |
| CN104997525B (zh) | 一种数字放射影像设备关键部件选型的装置与方法 | |
| JP4994225B2 (ja) | 2パラメータスペクトルの処理方法及び装置 | |
| CN112146601B (zh) | 基于剂量场检测的辐射成像方法及装置 | |
| CN105277578B (zh) | 一种提高双能辐射系统材料识别能力的方法及系统 | |
| JP2020148703A (ja) | X線検査装置 | |
| JP2016024096A (ja) | 検査装置 | |
| CN112147664A (zh) | 物品空间剂量分布检测方法及装置 | |
| CN108459344B (zh) | 基于γ相机的局域谱分析方法及装置 | |
| JP2006300889A (ja) | 物品検査システム | |
| CN105806857B (zh) | 双能射线检查系统物质识别及其分类参数处理方法与装置 | |
| McNiven et al. | Ionization chamber volume determination and quality assurance using micro-CT imaging | |
| JP2018105697A (ja) | 質量推定装置 |
Legal Events
| Date | Code | Title | Description |
|---|---|---|---|
| 121 | Ep: the epo has been informed by wipo that ep was designated in this application |
Ref document number: 20832504 Country of ref document: EP Kind code of ref document: A1 |
|
| NENP | Non-entry into the national phase |
Ref country code: DE |
|
| 122 | Ep: pct application non-entry in european phase |
Ref document number: 20832504 Country of ref document: EP Kind code of ref document: A1 |