WO2020240638A1 - 顕微鏡装置、顕微鏡装置の制御方法、および顕微鏡装置の制御プログラム - Google Patents
顕微鏡装置、顕微鏡装置の制御方法、および顕微鏡装置の制御プログラム Download PDFInfo
- Publication number
- WO2020240638A1 WO2020240638A1 PCT/JP2019/020786 JP2019020786W WO2020240638A1 WO 2020240638 A1 WO2020240638 A1 WO 2020240638A1 JP 2019020786 W JP2019020786 W JP 2019020786W WO 2020240638 A1 WO2020240638 A1 WO 2020240638A1
- Authority
- WO
- WIPO (PCT)
- Prior art keywords
- sample
- unit
- objective lens
- refractive index
- information
- Prior art date
- Legal status (The legal status is an assumption and is not a legal conclusion. Google has not performed a legal analysis and makes no representation as to the accuracy of the status listed.)
- Ceased
Links
Images









Classifications
-
- G—PHYSICS
- G02—OPTICS
- G02B—OPTICAL ELEMENTS, SYSTEMS OR APPARATUS
- G02B21/00—Microscopes
-
- G—PHYSICS
- G02—OPTICS
- G02B—OPTICAL ELEMENTS, SYSTEMS OR APPARATUS
- G02B21/00—Microscopes
- G02B21/02—Objectives
-
- G—PHYSICS
- G02—OPTICS
- G02B—OPTICAL ELEMENTS, SYSTEMS OR APPARATUS
- G02B21/00—Microscopes
- G02B21/24—Base structure
-
- G—PHYSICS
- G02—OPTICS
- G02B—OPTICAL ELEMENTS, SYSTEMS OR APPARATUS
- G02B21/00—Microscopes
- G02B21/36—Microscopes arranged for photographic purposes or projection purposes or digital imaging or video purposes including associated control and data processing arrangements
Definitions
- the present invention relates to a microscope device, a method for controlling the microscope device, and a control program for the microscope device.
- the microscope device has an illumination optical system for illuminating a sample, a detection unit for detecting light from the sample, and an objective lens, and has detection optics for guiding the light from the sample to the detection unit.
- the system includes an aberration correction unit that corrects aberrations of at least one of the illumination optical system and the detection optical system, and a control unit, and the control unit is the depth of the sample in the optical axis direction of the objective lens.
- Information on the correction amount of the aberration correction unit at the first position in the direction is calculated based on the light detected by the detection unit, and the information on the correction amount of the aberration correction unit at the calculated first position is calculated.
- the information on the refractive index of the sample, the information on the correction amount of the aberration correction unit at the second position different from the first position is calculated.
- the control method of the microscope device includes an illumination optical system for illuminating the sample, a detection unit for detecting the light from the sample, and an objective lens, and the light from the sample is sent to the detection unit.
- a control method for a microscope device including a detection optical system for guiding, an aberration correction unit for correcting aberrations of at least one of the illumination optical system and the detection optical system, and a control unit, in the direction of the optical axis of the objective lens.
- Information on the correction amount of the aberration correction unit at the first position in the depth direction of the sample is calculated based on the light detected by the detection unit, and the aberration correction at the calculated first position is performed. Based on the information on the correction amount of the portion and the information on the refractive index of the sample, the information on the correction amount of the aberration correction portion at the second position different from the first position is calculated.
- the control program of the microscope device has an illumination optical system for illuminating the sample, a detection unit for detecting the light from the sample, and an objective lens, and the light from the sample is sent to the detection unit. It is a control program of a microscope device including a detection optical system for guiding, an aberration correction unit for correcting an aberration of at least one of the illumination optical system and the detection optical system, and a control unit, and the light of the objective lens is transmitted to a computer. Information on the correction amount of the aberration correction unit at the first position in the depth direction of the sample, which is the axial direction, is calculated based on the light detected by the detection unit, and at the calculated first position. Based on the information on the correction amount of the aberration correction unit and the information on the refractive index of the sample, a process of calculating information on the correction amount of the aberration correction unit at a second position different from the first position is executed. Let me.
- the microscope device has a detection unit that detects light from a sample, an objective lens, a detection optical system that guides the light from the sample to the detection unit, and aberrations of the detection optical system.
- An aberration correction unit for correction and a control unit are provided, and the control unit provides information on the correction amount of the aberration correction unit at a first position in the depth direction of the sample, which is the optical axis direction of the objective lens.
- the first Information on the correction amount of the aberration correction unit at the second position different from the position is calculated.
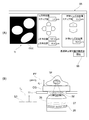
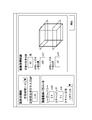
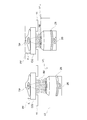
- (A) is a schematic diagram showing an example of GUI used when setting the observation depth and the like
- (B) is an explanatory diagram showing the relationship between the observation depth and the position of the objective lens. It is a figure which shows an example of GUI used when inputting the refractive index of a sample.
- (A) is an explanatory diagram showing the relationship between the observation depth, the optimum rotation position of the correction ring, and the position of the objective lens
- (B) is a schematic diagram showing a parameter list according to the first embodiment. is there. It is a flowchart which shows the detail of the correction ring position determination process which concerns on 1st Embodiment.
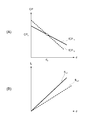
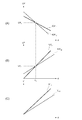
- (A) is a graph showing the relationship between the observation depth and the optimum rotation position of the correction ring
- (B) is a graph showing the relationship between the observation depth and the optimum position of the objective lens
- (C) is a graph showing the relationship between the observation depth and the position of the objective lens when the rotation position of the correction ring is constant.
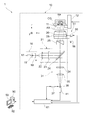
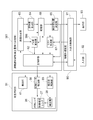
- FIG. 1 is a diagram showing a configuration of a microscope device 1 according to a first embodiment.
- the microscope device 1 is mainly composed of a confocal microscope 10 and an information processing device 90.
- the confocal microscope 10 and the information processing apparatus 90 are configured to be capable of transmitting and receiving data to and from each other.
- the coordinate axis extending in the optical axis direction of the objective lens 26 of the confocal microscope 10 is defined as the z-axis.
- the coordinate axes extending in the directions orthogonal to each other in the plane perpendicular to the z-axis are defined as the x-axis and the y-axis, respectively.
- the confocal microscope 10 includes a stage 11, a light source unit 16, an illumination optical system 21, a detection optical system 31, a detection unit 41, an aberration correction unit 51, and a microscope control unit 61.
- the stage 11 is formed in a plate shape having an opening in the center.
- the stage 11 supports the cover glass CG on which the sample TP to be observed is placed (see FIG. 2).
- sample TP include biological samples (not shown) and beads (not shown).
- the biological sample is a thick sample such as fluorescently stained cells.
- the beads are microspheres made of fluorescently labeled polystyrene (for example, having a diameter of about 0.2 ⁇ m).
- the stage 11 is provided with a stage drive unit 12.
- the stage drive unit 12 moves the stage 11 in a plane perpendicular to the z-axis (optical axis AX of the objective lens 26).
- the stage drive unit 12 may move the stage 11 along the z-axis (optical axis AX of the objective lens 26).
- the light source unit 16 emits excitation light for exciting the fluorescent substance contained in the sample TP.
- the light source unit 16 includes a light source 17, a shutter 18, and an acoustic optical element 19.
- the illumination optical system 21 illuminates the sample TP with the excitation light emitted from the light source unit 16.
- the illumination optical system 21 includes an illumination lens 22, an excitation filter 23, a dichroic mirror 24, a scanner 25, and an objective lens 26 in this order from the light source unit 16 side.
- the illumination lens 22 is a collimator lens for converting the excitation light emitted from the light source unit 16 into parallel light.
- the excitation filter 23 has a property that the excitation light from the light source unit 16 is transmitted and blocks at least a part of light of other wavelengths (eg, external light, stray light).
- the dichroic mirror 24 has a characteristic that the excitation light emitted from the light source unit 16 is reflected and the light in a predetermined wavelength band (eg, fluorescence) among the light generated by the sample TP on the stage 11 is transmitted.
- the scanner 25 scans the sample TP with the excitation light from the light source unit 16 in two directions, the x direction and the y direction.
- a galvano scanner, a resonant scanner, or the like is used as the scanner 25, for example, a galvano scanner, a resonant scanner, or the like is used.
- the objective lens 26 is arranged near the lower side of the stage 11.
- the objective lens 26 faces the sample TP on the stage 11 through the opening of the stage 11 and the cover glass CG (see FIG. 2).
- the gap between the objective lens 26 and the cover glass CG is filled with an immersion IM (see FIG. 2).
- the gap between the objective lens 26 and the cover glass CG is not limited to the immersion IM, and may be filled with a gas such as air.
- the detection optical system 31 collects the fluorescence generated in the sample TP.
- the detection optical system 31 includes an objective lens 26, a scanner 25, and a dichroic mirror 24 in this order from the sample TP side. Further, the detection optical system 31 has a fluorescence filter 34 and a condenser lens 35 in this order from the dichroic mirror 24 side.
- the fluorescence filter 34 has a characteristic that light in a predetermined wavelength band (eg, fluorescence) among the light from the sample TP is transmitted.
- the fluorescence filter 34 blocks at least a part of the excitation light, the outside light, the stray light, etc. reflected by the sample TP, for example.
- the condenser lens 35 collects the fluorescence from the sample TP.
- the detection unit 41 detects the fluorescence generated in the sample TP via the detection optical system 31. As the detection unit 41, for example, a photomultiplier tube is used.
- a pinhole 36 is provided in the vicinity of the detection unit 41 between the detection optical system 31 and the detection unit 41.
- the pinhole 36 is arranged at a position conjugate with the focal position on the sample TP side of the objective lens 26.
- the pinhole 36 is displaced from the focal plane of the objective lens 26 (the plane perpendicular to the optical axis AX of the objective lens 26 passing through the focal position of the objective lens 26) or the focal plane in the optical axis direction within a predetermined deviation allowable range. Only the light from the surface is allowed to pass through, and other light is blocked.
- the pinhole 36 is provided with a pinhole drive unit 37.
- the pinhole drive unit 37 enlarges or reduces the size of the pinhole 36. By enlarging or reducing the size of the pinhole 36 by the pinhole driving unit 37, the predetermined deviation allowable range described above can be changed.
- the microscope control unit 61 controls the stage drive unit 12, the pinhole drive unit 37, the detection unit 41, and the like. Further, the microscope control unit 61 sets, for example, the light intensity of the excitation light emitted from the light source unit 16, the size of the pinhole 36, the scanning speed of the excitation light with respect to the sample TP, and the like as the acquisition conditions of the image of the sample TP. To do.
- the excitation light emitted from the light source unit 16 passes through the illumination lens 22 of the illumination optical system 21 and becomes substantially parallel light.
- the excitation light transmitted through the illumination lens 22 passes through the excitation filter 23 and enters the dichroic mirror 24.
- the excitation light incident on the dichroic mirror 24 is reflected by the dichroic mirror 24 and incident on the scanner 25.
- the scanner 25 scans the sample TP with the excitation light incident on the scanner 25 in two directions, the x direction and the y direction.
- the excitation light incident on the scanner 25 passes through the scanner 25, passes through the objective lens 26, and is focused on the focal plane of the objective lens 26.
- the portion of the sample TP where the excitation light is focused is two-dimensionally scanned by the scanner 25 in two directions, the x direction and the y direction.
- Fluorescence is emitted from the fluorescent substance contained in the portion of the sample TP where the excitation light is focused.
- the fluorescence emitted by the sample TP is incident on the objective lens 26 as the detection optical system 31.
- the fluorescence incident on the objective lens 26 passes through the objective lens 26, passes through the scanner 25, and is incident on the dichroic mirror 24. Since the fluorescence incident on the dichroic mirror 24 has a wavelength different from that of the excitation light, it passes through the dichroic mirror 24 and reaches the fluorescence filter 34.
- the fluorescence that has reached the fluorescence filter 34 passes through the focusing lens 35 through the fluorescence filter 34 and is focused at a position conjugate with the focal position of the objective lens 26.
- the fluorescence focused at the position conjugate with the focal position of the objective lens 26 passes through the pinhole 36 and is incident on the detection unit 41.
- the detection unit 41 performs photoelectric conversion of the light (fluorescence) incident on the detection unit 41, and generates data corresponding to the amount of light (brightness) of the light as a light detection signal.
- the detection unit 41 outputs the generated data to the microscope control unit 61.
- the microscope control unit 61 takes the data input from the detection unit 41 as data for one pixel, and arranges the data in synchronization with the two-dimensional scanning by the scanner 25 to obtain data for a plurality of pixels.
- One image data arranged in a dimension (in two directions) is generated and stored in a storage unit 68 (see FIG. 3) such as a RAM. In this way, the microscope control unit 61 acquires an image of the sample TP.
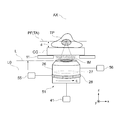
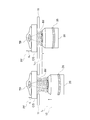
- FIG. 2 is an enlarged view of the aberration correction unit 51 in the confocal microscope 10.
- the aberration correction unit 51 corrects spherical aberration caused by the distance from the tip of the objective lens 26 to the cover glass CG, the thickness of the cover glass CG, the observation depth in the sample, and the like.
- the objective lens 26 is held near the lower part of the stage 11 by a revolver (not shown).
- the objective lens 26 has an aberration correction lens 27 and a correction ring 28.
- the aberration correction lens 27 can change the spherical aberration of the objective lens 26 by moving along the optical axis AX of the objective lens 26.
- the correction ring 28 is rotatably provided on the lens barrel portion of the objective lens 26 about the optical axis AX of the objective lens 26.
- the aberration correction lens 27 moves along the optical axis AX of the objective lens 26 according to the rotation of the correction ring 28.
- the aberration correction unit 51 includes an aberration correction lens 27 and a correction ring 28 of the objective lens 26, and a detection unit 41. Further, the aberration correction unit 51 includes a correction ring drive unit 55 and an objective lens drive unit 56.
- the correction ring drive unit 55 is configured by using, for example, an electric motor (not shown).
- the correction ring driving unit 55 rotationally drives the correction ring 28, changes the rotation position C of the correction ring 28, and moves the aberration correction lens 27 along the optical axis AX of the objective lens 26.
- the correction ring driving unit 55 changes the spherical aberration of the objective lens 26 by changing the rotation position (1) of the correction ring 28 and changing the position of the aberration correction lens 27 on the optical axis.
- the objective lens driving unit 56 is configured by using, for example, an electric motor (not shown).
- the objective lens driving unit 56 moves the objective lens 26 up and down in the z direction together with a revolver (not shown).
- the relative position of the objective lens 26 with respect to the sample TP changes, and the focal position PF of the objective lens 26 with respect to the sample TP changes in the z direction.
- an image of a cross section (observation surface TA) of a sample TP having a different position in the z direction (optical axis direction of the objective lens 26) is acquired. It is possible to do.
- an image of a cross section of a plurality of sample TPs having different positions in the z direction may be referred to as a z-stack image of the sample TP.
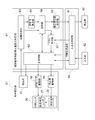
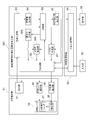
- FIG. 3 is a block diagram showing an electrical connection between the microscope control unit 61 and the information processing device 90 of the confocal microscope 10 according to the first embodiment.
- the microscope control unit 61 of the confocal microscope 10 also functions as an aberration correction amount calculation determination unit, and obtains an optimum rotation position of the correction ring 28.
- the microscope control unit 61 includes a main control unit 62, an image generation unit 63, an evaluation value calculation unit 64, a correction ring position determination unit 65, a list creation unit 67, and a storage unit 68.
- the main control unit 62 is electrically connected to the detection unit 41, the correction ring drive unit 55, and the objective lens drive unit 56, which constitute the aberration correction unit 51.
- the main control unit 62 is electrically connected to the input / output control unit 91 of the information processing device 90.
- the main control unit 62 controls the detection unit 41, the correction ring drive unit 55, and the objective lens drive unit 56 according to the data input from the input / output control unit 91.
- the image generation unit 63 generates an image of the sample TP based on the light detection signal input from the detection unit 41.
- the image generation unit 63 outputs the image data of the generated sample TP to at least one of the evaluation value calculation unit 64 and the storage unit 68. For example, when the image generation unit 63 generates an image of the sample TP stored in the storage unit 68, the image generation unit 63 outputs the image data of the generated sample TP to the storage unit 68.
- the image generation unit 63 When the image generation unit 63 generates an image of the sample TP used in the processing by the evaluation value calculation unit 64, the image generation unit 63 outputs the image data of the generated sample TP to the evaluation value calculation unit 64.
- the evaluation value calculation unit 64 obtains the evaluation value v, which will be described in detail, based on the image data of the sample TP input from the image generation unit 63.
- the evaluation value calculation unit 64 outputs the data of the obtained evaluation value v to the storage unit 68.
- the correction ring position determination unit 65 obtains the optimum rotation position of the correction ring 28 based on the data of the evaluation value v stored in the storage unit 68.
- the correction ring position determination unit 65 outputs the obtained data of the optimum rotation position of the correction ring 28 to the storage unit 68 via the main control unit 62, and also outputs the data to the input / output control unit 91 of the information processing device 90. ..
- the optimum rotation position of the correction ring 28 may be referred to as an optimum correction ring position CP.
- the list creation unit 67 creates a parameter list related to the setting of the confocal microscope 10 based on the setting data table stored in the storage unit 68 and the input data input from the input / output control unit 91 of the information processing apparatus 90. To do.
- the list creation unit 67 outputs the created parameter list to the main control unit 62.
- the storage unit 68 is configured by using a memory such as a RAM, a hard disk, or the like. Various data input from each unit of the microscope control unit 61 are stored. For example, the storage unit 68 stores the image data of the sample TP input from the image generation unit 63. The storage unit 68 stores the data of the evaluation value v input from the evaluation value calculation unit 64.
- the storage unit 68 stores the setting data table.
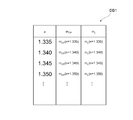
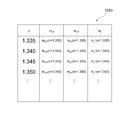
- the setting data table DB1 is data showing the relationship between the refractive index n of the sample TP, the CP-d change ratio m CP, and the L-d change ratio mL. It is a table.
- the CP-d change ratio m CP is the ratio between the amount of change in the observation depth d and the amount of change in the optimum correction ring position CP of the correction ring 28 due to the change in the observation depth d.
- the observation depth d is a depth position in the z direction from the lower end portion of the sample TP (the boundary portion between the cover glass CG and the sample TP) to the observation surface (see FIG. 2).
- the optimum correction ring position CP of the correction ring 28 means that the focal position PF of the objective lens 26 is at the observation depth d, the distance from the tip of the objective lens 26 to the cover glass CG, the thickness of the cover glass CG, and the observation.
- the relationship between the observation depth d and the optimum correction ring position CP when the refractive index of the sample TP is n1 can be represented by a straight line fCP n1 .
- the relationship between the observation depth d and the optimum correction ring position CP when the refractive index of the sample TP is n2 can be represented by a straight line fCP n2 .
- the CP-d change ratio m CP when the refractive index of the sample TP is n1 is obtained as the slope of the straight line fCP n1 .
- the CP-d change ratio m CP when the refractive index of the sample TP is n2 is obtained as the slope of the straight line fCP n2 , which is different from the slope of the straight line fCP n1 .
- the Ld change ratio mL is the ratio between the amount of change in the observation depth d and the amount of change in the position L of the objective lens 26 due to the change in the observation depth d.
- the position L of the objective lens 26 is a position of the objective lens 26 in the z direction with a predetermined reference position L0 as the origin position (see FIG. 2).
- the position of the objective lens 26 in the z direction can be detected, for example, by the amount of change from the reference position of the angle of the gear that drives the objective lens 26 in the z direction.
- the reason for obtaining the Ld change ratio mL is that the amount of change in the observation depth d and the amount of change in the position L of the objective lens 26 are different because there is a difference in the refractive index between the sample TP and the immersion IM. Because. For example, as shown in FIG. 7, the displacement amount when the position of the objective lens 26 is displaced from the L i to L i + 1 (L i + 1 -L i) , the focal position PF of the objective lens 26 in correspondence with the displacement observation It becomes different displacement amount when displaced to a position of the observation depth d i + 1 from the position of depth d i (d i + 1 -d i).
- the relationship between the observation depth d and the position L of the objective lens 26 when the refractive index of the sample TP is n1 can be represented by a straight line fL n1 .
- the relationship between the observation depth d and the position L of the objective lens 26 when the refractive index of the sample TP is n2 can be represented by a straight line fL n2 .
- L-d variation ratio m L in the case of the refractive index of the sample TP is n1 is determined as the slope of the straight line fL n1.
- L-d variation ratio m L when the refractive index n is n2 of the sample TP is determined as the slope of the different linear fL n2 is the slope of the line fL n1.
- the setting data table DB1 by obtaining the CP-d change ratio m CP and the L-d change ratio mL for a plurality of sample refractive indexes by performing an optical simulation in advance.
- the Ld change ratio mL is obtained by performing an optical simulation.
- the refractive index of the sample, the refractive index of the immersion liquid, the thickness of the cover glass, the observation depth d in the sample TP, and the like are set, and for example, the Strail ratio of the PSF (point image distribution function) is calculated to obtain the objective.
- the position L of the objective lens 26 when the focal position PF of the lens 26 is at the position of the observation depth d is obtained.
- the CP-d change ratio m CP is obtained by performing an optical simulation.
- the sample refractive index, the immersion refractive index, the thickness of the cover glass, the observation depth d in the sample TP, and the objective lens 26 when the focal position PF of the objective lens 26 is at the observation depth d are set, and the rotation position (optimal correction ring position CP) of the correction ring 28 in which the imaging state at this time is the best is obtained.
- the position L of the objective lens 26 when the focal position PF of the objective lens 26 is at the position of the observation depth d is calculated using the ld change ratio mL .
- a PSF (point image distribution function) stray ratio can be used as an index indicating the imaging state.
- a plot of the optimum correction ring position CP of the correction ring 28 with respect to the observation depth d is created.
- the created plot is fitted with, for example, a straight line, and the CP-d change ratio m CP is obtained.
- the information processing device 90 has an input / output control unit 91.
- the information processing device 90 is electrically connected to the input unit 92 and the display unit 93.
- the input unit 92 is an input interface that can be operated by the user.
- the input unit 92 includes, for example, at least one of a mouse, a keyboard, a touch pad, a trackball, and the like.
- the input unit 92 detects an operation by the user and outputs the detection result to the input / output control unit 91 of the information processing device 90 as input data input by the user.
- the display unit 93 is, for example, a liquid crystal display or the like.
- the input / output control unit 91 of the information processing device 90 includes a GUI (graphical user interface) required for operating the confocal microscope 10, an image of the sample TP output from the microscope control unit 61 of the confocal microscope 10, and a correction ring.
- the optimum correction ring position CP and the like of 28 are displayed on the display unit 93.
- the input / output control unit 91 outputs the input data input from the input unit 92 to the microscope control unit 61 of the confocal microscope 10.
- an image acquisition method a control method of the microscope device 1 for acquiring an image of the sample TP (hereinafter referred to as an image acquisition method) will be described.
- the image acquisition method according to the first embodiment first, the position L of the objective lens 26 when the focal position PF of the objective lens 26 is located at a certain observation depth d is obtained.
- the optimum correction ring position CP of the correction ring 28 at the observation depth d is experimentally obtained.
- the optimum correction ring position CP of the correction ring 28 at another observation depth d is obtained based on the refractive index of the sample TP input by the user's operation, not experimentally.
- the image acquisition method according to the first embodiment a case where the focal position PF of the objective lens 26 does not change even if the correction ring 28 is rotated to change the spherical aberration of the objective lens 26 will be described.
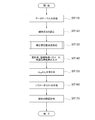
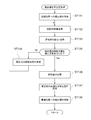
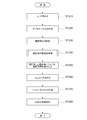
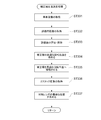
- FIG. 4 is a flowchart showing an image acquisition method according to the first embodiment.
- the microscope control unit 61 includes, for example, a computer system.
- the microscope control unit 61 reads out the control program stored in the storage unit 68 and executes various processes according to the control program.
- the setting data table DB1 is created and stored in the storage unit 68.
- the setting data table DB1 is created by obtaining the CP-d change ratio m CP and the L-d change ratio mL for a plurality of refractive indexes by performing an optical simulation in advance.
- step ST120 to set the position of the observation depth d S and observation region ROI to determine the optimum correction ring position CP of the corrector ring 28 experimentally.
- the user uses the GUI displayed on the display unit 93 to input the position L of the objective lens 26 to the input unit 92 while viewing the image TI of the sample. And set the observation depth d S.
- the user uses the GUI displayed on the display unit 93 to input the x-direction position and the y-direction position of the observation area ROI (stage 11) to the input unit 92 while viewing the image TI of the sample. And set the observation area ROI.
- the input unit 92 When the user performs an operation of inputting the position L of the objective lens 26 or an operation of inputting the x-direction position and the y-direction position of the observation area ROI (stage 11) to the input unit 92, the input unit 92 performs these operations.
- the input data corresponding to the above operation is output to the microscope control unit 61 of the confocal microscope 10 via the input / output control unit 91 of the information processing device 90.
- FIG. 8B shows a state in which the focal position PF of the objective lens 26 is at the position of the observation depth d S for which the optimum correction ring position CP of the correction ring 28 is experimentally obtained.
- the observation depth d S is an objective.
- focus position PF of the lens 26 is set by the position L S of the objective lens 26 when in the position of the observation depth d S.
- the relative observation depth in which the value at the observation depth d S is 0 may be referred to as the relative observation depth dr.
- Determining the optimum correction ring position CP of the corrector ring 28 experimentally, location L S and the objective lens 26, x-direction position and the y-direction position of the observation region ROI (stage 11) is not limited to manual, the image of the signal strength It may be set automatically on the condition that (luminance value) or high contrast is high.
- step ST130 the microscope control unit 61, the depth d S observations set in step ST120, determining the optimum correction ring position CP S correction ring 28.
- the input unit 92 receives the input data corresponding to this operation. Is output to the microscope control unit 61 of the confocal microscope 10 via the input / output control unit 91 of the information processing device 90. Then, in and observation region ROI (position L S of the objective lens 26) observed depth d S set in step ST120, the correction ring position determination process for determining the optimum correction ring position CP S corrector ring 28 is started.
- ROI position L S of the objective lens 26
- FIG. 11 is a flowchart showing the details of the correction ring position determination process according to the first embodiment.
- the main control unit 62 of the microscope control unit 61 transmits a control signal to the correction ring drive unit 55, and the correction ring drive unit 55 that receives the control signal puts the correction ring 28 in the rotation position in the initial state ( Hereinafter, it is rotationally moved to the initial correction ring position CB). Since the aberration correction lens 27 moves along the optical axis AX of the objective lens 26 in accordance with the rotation of the correction ring 28, the rotation position C of the correction ring 28 is on the optical axis AX of the objective lens 26 of the aberration correction lens 27. Corresponds to the position of.
- the microscope control unit 61 acquires the image of the sample TP once or a plurality of times.
- the microscope control unit 61 emits laser light (excitation light) from the light source unit 16. Further, the main control unit 62 of the microscope control unit 61 transmits a control signal to the detection unit 41, and the detection unit 41 that has received the control signal transmits the light (fluorescence) detection signal from the sample TP to the microscope control unit 61. Is output to the image generation unit 63 of.
- the image generation unit 63 performs a process of arranging the light detection signals (data for one pixel described above) input from the detection unit 41 in synchronization with the two-dimensional scanning by the scanner 25, thereby arranging the image of the sample TP. To generate.
- the image generation unit 63 outputs the image data of the generated sample TP to the evaluation value calculation unit 64.
- step ST133 the evaluation value calculation unit 64 of the microscope control unit 61 obtains the evaluation value v based on the image data of the sample TP generated in step ST132.
- the evaluation value calculation unit 64 stores the data of the obtained evaluation value v and the data of the rotation position C of the correction ring 28 at this time (when this process is executed for the first time, the initial correction ring position CB) in the storage unit 68. Hold.
- the evaluation value v for example, the contrast of the image, the integrated value of the signal intensity (luminance) of the image, the integrated value of the frequency component obtained by Fourier transforming the signal intensity of the image in a predetermined frequency domain, or the like can be used. .. Moreover, you may use the correlation value between images acquired a plurality of times under the same condition.
- step ST134 the main control unit 62 of the microscope control unit 61 determines whether or not the rotation position C of the correction ring 28 has been changed a predetermined number of times.
- step ST134: No the process proceeds to step ST135.
- step ST135 the main control unit 62 transmits a control signal to the correction ring drive unit 55, and the correction ring drive unit 55 that has received the control signal rotates the correction ring 28 by a predetermined rotational movement amount, and steps. Return to ST132. Then, the processes from step ST132 to step ST134 are repeated.
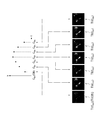
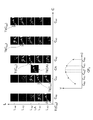
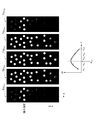
- FIG. 12 is a graph showing an example of the evaluation value v obtained by changing the rotation position C of the correction ring 28.
- the microscope control unit 61 first acquires the image TI (CB) of the sample at the initial correction ring position CB.
- the microscope control unit 61 acquires the image TI ( CB0 ) at the rotation position C B0 .
- the microscope control unit 61 acquires an image TI ( CB1 ) at the rotation position CB1 in which the correction ring 28 is rotationally moved from the initial correction ring position CB by the first rotation amount.
- the microscope control unit 61 acquires an image TI ( CB2 ) at the rotation position CB2 in which the correction ring 28 is rotationally moved from the initial correction ring position CB by a second rotation amount.
- the microscope control unit 61 acquires an image TI ( CB3 ) at the rotation position CB3 in which the correction ring 28 is rotationally moved from the initial correction ring position CB by a third rotation amount.
- the microscope control unit 61 acquires an image TI ( CB4 ) at the rotation position CB4 in which the correction ring 28 is rotationally moved from the initial correction ring position CB by a fourth rotation amount.
- the microscope control unit 61 acquires an image TI ( CB5 ) at the rotation position CB5 in which the correction ring 28 is rotationally moved from the initial correction ring position CB by a fifth rotation amount.
- the microscope control unit 61 acquires an image TI ( CB6 ) at the rotation position CB6 in which the correction ring 28 is rotationally moved from the initial correction ring position CB by a sixth rotation amount. That is, the microscope control unit 61 acquires the image TI at each of the rotation positions CB1 to CB6 in which the correction ring 28 is rotated and moved 6 times from the initial correction ring position CB.
- the evaluation value calculation unit 64 of the microscope control unit 61 rotationally moved the initial correction ring position CB and the correction ring 28 from the initial correction ring position CB by the first to sixth rotation amounts.
- the evaluation value v at the rotation positions C B1 to C B6 can be obtained.
- the initial correction ring position CB is set to the rotation position C B0 has been described as an example, but the present invention is not limited to this.
- the initial correction ring position CB may be the rotation position C B3 .
- step ST134 the correction ring position determination unit 65 of the microscope control unit 61 compares the evaluation values v at the plurality of rotation positions of the correction ring 28 stored in the storage unit 68, and the correction value v is maximized. The optimum rotation position of the ring 28 is obtained. After interpolation or function approximation is performed on the relationship between the evaluation value v and the rotation position C of the correction ring 28, the optimum rotation position of the correction ring 28 that maximizes the evaluation value v may be obtained.
- the correction ring position determination unit 65 outputs the obtained data of the optimum rotation position of the correction ring 28 to the main control unit 62, and proceeds to step ST137.
- step ST137 the main controller 62 of the microscope control unit 61, the data of the optimum rotational position of the correction ring 28 obtained in step ST136, as the data of the optimum correction ring position CP S experimentally determined, the storage unit 68 To memorize and hold.
- step ST138 the main control unit 62 transmits a control signal to the correction ring drive unit 55, and the correction ring drive unit 55 that has received this control signal finds the correction ring 28 in step ST136 and obtains the optimum correction ring position CP S. Rotate and move to. Then, the process proceeds to the next process (step ST140 in FIG. 4).
- step ST140 the refractive index of the sample TP, the image acquisition parameter, and the image acquisition range are input.
- the user uses the GUI (setting input screen) displayed on the display unit 93 to select and input the type of the sample TP as the refractive index n SA of the sample TP to the input unit 92. Do it against.
- cultured cells (1.35) are selectively input to “Sample type”, and in this case, the refractive index n SA is 1.35.
- the user can also select "manual input” and directly input the value of the refractive index n SA .
- the numerical value “1.36” is directly input, and in this case, the refractive index n SA is 1.36.
- the selection input of "sample type” is invalid.
- the user performs an operation of inputting an image acquisition parameter to the input unit 92 by using the GUI displayed on the display unit 93.
- the operations for inputting image acquisition parameters include laser power (power of light source 17), scan pitch (interval between scanning points in the sample TP scanned by the scanner 25), and number of scanning points (scanning points in the sample TP scanned by the scanner 25).
- the operation of inputting (the number of) is performed.
- the user uses the GUI displayed on the display unit 93 to perform an operation of inputting an image acquisition range on the input unit 92.
- As an operation for inputting the image acquisition range an operation of inputting the number of acquired z-stack images of the sample TP N, the upper end position L TP of the objective lens 26, and the lower end position L BM of the objective lens 26 is performed.
- the input unit 92 corresponds to these operations.
- the input data is output to the microscope control unit 61 of the confocal microscope 10 via the input / output control unit 91 of the information processing device 90.
- step ST150 the list creation unit 67 of the microscope control unit 61 refracts based on the setting data table DB1 (see FIG. 6) stored in the storage unit 68 and the refractive index n SA input in step ST140. determined by calculating the CP-d variation ratio m CP and L-d variation ratio m L corresponding to the rate n SA.
- the value of the refractive index that matches the refractive index n SA is not in the setting data table DB1, by performing interpolation on the values of the refractive index in the vicinity of the refractive index n SA in the setting data table DB1,
- the CP-d change ratio m CP and the L-d change ratio mL may be obtained.
- the CP-d change ratio m CP (n 1.335) and L corresponding to the refractive index 1.335 in the setting data table DB1. -D
- CP-d variation ratio m CP By interpolating with 1.340)
- the CP-d change ratio m CP when the refractive index n SA is 1.336 may be obtained.
- step ST160 a list creation unit 67 of the microscope control unit 61, a position L S of the objective lens 26 set in step ST120, and the optimum correction ring position CP S of the corrector ring 28 obtained in the step ST130, the input at step ST140
- the image acquisition range (the number of z-stack images of the sample TP acquired, the upper end position L TP of the objective lens 26, the lower end position L BM of the objective lens 26), the CP-d change ratio m CP obtained in step ST150, and the A parameter list relating to the setting of the confocal microscope 10 is created based on the ld change ratio mL . As shown in FIG.
- the parameter list LS1 includes a relative observation depth dr when acquiring a z-stack image of the sample TP, and an optimum correction ring position CP of the correction ring 28. , Is a list showing the relationship with the position L of the objective lens 26.
- the list creation unit 67 creates the parameter list LS1
- the list creation unit 67 outputs the data of the created parameter list LS1 to the main control unit 62.
- a parameter list LS1 To create a parameter list LS1, first, determine the position L i of the objective lens 26 to be displaced when acquiring z-stack images of the specimen TP.
- i is an integer from 1 to N (the number of acquired z-stack images of the sample TP N).
- Position L i of the objective lens 26 is determined using the equation (1) below.
- the relative observation depth dr i can be obtained by using the following equation (2).
- the optimum correction ring position CP i of the correction ring 28 corresponding to each relative observation depth dr i is obtained.
- the optimum correction ring position CP i of the correction ring 28 is obtained by using the following equation (3).
- step ST170 the microscope control unit 61 changes the optimum correction ring position CP of the correction ring 28 and the position L of the objective lens 26 according to the parameter list LS1 created in step ST160, thereby changing the z-stack image of the sample TP. To get.
- the parameter list LS1 when acquiring the z-stack image of the sample TP, each time an image of a cross section of the sample TP having a different position in the z direction (optical axis direction of the objective lens 26) is acquired, the parameter list LS1 is followed. , The optimum correction ring position CP of the correction ring 28 and the position L of the objective lens 26 can be changed. Therefore, optimum aberration correction can be performed each time an image of a cross section of a sample TP having a different position in the z direction (optical axis direction of the objective lens 26) is acquired.
- the thickness of the cover glass CG when actually acquiring the z-stack image of the sample TP may be different from the thickness of the cover glass CG set by the optical simulation when the setting data table DB1 is created. ..
- the optimum correction ring position CP S of the corrector ring 28 experimentally obtained in one certain viewing depth d S by so calculating the optimum correction ring position CP i of the correction ring 28 at the other observation depth position, the optimum correction ring position CP i of the correction ring 28, precisely than the case of calculating using only optical simulation Can be calculated.
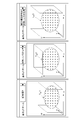
- the z-stack image of the sample TP by acquiring the z-stack image of the sample TP and then acquiring the z-stack image of the same sample TP in different observation regions, the z-stack image of the sample TP in a plurality of observation regions having different positions in the xy direction can be obtained. It is possible to perform tying side by side. Therefore, as a modification of the image acquisition method according to the first embodiment, a case where a z-stack image of the sample TP is acquired for tiling will be described.
- FIG. 13 is a flowchart showing an image acquisition method according to a modified example of the first embodiment. Since the processing of steps ST110 to ST140 is the same as the processing of steps ST110 to ST140 of FIG. 4, the description thereof will be omitted.
- step ST145 input the setting for tiling. At this time, the user performs an operation of inputting the number Mx of the observation areas arranged in the x direction and the number My of the observation areas arranged in the y direction to the input unit 92.
- step ST171 the main control unit 62 of the microscope control unit 61 determines whether or not the z-stack image of the sample TP has been acquired for all the observation regions set in step ST145.
- step ST171 the main control unit 62 determines that the z-stack image of the sample TP has not been acquired for all the observation regions (step ST171: No), the process proceeds to step ST172.
- step ST172 the main control unit 62 transmits a control signal to the stage drive unit 12, and the stage drive unit 12 that has received the control signal moves the stage 11 to a position corresponding to the next observation region in the xy direction.
- step ST171 the main control unit 62 transmits a control signal to the stage drive unit 12, and the stage drive unit 12 that has received the control signal moves the stage 11 to a position corresponding to the next observation region in the xy direction.
- the second embodiment will be described.
- the microscope device according to the second embodiment has the same configuration as the microscope device 1 according to the first embodiment, and the same configurations as those in the first embodiment described above will be described with appropriate reference numerals. Omit or simplify.
- the storage unit 68 (see FIG. 3) is added to the data table for setting, and stores the data of L-CP change ratio m LC.
- the focal position PF of the objective lens 26 may be displaced in the optical axis direction.
- the L-CP change ratio m LC is a ratio between the change amount ⁇ C of the rotation position of the correction ring 28 and the correction movement amount ⁇ L of the objective lens 26.
- the correction movement amount ⁇ L of the objective lens 26 is a change in the position L of the objective lens 26 required to return the focal position PF of the objective lens 26 displaced with the rotation of the correction ring 28 to the position of the observation depth d.
- the corrected movement amount ⁇ L of the objective lens 26 is obtained by using the following equation (4).
- the same setting data table DB1 (see FIG. 6) as in the first embodiment is used. Also in the second embodiment, the setting data table DB1 is created by obtaining the CP-d change ratio m CP and the L-d change ratio mL for a plurality of refractive indexes by performing an optical simulation in advance. Is possible.
- the rotation position C of the correction ring 28 and the position L of the objective lens 26 are two-dimensional at the observation depth d in a certain sample TP.
- the rotation position of the correction ring 28 and the position of the objective lens 26 in which the imaging state is the best are obtained.
- the focal position PF of the objective lens 26 is at the observation depth d
- the focal position PF of the objective lens 26 also changes.
- the optimum values are set for the two parameters of the rotation position C of the correction ring 28 and the position L of the objective lens 26. I need to ask.
- the PSF (point image distribution function) streak ratio can be used as an index representing the imaging state.
- a plot of the optimum correction ring position CP of the correction ring 28 with respect to the observation depth d is created. Then, the created plot is fitted with, for example, a straight line, and the CP-d change ratio m CP is obtained.
- the image acquisition method according to the second embodiment will be described.
- the focal position PF of the objective lens 26 changes. The case of doing so will be described.
- the correction movement amount ⁇ L of the objective lens 26 required to return the focal position PF of the objective lens 26 displaced with the rotation of the correction ring 28 to the position of the observation depth d is obtained.
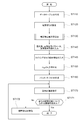
- FIG. 14 is a flowchart showing an image acquisition method according to the second embodiment.
- step ST210 and stores the data of the previously obtained L-CP variation ratio m LC in the storage unit 68.
- L-CP change ratio mLC it is possible to obtain the L-CP change ratio mLC by performing an optical simulation in advance or experimentally.
- step ST220 the setting data table DB1 is created and stored in the storage unit 68.
- the same setting data table as in the first embodiment Create DB1.
- step ST230 to set the position of the observation depth d S and observation region ROI to determine the optimum correction ring position CP of the corrector ring 28 experimentally.
- step ST230 the same processing as in step ST120 in the first embodiment is performed.
- step ST240 the microscope control unit 61, the depth d S observations set in step ST230, determining the optimum correction ring position CP S correction ring 28.
- step ST240 in the same manner as in step ST130 in the first embodiment, the correction ring position determination process for determining the optimum correction ring position CP S corrector ring 28 is started.
- FIG. 16 is a flowchart showing details of the correction ring position determination process according to the second embodiment.
- the main control unit 62 of the microscope control unit 61 transmits a control signal to the correction ring drive unit 55, and the correction ring drive unit 55 that receives the control signal puts the correction ring 28 in the rotation position in the initial state ( Rotate and move to the initial correction ring position CB).
- the main control unit 62 obtains the correction movement amount ⁇ L of the objective lens 26 according to the change amount ⁇ C of the rotation position of the correction ring 28 at this time by using the above equation (4).
- the main control unit 62 transmits a control signal to the objective lens drive unit 56, and the objective lens drive unit 56 that receives the control signal moves the objective lens 26 by the correction movement amount ⁇ L obtained by the main control unit 62. ..
- step ST242 the microscope control unit 61 acquires the image of the sample TP once or a plurality of times. In step ST242, the same processing as in step ST132 in the first embodiment is performed.
- step ST243 the evaluation value calculation unit 64 of the microscope control unit 61 obtains the evaluation value v based on the image data of the sample TP generated in step ST242.
- step ST243 the same processing as in step ST133 in the first embodiment is performed.
- step ST244 the main control unit 62 of the microscope control unit 61 determines whether or not the rotation position C of the correction ring 28 has been changed a predetermined number of times.
- step ST244: No the main control unit 62 determines that the rotation position C of the correction ring 28 has not been changed a predetermined number of times (step ST244: No)
- step ST245 the main control unit 62 transmits a control signal to the correction ring drive unit 55, and the correction ring drive unit 55 that has received the control signal rotates the correction ring 28 by a predetermined rotational movement amount.
- the main control unit 62 transmits a control signal to the objective lens drive unit 56, and the objective lens drive unit 56 that receives the control signal receives a predetermined rotational movement amount (change amount ⁇ C of the rotational position) of the correction ring 28.
- the objective lens 26 is moved by the correction movement amount ⁇ L according to the above, and the process returns to step ST242. Then, the processes from step ST242 to step ST244 are repeated.
- step ST244 If it is determined in step ST244 that the main control unit 62 has changed the rotation position C of the correction ring 28 a predetermined number of times (step ST244: Yes), the process proceeds to step ST246.
- step ST246 the correction ring position determination unit 65 of the microscope control unit 61 compares the evaluation values v at the plurality of rotation positions of the correction ring 28 stored in the storage unit 68, and the correction value v is maximized. The optimum rotation position of the ring 28 is obtained.
- the correction ring position determination unit 65 outputs the obtained data of the optimum rotation position of the correction ring 28 to the main control unit 62, and proceeds to step ST247.
- step ST247 the main controller 62 of the microscope control unit 61, the data of the optimum rotational position of the correction ring 28 obtained in step ST246, as the data of the optimum correction ring position CP S experimentally determined, the storage unit 68 To memorize and hold.
- step ST248 the main control unit 62 transmits a control signal to the correction ring drive unit 55, and the correction ring drive unit 55 that has received this control signal finds the correction ring 28 in step ST246 and obtains the optimum correction ring position CP S. Rotate and move to. Further, the main control unit 62 obtains the correction movement amount ⁇ L of the objective lens 26 according to the change amount ⁇ C of the rotation position of the correction ring 28 at this time by using the above equation (4).
- the main control unit 62 transmits a control signal to the objective lens drive unit 56, and the objective lens drive unit 56 that receives the control signal moves the objective lens 26 by the correction movement amount ⁇ L obtained by the main control unit 62. .. Then, the process proceeds to the next process (step ST250 in FIG. 14).
- step ST250 the refractive index of the sample TP, the image acquisition parameter, and the image acquisition range are input.
- step ST250 the same processing as in step ST140 in the first embodiment is performed.
- step ST260 the list creation unit 67 of the microscope control unit 61 refracts based on the setting data table DB1 (see FIG. 6) stored in the storage unit 68 and the refractive index n SA input in step ST250. determined by calculating the CP-d variation ratio m CP and L-d variation ratio m L corresponding to the rate n SA.
- the value of the refractive index that matches the refractive index n SA is not in the setting data table DB1, by performing interpolation on the values of the refractive index in the vicinity of the refractive index n SA in the setting data table DB1,
- the CP-d change ratio m CP and the L-d change ratio mL may be obtained.
- step ST270 a list creation unit 67 of the microscope control unit 61, a position L S of the objective lens 26 set in step ST230, and the optimum correction ring position CP S of the corrector ring 28 obtained in the step ST240, the input at step ST250
- the image acquisition range (the number of z-stack images of the sample TP acquired, the upper end position L TP of the objective lens 26, the lower end position L BM of the objective lens 26), and the CP-d change ratio m CP obtained in step ST260 and A parameter list relating to the setting of the confocal microscope 10 is created based on the ld change ratio mL . As shown in FIG.
- the parameter list LS2 includes a relative observation depth dr when acquiring a z-stack image of the sample TP, an optimum correction ring position CP of the correction ring 28, and a correction ring.
- 28 is a list showing the relationship between the position L C of the objective lens 26 to correct the displacement of the focus position PF of the objective lens 26 caused by the rotation of the.
- the position L Ci of the objective lens 26 corrected for the displacement of the focal position PF of the objective lens 26 due to the rotation of the correction ring 28 to each optimum correction ring position CP i is obtained.
- the position L Ci of the objective lens 26 corrected for the displacement of the focal position PF due to the rotation of the correction ring 28 is obtained by using the following equation (6).
- step ST280 the microscope control unit 61 corrects the optimum correction ring position CP of the correction ring 28 and the displacement of the focal position PF due to the rotation of the correction ring 28 according to the parameter list LS2 created in step ST270. by changing the position L C of acquiring the z-stack images of the specimen TP.
- the parameter list LS2 when acquiring the z-stack image of the sample TP, each time an image of a cross section of the sample TP having a different position in the z direction (optical axis direction of the objective lens 26) is acquired, the parameter list LS2 is followed. , the optimum correction ring position CP of the corrector ring 28, to correct the displacement of the focus position PF caused by the rotation of the correction ring 28, it is possible to change the position L C of the objective lens 26. Therefore, optimum aberration correction can be performed each time an image of a cross section of a sample TP having a different position in the z direction (optical axis direction of the objective lens 26) is acquired.
- the thickness of the cover glass CG when actually acquiring the z-stack image of the sample TP may be different from the thickness of the cover glass CG set by the optical simulation when the setting data table DB1 is created. ..
- the processing of steps ST210 to ST240 may be omitted, and the user may make a setting to change the observation area and then start from the processing of step ST250.
- the z-stack image of the same sample TP is acquired in different observation regions, thereby xy. It is possible to perform tying to arrange the z-stack images of the sample TP in a plurality of observation regions having different orientation positions.
- FIG. 17 is a block diagram showing an electrical connection between the microscope control unit 361 and the information processing device 90 according to the third embodiment.
- the microscope control unit 361 according to the third embodiment also functions as an aberration correction amount calculation determination unit, and obtains the optimum rotation position of the correction ring 28 and the optimum position of the objective lens 26.
- the microscope control unit 361 includes a main control unit 62, an image generation unit 63, an evaluation value calculation unit 64, a correction ring position determination unit 65, a z position calculation unit 366, a list creation unit 67, and a storage unit 68. Has.
- the image generation unit 63 generates an image of the sample TP based on the light detection signal input from the detection unit 41.
- the image generation unit 63 outputs the image data of the generated sample TP to at least one of the evaluation value calculation unit 64, the z position calculation unit 366, and the storage unit 68.
- the image generation unit 63 outputs the image data of the generated sample TP to the storage unit 68.
- the image generation unit 63 outputs the image data of the generated sample TP to the evaluation value calculation unit 64.
- the image generation unit 63 outputs the image data of the generated sample TP to the evaluation value calculation unit 64.
- the image generation unit 63 When the image generation unit 63 generates an image of the sample TP used in the processing by the z position calculation unit 366, the image generation unit 63 outputs the image data of the generated sample TP to the z position calculation unit 366.
- the z-position calculation unit 366 sets the optimum position of the objective lens 26 based on the z-stack image data for evaluation of the sample TP input from the image generation unit 63 and the reference image data of the sample TP stored in the storage unit 68. Ask for.
- the z-position calculation unit 366 outputs the obtained data of the optimum position of the objective lens 26 to the storage unit 68 via the main control unit 62.
- the optimum position of the objective lens 26 may be referred to as the optimum objective lens position LP.
- the storage unit 68 stores the setting data table and the reference image data of the sample TP.
- the reference image data of the sample TP is used when the z-position calculation unit 366 obtains the optimum objective lens position LP of the objective lens 26.
- the setting data table DB3 according to the third embodiment has the refractive index n of the sample TP, the CP-d change ratio m CP , the LP-d change ratio m LP , and L'-d. It is a data table which shows the relationship with the change ratio m L' .
- the CP-d change ratio m CP refers to the amount of change in the observation depth d and the optimum correction ring position CP of the correction ring 28 accompanying the change in the observation depth d, as described in the first embodiment. It is the ratio with the amount of change.
- the relationship between the observation depth d and the optimum correction ring position CP when the refractive index of the sample TP is n1 can be represented by a straight line fCP n1 .
- the relationship between the observation depth d and the optimum correction ring position CP when the refractive index of the sample TP is n2 can be represented by a straight line fCP n2 .
- the CP-d change ratio m CP when the refractive index of the sample TP is n1 is obtained as the slope of the straight line fCP n1 .
- the CP-d change ratio m CP when the refractive index of the sample TP is n2 is obtained as the slope of the straight line fCP n2 , which is different from the slope of the straight line fCP n1 .
- LP-d change ratio m LP is a ratio between the amount of change in the observation depth d and the amount of change in the optimum objective lens position LP of the objective lens 26 with the change in the observation depth d.
- the optimum objective lens position LP of the objective lens 26 is the optimum position of the objective lens 26 corrected for the displacement of the focal position PF due to the rotation of the correction ring 28 (see FIG. 21).
- the relationship between the observation depth d and the optimum objective lens position LP of the objective lens 26 when the refractive index of the sample TP is n1 can be represented by a straight line fLP n1 .
- the relationship between the observation depth d and the optimum objective lens position LP of the objective lens 26 when the refractive index of the sample TP is n2 can be represented by a straight line fLP n2 .
- the LP-d change ratio m LP when the refractive index of the sample TP is n1 is obtained as the slope of the straight line fLP n1 .
- the LP ⁇ d change ratio m LP when the refractive index n of the sample TP is n2 is obtained as the slope of the straight line fLP n2 which is different from the slope of the straight line fLP n1 .
- L'-d variation ratio m L ' refers to the amount of change in the observation depth d, the position L of the objective lens 26 due to the change of the viewing depth d' which is the ratio of the amount of change.
- the position L'of the objective lens 26 is the position of the objective lens 26 when the focal position PF of the objective lens 26 is at the position of the observation depth d, assuming that the rotation position C of the correction ring 28 is constant. Is.
- the position L of the observation depth d and the objective lens 26 when the refractive index of the sample TP is n1 'relationship with linear fL' can be represented by n1.
- Position L of the observation depth d and the objective lens 26 in the case of the refractive index of the sample TP is n2 'relationship with linear fL' can be represented by n2.
- the L' ⁇ d change ratio mL ′ when the refractive index of the sample TP is n1 is obtained as the slope of the straight line fL ′ n1 .
- L'-d variation ratio in the case where the refractive index n is n2 samples TP m L 'is straight fL' determined as the slope of the different linear fL 'n2 is the slope of n1.
- Displacement of the objective lens 26 when the rotational position of the correction ring 28 is displaced (L i + 1 -L i) the displacement amount of the objective lens 26 when the rotation position of the correction ring 28 is constant (L 'i + 1 -L ' I ) is different.
- the plurality of refractive index by obtaining the CP-d variation ratio m CP, LP-d variation ratio m LP, and L'-d variation ratio m L ', data table for setting It is possible to create DB3.
- the CP-d change ratio m CP and the LP-d change ratio m LP are obtained by performing an optical simulation.
- the rotation position and the position of the objective lens 26 are obtained.
- the refractive index of the sample the refractive index of the immersion liquid, the thickness of the cover glass, the observation depth d in the sample TP, and the like are set, and the rotation position (optimal correction ring position) of the correction ring 28 in which the imaging state is the best is set.
- the positions of the CP) and the objective lens 26 are obtained.
- the PSF (point image distribution function) streak ratio can be used as an index representing the imaging state.
- a plot of the optimum correction ring position CP of the correction ring 28 with respect to the observation depth d is created. Then, the created plot is fitted with, for example, a straight line, and the CP-d change ratio m CP is obtained. Further, by obtaining the optimum objective lens position LP of the objective lens 26 for the plurality of observation depths d, a plot of the optimum objective lens position LP of the objective lens 26 with respect to the observation depth d is created. Then, the created plot is fitted with, for example, a straight line, and the LP-d change ratio m LP is obtained.
- the sample refractive index, the immersion refractive index, the thickness of the cover glass, the observation depth d in the sample TP, etc. are set, the correction ring 28 is fixed at an arbitrary fixed rotation position CCST , and the objective lens 26
- the position L'of the objective lens 26 in which the imaging state is the best is obtained by a one-dimensional parameter for the position L.
- the PSF (point image distribution function) streak ratio can be used as an index representing the imaging state.
- a plot of the position L'of the objective lens 26 with respect to the observation depth d is created.
- the image acquisition method according to the third embodiment will be described.
- the position L of the objective lens 26 when the focal position PF of the objective lens 26 is located at a certain observation depth d is obtained.
- the optimum correction ring position CP of the correction ring 28 and the optimum objective lens position LP of the objective lens 26 at the observation depth d are experimentally obtained.
- the optimum correction ring position CP of the correction ring 28 and the optimum objective lens position LP of the objective lens 26 at another observation depth d are based on the refractive index of the sample TP input by the user's operation, not experimentally.
- FIG. 18 is a flowchart showing an image acquisition method according to the third embodiment.
- the microscope control unit 361 includes, for example, a computer system.
- the microscope control unit 361 reads out the control program stored in the storage unit 68, and executes various processes according to the control program.
- the setting data table DB3 is created and stored in the storage unit 68. As described above, in advance, by performing an optical simulation for a plurality of refractive index, by obtaining the CP-d variation ratio m CP, LP-d variation ratio m LP, and L'-d variation ratio m L ' , Create the setting data table DB3.
- step ST 320 to set the optimum correction ring position CP and the position of the observation depth d S and observation region ROI that the optimum objective lens position LP of the objective lens 26 determined experimentally correction ring 28.
- step ST320 the same processing as in step ST120 in the first embodiment is performed.
- step ST330 the microscope control unit 361 obtains the optimum correction ring position CP S of the correction ring 28 and the optimum objective lens position LP S of the objective lens 26 at the observation depth d S set in step ST320.
- step ST330 in the same manner as in step ST130 in the first embodiment, the correction ring position determination process for obtaining the optimum objective lens position LP S of the optimum correction ring position CP S and the objective lens 26 in the correction ring 28 is started To.
- FIG. 23 is a flowchart showing the details of the correction ring position determination process according to the third embodiment.
- the microscope control unit 361 acquires an image of a sample TP of the position L S of the rotational position and the objective lens 26 in the correction ring 28 at the time of setting the observation depth d S.
- the image of the sample TP acquired in this step ST331 is used as the reference image of the sample TP.
- the rotational position of the correction ring 28 at the time of setting the observation depth d S a reference correction ring position CA, it may be referred to the position L S of the objective lens 26 and the standard objective lens position LA.
- the microscope control unit 361 emits laser light (excitation light) from the light source unit 16. Further, the main control unit 62 of the microscope control unit 361 transmits a control signal to the detection unit 41, and the detection unit 41 that receives the control signal transmits the light (fluorescence) detection signal from the sample TP to the microscope control unit 361. Is output to the image generation unit 63 of.
- the image generation unit 63 performs a process of arranging the light detection signals (data for one pixel described above) input from the detection unit 41 in synchronization with the two-dimensional scanning by the scanner 25 to reference the sample TP. Generate an image.
- the image generation unit 63 outputs the reference image data of the generated sample TP to the storage unit 68.
- step ST332 the microscope control unit 361 rotates the correction ring 28 to the rotation position in the initial state, and moves the objective lens 26 to the position in the initial state in the z direction.
- the rotational position of the correction ring 28 in the initial state may be referred to as the correction ring position CA0 in the initial state
- the position of the objective lens 26 in the initial state may be referred to as the objective lens position LA0 in the initial state.
- the microscope control unit 361 changes the rotational position of the correction ring 28 from the correction ring position CA0 in the initial state by a predetermined rotational movement amount, and changes the position of the objective lens 26 from the objective lens position LA0 in the initial state to a predetermined position.
- the main control unit 62 of the microscope control unit 361 transmits a control signal to the correction ring drive unit 55, and the correction ring drive unit 55 that receives the control signal sets the correction ring 28 to the correction ring position C in the initial state. It is rotationally moved from A0 by a predetermined rotational movement amount.
- the main control unit 62 transmits a control signal to the objective lens drive unit 56, and the objective lens drive unit 56 that receives the control signal z moves the objective lens 26 from the objective lens position LA0 in the initial state by a predetermined amount of movement. Move in the direction.
- the microscope control unit 361 emits laser light (excitation light) from the light source unit 16.
- the main control unit 62 of the microscope control unit 361 transmits a control signal to the detection unit 41, and the detection unit 41 that receives the control signal transmits the light (fluorescence) detection signal from the sample TP to the microscope control unit 361. Is output to the image generation unit 63 of.
- the image generation unit 63 evaluates the sample TP by performing a process of arranging the light detection signals (data for one pixel described above) input from the detection unit 41 in synchronization with the two-dimensional scanning by the scanner 25. Generate an image for.
- the image generation unit 63 outputs the evaluation image data of the generated sample TP to the evaluation value calculation unit 64.
- the evaluation value calculation unit 64 of the microscope control unit 361 correlates the reference image data of the sample TP stored in the storage unit 68 with the plurality of types of evaluation image data of the sample TP generated in step ST332. To be calculated respectively.
- the evaluation value calculation unit 64 sets the evaluation image at the position of the objective lens 26 having the maximum correlation value among the evaluation images of the sample TP having the same rotation position of the correction ring 28 but different positions of the objective lens 26. It is selected as an evaluation image at each rotation position of the correction ring 28.
- the evaluation value calculation unit 64 obtains the evaluation value v for each rotation position of the correction ring 28 based on the evaluation image data of the selected sample TP.
- the evaluation value calculation unit 64 stores and holds the data of the obtained evaluation value v and the data of the rotation position C of the correction ring 28 at this time in the storage unit 68.
- As the evaluation value v the same evaluation value as in the first embodiment can be used.
- FIG. 24 is a graph showing an example of the evaluation value v obtained by changing the rotation position C of the correction ring 28.
- the microscope control unit 361 sets the reference image TI (CA) of the sample TP. ) To get.
- the microscope control unit 361 sets the position of the objective lens 26 to the objective in the initial state at the correction ring position CA0 in the initial state in which the correction ring 28 is rotationally moved from the reference correction ring position CA by a predetermined initial rotation amount.
- An evaluation image of the sample TP displaced to the lens position LA0 and the four positions LA1 to LA4 is acquired.
- the evaluation value calculation unit 64 displays the evaluation image at the objective lens position LA0 in the initial state where the correlation value is maximum, which is indicated by the first ⁇ mark from the left side in FIG. 24. It is selected as the evaluation image TI ( CA0 ) at the correction ring position CA0 in the initial state.
- Microscope control unit 361 the correction ring 28 in the initial state correction ring position C A0 from the rotational position C A1 rotated moved first rotation amount, the objective lens position L A0 and the initial state the position of the objective lens 26
- An evaluation image of the sample TP displaced to the four positions LA1 to LA4 is acquired.
- the evaluation value calculation unit 64 corrects the evaluation image at the position LA1 of the objective lens 26 having the maximum correlation value, which is indicated by the second ⁇ mark from the left side in FIG. 24, among these evaluation images. It is selected as the evaluation image TI ( CA1 ) at the rotation position CA1 of the ring 28.
- the microscope control unit 361 sets the position of the objective lens 26 to the objective lens position LA0 in the initial state at the rotation position CA2 in which the correction ring 28 is rotationally moved from the correction ring position CA0 in the initial state by a second rotation amount.
- An evaluation image of the sample TP displaced to the four positions LA1 to LA4 is acquired.
- the evaluation value calculation unit 64 corrects the evaluation image at the position LA2 of the objective lens 26 having the maximum correlation value, which is indicated by the third ⁇ mark from the left side in FIG. 24, among these evaluation images. It is selected as the evaluation image TI ( CA2 ) at the rotation position CA2 of the ring 28.
- Microscope control unit 361 the correction ring position C A0 from the rotational position C A3 rotated moved by the third rotation amount of the correction ring 28 initially, an objective lens position L A0 and the initial state the position of the objective lens 26
- An evaluation image of the sample TP displaced to the four positions LA1 to LA4 is acquired.
- the evaluation value calculation unit 64 corrects the evaluation image at the position LA3 of the objective lens 26 having the maximum correlation value, which is indicated by the fourth ⁇ mark from the left side of FIG. 24, among these evaluation images. It is selected as the evaluation image TI ( CA3 ) at the rotation position CA3 of the ring 28.
- Microscope control unit 361 the correction ring position C A0 from the rotational position C A4 rotated moved fourth rotation amount of the correction ring 28 the initial state, the objective lens position L A0 and the initial state the position of the objective lens 26
- An evaluation image of the sample TP displaced to the four positions LA1 to LA4 is acquired.
- the evaluation value calculation unit 64 corrects the evaluation image at the position LA4 of the objective lens 26 having the maximum correlation value, which is indicated by the fifth ⁇ mark from the left side of FIG. 24, among these evaluation images. It is selected as the evaluation image TI ( CA4 ) at the rotation position CA4 of the ring 28.
- Evaluation value calculation unit 64 based on the evaluation image data selected, the correction ring position C A0 and the initial state, the rotation is moved by one to four times from the correction ring position C A0 in the initial state position C A1 ⁇ C
- the evaluation value v in A4 can be obtained.
- the correction ring position determination unit 65 of the microscope control unit 361 determines the optimum correction ring position CP of the correction ring 28 based on the evaluation values v at the plurality of rotation positions of the correction ring 28 stored in the storage unit 68. Find S. Specifically, the correction ring position determination unit 65 creates a plot of the evaluation value v for a plurality of rotation positions of the correction ring 28. The correction ring position determination unit 65, as shown in FIG. 24, by performing interpolation or function approximation for this plot to determine the optimum correction ring position CP S correction ring 28 evaluation value v is maximum ..
- Correction ring position determination unit 65 the data of the optimum correction ring position CP S of the corrector ring 28 thus determined is output to the main control unit 62.
- interpolation for example, a method of the Lagrange interpolation or spline interpolation to plot the evaluation value v for a plurality of rotational positions C A0 ⁇ C A4 of the correction ring 28.
- function approximation for example, by the least squares method, there is a method of fitting a plot of evaluation values v for a plurality of rotational positions C A0 ⁇ C A4 corrector ring 28 to a quadratic curve or a Gaussian function.
- step ST335 the main control unit 62 of the microscope control unit 361 transmits a control signal to the correction ring drive unit 55, and the correction ring drive unit 55 that receives this control signal optimizes the correction ring 28 obtained in step ST334. rotating movement to the correction ring position CP S.
- step ST-336 the microscope control unit 361, in a state where the corrector ring 28 is rotated and moved to the optimum correction ring position CP S, changing the position L of the objective lens 26, to obtain a z-stack images for evaluation of the sample TP.
- the main control unit 62 of the microscope control unit 361 transmits a control signal to the objective lens drive unit 56, and the objective lens drive unit 56 that receives the control signal moves the objective lens 26 in the z direction.
- the microscope control unit 361 emits laser light (excitation light) from the light source unit 16.
- the main control unit 62 of the microscope control unit 361 transmits a control signal to the detection unit 41, and the detection unit 41 that receives the control signal transmits the light (fluorescence) detection signal from the sample TP to the microscope control unit 361. Is output to the image generation unit 63 of.
- the image generation unit 63 evaluates the sample TP by performing a process of arranging the light detection signals (data for one pixel described above) input from the detection unit 41 in synchronization with the two-dimensional scanning by the scanner 25. Generate a z-stack image for.
- the image generation unit 63 outputs the z-stack image data for evaluation of the generated sample TP to the z-position calculation unit 366.
- the z position calculation unit 366 of the microscope control unit 361 determines the correlation value between the reference image data of the sample TP stored in the storage unit 68 and the z-stack image data for evaluation of the sample TP generated in step ST336. Ask for each. z position calculating unit 366, among the evaluation z stack image of a sample TP, the position of the objective lens 26 which is an image where the correlation value is maximized is obtained, determined as the optimum position of the objective lens LP S.
- the z-position calculation unit 366 may create a plot of correlation values for a plurality of positions of the objective lens 26. Then, z position calculation unit 366, by performing interpolation or function approximation to this plot, the position of the objective lens 26 at which the correlation value is maximized, may be obtained as the optimum position of the objective lens LP S.
- the z position calculating unit 366 the data of the optimum position of the objective lens LP S of the objective lens 26 determined, and outputs to the main control unit 62.
- step ST340 the refractive index of the sample TP, the image acquisition parameter, and the image acquisition range are input.
- step ST340 the same processing as in step ST140 in the first embodiment is performed.
- step ST350 the list creation unit 67 of the microscope control unit 361 refracts based on the setting data table DB3 (see FIG. 20) stored in the storage unit 68 and the refractive index n SA input in step ST340. corresponding to the rate n SA, determined by calculating CP-d variation ratio m CP, LP-d variation ratio m LP, and the L'-d variation ratio m L '.
- the value of the refractive index that matches the refractive index n SA is not in the setting data table DB3, by performing interpolation on the values of the refractive index in the vicinity of the refractive index n SA in the setting data table DB3,
- the CP-d change ratio m CP , the LP-d change ratio m LP , and the L'-d change ratio mL may be obtained.
- step ST360 a list creation unit 67 of the microscope control unit 361, a position L S of the objective lens 26 set in step ST 320, the optimum correction ring position CP S and the objective lens 26 of the corrector ring 28 obtained in step ST330 optimum
- the objective lens position LP S the image acquisition range input in step ST340 (the number of acquired z-stack images of the sample TP N, the upper end position L TP of the objective lens 26, the lower end position L BM of the objective lens 26), and step ST350.
- the parameter list LS3 includes the relative observation depth dr when acquiring the z-stack image of the sample TP, the optimum correction ring position CP of the correction ring 28, and the objective lens. It is a list which shows the relationship with the optimal objective lens position LP of 26.
- the list creation unit 67 creates the parameter list LS3
- the list creation unit 67 outputs the data of the created parameter list LS3 to the main control unit 62.
- the lower end depth dr BM of the relative observation depth and the upper end depth dr TP of the relative observation depth when acquiring the z-stack image of the sample TP are obtained.
- the lower end depth dr BM of the relative observation depth is obtained by using the following equation (7).
- the upper end depth dr TP of the relative observation depth can be obtained by using the following formula (8) in the same manner as the above formula (7).
- the relative observation depth dr i to be changed when the z-stack image of the sample TP is acquired is obtained.
- i is an integer from 1 to N (the number of acquired z-stack images of the sample TP N).
- the relative observation depth dr i (the relative observation depth position of the i-th acquired image) is obtained by using the following equation (9).
- the equation (9) in order to obtain the i-th relative observation depth, the lower end depth dr BM of the relative observation depth is multiplied by the z-stack image acquisition step width and the image acquisition index (i-1). Add.
- the optimum correction ring position CP i of the correction ring 28 and the optimum objective lens position LP i of the objective lens 26 corresponding to each relative observation depth dr i are obtained.
- the optimum correction ring position CP i of the correction ring 28 is obtained by using the following equation (10).
- the optimum objective lens position LP i of the objective lens 26 is obtained by using the following equation (11).
- the relative observation depth dr i obtained by using the above equations (7) to (11), the optimum correction ring position CP i of the correction ring 28, and the optimum objective lens position LP i of the objective lens 26 Create a list showing the relationships.
- the parameter list LS3 as shown in FIG. 25 can be created.
- step ST370 the microscope control unit 361 changes the optimum correction ring position CP of the correction ring 28 and the optimum objective lens position LP of the objective lens 26 according to the parameter list LS3 created in step ST360 to obtain the sample TP. Get the z-stack image.
- step ST380 the microscope control unit 361 outputs the z-stack image data of the sample TP acquired in step ST370 to the input / output control unit 91 of the information processing apparatus 90.
- the input / output control unit 91 generates a three-dimensional image of the sample TP based on the z-stack image data input from the microscope control unit 361, and displays it on the display unit 93.
- the three-dimensional image of the sample TP displayed on the display unit 93 may be simply referred to as a three-dimensional image T 3D 1 to T 3D 3 (see FIG. 26).
- the input / output control unit 91 can selectively switch to any one of the three types of three-dimensional images T 3D 1 to T 3D 3 and display it on the display unit 93. is there.
- the first three-dimensional image T 3D 1 is a three-dimensional image of the sample TP in which the coordinate axes in the z direction are the coordinate axes corresponding to the relative observation depth dr i .
- the input unit 92 corresponds to this operation.
- the input data to be input is output to the input / output control unit 91 of the information processing apparatus 90.
- the input / output control unit 91 causes the display unit 93 to display the first three-dimensional image T 3D 1.
- the second three-dimensional image T 3D 2 is a three-dimensional image of the sample TP whose coordinate axis in the z direction is the coordinate axis corresponding to the optimum objective lens position LP i of the objective lens 26.
- the input unit 92 outputs the input data corresponding to this operation. Is output to the input / output control unit 91 of the information processing device 90. Then, the input / output control unit 91 causes the display unit 93 to display the second three-dimensional image T 3D 2.
- the third three-dimensional image T 3D 3 is a three-dimensional image of the sample TP whose coordinate axis in the z direction is the coordinate axis corresponding to the position L' i of the objective lens 26.
- the input unit 92 performs this operation.
- the corresponding input data is output to the input / output control unit 91 of the information processing device 90.
- the input / output control unit 91 causes the display unit 93 to display the third three-dimensional image T 3D 3.
- the position L' i of the objective lens 26 can be obtained, for example, by using the following equation (12).
- the parameter list LS3 when acquiring the z-stack image of the sample TP, each time an image of a cross section of the sample TP having a different position in the z direction (optical axis direction of the objective lens 26) is acquired, the parameter list LS3 is followed.
- the optimum correction ring position CP of the correction ring 28 and the optimum objective lens position LP of the objective lens 26 corrected for the displacement of the focal position PF due to the rotation of the correction ring 28 can be changed. Therefore, optimum aberration correction can be performed each time an image of a cross section of a sample TP having a different position in the z direction (optical axis direction of the objective lens 26) is acquired.
- the list creation section 67, the optimum position of the objective lens of the optimum correction ring position CP S and the objective lens 26 of the corrector ring locator certain one observation depth by 65, etc. d S in experimentally determined correction collar 28 Based on the LP S , the refractive index n SA of the sample TP input from the input unit 92, and the setting data table DB 3, the optimum correction ring position CP i of the correction ring 28 constituting the parameter list LS 3 and the correction
- the optimum objective lens position LP of the objective lens 26 obtained by correcting the displacement of the focal position PF due to the rotation of the ring 28 is obtained.
- the thickness of the cover glass CG when actually acquiring the z-stack image of the sample TP may be different from the thickness of the cover glass CG set by the optical simulation when the setting data table DB3 is created. ..
- the optimum correction ring position CP S of the corrector ring 28 experimentally obtained in one certain viewing depth d S by so calculating the optimum correction ring position CP i of the correction ring 28 at the other observation depth position, the optimum correction ring position CP i of the correction ring 28, precisely than the case of calculating using only optical simulation Can be calculated.
- the processing of steps ST310 to ST330 may be omitted, and the user may make a setting to change the observation area and then start from the processing of step ST340.
- the z-stack image of the same sample TP is acquired in different observation regions, thereby xy. It is possible to perform tying to arrange the z-stack images of the sample TP in a plurality of observation regions having different orientation positions.
- the input / output control unit 91 of the information processing device 90 selectively switches to any one of the three types of three-dimensional images T 3D 1 to T 3D 3 and displays the display unit 93. It is possible to display it, but it is not limited to this.
- the input / output control unit 91 selectively switches to one of two types of three-dimensional images T 3D 1 to T 3D 2 and displays them without using the third three-dimensional image T 3D 3. It may be displayed in the unit 93.
- the evaluation value calculation unit 64 of the microscope control unit 361 has the evaluation image of the sample TP in which the rotation position of the correction ring 28 is the same but the position of the objective lens 26 is different. Among them, the evaluation image at the position of the objective lens 26 having the maximum correlation value is selected as the evaluation image at each rotation position of the correction ring 28. Then, the evaluation value calculation unit 64 obtains the evaluation value v for each rotation position of the correction ring 28 based on the evaluation image data of the selected sample TP.
- evaluation images at a plurality of rotation positions of the correction ring 28 are selected in the same manner as in the third embodiment described above, and based on the selected evaluation image data. Therefore, it is possible to obtain the evaluation value v.
- the microscope device according to the fourth embodiment has the same configuration as the microscope device according to the third embodiment, and the same reference numerals are appropriately provided to the same configurations as those of the first embodiment and the third embodiment described above. The explanation is omitted or simplified.
- FIG. 27 is a flowchart showing an image acquisition method according to the fourth embodiment.
- step ST401 the setting data table DB3 is created and stored in the storage unit 68.
- step ST401 the same processing as in step ST310 in the third embodiment is performed.
- step ST 402 to set the optimum correction ring position CP and the position of the observation depth d S and observation region ROI that the optimum objective lens position LP of the objective lens 26 determined experimentally correction ring 28.
- step ST402 the same processing as step ST320 in the third embodiment, that is, step ST120 in the first embodiment is performed.
- step ST403 the microscope control unit 361 obtains the optimum correction ring position CP S of the correction ring 28 and the optimum objective lens position LP S of the objective lens 26 at the observation depth d S set in step ST402.
- step ST403 the same correction ring position determination process as in step ST330 in the third embodiment is performed.
- step ST404 the search range of the refractive index of the sample TP, the image acquisition parameter, and the image acquisition range are input.
- the same input operation as in the case of step ST140 in the first embodiment is performed.
- the search range of the refractive index of the sample TP as shown in FIG. 28, the user inputs the search range of the refractive index of the sample TP by using the GUI (setting input screen) displayed on the display unit 93. The operation is performed on the input unit 92.
- the minimum value “1.34” and the maximum value “1.40” are directly input as the “sample refractive index search range”, and in this case, the minimum value of the refractive index to be searched is 1.
- the maximum value of the refractive index to be searched is 1.40.
- the input unit 92 performs these operations.
- the input data corresponding to is output to the microscope control unit 361 of the confocal microscope 10 via the input / output control unit 91 of the information processing device 90.
- step ST405 the main control unit 62 of the microscope control unit 361 sets the value of the refractive index to be searched from the search range of the refractive index of the sample TP input in step ST404.
- the value of the first refractive index to be searched may be set to the value of the minimum refractive index in the search range, and the value of the last refractive index to be searched may be set to the value of the maximum refractive index in the search range. ..
- the value of the first refractive index to be searched may be set to the value of the maximum refractive index in the search range, and the value of the last refractive index to be searched may be set to the value of the minimum refractive index in the search range. ..
- step ST406 the list creation unit 67 of the microscope control unit 361 searches based on the setting data table DB3 stored in the storage unit 68 and the refractive index set in step ST405, as in the third embodiment. corresponding to the refractive index performed, determined by calculating CP-d variation ratio m CP, LP-d variation ratio m LP, and the L'-d variation ratio m L '.
- step ST 407 the list creation section 67 of the microscope control unit 361, a position L S of the objective lens 26 set in step ST 402, the optimum correction ring position CP S and the objective lens 26 of the corrector ring 28 obtained in step ST403 optimum
- the objective lens position LP S the image acquisition range input in step ST404 (the number of acquired z-stack images of the sample TP N, the upper end position L TP of the objective lens 26, the lower end position L BM of the objective lens 26), and step ST406.
- a parameter list for searching the refractive index is created.
- the parameter list for the refractive index search is the same parameter list as in the third embodiment.
- the list creation unit 67 creates the parameter list for the refractive index search
- the list creation unit 67 outputs the data of the created parameter list for the refractive index search to the main control unit 62.
- step ST408 the main control unit 62 of the microscope control unit 361 observes the lower end depth dr BM of the relative observation depth obtained in step ST407 and the upper end depth dr TP of the relative observation depth set in step ST402.
- the relationship between the observation depth d and the optimum correction ring position CP is as shown by the solid line in FIG. 29.
- the straight line shown by the broken line or the alternate long and short dash line in FIG. 29 shows the relationship between the observation depth d and the optimum correction ring position CP.
- step ST409 the microscope control unit 361 acquires an image of the sample TP at the observation depth for refractive index search set in step ST408 according to the parameter list for refractive index search created in step ST407.
- step ST410 the main control unit 62 of the microscope control unit 361 determines whether or not an image of the sample TP has been acquired for all the refractive indexes within the search range set in step ST405.
- step ST410: No the process returns to step ST405.
- the processes from step ST405 to step ST410 are repeated.
- step ST410 the refractive index of the sample TP for which the z-stack image is acquired is selectively input based on the image of the sample TP corresponding to the plurality of refractive indexes within the search range acquired in step ST409.
- the microscope control unit 361 outputs the image data of the sample TP acquired in step ST409 to the input / output control unit 91 of the information processing device 90.
- the input / output control unit 91 generates an image of the sample TP corresponding to a plurality of refractive indexes within the search range based on the image data input from the microscope control unit 361, and displays the image on the display unit 93. As shown in FIG. 30, the user compares the images of the sample TP corresponding to the plurality of refractive indexes displayed on the display unit 93. The user performs an operation on the input unit 92 to select the refractive index from which the image of the sample TP that feels the best image quality can be obtained as the refractive index of the sample TP. In FIG.
- an image of the sample TP corresponding to the sample refractive index “1.37” is selectively input, and in this case, the refractive index n SA of the input sample TP is 1.37.
- the input unit 92 outputs the input data corresponding to this operation to the microscope control unit 361 via the input / output control unit 91.
- step ST412 the list creation unit 67 of the microscope control unit 361 has the setting data table DB3 stored in the storage unit 68 and the refractive index n SA input in step ST411, as in step ST350 in the third embodiment. Based on the above, the CP-d change ratio m CP , the LP-d change ratio m LP , and the L'-d change ratio mL , which correspond to the refractive index n SA , are calculated and obtained.
- step ST413 the list creation unit 67 of the microscope control unit 361 creates a parameter list LS3 related to the setting of the confocal microscope 10.
- step ST413 the same processing as in step ST360 in the third embodiment is performed.
- step ST414 the microscope control unit 361 changes the optimum correction ring position CP of the correction ring 28 and the optimum objective lens position LP of the objective lens 26 according to the parameter list LS3 created in step ST413 to obtain the sample TP. Get the z-stack image.
- step ST415 the microscope control unit 361 outputs the z-stack image data of the sample TP acquired in step ST414 to the input / output control unit 91 of the information processing device 90.
- the input / output control unit 91 generates a three-dimensional image of the sample TP based on the z-stack image data input from the microscope control unit 361, and displays it on the display unit 93.
- step ST415 the same processing as in step ST380 in the third embodiment is performed.
- the same effect as that of the third embodiment can be obtained. Further, according to the fourth embodiment, even when the refractive index of the sample TP is unknown, the refractive index of the sample TP for acquiring a z-stack image based on the images of the sample TP corresponding to a plurality of refractive indexes. Can be selected and entered.
- the processing of steps ST401 to ST403 may be omitted, and the user may make a setting to change the observation area and then start from the processing of step ST404.
- the z-stack image of the same sample TP is acquired in different observation regions, thereby xy. It is possible to perform tying to arrange the z-stack images of the sample TP in a plurality of observation regions having different orientation positions.
- FIG. 31 is a block diagram showing an electrical connection between the microscope control unit 561 and the information processing device 90 according to the fifth embodiment.
- the microscope control unit 561 according to the fifth embodiment is configured in the same manner as the microscope control unit 361 according to the third embodiment.
- the microscope control unit 561 according to the fifth embodiment further has a refractive index determination unit 569 as compared with the microscope control unit 361 according to the third embodiment.
- the evaluation value calculation unit 64 can obtain the evaluation value w for the refractive index search based on the z-stack image data of the sample TP for the refractive index search input from the image generation unit 63. Is. The evaluation value calculation unit 64 outputs the data of the obtained evaluation value w to the storage unit 68.
- the refractive index determination unit 569 obtains the refractive index of the sample TP based on the data of the evaluation value w for the refractive index search stored in the storage unit 68.
- the refractive index determination unit 569 outputs the obtained refractive index data of the sample TP to the storage unit 68 via the main control unit 62, and also outputs the obtained data to the input / output control unit 91 of the information processing device 90.
- FIG. 32 is a flowchart showing an image acquisition method according to the fifth embodiment.
- the microscope control unit 561 includes, for example, a computer system.
- the microscope control unit 561 reads out the control program stored in the storage unit 68 and executes various processes according to the control program.
- the setting data table DB3 is created and stored in the storage unit 68.
- the same processing as in step ST310 in the third embodiment is performed.
- step ST 502 to set the optimum correction ring position CP and the position of the observation depth d S and observation region ROI that the optimum objective lens position LP of the objective lens 26 determined experimentally correction ring 28.
- step ST502 the same processing as step ST320 in the third embodiment, that is, step ST120 in the first embodiment is performed.
- step ST503 the microscope control unit 561 obtains the optimum correction ring position CP S of the correction ring 28 and the optimum objective lens position LP S of the objective lens 26 at the observation depth d S set in step ST502.
- step ST503 the same correction ring position determination process as in step ST330 in the third embodiment is performed.
- step ST504 the search range of the refractive index of the sample TP, the image acquisition parameter, and the image acquisition range are input.
- step ST504 the same processing as in step ST404 in the fourth embodiment is performed.
- step ST505 the main control unit 62 of the microscope control unit 561 sets the value of the refractive index to be searched from the search range of the refractive index of the sample TP input in step ST504.
- step ST505 the same processing as in step ST405 in the fourth embodiment is performed.
- step ST506 the list creation unit 67 of the microscope control unit 561 has a CP-d change ratio m CP , an LP-d change ratio m LP , and an L'-d change ratio mL , which correspond to the refractive index to be searched. Is calculated and calculated. In step ST506, the same processing as in step ST406 in the fourth embodiment is performed.
- step ST507 the list creation unit 67 of the microscope control unit 561 creates a parameter list for the refractive index search.
- step ST507 the same processing as in step ST407 in the fourth embodiment is performed.
- step ST508 the microscope control unit 561 changes the optimum correction ring position CP of the correction ring 28 and the optimum objective lens position LP of the objective lens 26 according to the parameter list for refractive index search created in step ST507. , A z-stack image of the sample TP for refractive index search is acquired.
- the evaluation value calculation unit 64 of the microscope control unit 561 obtains the evaluation value w for the refractive index search based on the z-stack image data of the sample TP for the refractive index search acquired in step ST508.
- the evaluation value calculation unit 64 stores and holds the obtained evaluation value w data and the refractive index data at this time in the storage unit 68.
- the evaluation value w for the refractive index search for example, the contrast of the image in the entire z-stack image, the xz cross-section of the z-stack image, the yz-section of the z-stack image, the integrated value of the signal intensity (luminance) of the image, and the like Can be used. Further, as shown by the broken line in FIG. 33, the contrast of the image, the integrated value of the signal intensity (luminance) of the image, and the like in the cross section where the signal intensity of the z-stack image is maximized can be used.
- step ST510 the main control unit 62 of the microscope control unit 561 determines whether or not the z-stack image of the sample TP has been acquired for all the refractive indexes within the search range set in step ST505.
- the main control unit 62 determines that the z-stack image of the sample TP has not been acquired for all the refractive indexes within the search range (step ST510: No)
- the process returns to step ST505.
- the processes from step ST505 to step ST510 are repeated.
- FIG. 33 is a graph showing an example of the evaluation value w obtained by changing the refractive index. As shown in FIG. 33, when the search range of the refractive index is set to n A1 to n A5 , the z-stack image TI (n A1 ) of the sample TP corresponding to the refractive index n A1 and the sample corresponding to the refractive index n A2.
- Z-stack image TI (n A2 ) of TP Z-stack image TI (n A3 ) of sample TP corresponding to refractive index n A3
- z-stack image TI (n A4 ) of sample TP corresponding to refractive index n A4 Z-stack image TI (n A5 ) of the sample TP corresponding to the refractive index n A5 can be obtained.
- step ST510 the refractive index determination unit 569 of the microscope control unit 561 obtains the refractive index n SA of the sample TP based on the data of the evaluation values w corresponding to the plurality of refractive indexes stored in the storage unit 68. Specifically, a plot of evaluation values w corresponding to a plurality of refractive indexes is created. Then, by performing interpolation or function approximation on this plot as shown in FIG.
- the refractive index n SA that maximizes the evaluation value w is obtained.
- a method of performing interpolation for example, there is a method of performing Lagrange interpolation or spline interpolation on a plot of evaluation values w for a plurality of refractive indexes n A1 to n A5 .
- a method of function approximation for example, there is a method of fitting a plot of evaluation values w for a plurality of refractive indexes n A1 to n A5 to a quadratic curve or a Gaussian function by the least squares method.
- step ST512 the refractive index determination unit 569 of the microscope control unit 561 outputs the obtained data of the refractive index n SA of the sample TP to the storage unit 68 via the main control unit 62, and inputs the information processing device 90. Output to the output control unit 91.
- the input / output control unit 91 causes the display unit 93 to display the refractive index n SA of the sample TP input from the microscope control unit 561 (refractive index determination unit 569).
- step ST513 the list creation unit 67 of the microscope control unit 561 uses the setting data table DB3 stored in the storage unit 68 and the refractive index n SA obtained in step ST511, as in step ST350 in the third embodiment. Based on this, the CP-d change ratio m CP , the LP-d change ratio m LP , and the L'-d change ratio mL , which correspond to the refractive index n SA , are calculated and obtained.
- step ST514 the list creation unit 67 of the microscope control unit 561 creates a parameter list LS3 related to the setting of the confocal microscope 10.
- step ST514 the same processing as in step ST360 in the third embodiment is performed.
- step ST515 the microscope control unit 561 changes the optimum correction ring position CP of the correction ring 28 and the optimum objective lens position LP of the objective lens 26 according to the parameter list LS3 created in step ST514 to obtain the sample TP. Get the z-stack image.
- step ST516 the microscope control unit 361 outputs the z-stack image data of the sample TP acquired in step ST414 to the input / output control unit 91 of the information processing apparatus 90.
- the input / output control unit 91 generates a three-dimensional image of the sample TP based on the z-stack image data input from the microscope control unit 361, and displays it on the display unit 93.
- step ST516 the same processing as in step ST380 in the third embodiment is performed.
- the same effect as that of the third embodiment can be obtained. Further, according to the fifth embodiment, even when the refractive index of the sample TP is unknown, the refractive index of the sample TP is determined based on the search range of the refractive index input from the input unit 92 by the user's operation. Can be asked.
- the processing of steps ST501 to ST503 may be omitted, and the user may make a setting to change the observation area and then start from the processing of step ST504.
- the z-stack image of the same sample TP is acquired in different observation regions, thereby xy. It is possible to perform tying to arrange the z-stack images of the sample TP in a plurality of observation regions having different orientation positions.
- one type of setting data table is created, but the present invention is not limited to this.
- a plurality of types of setting data tables different for each of the wavelength and temperature of the illumination light and the objective lens may be created and used properly according to the wavelength and temperature of the illumination light and the objective lens.
- the data regarding the refractive index of the sample TP, the image acquisition parameters, and the image acquisition range are set by the input operation of the user, but are not limited thereto.
- at least one of these data may be automatically set by referring to the data stored in the storage unit 68 or the like when the z-stack image of the sample TP was previously acquired. Good.
- the aberration correction lens 27 is configured to move along the optical axis AX of the objective lens 26 in accordance with the rotation of the correction ring 28.
- the aberration correction lens 27 may be configured to move along the optical axis AX of the objective lens 26 by utilizing the cam structure.
- the aberration correction lens 27 is used as an aberration correction element for correcting aberrations caused by the distance from the tip of the objective lens 26 to the cover glass CG, the thickness of the cover glass CG, the observation depth d, and the like.
- it is not limited to this.
- other phase modulation elements such as a liquid lens, a deformable mirror, and a liquid crystal element may be used as the aberration correction element.
- the liquid lens is arranged inside the illumination optical system 21, the detection optical system 31, or the objective lens 26, and corrects aberrations by changing the shape of the lens.
- the phase modulation element such as the deformable mirror and the liquid crystal element is arranged in the illumination optical system 21 or the detection optical system 31, and at least of the illumination light (excitation light) for the sample TP and the detection light (fluorescence) from the sample TP. Aberrations are corrected by modulating one of the phases.
- the phase modulation element is provided with an adjustment unit capable of changing or adjusting the amount of aberration correction.
- the adjusting unit provided on the liquid lens changes the shape of the lens by controlling the voltage value applied to the liquid lens. This makes it possible to change or adjust the amount of aberration correction by the liquid lens.
- the adjusting unit provided on the deformable mirror changes the shape of the mirror by controlling the voltage value applied to the deformable mirror. This makes it possible to change or adjust the amount of aberration correction by the deformable mirror.
- the adjusting unit provided on the liquid crystal element changes the distribution of the liquid crystal by controlling the voltage value applied to the liquid crystal element. As a result, the amount of aberration correction by the liquid crystal element can be changed or adjusted.
- the input unit 92 and the display unit 93 are devices provided separately from the information processing device 90, but the present invention is not limited thereto.
- the input unit 92 may be a device (for example, a built-in touch pad or the like) provided integrally with the information processing device 90.
- the input unit 92 may be a device (for example, a touch panel) provided integrally with the display unit 93.
- the display unit 93 may be a device provided integrally with the information processing device 90.
- the microscope device 1 is provided with a confocal microscope 10, but the present invention is not limited to this.
- the microscope provided in the microscope device may be a differential interference microscope, a phase contrast microscope, a multiphoton excitation microscope, an epi-fluorescence microscope, a super-resolution microscope, a dark-field microscope, a thermal lens microscope, or the like.
- the microscope provided in the microscope device is not limited to the inverted microscope, and may be an upright microscope.
- Microscope 10 Confocal microscope 11 Stage 12 Stage drive unit 16 Light source unit 21 Illumination optical system 26 Objective lens 27 Aberration correction lens 28 Correction ring 31 Detection optical system 41 Detection unit 51 Aberration correction unit 55 Correction ring drive unit 56 Objective lens drive Unit 61 Microscope control unit 62 Main control unit 63 Image generation unit 65 Correction ring position determination unit 67 List creation unit 68 Storage unit 90 Information processing device 361 Microscope control unit (third embodiment) 561 Microscope control unit (fifth embodiment) TP sample DB1, DB3 setting data table LS1 to LS3 parameter list
Landscapes
- Physics & Mathematics (AREA)
- Chemical & Material Sciences (AREA)
- Analytical Chemistry (AREA)
- General Physics & Mathematics (AREA)
- Optics & Photonics (AREA)
- Engineering & Computer Science (AREA)
- Multimedia (AREA)
- Microscoopes, Condenser (AREA)
Abstract
顕微鏡装置1において、顕微鏡制御部(61)は、対物レンズ(26)の光軸方向である試料(TP)の深さ方向の第1の位置における収差補正部(51)の補正量に関する情報を、検出部(41)で検出された光に基づいて算出し、算出した第1の位置における収差補正部(51)の補正量に関する情報と、試料(TP)の屈折率に関する情報とに基づいて、第1の位置と異なる第2の位置における収差補正部(51)の補正量に関する情報を算出する。
Description
本発明は、顕微鏡装置、顕微鏡装置の制御方法、および顕微鏡装置の制御プログラムに関する。
波面変換素子を用いて収差を補正する技術が知られている(例えば、特許文献1を参照)。顕微鏡装置においては、従来から、適切な収差補正が求められている。
第1の態様に係る顕微鏡装置は、試料を照明する照明光学系と、前記試料からの光を検出する検出部と、対物レンズを有し、前記試料からの光を前記検出部に導く検出光学系と、前記照明光学系および前記検出光学系の少なくとも一方の収差を補正する収差補正部と、制御部とを備え、前記制御部は、前記対物レンズの光軸方向である前記試料の深さ方向の第1の位置における前記収差補正部の補正量に関する情報を、前記検出部で検出された光に基づいて算出し、前記算出した前記第1の位置における前記収差補正部の補正量に関する情報と、前記試料の屈折率に関する情報とに基づいて、前記第1の位置と異なる第2の位置における前記収差補正部の補正量に関する情報を算出する。
第2の態様に係る顕微鏡装置の制御方法は、試料を照明する照明光学系と、前記試料からの光を検出する検出部と、対物レンズを有し、前記試料からの光を前記検出部に導く検出光学系と、前記照明光学系および前記検出光学系の少なくとも一方の収差を補正する収差補正部と、制御部とを備える顕微鏡装置の制御方法であって、前記対物レンズの光軸方向である前記試料の深さ方向の第1の位置における前記収差補正部の補正量に関する情報を、前記検出部で検出された光に基づいて算出し、前記算出した前記第1の位置における前記収差補正部の補正量に関する情報と、前記試料の屈折率に関する情報とに基づいて、前記第1の位置と異なる第2の位置における前記収差補正部の補正量に関する情報を算出する。
第3の態様に係る顕微鏡装置の制御プログラムは、試料を照明する照明光学系と、前記試料からの光を検出する検出部と、対物レンズを有し、前記試料からの光を前記検出部に導く検出光学系と、前記照明光学系および前記検出光学系の少なくとも一方の収差を補正する収差補正部と、制御部とを備える顕微鏡装置の制御プログラムであって、コンピュータに、前記対物レンズの光軸方向である前記試料の深さ方向の第1の位置における前記収差補正部の補正量に関する情報を、前記検出部で検出された光に基づいて算出し、前記算出した前記第1の位置における前記収差補正部の補正量に関する情報と、前記試料の屈折率に関する情報とに基づいて、前記第1の位置と異なる第2の位置における前記収差補正部の補正量に関する情報を算出する処理を実行させる。
第4の態様に係る顕微鏡装置は、試料からの光を検出する検出部と、対物レンズを有し、前記試料からの光を前記検出部に導く検出光学系と、前記検出光学系の収差を補正する収差補正部と、制御部とを備え、前記制御部は、前記対物レンズの光軸方向である前記試料の深さ方向の第1の位置における前記収差補正部の補正量に関する情報を、前記検出部で検出された光に基づいて算出し、前記算出した前記第1の位置における前記収差補正部の補正量に関する情報と、前記試料の屈折率に関する情報とに基づいて、前記第1の位置と異なる第2の位置における前記収差補正部の補正量に関する情報を算出する。
[第1実施形態]
第1実施形態について説明する。図1は、第1実施形態に係る顕微鏡装置1の構成を示す図である。この顕微鏡装置1は、共焦点顕微鏡10と、情報処理装置90とを主体に構成される。共焦点顕微鏡10と情報処理装置90とは、互いにデータの送受信が可能に構成されている。以降の説明において、共焦点顕微鏡10の対物レンズ26の光軸方向に延びる座標軸をz軸とする。また、このz軸と垂直な面内において互いに直交する方向に延びる座標軸をそれぞれx軸およびy軸とする。
第1実施形態について説明する。図1は、第1実施形態に係る顕微鏡装置1の構成を示す図である。この顕微鏡装置1は、共焦点顕微鏡10と、情報処理装置90とを主体に構成される。共焦点顕微鏡10と情報処理装置90とは、互いにデータの送受信が可能に構成されている。以降の説明において、共焦点顕微鏡10の対物レンズ26の光軸方向に延びる座標軸をz軸とする。また、このz軸と垂直な面内において互いに直交する方向に延びる座標軸をそれぞれx軸およびy軸とする。
共焦点顕微鏡10は、ステージ11と、光源ユニット16と、照明光学系21と、検出光学系31と、検出部41と、収差補正部51と、顕微鏡制御部61とを備える。ステージ11は、図2に示すように、中央に開口部を有する板状に形成される。ステージ11は、観察対象である試料TPが載置されたカバーガラスCGを支持する(図2を参照)。試料TPの例として、例えば、生体試料(図示せず)やビーズ(図示せず)等がある。生体試料は、蛍光染色された細胞等の厚みがある試料である。ビーズは、蛍光標識されたポリスチレン製の(例えば、直径0.2μm程度の)微小な球体である。
図1に示すように、ステージ11には、ステージ駆動部12が設けられる。ステージ駆動部12は、ステージ11をz軸(対物レンズ26の光軸AX)と垂直な面内で移動させる。ステージ駆動部12によりステージ11をz軸と垂直な面内で移動させることで、カバーガラスCGを介してステージ11に支持された、試料TPにおける広範囲の画像を取得することが可能である。なお、ステージ駆動部12は、ステージ11をz軸(対物レンズ26の光軸AX)に沿って移動させてもよい。
光源ユニット16は、試料TPに含まれる蛍光物質を励起するための励起光を射出させる。光源ユニット16は、光源17と、シャッタ18と、音響光学素子19とを有する。光源17として、例えば、所定の波長域のレーザー光(励起光)を射出させることが可能なレーザー光源等が用いられる。
照明光学系21は、光源ユニット16から射出された励起光で試料TPを照明する。照明光学系21は、光源ユニット16側から順に、照明用レンズ22と、励起フィルタ23と、ダイクロイックミラー24と、スキャナ25と、対物レンズ26とを有する。照明用レンズ22は、光源ユニット16から射出された励起光を平行光にするためのコリメーターレンズである。励起フィルタ23は、光源ユニット16からの励起光が透過し、他の波長の光(例、外光、迷光)の少なくとも一部を遮る特性を有する。ダイクロイックミラー24は、光源ユニット16から射出された励起光が反射し、ステージ11上の試料TPで発生した光のうち所定の波長帯の光(例、蛍光)が透過する特性を有する。スキャナ25は、x方向とy方向との2方向において、光源ユニット16からの励起光で試料TPを走査する。スキャナ25として、例えば、ガルバノスキャナや、レゾナントスキャナ等が用いられる。
対物レンズ26は、ステージ11の下方近傍に配置される。対物レンズ26は、ステージ11の開口部およびカバーガラスCG(図2を参照)を介して、ステージ11上の試料TPと対向する。対物レンズ26とカバーガラスCGとの間隙部は、浸液IM(図2を参照)で満たされるようになっている。なお、対物レンズ26とカバーガラスCGとの間隙部は、浸液IMに限らず、空気等の気体で満たされていてもよい。
検出光学系31は、試料TPで発生した蛍光を集光する。検出光学系31は、試料TP側から順に、対物レンズ26と、スキャナ25と、ダイクロイックミラー24とを含む。さらに、検出光学系31は、ダイクロイックミラー24側から順に、蛍光フィルタ34と、集光レンズ35とを有する。蛍光フィルタ34は、試料TPからの光のうち所定の波長帯の光(例、蛍光)が透過する特性を有する。蛍光フィルタ34は、例えば、試料TPで反射した励起光、外光、迷光などの少なくとも一部を遮断する。集光レンズ35は、試料TPからの蛍光を集光する。検出部41は、検出光学系31を介して、試料TPで発生した蛍光を検出する。検出部41として、例えば、光電子増倍管が用いられる。
検出光学系31と検出部41との間における検出部41の近傍に、ピンホール36が設けられる。ピンホール36は、対物レンズ26の試料TP側の焦点位置と共役な位置に配置される。ピンホール36は、対物レンズ26の焦点面(対物レンズ26の焦点位置を通る対物レンズ26の光軸AXと垂直な面)または、当該焦点面から所定のずれ許容範囲内で光軸方向にずれた面からの光のみを通過させ、他の光を遮光する。ピンホール36には、ピンホール駆動部37が設けられる。ピンホール駆動部37は、ピンホール36の大きさを拡大若しくは縮小させる。ピンホール駆動部37により、ピンホール36の大きさを拡大若しくは縮小させることで、上述した所定のずれ許容範囲を変えることができる。
顕微鏡制御部61は、ステージ駆動部12、ピンホール駆動部37、検出部41等を制御する。また、顕微鏡制御部61は、試料TPの画像の取得条件として、例えば、光源ユニット16から射出される励起光の光強度、ピンホール36の大きさ、試料TPに対する励起光の走査速度等を設定する。
光源ユニット16から射出された励起光は、照明光学系21の照明用レンズ22を透過して略平行光になる。照明用レンズ22を透過した励起光は、励起フィルタ23を通ってダイクロイックミラー24に入射する。ダイクロイックミラー24に入射した励起光は、ダイクロイックミラー24で反射してスキャナ25に入射する。スキャナ25は、x方向とy方向との2方向において、スキャナ25に入射した励起光で試料TPを走査する。スキャナ25に入射した励起光は、スキャナ25を通って対物レンズ26を透過し、対物レンズ26の焦点面に集光される。試料TPにおいて励起光が集光される部分(すなわち、対物レンズ26の焦点面と重なる部分)は、スキャナ25によりx方向とy方向との2方向において2次元的に走査される。
試料TPにおいて励起光が集光される部分に含まれる蛍光物質から、蛍光が発光する。試料TPで発した蛍光は、検出光学系31としての対物レンズ26に入射する。対物レンズ26に入射した蛍光は、対物レンズ26を透過し、スキャナ25を通ってダイクロイックミラー24に入射する。ダイクロイックミラー24に入射した蛍光は、励起光と波長が異なるため、ダイクロイックミラー24を透過して蛍光フィルタ34に達する。蛍光フィルタ34に達した蛍光は、蛍光フィルタ34を通って集光レンズ35を透過し、対物レンズ26の焦点位置と共役な位置に集光される。対物レンズ26の焦点位置と共役な位置に集光された蛍光は、ピンホール36を通過して検出部41に入射する。
検出部41は、検出部41に入射した光(蛍光)の光電変換を行い、光の検出信号として、その光の光量(明るさ)に対応するデータを生成する。検出部41は、生成したデータを顕微鏡制御部61へ出力する。顕微鏡制御部61は、検出部41から入力されたデータを1画素分のデータとして、これをスキャナ25による2次元的な走査と同期して並べる処理を行うことで、複数画素分のデータが2次元で(2方向で)並ぶ1つの画像データを生成し、RAMなどの記憶部68(図3を参照)に記憶させる。このようにして、顕微鏡制御部61は、試料TPの画像を取得する。
図2は、共焦点顕微鏡10における収差補正部51の拡大図である。収差補正部51は、対物レンズ26先端からカバーガラスCGまでの距離、カバーガラスCGの厚み、及び試料中の観察深さなどに起因する球面収差を補正する。対物レンズ26は、レボルバ(図示せず)によりステージ11の下方近傍で保持される。対物レンズ26は、収差補正レンズ27と、補正環28とを有する。収差補正レンズ27は、対物レンズ26の光軸AXに沿って移動することで、対物レンズ26の球面収差を変化させることが可能である。補正環28は、対物レンズ26の鏡筒部に、対物レンズ26の光軸AXを中心に回転自在に設けられる。補正環28の回転に応じて、収差補正レンズ27が対物レンズ26の光軸AXに沿って移動する。
収差補正部51は、対物レンズ26の収差補正レンズ27および補正環28と、検出部41とを含む。さらに、収差補正部51は、補正環駆動部55と、対物レンズ駆動部56とを有する。補正環駆動部55は、例えば電動モータ(図示せず)を用いて構成される。補正環駆動部55は、補正環28を回転駆動し、補正環28の回転位置Cを変化させ、収差補正レンズ27を対物レンズ26の光軸AXに沿って移動させる。補正環駆動部55は、補正環28の回転位置■を変化させて、収差補正レンズ27の光軸上の位置を変化させることにより、対物レンズ26の球面収差を変化させる。
対物レンズ駆動部56は、例えば電動モータ(図示せず)を用いて構成される。対物レンズ駆動部56は、レボルバ(不図示)とともに対物レンズ26をz方向に上下移動させる。対物レンズ駆動部56により対物レンズ26がz方向に移動すると、試料TPに対する対物レンズ26の相対位置が変化し、試料TPに対する対物レンズ26の焦点位置PFがz方向に変化する。対物レンズ駆動部56により対物レンズ26の焦点位置PFをz方向に変位させることで、z方向(対物レンズ26の光軸方向)の位置が異なる試料TPの断面(観察面TA)の画像を取得することが可能である。以降、z方向の位置が異なる複数の試料TPの断面の画像を、試料TPのzスタック画像と称することがある。
図3は、第1実施形態に係る共焦点顕微鏡10の顕微鏡制御部61と情報処理装置90との間の電気的な接続を示すブロック図である。共焦点顕微鏡10の顕微鏡制御部61は、収差の補正量算出決定部としても機能し、補正環28の最適な回転位置を求める。顕微鏡制御部61は、主制御部62と、画像生成部63と、評価値算出部64と、補正環位置決定部65と、リスト作成部67と、記憶部68とを有する。
主制御部62は、収差補正部51を構成する、検出部41、補正環駆動部55、および対物レンズ駆動部56と電気的に接続される。主制御部62は、情報処理装置90の入出力制御部91と電気的に接続される。主制御部62は、入出力制御部91から入力されるデータに応じて、検出部41、補正環駆動部55、および対物レンズ駆動部56を制御する。
画像生成部63は、検出部41から入力された光の検出信号に基づいて、試料TPの画像を生成する。画像生成部63は、生成した試料TPの画像データを、評価値算出部64および記憶部68のうち少なくともいずれかへ出力する。例えば、画像生成部63は、記憶部68で記憶される試料TPの画像を生成すると、生成した試料TPの画像データを記憶部68へ出力する。画像生成部63は、評価値算出部64による処理で用いられる試料TPの画像を生成すると、生成した試料TPの画像データを評価値算出部64へ出力する。
評価値算出部64は、画像生成部63から入力された試料TPの画像データに基づいて、詳細は後述する評価値vを求める。評価値算出部64は、求めた評価値vのデータを記憶部68へ出力する。
補正環位置決定部65は、記憶部68に記憶された評価値vのデータに基づいて、補正環28の最適な回転位置を求める。補正環位置決定部65は、求めた補正環28の最適な回転位置のデータを、主制御部62を介して記憶部68へ出力するとともに、情報処理装置90の入出力制御部91へ出力する。以降、補正環28の最適な回転位置を最適補正環位置CPと称することがある。
リスト作成部67は、記憶部68に記憶された設定用データテーブルと、情報処理装置90の入出力制御部91から入力された入力データに基づいて、共焦点顕微鏡10の設定に関するパラメータリストを作成する。リスト作成部67は、作成したパラメータリストを、主制御部62へ出力する。
記憶部68は、RAM等のメモリやハードディスク等を用いて構成される。顕微鏡制御部61の各部から入力される各種データを記憶する。例えば、記憶部68は、画像生成部63から入力された試料TPの画像データを記憶する。記憶部68は、評価値算出部64から入力された評価値vのデータを記憶する。
また、記憶部68は、設定用データテーブルを記憶している。第1実施形態に係る設定用データテーブルDB1は、図6に示すように、試料TPの屈折率nと、CP-d変化比mCPと、L-d変化比mLとの関係を示すデータテーブルである。
ここで、CP-d変化比mCPとは、観察深さdの変化量と、観察深さdの変化に伴う補正環28の最適補正環位置CPの変化量との比である。観察深さdとは、試料TPの下端部(カバーガラスCGと試料TPとの境界部)から観察面までのz方向の深さ位置である(図2を参照)。補正環28の最適補正環位置CPとは、対物レンズ26の焦点位置PFが観察深さdの位置にあり、かつ対物レンズ26先端からカバーガラスCGまでの距離、カバーガラスCGの厚み、及び観察深さdなどに起因する球面収差が最小となる、補正環28の最適な回転位置である。例えば、図5(A)に示すように、試料TPの屈折率がn1の場合における観察深さdと最適補正環位置CPとの関係は直線fCPn1で表すことができる。試料TPの屈折率がn2の場合における観察深さdと最適補正環位置CPとの関係は直線fCPn2で表すことができる。このとき、試料TPの屈折率がn1の場合におけるCP-d変化比mCPは、直線fCPn1の傾きとして求まる。試料TPの屈折率がn2の場合におけるCP-d変化比mCPは、直線fCPn1の傾きとは異なる直線fCPn2の傾きとして求まる。
L-d変化比mLとは、観察深さdの変化量と、観察深さdの変化に伴う対物レンズ26の位置Lの変化量との比である。対物レンズ26の位置Lとは、所定の基準位置L0を原点位置とした、対物レンズ26のz方向の位置である(図2を参照)。対物レンズ26のz方向の位置は、例えば、対物レンズ26をz方向に駆動させるギアの角度の基準位置からの変化量で検出できる。L-d変化比mLを求める理由は、試料TPと浸液IMとの間では屈折率の差があるため、観察深さdの変化量と対物レンズ26の位置Lの変化量とが異なるからである。例えば図7に示すように、対物レンズ26の位置がLiからLi+1まで変位した場合の変位量(Li+1-Li)は、この変位に対応して対物レンズ26の焦点位置PFが観察深さdiの位置から観察深さdi+1の位置まで変位した場合の変位量(di+1-di)と異なってしまう。
例えば、図5(B)に示すように、試料TPの屈折率がn1の場合における観察深さdと対物レンズ26の位置Lとの関係は直線fLn1で表すことができる。試料TPの屈折率がn2の場合における観察深さdと対物レンズ26の位置Lとの関係は直線fLn2で表すことができる。このとき、試料TPの屈折率がn1の場合におけるL-d変化比mLは、直線fLn1の傾きとして求まる。試料TPの屈折率nがn2の場合におけるL-d変化比mLは、直線fLn1の傾きとは異なる直線fLn2の傾きとして求まる。
予め、光学シミュレーションを行うことにより、複数の試料屈折率についてCP-d変化比mCPおよびL-d変化比mLを求めることで、設定用データテーブルDB1を作成することが可能である。具体的には、光学シミュレーションを行うことによりL-d変化比mLを求める。このときまず、試料屈折率、浸液屈折率、カバーガラスの厚み、試料TP中の観察深さdなどを設定し、例えば、PSF(点像分布関数)のストレール比を算出することにより、対物レンズ26の焦点位置PFが観察深さdの位置にあるときの対物レンズ26の位置Lを求める。次に、複数の観察深さdについて対物レンズ26の位置Lを求めることで、観察深さdに対する対物レンズ26の位置Lのプロットを作成する。そして、作成したプロットを例えば直線でフィッティングし、L-d変化比mLを求める。複数の試料屈折率を設定してL-d変化比mLを求めることで、試料屈折率毎にL-d変化比mLを求める。
続いて、光学シミュレーションを行うことによりCP-d変化比mCPを求める。このときまず、試料屈折率、浸液屈折率、カバーガラスの厚み、試料TP中の観察深さd、および対物レンズ26の焦点位置PFが観察深さdの位置にあるときの対物レンズ26の位置Lなどを設定し、このときの結像状態が最良となる補正環28の回転位置(最適補正環位置CP)を求める。なお、対物レンズ26の焦点位置PFが観察深さdの位置にあるときの対物レンズ26の位置Lは、L-d変化比mLを用いて算出される。また、結像状態を表す指標として、PSF(点像分布関数)のストレール比を用いることができる。次に、複数の観察深さdについて補正環28の最適補正環位置CPを求めることで、観察深さdに対する補正環28の最適補正環位置CPのプロットを作成する。そして、作成したプロットを例えば直線でフィッティングし、CP-d変化比mCPを求める。複数の試料屈折率を設定してCP-d変化比mCPを求めることで、試料屈折率毎にCP-d変化比mCPを求める。
情報処理装置90は、入出力制御部91を有する。情報処理装置90は、入力部92および表示部93と電気的に接続される。入力部92は、ユーザーが操作可能な入力インターフェースである。入力部92は、例えば、マウス、キーボード、タッチパッド、トラックボール等のうち少なくとも1つを含む。入力部92は、ユーザーによる操作を検出し、その検出結果をユーザーが入力した入力データとして情報処理装置90の入出力制御部91へ出力する。表示部93は、例えば、液晶ディスプレイ等である。情報処理装置90の入出力制御部91は、共焦点顕微鏡10の操作に必要なGUI(グラフィカルユーザーインターフェース)や、共焦点顕微鏡10の顕微鏡制御部61から出力された、試料TPの画像、補正環28の最適補正環位置CP等を表示部93に表示させる。入出力制御部91は、入力部92から入力された入力データを共焦点顕微鏡10の顕微鏡制御部61へ出力する。
次に、試料TPの画像を取得するための顕微鏡装置1の制御方法(以降、画像取得方法と称する)について説明する。第1実施形態に係る画像取得方法では、まず、或る一つの観察深さdの位置に対物レンズ26の焦点位置PFがあるときの、対物レンズ26の位置Lを求める。次に、当該観察深さdにおける補正環28の最適補正環位置CPを実験的に求める。そして、他の観察深さdにおける補正環28の最適補正環位置CPを、実験的にではなく、ユーザーの操作により入力される試料TPの屈折率に基づいて求める。なお、第1実施形態に係る画像取得方法では、補正環28を回転させて対物レンズ26の球面収差を変化させても、対物レンズ26の焦点位置PFが変化しない場合について説明する。
図4は、第1実施形態に係る画像取得方法を示すフローチャートである。なお、顕微鏡制御部61は、例えばコンピュータシステムを含む。顕微鏡制御部61は、記憶部68に記憶されている制御プログラムを読み出し、この制御プログラムに従って各種の処理を実行する。ステップST110において、設定用データテーブルDB1を作成して記憶部68に記憶させる。前述したように、予め、光学シミュレーションを行うことにより、複数の屈折率についてCP-d変化比mCPおよびL-d変化比mLを求めることで、設定用データテーブルDB1を作成する。
ステップST120において、補正環28の最適補正環位置CPを実験的に求める観察深さdSおよび観察領域ROIの位置を設定する。図8(A)に示すように、ユーザーは、表示部93に表示されるGUIを利用して、試料の画像TIを見ながら、対物レンズ26の位置Lを入力する操作を入力部92に対して行い、観察深さdSを設定する。ユーザーは、表示部93に表示されるGUIを利用して、試料の画像TIを見ながら、観察領域ROI(ステージ11)のx方向位置およびy方向位置を入力する操作を入力部92に対して行い、観察領域ROIを設定する。ユーザーが、対物レンズ26の位置Lを入力する操作や、観察領域ROI(ステージ11)のx方向位置およびy方向位置を入力する操作を入力部92に対して行うと、入力部92は、これらの操作に対応する入力データを、情報処理装置90の入出力制御部91を介して共焦点顕微鏡10の顕微鏡制御部61へ出力する。
図8(B)は、対物レンズ26の焦点位置PFが、補正環28の最適補正環位置CPを実験的に求める観察深さdSの位置にある状態を示す。図8(A)を用いて説明したように、ユーザーは、補正環28の最適補正環位置CPを実験的に求める観察深さdSが実際にはわからないため、観察深さdSは、対物レンズ26の焦点位置PFがこの観察深さdSの位置にあるときの対物レンズ26の位置LSにより設定される。なお、観察深さdSのときの値を0とする相対的な観察深さを、相対観察深さdrと称することがある。補正環28の最適補正環位置CPを実験的に求める、対物レンズ26の位置LSおよび、観察領域ROI(ステージ11)のx方向位置およびy方向位置は、手動に限らず、画像の信号強度(輝度値)やコントラストが高いこと等を条件として自動的に設定されるようにしてもよい。
ステップST130において、顕微鏡制御部61は、ステップST120で設定した観察深さdSにおける、補正環28の最適補正環位置CPSを求める。ユーザーが、図8(A)に示すGUI(補正環調整画面)95の「開始」ボタン96を選択する操作を入力部92に対して行うと、入力部92は、この操作に対応する入力データを、情報処理装置90の入出力制御部91を介して共焦点顕微鏡10の顕微鏡制御部61へ出力する。そして、ステップST120で設定した観察深さdS(対物レンズ26の位置LS)および観察領域ROIにおいて、補正環28の最適補正環位置CPSを求める補正環位置決定処理が開始される。
ここで、補正環位置決定処理の詳細について説明する。図11は、第1実施形態に係る補正環位置決定処理の詳細を示すフローチャートである。ステップST131において、顕微鏡制御部61の主制御部62は、補正環駆動部55へ制御信号を送信し、この制御信号を受信した補正環駆動部55は、補正環28を初期状態の回転位置(以降、初期補正環位置CBと称することがある)へ回転移動させる。補正環28の回転に応じて、収差補正レンズ27が対物レンズ26の光軸AXに沿って移動するため、補正環28の回転位置Cは、収差補正レンズ27の対物レンズ26における光軸AX上の位置に対応している。
ステップST132において、顕微鏡制御部61は、試料TPの画像を1回または複数回取得する。顕微鏡制御部61は、光源ユニット16からレーザー光(励起光)射出させる。また、顕微鏡制御部61の主制御部62は、検出部41へ制御信号を送信し、この制御信号を受信した検出部41は、試料TPからの光(蛍光)の検出信号を顕微鏡制御部61の画像生成部63へ出力する。画像生成部63は、検出部41から入力された光の検出信号(前述の1画素分のデータ)をスキャナ25による2次元的な走査と同期して並べる処理を行うことで、試料TPの画像を生成する。画像生成部63は、生成した試料TPの画像データを評価値算出部64へ出力する。
ステップST133において、顕微鏡制御部61の評価値算出部64は、ステップST132で生成した試料TPの画像データに基づいて、評価値vを求める。評価値算出部64は、求めた評価値vのデータおよび、このときの補正環28の回転位置C(初めてこの処理を実行する場合、初期補正環位置CB)のデータを記憶部68に記憶させて保持する。評価値vとして、例えば、画像のコントラストや、画像の信号強度(輝度)の積算値、画像の信号強度をフーリエ変換して得られる周波数成分の所定の周波数領域における積算値等を用いることができる。また、同じ条件で複数回取得した画像間の相関値を用いてもよい。
ステップST134において、顕微鏡制御部61の主制御部62は、補正環28の回転位置Cを規定回数変えたか否かを判定する。主制御部62が、補正環28の回転位置Cを規定回数変えていないと判定した場合(ステップST134:No)、ステップST135へ進む。ステップST135において、主制御部62は、補正環駆動部55へ制御信号を送信し、この制御信号を受信した補正環駆動部55は、補正環28を所定の回転移動量だけ回転移動させ、ステップST132へ戻る。そして、ステップST132からステップST134までの処理を繰り返す。以上の処理により、所定の回転移動量で、補正環28を初期補正環位置CBから規定回数だけ回転移動させたときの、それぞれの補正環28の回転位置での評価値vを求めることができる。
図12は、補正環28の回転位置Cを変えて求まる評価値vの一例を示すグラフである。図12に示すように、補正環28の回転位置Cを変える規定回数を6とした場合、まず、顕微鏡制御部61は、初期補正環位置CBでの試料の画像TI(CB)を取得する。ここで、初期補正環位置CBを回転位置CB0とすると、顕微鏡制御部61は、回転位置CB0での画像TI(CB0)を取得することになる。顕微鏡制御部61は、補正環28を初期補正環位置CBから第1の回転量だけ回転移動させた回転位置CB1での画像TI(CB1)を取得する。顕微鏡制御部61は、補正環28を初期補正環位置CBから第2の回転量だけ回転移動させた回転位置CB2での画像TI(CB2)を取得する。顕微鏡制御部61は、補正環28を初期補正環位置CBから第3の回転量だけ回転移動させた回転位置CB3での画像TI(CB3)を取得する。顕微鏡制御部61は、補正環28を初期補正環位置CBから第4の回転量だけ回転移動させた回転位置CB4での画像TI(CB4)を取得する。顕微鏡制御部61は、補正環28を初期補正環位置CBから第5の回転量だけ回転移動させた回転位置CB5での画像TI(CB5)を取得する。顕微鏡制御部61は、補正環28を初期補正環位置CBから第6の回転量だけ回転移動させた回転位置CB6での画像TI(CB6)を取得する。つまり、顕微鏡制御部61は、補正環28を初期補正環位置CBから6回回転移動させた各回転位置CB1~CB6で画像TIを取得する。顕微鏡制御部61の評価値算出部64は、これらの画像データに基づいて、初期補正環位置CBおよび、補正環28を初期補正環位置CBから第1~第6の回転量だけ回転移動させた回転位置CB1~CB6での評価値vを求めることができる。
なお、上記では、初期補正環位置CBを回転位置CB0とした場合を例に挙げて説明したが、これに限られるものではない。例えば、初期補正環位置CBを回転位置CB3としてもよい。
ステップST134において、主制御部62が、補正環28の回転位置Cを規定回数変えたと判定した場合(ステップST134:Yes)、ステップST136へ進む。ステップST136において、顕微鏡制御部61の補正環位置決定部65は、記憶部68に記憶された補正環28の複数の回転位置での評価値vを比較して、評価値vが最大となる補正環28の最適な回転位置を求める。評価値vと補正環28の回転位置Cとの関係について補間または関数近似を行った上で、評価値vが最大となる補正環28の最適な回転位置を求めてもよい。補正環位置決定部65は、求めた補正環28の最適な回転位置のデータを、主制御部62へ出力し、ステップST137へ進む。
ステップST137において、顕微鏡制御部61の主制御部62は、ステップST136で求めた補正環28の最適な回転位置のデータを、実験的に求めた最適補正環位置CPSのデータとして、記憶部68に記憶させて保持する。ステップST138において、主制御部62は、補正環駆動部55へ制御信号を送信し、この制御信号を受信した補正環駆動部55は、補正環28をステップST136で求めた最適補正環位置CPSへ回転移動させる。そして、次の処理(図4のステップST140)に移行する。
ステップST140において、試料TPの屈折率、画像取得パラメータ、画像取得範囲の入力を行う。図9に示すように、ユーザーは、表示部93に表示されるGUI(設定入力画面)を利用して、試料TPの屈折率nSAとして試料TPの種類を選択入力する操作を入力部92に対して行う。図9では例えば、「試料の種類」に培養細胞(1.35)が選択入力されており、この場合、屈折率nSAは1.35となる。また、ユーザーは、「手入力」を選択して、屈折率nSAの値を直接入力する操作を行うことも可能である。図9では例えば、数値「1.36」が直接入力されており、この場合、屈折率nSAは1.36となる。なお、「手入力」が選択されている場合、「試料の種類」の選択入力は無効となる。ユーザーは、表示部93に表示されるGUIを利用して、画像取得パラメータを入力する操作を入力部92に対して行う。画像取得パラメータを入力する操作として、レーザーパワー(光源17のパワー)、スキャンピッチ(スキャナ25により走査される試料TPにおける走査点の間隔)、スキャン点数(スキャナ25により走査される試料TPにおける走査点の数)を入力する操作が行われる。ユーザーは、表示部93に表示されるGUIを利用して、画像取得範囲を入力する操作を入力部92に対して行う。画像取得範囲を入力する操作として、試料TPのzスタック画像の取得枚数N、対物レンズ26の上端位置LTP、対物レンズ26の下端位置LBMを入力する操作が行われる。
ユーザーが、試料TPの屈折率を入力する操作や、画像取得パラメータを入力する操作、画像取得範囲を入力する操作を入力部92に対して行うと、入力部92は、これらの操作に対応する入力データを、情報処理装置90の入出力制御部91を介して共焦点顕微鏡10の顕微鏡制御部61へ出力する。なお、zスタック画像は、対物レンズ26の上端位置LTPが設定されたときの対物レンズ26の焦点位置PFから、対物レンズの下端位置LBMが設定されたときの対物レンズ26の焦点位置PFまでの間で取得される。
ステップST150において、顕微鏡制御部61のリスト作成部67は、記憶部68に記憶された設定用データテーブルDB1(図6を参照)と、ステップST140で入力された屈折率nSAに基づいて、屈折率nSAに対応するCP-d変化比mCPおよびL-d変化比mLを算出して求める。なお、屈折率nSAと合致する屈折率の値が、設定用データテーブルDB1にない場合、設定用データテーブルDB1における屈折率nSAの近傍の屈折率の値に対して補間を行うことで、CP-d変化比mCPおよびL-d変化比mLを求めるようにしてもよい。
例えば、ステップST140で入力された屈折率nSAが1.336であった場合、設定用データテーブルDB1における屈折率が1.335に対応するCP-d変化比mCP(n=1.335)およびL-d変化比mL(n=1.335)を用いてもよい。また、設定用データテーブルDB1における屈折率が1.335に対応するCP-d変化比mCP(n=1.335)と、屈折率が1.340に対応するCP-d変化比mCP(n=1.340)とを補間することにより、屈折率nSAが1.336である場合のCP-d変化比mCPを求めてもよい。設定用データテーブルDB1における屈折率が1.335に対応するL-d変化比mL(n=1.335)と、屈折率が1.340に対応するL-d変化比mL(n=1.340)とを補間することにより、屈折率nSAが1.336である場合のL-d変化比mLを求めてもよい。
ステップST160において、顕微鏡制御部61のリスト作成部67は、ステップST120で設定した対物レンズ26の位置LSと、ステップST130で求めた補正環28の最適補正環位置CPSと、ステップST140で入力された画像取得範囲(試料TPのzスタック画像の取得枚数N、対物レンズ26の上端位置LTP、対物レンズ26の下端位置LBM)と、ステップST150で求めたCP-d変化比mCPおよびL-d変化比mLに基づいて、共焦点顕微鏡10の設定に関するパラメータリストを作成する。第1実施形態に係るパラメータリストLS1は、図10(B)に示すように、試料TPのzスタック画像を取得する際の、相対観察深さdrと、補正環28の最適補正環位置CPと、対物レンズ26の位置Lとの関係を示すリストである。リスト作成部67は、パラメータリストLS1を作成すると、作成したパラメータリストLS1のデータを、主制御部62へ出力する。
パラメータリストLS1を作成するには、まず、試料TPのzスタック画像を取得する際に変位させる対物レンズ26の位置Liを求める。ここで、iは、1~N(試料TPのzスタック画像の取得枚数N)までの整数である。対物レンズ26の位置Liは、下記の式(1)を用いて求められる。

次に、対物レンズ26が位置Liに位置するときの相対観察深さdriを求める。相対観察深さdriは、下記の式(2)を用いて求められる。
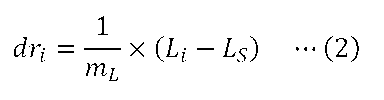
次に、各相対観察深さdriに対応する補正環28の最適補正環位置CPiを求める。補正環28の最適補正環位置CPiは、下記の式(3)を用いて求められる。
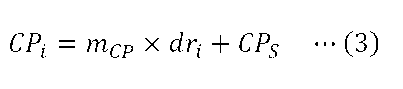
そして、上記の式(1)~(3)を用いて求めた、相対観察深さdriと、補正環28の最適補正環位置CPiと、対物レンズ26の位置Liとの関係を示すリストを作成する。これにより、図10(B)に示すようなパラメータリストLS1を作成することができる。図10(A)に、相対観察深さdri(i=1,2,3,…)と、補正環28の最適補正環位置CPi(i=1,2,3,…)と、対物レンズ26の位置Li(i=1,2,3,…)との位置関係を模式的に示す。
ステップST170において、顕微鏡制御部61は、ステップST160で作成したパラメータリストLS1に従って、補正環28の最適補正環位置CPと、対物レンズ26の位置Lとを変化させることにより、試料TPのzスタック画像を取得する。
第1実施形態によれば、試料TPのzスタック画像を取得する際、z方向(対物レンズ26の光軸方向)の位置が異なる試料TPの断面の画像を取得する毎に、パラメータリストLS1に従って、補正環28の最適補正環位置CPと、対物レンズ26の位置Lとを変化させることができる。そのため、z方向(対物レンズ26の光軸方向)の位置が異なる試料TPの断面の画像を取得する毎に、最適な収差補正を行うことができる。
また、リスト作成部67は、補正環位置決定部65等によって或る一つの観察深さdSで実験的に求めた補正環28の最適補正環位置CPSと、入力部92から入力された試料TPの屈折率nSAと、設定用データテーブルDB1とに基づいて、パラメータリストLS1を構成する補正環28の最適補正環位置CPiを求める。これにより、補正環28の最適補正環位置CPiの全てを実験的に求める必要がなく、パラメータリストLS1を作成する手間を低減させることができる。
なお例えば、実際に試料TPのzスタック画像を取得するときのカバーガラスCGの厚みは、設定用データテーブルDB1を作成する際に光学シミュレーションで設定したカバーガラスCGの厚みと異なっている場合がある。第1実施形態では、光学シミュレーションを行うことにより作成した設定用データテーブルDB1と、或る一つの観察深さdSで実験的に求めた補正環28の最適補正環位置CPSとを用いることにより、他の観察深さ位置での補正環28の最適補正環位置CPiを算出するので、補正環28の最適補正環位置CPiを、光学シミュレーションだけを用いて算出する場合よりも精度よく算出することができる。
[第1実施形態の変形例]
上述の第1実施形態において、試料TPのzスタック画像を取得した後、異なる観察領域で同様の試料TPのzスタック画像を取得することが可能である。この場合、例えば、ステップST110~ST130の処理を省略し、ユーザーが観察領域を変える設定を行った後、ステップST140の処理から開始するようにしてもよい。
上述の第1実施形態において、試料TPのzスタック画像を取得した後、異なる観察領域で同様の試料TPのzスタック画像を取得することが可能である。この場合、例えば、ステップST110~ST130の処理を省略し、ユーザーが観察領域を変える設定を行った後、ステップST140の処理から開始するようにしてもよい。
また、試料TPのzスタック画像を取得した後、異なる観察領域で同様の試料TPのzスタック画像を取得することで、xy方向の位置が異なる複数の観察領域での試料TPのzスタック画像を並べるタイリングを行うことが可能である。そこで、第1実施形態に係る画像取得方法の変形例として、タイリングを行うために試料TPのzスタック画像を取得する場合について説明する。
図13は、第1実施形態の変形例に係る画像取得方法を示すフローチャートである。ステップST110~ステップST140の処理は、図4のステップST110~ステップST140の処理と同様であるので、その説明を省略する。ステップST145において、タイリングを行うための設定の入力を行う。このとき、ユーザーは、x方向に並べる観察領域の数Mxと、y方向に並べる観察領域の数Myを入力する操作を入力部92に対して行う。
ステップST150~ステップST170の処理は、図4のステップST150~ステップST170の処理と同様であるので、その説明を省略する。ステップST171において、顕微鏡制御部61の主制御部62は、ステップST145で設定した全ての観察領域について試料TPのzスタック画像を取得したか否かを判定する。主制御部62が、全ての観察領域について試料TPのzスタック画像を取得していないと判定した場合(ステップST171:No)、ステップST172へ進む。
ステップST172において、主制御部62は、ステージ駆動部12へ制御信号を送信し、この制御信号を受信したステージ駆動部12は、ステージ11を次の観察領域に対応する位置までxy方向に移動させ、ステップST170へ戻る。そして、ステップST170からステップST171までの処理を繰り返す。ステップST171において、主制御部62が全ての観察領域について試料TPのzスタック画像を取得したと判定した場合(ステップST171:Yes)、処理を終了する。以上の処理により、Mx×My個の観察領域での試料TPのzスタック画像を取得することができる。
[第2実施形態]
第2実施形態について説明する。第2実施形態に係る顕微鏡装置は、第1実施形態に係る顕微鏡装置1と同様の構成であり、上述の第1実施形態と同様の構成については、適宜、同じ符号を付してその説明を省略あるいは簡略化する。第2実施形態において、記憶部68(図3を参照)は、設定用データテーブルに加え、L-CP変化比mLCのデータを記憶している。
第2実施形態について説明する。第2実施形態に係る顕微鏡装置は、第1実施形態に係る顕微鏡装置1と同様の構成であり、上述の第1実施形態と同様の構成については、適宜、同じ符号を付してその説明を省略あるいは簡略化する。第2実施形態において、記憶部68(図3を参照)は、設定用データテーブルに加え、L-CP変化比mLCのデータを記憶している。
補正環28を回転させて対物レンズ26の球面収差を変化させると、対物レンズ26の焦点位置PFが光軸方向に変位する場合がある。L-CP変化比mLCとは、補正環28の回転位置の変化量ΔCと、対物レンズ26の補正移動量ΔLとの比である。対物レンズ26の補正移動量ΔLとは、補正環28の回転に伴って変位した対物レンズ26の焦点位置PFを観察深さdの位置まで戻すのに必要な、対物レンズ26の位置Lの変化量である。対物レンズ26の補正移動量ΔLは、下記の式(4)を用いて求められる。
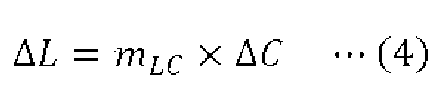
光学シミュレーションを行うことによりL-CP変化比mLCを求めることが可能である。この場合、まず、試料屈折率、浸液屈折率、カバーガラスの厚み、補正環28の任意の回転位置CTなどを設定し、例えば、PSF(点像分布関数)のストレール比を算出することにより、対物レンズ26の焦点位置PFが任意の観察深さdTの位置にあるときの対物レンズ26の位置LT1を求める。次に、補正環28の回転位置を、任意の回転位置CTからΔCだけ変化させた状態で、対物レンズ26の焦点位置PFが任意の観察深さdTの位置にあるときの対物レンズ26の位置LT2を求める。そして、下記の式(5)を用いてL-CP変化比mLCを求める。

また、実験的にL-CP変化比mLCを求めることが可能である。この場合、補正環28の任意の回転位置CT’と任意の観察深さdT’における、対物レンズ26の位置LT1’を求める。次に、補正環28の回転位置を、任意の回転位置CT’からΔCだけ変化させた状態で、補正環28の回転位置を変化させる前と同じ画像が得られる対物レンズ26の位置LT2’を求める。そして、上記の式(5)を用いてL-CP変化比mLCを求める。
第2実施形態に係る設定用データテーブルとして、第1実施形態と同様の設定用データテーブルDB1(図6を参照)が用いられる。第2実施形態においても、予め、光学シミュレーションを行うことにより、複数の屈折率についてCP-d変化比mCPおよびL-d変化比mLを求めることで、設定用データテーブルDB1を作成することが可能である。
なお、光学シミュレーションを行うことによりCP-d変化比mCPを求める際、或る試料TP中の観察深さdにおいて、補正環28の回転位置Cと対物レンズ26の位置Lとの2次元のパラメータ空間内で、結像状態が最良となる補正環28の回転位置および対物レンズ26の位置を求める。具体的には、対物レンズ26の焦点位置PFが観察深さdの位置にあるときの、結像状態が最良となる補正環28の回転位置(最適補正環位置CP)および対物レンズ26の位置を求める。本実施形態では、補正環28の回転位置が変化すると、対物レンズ26の焦点位置PFも変化するため、補正環28の回転位置Cと対物レンズ26の位置Lとの2つのパラメータについて最適値を求める必要がある。結像状態を表す指標として、PSF(点像分布関数)のストレール比を用いることができる。次に、複数の観察深さdについて補正環28の最適補正環位置CPを求めることで、観察深さdに対する補正環28の最適補正環位置CPのプロットを作成する。そして、作成したプロットを例えば直線でフィッティングし、CP-d変化比mCPを求める。
次に、第2実施形態に係る画像取得方法について説明する。第2実施形態に係る画像取得方法では、第1実施形態に係る画像取得方法と異なり、補正環28を回転させて対物レンズ26の球面収差を変化させると、対物レンズ26の焦点位置PFが変化する場合について説明する。この場合、前述したように、補正環28の回転に伴って変位した対物レンズ26の焦点位置PFを観察深さdの位置まで戻すのに必要な、対物レンズ26の補正移動量ΔLを求める。
図14は、第2実施形態に係る画像取得方法を示すフローチャートである。ステップST210において、予め求めておいたL-CP変化比mLCのデータを記憶部68に記憶させる。前述したように、予め、光学シミュレーションを行うことにより、もしくは実験的に、L-CP変化比mLCを求めることが可能である。
ステップST220において、設定用データテーブルDB1を作成して記憶部68に記憶させる。前述したように、予め、光学シミュレーションを行うことにより、複数の屈折率についてCP-d変化比mCPおよびL-d変化比mLを求めることで、第1実施形態と同様の設定用データテーブルDB1を作成する。
ステップST230において、補正環28の最適補正環位置CPを実験的に求める観察深さdSおよび観察領域ROIの位置を設定する。ステップST230では、第1実施形態におけるステップST120と同様の処理が行われる。
ステップST240において、顕微鏡制御部61は、ステップST230で設定した観察深さdSにおける、補正環28の最適補正環位置CPSを求める。ステップST240では、第1実施形態におけるステップST130の場合と同様の操作により、補正環28の最適補正環位置CPSを求める補正環位置決定処理が開始される。
ここで、補正環位置決定処理の詳細について説明する。図16は、第2実施形態に係る補正環位置決定処理の詳細を示すフローチャートである。ステップST241において、顕微鏡制御部61の主制御部62は、補正環駆動部55へ制御信号を送信し、この制御信号を受信した補正環駆動部55は、補正環28を初期状態の回転位置(初期補正環位置CB)へ回転移動させる。また、主制御部62は、上記の式(4)を用いて、このときの補正環28の回転位置の変化量ΔCに応じた、対物レンズ26の補正移動量ΔLを求める。主制御部62は、対物レンズ駆動部56へ制御信号を送信し、この制御信号を受信した対物レンズ駆動部56は、主制御部62で求めた補正移動量ΔLだけ、対物レンズ26を移動させる。
ステップST242において、顕微鏡制御部61は、試料TPの画像を1回または複数回取得する。ステップST242では、第1実施形態におけるステップST132と同様の処理が行われる。
ステップST243において、顕微鏡制御部61の評価値算出部64は、ステップST242で生成した試料TPの画像データに基づいて、評価値vを求める。ステップST243では、第1実施形態におけるステップST133と同様の処理が行われる。
ステップST244において、顕微鏡制御部61の主制御部62は、補正環28の回転位置Cを規定回数変えたか否かを判定する。主制御部62が、補正環28の回転位置Cを規定回数変えていないと判定した場合(ステップST244:No)、ステップST245へ進む。ステップST245において、主制御部62は、補正環駆動部55へ制御信号を送信し、この制御信号を受信した補正環駆動部55は、補正環28を所定の回転移動量だけ回転移動させる。また、主制御部62は、対物レンズ駆動部56へ制御信号を送信し、この制御信号を受信した対物レンズ駆動部56は、補正環28の所定の回転移動量(回転位置の変化量ΔC)に応じた補正移動量ΔLだけ、対物レンズ26を移動させ、ステップST242へ戻る。そして、ステップST242からステップST244までの処理を繰り返す。以上の処理により、所定の回転移動量で、補正環28を初期補正環位置CBから規定回数だけ回転移動させたときの、それぞれの補正環28の回転位置での評価値vを求めることができる。
ステップST244において、主制御部62が、補正環28の回転位置Cを規定回数変えたと判定した場合(ステップST244:Yes)、ステップST246へ進む。ステップST246において、顕微鏡制御部61の補正環位置決定部65は、記憶部68に記憶された補正環28の複数の回転位置での評価値vを比較して、評価値vが最大となる補正環28の最適な回転位置を求める。補正環位置決定部65は、求めた補正環28の最適な回転位置のデータを、主制御部62へ出力し、ステップST247へ進む。
ステップST247において、顕微鏡制御部61の主制御部62は、ステップST246で求めた補正環28の最適な回転位置のデータを、実験的に求めた最適補正環位置CPSのデータとして、記憶部68に記憶させて保持する。ステップST248において、主制御部62は、補正環駆動部55へ制御信号を送信し、この制御信号を受信した補正環駆動部55は、補正環28をステップST246で求めた最適補正環位置CPSへ回転移動させる。また、主制御部62は、上記の式(4)を用いて、このときの補正環28の回転位置の変化量ΔCに応じた、対物レンズ26の補正移動量ΔLを求める。主制御部62は、対物レンズ駆動部56へ制御信号を送信し、この制御信号を受信した対物レンズ駆動部56は、主制御部62で求めた補正移動量ΔLだけ、対物レンズ26を移動させる。そして、次の処理(図14のステップST250)に移行する。
ステップST250において、試料TPの屈折率、画像取得パラメータ、画像取得範囲の入力を行う。ステップST250では、第1実施形態におけるステップST140と同様の処理が行われる。
ステップST260において、顕微鏡制御部61のリスト作成部67は、記憶部68に記憶された設定用データテーブルDB1(図6を参照)と、ステップST250で入力された屈折率nSAに基づいて、屈折率nSAに対応するCP-d変化比mCPおよびL-d変化比mLを算出して求める。なお、屈折率nSAと合致する屈折率の値が、設定用データテーブルDB1にない場合、設定用データテーブルDB1における屈折率nSAの近傍の屈折率の値に対して補間を行うことで、CP-d変化比mCPおよびL-d変化比mLを求めるようにしてもよい。
ステップST270において、顕微鏡制御部61のリスト作成部67は、ステップST230で設定した対物レンズ26の位置LSと、ステップST240で求めた補正環28の最適補正環位置CPSと、ステップST250で入力された画像取得範囲(試料TPのzスタック画像の取得枚数N、対物レンズ26の上端位置LTP、対物レンズ26の下端位置LBM)と、ステップST260で求めたCP-d変化比mCPおよびL-d変化比mLに基づいて、共焦点顕微鏡10の設定に関するパラメータリストを作成する。第2実施形態に係るパラメータリストLS2は、図15に示すように、試料TPのzスタック画像を取得する際の、相対観察深さdrと、補正環28の最適補正環位置CPと、補正環28の回転に伴う対物レンズ26の焦点位置PFの変位を補正した対物レンズ26の位置LCとの関係を示すリストである。リスト作成部67は、パラメータリストLS2を作成すると、作成したパラメータリストLS2のデータを、主制御部62へ出力する。
パラメータリストLS2を作成するには、まず、上記の式(1)を用いて、第1実施形態で述べた対物レンズ26の位置Liを求める。次に、上記の式(2)を用いて、対物レンズ26が位置Liに位置するときの相対観察深さdriを求める。次に、上記の式(3)を用いて、各相対観察深さdriに対応する補正環28の最適補正環位置CPiを求める。
次に、補正環28の各最適補正環位置CPiへの回転に伴う、対物レンズ26の焦点位置PFの変位を補正した対物レンズ26の位置LCiを求める。補正環28の回転に伴う焦点位置PFの変位を補正した対物レンズ26の位置LCiは、下記の式(6)を用いて求められる。

そして、上記の式(1)~(3)および式(6)を用いて求めた、相対観察深さdriと、補正環28の最適補正環位置CPiと、補正環28の回転に伴う焦点位置PFの変位を補正した対物レンズ26の位置LCiとの関係を示すリストを作成する。これにより、図15に示すようなパラメータリストLS2を作成することができる。
ステップST280において、顕微鏡制御部61は、ステップST270で作成したパラメータリストLS2に従って、補正環28の最適補正環位置CPと、補正環28の回転に伴う焦点位置PFの変位を補正した、対物レンズ26の位置LCとを変化させることにより、試料TPのzスタック画像を取得する。
第2実施形態によれば、試料TPのzスタック画像を取得する際、z方向(対物レンズ26の光軸方向)の位置が異なる試料TPの断面の画像を取得する毎に、パラメータリストLS2に従って、補正環28の最適補正環位置CPと、補正環28の回転に伴う焦点位置PFの変位を補正した、対物レンズ26の位置LCとを変化させることができる。そのため、z方向(対物レンズ26の光軸方向)の位置が異なる試料TPの断面の画像を取得する毎に、最適な収差補正を行うことができる。
また、リスト作成部67は、補正環位置決定部65等によって或る一つの観察深さdSで実験的に求めた補正環28の最適補正環位置CPSと、入力部92から入力された試料TPの屈折率nSAと、設定用データテーブルDB1とに基づいて、パラメータリストLS2を構成する、補正環28の最適補正環位置CPiと、補正環28の回転に伴う焦点位置PFの変位を補正した、対物レンズ26の位置LCとを求める。これにより、補正環28の最適補正環位置CPiや対物レンズ26の位置LCの全てを実験的に求める必要がなく、パラメータリストLS2を作成する手間を低減させることができる。
なお例えば、実際に試料TPのzスタック画像を取得するときのカバーガラスCGの厚みは、設定用データテーブルDB1を作成する際に光学シミュレーションで設定したカバーガラスCGの厚みと異なっている場合がある。第2実施形態では、光学シミュレーションを行うことにより作成した設定用データテーブルDB1と、或る一つの観察深さdSで実験的に求めた補正環28の最適補正環位置CPSとを用いることにより、他の観察深さ位置での補正環28の最適補正環位置CPiを算出するので、補正環28の最適補正環位置CPiを、光学シミュレーションだけを用いて算出する場合よりも精度よく算出することができる。
上述の第2実施形態において、試料TPのzスタック画像を取得した後、異なる観察領域で同様の試料TPのzスタック画像を取得することが可能である。この場合、例えば、ステップST210~ST240の処理を省略し、ユーザーが観察領域を変える設定を行った後、ステップST250の処理から開始するようにしてもよい。また、第1実施形態の変形例で述べた画像取得方法と同様にして、試料TPのzスタック画像を取得した後、異なる観察領域で同様の試料TPのzスタック画像を取得することで、xy方向の位置が異なる複数の観察領域での試料TPのzスタック画像を並べるタイリングを行うことが可能である。
[第3実施形態]
第3実施形態について説明する。第3実施形態に係る顕微鏡装置は、第1実施形態に係る顕微鏡装置1と同様の構成であり、上述の第1実施形態と同様の構成については、適宜、同じ符号を付してその説明を省略あるいは簡略化する。図17は、第3実施形態に係る顕微鏡制御部361と情報処理装置90との間の電気的な接続を示すブロック図である。第3実施形態に係る顕微鏡制御部361は、収差の補正量算出決定部としても機能し、補正環28の最適な回転位置と、対物レンズ26の最適な位置を求める。顕微鏡制御部361は、主制御部62と、画像生成部63と、評価値算出部64と、補正環位置決定部65と、z位置算出部366と、リスト作成部67と、記憶部68とを有する。
第3実施形態について説明する。第3実施形態に係る顕微鏡装置は、第1実施形態に係る顕微鏡装置1と同様の構成であり、上述の第1実施形態と同様の構成については、適宜、同じ符号を付してその説明を省略あるいは簡略化する。図17は、第3実施形態に係る顕微鏡制御部361と情報処理装置90との間の電気的な接続を示すブロック図である。第3実施形態に係る顕微鏡制御部361は、収差の補正量算出決定部としても機能し、補正環28の最適な回転位置と、対物レンズ26の最適な位置を求める。顕微鏡制御部361は、主制御部62と、画像生成部63と、評価値算出部64と、補正環位置決定部65と、z位置算出部366と、リスト作成部67と、記憶部68とを有する。
画像生成部63は、検出部41から入力された光の検出信号に基づいて、試料TPの画像を生成する。画像生成部63は、生成した試料TPの画像データを、評価値算出部64、z位置算出部366、記憶部68のうち少なくともいずれかへ出力する。例えば、画像生成部63は、記憶部68で記憶される試料TPの画像を生成すると、生成した試料TPの画像データを記憶部68へ出力する。画像生成部63は、評価値算出部64による処理で用いられる試料TPの画像を生成すると、生成した試料TPの画像データを評価値算出部64へ出力する。画像生成部63は、z位置算出部366による処理で用いられる試料TPの画像を生成すると、生成した試料TPの画像データをz位置算出部366へ出力する。
z位置算出部366は、画像生成部63から入力された試料TPの評価用zスタック画像データと、記憶部68に記憶された試料TPの基準画像データに基づいて、対物レンズ26の最適な位置を求める。z位置算出部366は、求めた対物レンズ26の最適な位置のデータを、主制御部62を介して記憶部68へ出力する。以降、対物レンズ26の最適な位置を最適対物レンズ位置LPと称することがある。
第3実施形態において、記憶部68は、設定用データテーブルと、試料TPの基準画像データを記憶する。試料TPの基準画像データは、z位置算出部366により対物レンズ26の最適対物レンズ位置LPを求める際に用いられる。第3実施形態に係る設定用データテーブルDB3は、図20に示すように、試料TPの屈折率nと、CP-d変化比mCPと、LP-d変化比mLPと、L’-d変化比mL’との関係を示すデータテーブルである。
ここで、CP-d変化比mCPとは、第1実施形態でも述べたように、観察深さdの変化量と、観察深さdの変化に伴う補正環28の最適補正環位置CPの変化量との比である。例えば、図19(A)に示すように、試料TPの屈折率がn1の場合における観察深さdと最適補正環位置CPとの関係は直線fCPn1で表すことができる。試料TPの屈折率がn2の場合における観察深さdと最適補正環位置CPとの関係は直線fCPn2で表すことができる。このとき、試料TPの屈折率がn1の場合におけるCP-d変化比mCPは、直線fCPn1の傾きとして求まる。試料TPの屈折率がn2の場合におけるCP-d変化比mCPは、直線fCPn1の傾きとは異なる直線fCPn2の傾きとして求まる。
LP-d変化比mLPとは、観察深さdの変化量と、観察深さdの変化に伴う対物レンズ26の最適対物レンズ位置LPの変化量との比である。対物レンズ26の最適対物レンズ位置LPとは、補正環28の回転に伴う焦点位置PFの変位を補正した対物レンズ26の最適な位置である(図21を参照)。例えば、図19(B)に示すように、試料TPの屈折率がn1の場合における観察深さdと対物レンズ26の最適対物レンズ位置LPとの関係は直線fLPn1で表すことができる。試料TPの屈折率がn2の場合における観察深さdと対物レンズ26の最適対物レンズ位置LPとの関係は直線fLPn2で表すことができる。このとき、試料TPの屈折率がn1の場合におけるLP-d変化比mLPは、直線fLPn1の傾きとして求まる。試料TPの屈折率nがn2の場合におけるLP-d変化比mLPは、直線fLPn1の傾きとは異なる直線fLPn2の傾きとして求まる。
L’-d変化比mL’とは、観察深さdの変化量と、観察深さdの変化に伴う対物レンズ26の位置L’の変化量との比である。対物レンズ26の位置L’とは、補正環28の回転位置Cが一定であると仮定した場合における、対物レンズ26の焦点位置PFが観察深さdの位置にあるときの対物レンズ26の位置である。例えば、図19(C)に示すように、試料TPの屈折率がn1の場合における観察深さdと対物レンズ26の位置L’との関係は直線fL’n1で表すことができる。試料TPの屈折率がn2の場合における観察深さdと対物レンズ26の位置L’との関係は直線fL’n2で表すことができる。このとき、試料TPの屈折率がn1の場合におけるL’-d変化比mL’は、直線fL’n1の傾きとして求まる。試料TPの屈折率nがn2の場合におけるL’-d変化比mL’は、直線fL’n1の傾きとは異なる直線fL’n2の傾きとして求まる。
なお、図21に示すように、観察深さがdiから観察深さdi+1まで変位する際、補正環28の回転位置をCPiからCPi+1まで変位させる場合には、対物レンズ26の位置をLPiからLPi+1まで変位させるものとする。図22に示すように、観察深さがdiから観察深さdi+1まで変位する際、補正環28の回転位置を一定の位置(C=CCST)に固定する場合には、対物レンズ26の位置をL’iからL’i+1まで変位させるものとする。補正環28の回転位置が変位する場合の対物レンズ26の変位量(Li+1-Li)は、補正環28の回転位置が一定である場合の対物レンズ26の変位量(L’i+1-L’i)とは異なる。
予め、光学シミュレーションを行うことにより、複数の屈折率について、CP-d変化比mCP、LP-d変化比mLP、およびL’-d変化比mL’を求めることで、設定用データテーブルDB3を作成することが可能である。具体的は、光学シミュレーションを行うことによりCP-d変化比mCPおよびLP-d変化比mLPを求める。このときまず、或る試料TP中の観察深さdにおいて、補正環28の回転位置Cと対物レンズ26の位置Lとの2次元のパラメータ空間内で、結像状態が最良となる補正環28の回転位置および対物レンズ26の位置を求める。具体的には、試料屈折率、浸液屈折率、カバーガラスの厚み、試料TP中の観察深さdなどを設定し、結像状態が最良となる補正環28の回転位置(最適補正環位置CP)および対物レンズ26の位置(最適対物レンズ位置LP)を求める。結像状態を表す指標として、PSF(点像分布関数)のストレール比を用いることができる。
次に、複数の観察深さdについて補正環28の最適補正環位置CPを求めることで、観察深さdに対する補正環28の最適補正環位置CPのプロットを作成する。そして、作成したプロットを例えば直線でフィッティングし、CP-d変化比mCPを求める。また、複数の観察深さdについて対物レンズ26の最適対物レンズ位置LPを求めることで、観察深さdに対する対物レンズ26の最適対物レンズ位置LPのプロットを作成する。そして、作成したプロットを例えば直線でフィッティングし、LP-d変化比mLPを求める。
続いて、光学シミュレーションを行うことによりL’-d変化比mL’を求める。このときまず、試料屈折率、浸液屈折率、カバーガラスの厚み、試料TP中の観察深さdなどを設定し、補正環28を任意の固定回転位置CCSTで固定し、対物レンズ26の位置Lについての1次元のパラメータで、結像状態が最良となる対物レンズ26の位置L’を求める。結像状態を表す指標として、PSF(点像分布関数)のストレール比を用いることができる。次に、複数の観察深さdについて対物レンズ26の位置L’を求めることで、観察深さdに対する対物レンズ26の位置L’のプロットを作成する。そして、作成したプロットを例えば直線でフィッティングし、L’-d変化比mL’を求める。補正環28の任意の固定回転位置CCSTには、例えば、ユーザーが最も高い頻度で観察を行うと予想される試料TP中の観察深さdにおける、補正環28の最適な回転位置が用いられてもよい。複数の試料屈折率を設定してCP-d変化比mCP、LP-d変化比mLP、L’-d変化比mL’を求めることで、試料屈折率毎にCP-d変化比mCP、LP-d変化比mLP、L’-d変化比mL’を求める。
次に、第3実施形態に係る画像取得方法について説明する。第3実施形態に係る画像取得方法では、まず、或る一つの観察深さdの位置に対物レンズ26の焦点位置PFがあるときの、対物レンズ26の位置Lを求める。次に、当該観察深さdにおける補正環28の最適補正環位置CPおよび対物レンズ26の最適対物レンズ位置LPを実験的に求める。そして、他の観察深さdにおける補正環28の最適補正環位置CPおよび対物レンズ26の最適対物レンズ位置LPを、実験的にではなく、ユーザーの操作により入力される試料TPの屈折率に基づいて求める。
図18は、第3実施形態に係る画像取得方法を示すフローチャートである。なお、顕微鏡制御部361は、例えばコンピュータシステムを含む。顕微鏡制御部361は、記憶部68に記憶されている制御プログラムを読み出し、この制御プログラムに従って各種の処理を実行する。ステップST310において、設定用データテーブルDB3を作成して記憶部68に記憶させる。前述したように、予め、光学シミュレーションを行うことにより、複数の屈折率について、CP-d変化比mCP、LP-d変化比mLP、およびL’-d変化比mL’を求めることで、設定用データテーブルDB3を作成する。
ステップST320において、補正環28の最適補正環位置CPおよび対物レンズ26の最適対物レンズ位置LPを実験的に求める観察深さdSおよび観察領域ROIの位置を設定する。ステップST320では、第1実施形態におけるステップST120と同様の処理が行われる。
ステップST330において、顕微鏡制御部361は、ステップST320で設定した観察深さdSにおける、補正環28の最適補正環位置CPSと、対物レンズ26の最適対物レンズ位置LPSを求める。ステップST330では、第1実施形態におけるステップST130の場合と同様の操作により、補正環28の最適補正環位置CPSおよび対物レンズ26の最適対物レンズ位置LPSを求める補正環位置決定処理が開始される。
ここで、補正環位置決定処理の詳細について説明する。図23は、第3実施形態に係る補正環位置決定処理の詳細を示すフローチャートである。ステップST331において、顕微鏡制御部361は、観察深さdSを設定したときの補正環28の回転位置および対物レンズ26の位置LSについての試料TPの画像を取得する。このステップST331で取得する試料TPの画像を、試料TPの基準画像とする。以降、観察深さdSを設定したときの補正環28の回転位置を基準補正環位置CAと称し、対物レンズ26の位置LSを基準対物レンズ位置LAと称することがある。顕微鏡制御部361は、光源ユニット16からレーザー光(励起光)射出させる。また、顕微鏡制御部361の主制御部62は、検出部41へ制御信号を送信し、この制御信号を受信した検出部41は、試料TPからの光(蛍光)の検出信号を顕微鏡制御部361の画像生成部63へ出力する。画像生成部63は、検出部41から入力された光の検出信号(前述の1画素分のデータ)をスキャナ25による2次元的な走査と同期して並べる処理を行うことで、試料TPの基準画像を生成する。画像生成部63は、生成した試料TPの基準画像データを記憶部68へ出力する。
ステップST332において、顕微鏡制御部361は、補正環28を初期状態の回転位置へ回転移動させ、対物レンズ26を初期状態の位置へz方向に移動させる。以降、初期状態の補正環28の回転位置を初期状態の補正環位置CA0と称し、初期状態の対物レンズ26の位置を初期状態の対物レンズ位置LA0と称することがある。その後、顕微鏡制御部361は、補正環28の回転位置を初期状態の補正環位置CA0から所定の回転移動量ずつ変化させ、対物レンズ26の位置を初期状態の対物レンズ位置LA0から所定の移動量ずつ変化させた、試料TPの複数種類の評価用画像を取得する。なお、各種類の評価用画像を、1回取得してもよく、複数回取得してもよい。このとき、顕微鏡制御部361の主制御部62は、補正環駆動部55へ制御信号を送信し、この制御信号を受信した補正環駆動部55は、補正環28を初期状態の補正環位置CA0から所定の回転移動量ずつ回転移動させる。主制御部62は、対物レンズ駆動部56へ制御信号を送信し、この制御信号を受信した対物レンズ駆動部56は、対物レンズ26を初期状態の対物レンズ位置LA0から所定の移動量ずつz方向に移動させる。それぞれの補正環28の回転位置および対物レンズ26の位置において、顕微鏡制御部361は、光源ユニット16からレーザー光(励起光)射出させる。また、顕微鏡制御部361の主制御部62は、検出部41へ制御信号を送信し、この制御信号を受信した検出部41は、試料TPからの光(蛍光)の検出信号を顕微鏡制御部361の画像生成部63へ出力する。画像生成部63は、検出部41から入力された光の検出信号(前述の1画素分のデータ)をスキャナ25による2次元的な走査と同期して並べる処理を行うことで、試料TPの評価用画像を生成する。画像生成部63は、生成した試料TPの評価用画像データを評価値算出部64へ出力する。
ステップST333において、顕微鏡制御部361の評価値算出部64は、記憶部68に記憶された試料TPの基準画像データと、ステップST332で生成した試料TPの複数種類の評価用画像データとの相関値をそれぞれ求める。評価値算出部64は、補正環28の回転位置が同じで対物レンズ26の位置が異なる試料TPの評価用画像のうち、相関値が最大となる対物レンズ26の位置での評価用画像を、補正環28の各回転位置での評価用画像として選択する。評価値算出部64は、補正環28の各回転位置について、選択した試料TPの評価用画像データに基づいて、評価値vを求める。評価値算出部64は、求めた評価値vのデータおよび、このときの補正環28の回転位置Cのデータを記憶部68に記憶させて保持する。評価値vとして、第1実施形態と同様のものを用いることができる。
図24は、補正環28の回転位置Cを変えて求まる評価値vの一例を示すグラフである。図24に示すように、補正環28の回転位置Cを変える規定回数を初期状態の補正環位置CA0から4回とした場合、まず、顕微鏡制御部361は、試料TPの基準画像TI(CA)を取得する。これに加え、顕微鏡制御部361は、補正環28を基準補正環位置CAから所定の初期回転量だけ回転移動させた初期状態の補正環位置CA0において、対物レンズ26の位置を初期状態の対物レンズ位置LA0および4つの位置LA1~LA4に変位させた試料TPの評価用画像を取得する。評価値算出部64は、これらの評価用画像のうち、図24の左側から1番目の△印で示した、相関値が最大となる初期状態の対物レンズ位置LA0での評価用画像を、初期状態の補正環位置CA0での評価用画像TI(CA0)として選択する。
顕微鏡制御部361は、補正環28を初期状態の補正環位置CA0から第1の回転量だけ回転移動させた回転位置CA1において、対物レンズ26の位置を初期状態の対物レンズ位置LA0および4つの位置LA1~LA4に変位させた試料TPの評価用画像を取得する。評価値算出部64は、これらの評価用画像のうち、図24の左側から2番目の△印で示した、相関値が最大となる対物レンズ26の位置LA1での評価用画像を、補正環28の回転位置CA1での評価用画像TI(CA1)として選択する。顕微鏡制御部361は、補正環28を初期状態の補正環位置CA0から第2の回転量だけ回転移動させた回転位置CA2において、対物レンズ26の位置を初期状態の対物レンズ位置LA0および4つの位置LA1~LA4に変位させた試料TPの評価用画像を取得する。評価値算出部64は、これらの評価用画像のうち、図24の左側から3番目の△印で示した、相関値が最大となる対物レンズ26の位置LA2での評価用画像を、補正環28の回転位置CA2での評価用画像TI(CA2)として選択する。
顕微鏡制御部361は、補正環28を初期状態の補正環位置CA0から第3の回転量だけ回転移動させた回転位置CA3において、対物レンズ26の位置を初期状態の対物レンズ位置LA0および4つの位置LA1~LA4に変位させた試料TPの評価用画像を取得する。評価値算出部64は、これらの評価用画像のうち、図24の左側から4番目の△印で示した、相関値が最大となる対物レンズ26の位置LA3での評価用画像を、補正環28の回転位置CA3での評価用画像TI(CA3)として選択する。顕微鏡制御部361は、補正環28を初期状態の補正環位置CA0から第4の回転量だけ回転移動させた回転位置CA4において、対物レンズ26の位置を初期状態の対物レンズ位置LA0および4つの位置LA1~LA4に変位させた試料TPの評価用画像を取得する。評価値算出部64は、これらの評価用画像のうち、図24の左側から5番目の△印で示した、相関値が最大となる対物レンズ26の位置LA4での評価用画像を、補正環28の回転位置CA4での評価用画像TI(CA4)として選択する。評価値算出部64は、選択した評価用画像データに基づいて、初期状態の補正環位置CA0および、初期状態の補正環位置CA0から1~4回だけ移動させた回転位置CA1~CA4での評価値vを求めることができる。
ステップST334において、顕微鏡制御部361の補正環位置決定部65は、記憶部68に記憶された補正環28の複数の回転位置での評価値vに基づいて、補正環28の最適補正環位置CPSを求める。具体的には、補正環位置決定部65は、補正環28の複数の回転位置に対する評価値vのプロットを作成する。そして、補正環位置決定部65は、図24に示すように、このプロットに対して補間または関数近似を行うことで、評価値vが最大となる補正環28の最適補正環位置CPSを求める。補正環位置決定部65は、求めた補正環28の最適補正環位置CPSのデータを、主制御部62へ出力する。補間を行う方法として、例えば、補正環28の複数の回転位置CA0~CA4に対する評価値vのプロットに対しラグランジュ補間やスプライン補間をする方法がある。関数近似を行う方法として、例えば、最小二乗法により、補正環28の複数の回転位置CA0~CA4に対する評価値vのプロットを二次曲線やガウス関数にフィッティングする方法がある。
ステップST335において、顕微鏡制御部361の主制御部62は、補正環駆動部55へ制御信号を送信し、この制御信号を受信した補正環駆動部55は、補正環28をステップST334で求めた最適補正環位置CPSへ回転移動させる。
ステップST336において、顕微鏡制御部361は、補正環28が最適補正環位置CPSに回転移動した状態で、対物レンズ26の位置Lを変化させた、試料TPの評価用zスタック画像を取得する。このとき、顕微鏡制御部361の主制御部62は、対物レンズ駆動部56へ制御信号を送信し、この制御信号を受信した対物レンズ駆動部56は、対物レンズ26をz方向に移動させる。それぞれの対物レンズ26の位置において、顕微鏡制御部361は、光源ユニット16からレーザー光(励起光)射出させる。また、顕微鏡制御部361の主制御部62は、検出部41へ制御信号を送信し、この制御信号を受信した検出部41は、試料TPからの光(蛍光)の検出信号を顕微鏡制御部361の画像生成部63へ出力する。画像生成部63は、検出部41から入力された光の検出信号(前述の1画素分のデータ)をスキャナ25による2次元的な走査と同期して並べる処理を行うことで、試料TPの評価用zスタック画像を生成する。画像生成部63は、生成した試料TPの評価用zスタック画像データをz位置算出部366へ出力する。
ステップST337において、顕微鏡制御部361のz位置算出部366は、記憶部68に記憶された試料TPの基準画像データと、ステップST336で生成した試料TPの評価用zスタック画像データとの相関値をそれぞれ求める。z位置算出部366は、試料TPの評価用zスタック画像のうち、相関値が最大となる画像が得られる対物レンズ26の位置を、最適対物レンズ位置LPSとして求める。なお、z位置算出部366は、対物レンズ26の複数の位置に対する相関値のプロットを作成してもよい。そして、z位置算出部366は、このプロットに対して補間または関数近似を行うことで、相関値が最大となる対物レンズ26の位置を、最適対物レンズ位置LPSとして求めるようにしてもよい。
z位置算出部366は、求めた対物レンズ26の最適対物レンズ位置LPSのデータを、主制御部62へ出力する。主制御部62は、補正環位置決定部65から入力された最適補正環位置CPSのデータおよび、z位置算出部366から入力された最適対物レンズ位置LPSのデータを、記憶部68に記憶させて保持する。そして、次の処理(図18のステップST340)に移行する。以上の処理により、補正環28を回転させると、対物レンズ26の焦点位置PFが変化する場合でも、ステップST320で設定した観察深さdSにおいて、結像状態が最良となる補正環28の最適補正環位置CPおよび対物レンズ26の最適対物レンズ位置LPを求めることができる。
ステップST340において、試料TPの屈折率、画像取得パラメータ、画像取得範囲の入力を行う。ステップST340では、第1実施形態におけるステップST140と同様の処理が行われる。
ステップST350において、顕微鏡制御部361のリスト作成部67は、記憶部68に記憶された設定用データテーブルDB3(図20を参照)と、ステップST340で入力された屈折率nSAに基づいて、屈折率nSAに対応する、CP-d変化比mCP、LP-d変化比mLP、およびL’-d変化比mL’を算出して求める。なお、屈折率nSAと合致する屈折率の値が、設定用データテーブルDB3にない場合、設定用データテーブルDB3における屈折率nSAの近傍の屈折率の値に対して補間を行うことで、CP-d変化比mCP、LP-d変化比mLP、およびL’-d変化比mL’を求めるようにしてもよい。
ステップST360において、顕微鏡制御部361のリスト作成部67は、ステップST320で設定した対物レンズ26の位置LSと、ステップST330で求めた補正環28の最適補正環位置CPSおよび対物レンズ26の最適対物レンズ位置LPSと、ステップST340で入力された画像取得範囲(試料TPのzスタック画像の取得枚数N、対物レンズ26の上端位置LTP、対物レンズ26の下端位置LBM)と、ステップST350で求めた、CP-d変化比mCP、LP-d変化比mLP、およびL’-d変化比mL’に基づいて、共焦点顕微鏡10の設定に関するパラメータリストを作成する。第3実施形態に係るパラメータリストLS3は、図25に示すように、試料TPのzスタック画像を取得する際の、相対観察深さdrと、補正環28の最適補正環位置CPと、対物レンズ26の最適対物レンズ位置LPとの関係を示すリストである。リスト作成部67は、パラメータリストLS3を作成すると、作成したパラメータリストLS3のデータを、主制御部62へ出力する。
パラメータリストLS3を作成するには、まず、試料TPのzスタック画像を取得する際の、相対観察深さの下端深さdrBMおよび相対観察深さの上端深さdrTPを求める。相対観察深さの下端深さdrBMは、下記の式(7)を用いて求められる。式(7)では、ステップST340で設定した対物レンズ26の下端位置LBMを相対観察深さの下端深さdrBMへ変換するため、対物レンズ26の下端位置LBMから基準となる相対観察深さ(dr=0)での対物レンズ26の最適対物レンズ位置LPSを引いた上で、補正環28の回転位置が一定の場合のL’-d変化比mL’で割る。L’-d変化比mL’を用いる理由は、対物レンズ26の最適対物レンズ位置LPSおよび対物レンズ26の下端位置LBMがそれぞれ、ステップST330およびステップST340において同じ最適補正環位置CPSで設定されたためである。
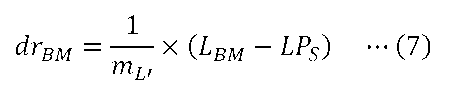
相対観察深さの上端深さdrTPは、上記の式(7)と同様に、下記の式(8)を用いて求められる。
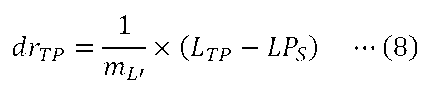
次に、試料TPのzスタック画像を取得する際に変化させる相対観察深さdriを求める。ここで、iは、1~N(試料TPのzスタック画像の取得枚数N)までの整数である。相対観察深さdri(i番目に取得される画像の相対観察深さ位置)は、下記の式(9)を用いて求められる。式(9)では、i番目の相対観察深さを求めるため、相対観察深さの下端深さdrBMに、zスタック画像の取得ステップ幅と画像取得インデックス(i-1)とを掛けたものを加える。

次に、各相対観察深さdriに対応する補正環28の最適補正環位置CPiおよび対物レンズ26の最適対物レンズ位置LPiを求める。補正環28の最適補正環位置CPiは、下記の式(10)を用いて求められる。式(10)を用いる理由は、相対観察深さdriと、その深さでの補正環28の最適補正環位置CPiとの関係が、CP-d変化比mCPと、基準となる相対観察深さ(dr=0)での補正環28の最適補正環位置CPSで決まるためである。

対物レンズ26の最適対物レンズ位置LPiは、下記の式(11)を用いて求められる。式(11)を用いる理由は、相対観察深さdriと、その深さでの対物レンズ26の最適対物レンズ位置LPiとの関係が、LP-d変化比mLPと、基準となる相対観察深さ(dr=0)での対物レンズ26の最適対物レンズ位置LPSで決まるためである。

そして、上記の式(7)~(11)を用いて求めた、相対観察深さdriと、補正環28の最適補正環位置CPiと、対物レンズ26の最適対物レンズ位置LPiとの関係を示すリストを作成する。これにより、図25に示すようなパラメータリストLS3を作成することができる。
ステップST370において、顕微鏡制御部361は、ステップST360で作成したパラメータリストLS3に従って、補正環28の最適補正環位置CPと、対物レンズ26の最適対物レンズ位置LPとを変化させることにより、試料TPのzスタック画像を取得する。
ステップST380において、顕微鏡制御部361は、ステップST370で取得した試料TPのzスタック画像データを情報処理装置90の入出力制御部91へ出力する。入出力制御部91は、顕微鏡制御部361から入力されたzスタック画像データに基づいて、試料TPの3次元的な画像を生成し、表示部93に表示させる。以降、表示部93に表示される試料TPの3次元的な画像を、単に3次元画像T3D1~T3D3(図26を参照)と称することがある。図26に示すように、入出力制御部91は、3種類の3次元画像T3D1~T3D3のうちいずれか一つに選択的に切り替えて、表示部93に表示させることが可能である。
第1の3次元画像T3D1は、z方向の座標軸を相対観察深さdriに対応する座標軸とした試料TPの3次元的な画像である。ユーザーが、図26に示すGUI(画像選択画面)を利用して、表示zスケールとして「観察深さ」を選択する操作を入力部92に対して行うと、入力部92は、この操作に対応する入力データを、情報処理装置90の入出力制御部91へ出力する。そして、入出力制御部91は、第1の3次元画像T3D1を表示部93に表示させる。
第2の3次元画像T3D2は、z方向の座標軸を対物レンズ26の最適対物レンズ位置LPiに対応する座標軸とした試料TPの3次元的な画像である。ユーザーが、図26に示すGUIを利用して、表示zスケールとして「対物レンズの位置」を選択する操作を入力部92に対して行うと、入力部92は、この操作に対応する入力データを、情報処理装置90の入出力制御部91へ出力する。そして、入出力制御部91は、第2の3次元画像T3D2を表示部93に表示させる。
第3の3次元画像T3D3は、z方向の座標軸を対物レンズ26の位置L’iに対応する座標軸とした試料TPの3次元的な画像である。ユーザーが、図26に示すGUIを利用して、表示zスケールとして「補正環固定時の対物レンズの位置」を選択する操作を入力部92に対して行うと、入力部92は、この操作に対応する入力データを、情報処理装置90の入出力制御部91へ出力する。そして、入出力制御部91は、第3の3次元画像T3D3を表示部93に表示させる。対物レンズ26の位置L’iは、例えば、下記の式(12)を用いて求められる。式(12)では、相対観察深さdriを、補正環28の回転位置が一定の場合の対物レンズ26の位置L’iへ変換するため、補正環28の回転位置が一定の場合のL’-d変化比mL’と相対観察深さdriとを掛けた上で、基準となる相対観察深さ(dr=0)での対物レンズ26の最適対物レンズ位置LPSを加える。

第3実施形態によれば、試料TPのzスタック画像を取得する際、z方向(対物レンズ26の光軸方向)の位置が異なる試料TPの断面の画像を取得する毎に、パラメータリストLS3に従って、補正環28の最適補正環位置CPと、補正環28の回転に伴う焦点位置PFの変位を補正した、対物レンズ26の最適対物レンズ位置LPとを変化させることができる。そのため、z方向(対物レンズ26の光軸方向)の位置が異なる試料TPの断面の画像を取得する毎に、最適な収差補正を行うことができる。
また、リスト作成部67は、補正環位置決定部65等によって或る一つの観察深さdSで実験的に求めた補正環28の最適補正環位置CPSおよび対物レンズ26の最適対物レンズ位置LPSと、入力部92から入力された試料TPの屈折率nSAと、設定用データテーブルDB3とに基づいて、パラメータリストLS3を構成する、補正環28の最適補正環位置CPiと、補正環28の回転に伴う焦点位置PFの変位を補正した、対物レンズ26の最適対物レンズ位置LPとを求める。これにより、補正環28の最適補正環位置CPiや対物レンズ26の最適対物レンズ位置LPの全てを実験的に求める必要がなく、パラメータリストLS3を作成する手間を低減させることができる。
なお例えば、実際に試料TPのzスタック画像を取得するときのカバーガラスCGの厚みは、設定用データテーブルDB3を作成する際に光学シミュレーションで設定したカバーガラスCGの厚みと異なっている場合がある。第3実施形態では、光学シミュレーションを行うことにより作成した設定用データテーブルDB3と、或る一つの観察深さdSで実験的に求めた補正環28の最適補正環位置CPSとを用いることにより、他の観察深さ位置での補正環28の最適補正環位置CPiを算出するので、補正環28の最適補正環位置CPiを、光学シミュレーションだけを用いて算出する場合よりも精度よく算出することができる。
上述の第3実施形態において、試料TPのzスタック画像を取得した後、異なる観察領域で同様の試料TPのzスタック画像を取得することが可能である。この場合、例えば、ステップST310~ST330の処理を省略し、ユーザーが観察領域を変える設定を行った後、ステップST340の処理から開始するようにしてもよい。また、第1実施形態の変形例で述べた画像取得方法と同様にして、試料TPのzスタック画像を取得した後、異なる観察領域で同様の試料TPのzスタック画像を取得することで、xy方向の位置が異なる複数の観察領域での試料TPのzスタック画像を並べるタイリングを行うことが可能である。
上述の第3実施形態において、情報処理装置90の入出力制御部91は、3種類の3次元画像T3D1~T3D3のうちいずれか一つに選択的に切り替えて、表示部93に表示させることが可能であるが、これに限られるものではない。例えば、入出力制御部91は、第3の3次元画像T3D3を用いずに、2種類の3次元画像T3D1~T3D2のうちいずれか一つに選択的に切り替えて、表示部93に表示させるようにしてもよい。
上述の第3実施形態に係る補正環位置決定処理において、顕微鏡制御部361の評価値算出部64は、補正環28の回転位置が同じで対物レンズ26の位置が異なる試料TPの評価用画像のうち、相関値が最大となる対物レンズ26の位置での評価用画像を、補正環28の各回転位置での評価用画像として選択する。そして、評価値算出部64は、補正環28の各回転位置について、選択した試料TPの評価用画像データに基づいて、評価値vを求める。第2実施形態に係る補正環位置決定処理においても、上述の第3実施形態と同様にして、補正環28の複数の回転位置での評価用画像を選択し、選択した評価用画像データに基づいて、評価値vを求めることが可能である。
[第4実施形態]
第4実施形態について説明する。第4実施形態に係る顕微鏡装置は、第3実施形態に係る顕微鏡装置と同様の構成であり、上述の第1実施形態および第3実施形態と同様の構成については、適宜、同じ符号を付してその説明を省略あるいは簡略化する。
第4実施形態について説明する。第4実施形態に係る顕微鏡装置は、第3実施形態に係る顕微鏡装置と同様の構成であり、上述の第1実施形態および第3実施形態と同様の構成については、適宜、同じ符号を付してその説明を省略あるいは簡略化する。
第4実施形態に係る画像取得方法について説明する。図27は、第4実施形態に係る画像取得方法を示すフローチャートである。ステップST401において、設定用データテーブルDB3を作成して記憶部68に記憶させる。ステップST401では、第3実施形態におけるステップST310と同様の処理が行われる。
ステップST402において、補正環28の最適補正環位置CPおよび対物レンズ26の最適対物レンズ位置LPを実験的に求める観察深さdSおよび観察領域ROIの位置を設定する。ステップST402では、第3実施形態におけるステップST320、すなわち、第1実施形態におけるステップST120と同様の処理が行われる。
ステップST403において、顕微鏡制御部361は、ステップST402で設定した観察深さdSにおける、補正環28の最適補正環位置CPSと、対物レンズ26の最適対物レンズ位置LPSを求める。ステップST403では、第3実施形態におけるステップST330の場合と同様の補正環位置決定処理が行われる。
ステップST404において、試料TPの屈折率の探索範囲、画像取得パラメータ、画像取得範囲の入力を行う。画像取得パラメータおよび画像取得範囲については、第1実施形態におけるステップST140の場合と同様の入力操作が行われる。試料TPの屈折率の探索範囲についても、図28に示すように、ユーザーは、表示部93に表示されるGUI(設定入力画面)を利用して、試料TPの屈折率の探索範囲を入力する操作を入力部92に対して行う。図28では例えば、「試料屈折率探索範囲」として、最小値「1.34」および最大値「1.40」が直接入力されており、この場合、探索を行う屈折率の最小値は1.34となり、探索を行う屈折率の最大値は1.40となる。ユーザーが、試料TPの屈折率の探索範囲を入力する操作や、画像取得パラメータを入力する操作、画像取得範囲を入力する操作を入力部92に対して行うと、入力部92は、これらの操作に対応する入力データを、情報処理装置90の入出力制御部91を介して共焦点顕微鏡10の顕微鏡制御部361へ出力する。
ステップST405において、顕微鏡制御部361の主制御部62は、ステップST404で入力された試料TPの屈折率の探索範囲の中から、探索を行う屈折率の値を設定する。探索を行う最初の屈折率の値を、探索範囲における最小の屈折率の値に設定し、探索を行う最後の屈折率の値を、探索範囲における最大の屈折率の値に設定してもよい。探索を行う最初の屈折率の値を、探索範囲における最大の屈折率の値に設定し、探索を行う最後の屈折率の値を、探索範囲における最小の屈折率の値に設定してもよい。
ステップST406において、顕微鏡制御部361のリスト作成部67は、第3実施形態と同様に、記憶部68に記憶された設定用データテーブルDB3と、ステップST405で設定した屈折率に基づいて、探索を行う屈折率に対応する、CP-d変化比mCP、LP-d変化比mLP、およびL’-d変化比mL’を算出して求める。
ステップST407において、顕微鏡制御部361のリスト作成部67は、ステップST402で設定した対物レンズ26の位置LSと、ステップST403で求めた補正環28の最適補正環位置CPSおよび対物レンズ26の最適対物レンズ位置LPSと、ステップST404で入力された画像取得範囲(試料TPのzスタック画像の取得枚数N、対物レンズ26の上端位置LTP、対物レンズ26の下端位置LBM)と、ステップST406で求めた、CP-d変化比mCP、LP-d変化比mLP、およびL’-d変化比mL’に基づいて、屈折率探索用のパラメータリストを作成する。屈折率探索用のパラメータリストは、第3実施形態と同様のパラメータリストである。リスト作成部67は、屈折率探索用のパラメータリストを作成すると、作成した屈折率探索用のパラメータリストのデータを、主制御部62へ出力する。
ステップST408において、顕微鏡制御部361の主制御部62は、ステップST407で求めた相対観察深さの下端深さdrBMおよび相対観察深さの上端深さdrTPのうち、ステップST402で設定した観察深さdS(相対観察深さdr=0)から遠い方を、屈折率探索用の観察深さとして設定する。この理由は、屈折率探索用の観察深さが基準となる相対観察深さ(dr=0)から遠いほど、異なる試料屈折率を設定して取得した試料TPの画像間での差異が明確に表れるからである。例えば、実際の試料屈折率が1.37であったとすると、観察深さdと最適補正環位置CPとの関係は、図29の実線で示す直線のようになる。一方、試料屈折率を実際の試料屈折率である1.37からずれた値に設定すると、観察深さdと最適補正環位置CPとの関係として、図29の破線や一点鎖線で示す直線が設定される。相対観察深さの上端深さdrTPが基準となる相対観察深さ(dr=0)から最も遠いとき、実際の試料屈折率に対応する最適補正環位置と、実際の試料屈折率からずれた値に設定された試料屈折率に対応する最適補正環位置との差は、相対観察深さの上端深さdrTPにおいて最大となる。そのため、設定屈折率を変えたときの画質の変化も相対観察深さの上端深さdrTPにおいて最大となるので、ユーザーは、最も画質が良いと感じる試料TPの画像をより正確に選択することができる。
ステップST409において、顕微鏡制御部361は、ステップST407で作成した屈折率探索用のパラメータリストに従って、ステップST408で設定した屈折率探索用の観察深さにおける試料TPの画像を取得する。
ステップST410において、顕微鏡制御部361の主制御部62は、ステップST405で設定される探索範囲内の全ての屈折率について、試料TPの画像を取得したか否かを判定する。主制御部62が、探索範囲内の全ての屈折率について試料TPの画像を取得していないと判定した場合(ステップST410:No)、ステップST405へ戻る。そして、ステップST405からステップST410までの処理を繰り返す。以上の処理により、探索範囲内の複数の屈折率に対応する試料TPの画像を取得することができる。
ステップST410において、主制御部62が、探索範囲内の全ての屈折率について試料TPの画像を取得したと判定した場合(ステップST410:Yes)、ステップST411へ進む。ステップST411において、ステップST409で取得した、探索範囲内の複数の屈折率に対応する試料TPの画像に基づいて、zスタック画像を取得する試料TPの屈折率が選択入力される。このとき、顕微鏡制御部361は、ステップST409で取得した試料TPの画像データを情報処理装置90の入出力制御部91へ出力する。入出力制御部91は、顕微鏡制御部361から入力された画像データに基づいて、探索範囲内の複数の屈折率に対応する試料TPの画像を生成し、表示部93に表示させる。図30に示すように、ユーザーは、表示部93に表示された複数の屈折率に対応する試料TPの画像を比較する。ユーザーは、最も画質が良いと感じる試料TPの画像が得られる屈折率を、試料TPの屈折率として選択する操作を入力部92に対して行う。図30では例えば、試料屈折率「1.37」に対応する試料TPの画像が選択入力されており、この場合、入力される試料TPの屈折率nSAは1.37となる。ユーザーが屈折率を選択する操作を入力部92に対して行うと、入力部92は、この操作に対応する入力データを、入出力制御部91を介して顕微鏡制御部361へ出力する。
ステップST412において、顕微鏡制御部361のリスト作成部67は、第3実施形態におけるステップST350と同様に、記憶部68に記憶された設定用データテーブルDB3と、ステップST411で入力された屈折率nSAに基づいて、屈折率nSAに対応する、CP-d変化比mCP、LP-d変化比mLP、およびL’-d変化比mL’を算出して求める。
ステップST413において、顕微鏡制御部361のリスト作成部67は、共焦点顕微鏡10の設定に関するパラメータリストLS3を作成する。ステップST413では、第3実施形態におけるステップST360と同様の処理が行われる。
ステップST414において、顕微鏡制御部361は、ステップST413で作成したパラメータリストLS3に従って、補正環28の最適補正環位置CPと、対物レンズ26の最適対物レンズ位置LPとを変化させることにより、試料TPのzスタック画像を取得する。
ステップST415において、顕微鏡制御部361は、ステップST414で取得した試料TPのzスタック画像データを情報処理装置90の入出力制御部91へ出力する。入出力制御部91は、顕微鏡制御部361から入力されたzスタック画像データに基づいて、試料TPの3次元的な画像を生成し、表示部93に表示させる。ステップST415では、第3実施形態におけるステップST380と同様の処理が行われる。
第4実施形態によれば、第3実施形態と同様の効果を得ることができる。また、第4実施形態によれば、試料TPの屈折率が未知の場合であっても、複数の屈折率に対応する試料TPの画像に基づいて、zスタック画像を取得する試料TPの屈折率を選択して入力することができる。
上述の第4実施形態において、試料TPのzスタック画像を取得した後、異なる観察領域で同様の試料TPのzスタック画像を取得することが可能である。この場合、例えば、ステップST401~ST403の処理を省略し、ユーザーが観察領域を変える設定を行った後、ステップST404の処理から開始するようにしてもよい。また、第1実施形態の変形例で述べた画像取得方法と同様にして、試料TPのzスタック画像を取得した後、異なる観察領域で同様の試料TPのzスタック画像を取得することで、xy方向の位置が異なる複数の観察領域での試料TPのzスタック画像を並べるタイリングを行うことが可能である。
上述の第4実施形態では、屈折率の探索を行う処理を、第3実施形態に組み込んだ例について説明したが、これに限られるものではなく、第1実施形態や第2実施形態に組み込むことが可能である。
[第5実施形態]
第5実施形態について説明する。第5実施形態に係る顕微鏡装置は、第3実施形態に係る顕微鏡装置と同様の構成であり、上述の第1実施形態および第3実施形態と同様の構成については、適宜、同じ符号を付してその説明を省略あるいは簡略化する。図31は、第5実施形態に係る顕微鏡制御部561と情報処理装置90との間の電気的な接続を示すブロック図である。第5実施形態に係る顕微鏡制御部561は、第3実施形態に係る顕微鏡制御部361と同様に構成される。第5実施形態に係る顕微鏡制御部561は、第3実施形態に係る顕微鏡制御部361と比較して、屈折率決定部569をさらに有する。
第5実施形態について説明する。第5実施形態に係る顕微鏡装置は、第3実施形態に係る顕微鏡装置と同様の構成であり、上述の第1実施形態および第3実施形態と同様の構成については、適宜、同じ符号を付してその説明を省略あるいは簡略化する。図31は、第5実施形態に係る顕微鏡制御部561と情報処理装置90との間の電気的な接続を示すブロック図である。第5実施形態に係る顕微鏡制御部561は、第3実施形態に係る顕微鏡制御部361と同様に構成される。第5実施形態に係る顕微鏡制御部561は、第3実施形態に係る顕微鏡制御部361と比較して、屈折率決定部569をさらに有する。
第5実施形態において、評価値算出部64は、画像生成部63から入力された屈折率探索用の試料TPのzスタック画像データに基づいて、屈折率探索用の評価値wを求めることが可能である。評価値算出部64は、求めた評価値wのデータを記憶部68へ出力する。
屈折率決定部569は、記憶部68に記憶された屈折率探索用の評価値wのデータに基づいて、試料TPの屈折率を求める。屈折率決定部569は、求めた試料TPの屈折率のデータを、主制御部62を介して記憶部68へ出力するとともに、情報処理装置90の入出力制御部91へ出力する。
第5実施形態に係る画像取得方法について説明する。図32は、第5実施形態に係る画像取得方法を示すフローチャートである。なお、顕微鏡制御部561は、例えばコンピュータシステムを含む。顕微鏡制御部561は、記憶部68に記憶されている制御プログラムを読み出し、この制御プログラムに従って各種の処理を実行する。ステップST501において、設定用データテーブルDB3を作成して記憶部68に記憶させる。ステップST501では、第3実施形態におけるステップST310と同様の処理が行われる。
ステップST502において、補正環28の最適補正環位置CPおよび対物レンズ26の最適対物レンズ位置LPを実験的に求める観察深さdSおよび観察領域ROIの位置を設定する。ステップST502では、第3実施形態におけるステップST320、すなわち、第1実施形態におけるステップST120と同様の処理が行われる。
ステップST503において、顕微鏡制御部561は、ステップST502で設定した観察深さdSにおける、補正環28の最適補正環位置CPSと、対物レンズ26の最適対物レンズ位置LPSを求める。ステップST503では、第3実施形態におけるステップST330の場合と同様の補正環位置決定処理が行われる。
ステップST504において、試料TPの屈折率の探索範囲、画像取得パラメータ、画像取得範囲の入力を行う。ステップST504では、第4実施形態におけるステップST404と同様の処理が行われる。
ステップST505において、顕微鏡制御部561の主制御部62は、ステップST504で入力された試料TPの屈折率の探索範囲の中から、探索を行う屈折率の値を設定する。ステップST505では、第4実施形態におけるステップST405と同様の処理が行われる。
ステップST506において、顕微鏡制御部561のリスト作成部67は、探索を行う屈折率に対応する、CP-d変化比mCP、LP-d変化比mLP、およびL’-d変化比mL’を算出して求める。ステップST506では、第4実施形態におけるステップST406と同様の処理が行われる。
ステップST507において、顕微鏡制御部561のリスト作成部67は、屈折率探索用のパラメータリストを作成する。ステップST507では、第4実施形態におけるステップST407と同様の処理が行われる。
ステップST508において、顕微鏡制御部561は、ステップST507で作成した屈折率探索用のパラメータリストに従って、補正環28の最適補正環位置CPと、対物レンズ26の最適対物レンズ位置LPとを変化させることにより、屈折率探索用の試料TPのzスタック画像を取得する。
ステップST509において、顕微鏡制御部561の評価値算出部64は、ステップST508で取得した屈折率探索用の試料TPのzスタック画像データに基づいて、屈折率探索用の評価値wを求める。評価値算出部64は、求めた評価値wのデータおよび、このときの屈折率のデータを記憶部68に記憶させて保持する。屈折率探索用の評価値wとして、例えば、zスタック画像の全体、zスタック画像のxz断面、zスタック画像のyz断面における、画像のコントラストや、画像の信号強度(輝度)の積算値等を用いることができる。また、図33の破線で示すように、zスタック画像の信号強度が最大となる断面における、画像のコントラストや、画像の信号強度(輝度)の積算値等を用いることができる。
ステップST510において、顕微鏡制御部561の主制御部62は、ステップST505で設定される探索範囲内の全ての屈折率について、試料TPのzスタック画像を取得したか否かを判定する。主制御部62が、探索範囲内の全ての屈折率について試料TPのzスタック画像を取得していないと判定した場合(ステップST510:No)、ステップST505へ戻る。そして、ステップST505からステップST510までの処理を繰り返す。以上の処理により、探索範囲内の複数の屈折率に対応する試料TPのzスタック画像を取得することができる。
図33は、屈折率を変えて求まる評価値wの一例を示すグラフである。図33に示すように、屈折率の探索範囲をnA1~nA5に設定した場合、屈折率nA1に対応する試料TPのzスタック画像TI(nA1)、屈折率nA2に対応する試料TPのzスタック画像TI(nA2)、屈折率nA3に対応する試料TPのzスタック画像TI(nA3)、屈折率nA4に対応する試料TPのzスタック画像TI(nA4)、および屈折率nA5に対応する試料TPのzスタック画像TI(nA5)を取得することができる。そして、各屈折率nA1~nA5に対応する試料TPのzスタック画像TI(nA1)~TI(nA5)に基づいて、各屈折率nA1~nA5についての評価値wを求めることができる。
ステップST510において、主制御部62が、探索範囲内の全ての屈折率について試料TPのzスタック画像を取得したと判定した場合(ステップST510:Yes)、ステップST511へ進む。ステップST511において、顕微鏡制御部561の屈折率決定部569は、記憶部68に記憶された複数の屈折率に対応する評価値wのデータに基づいて、試料TPの屈折率nSAを求める。具体的には、複数の屈折率に対応する評価値wのプロットを作成する。そして、このプロットに対して図33に示すように補間または関数近似を行うことで、評価値wが最大となる屈折率nSAを求める。補間を行う方法として、例えば、複数の屈折率nA1~nA5に対する評価値wのプロットに対しラグランジュ補間やスプライン補間をする方法がある。関数近似を行う方法として、例えば、最小二乗法により、複数の屈折率nA1~nA5に対する評価値wのプロットを二次曲線やガウス関数にフィッティングする方法がある。
ステップST512において、顕微鏡制御部561の屈折率決定部569は、求めた試料TPの屈折率nSAのデータを、主制御部62を介して記憶部68へ出力するとともに、情報処理装置90の入出力制御部91へ出力する。入出力制御部91は、顕微鏡制御部561(屈折率決定部569)から入力された試料TPの屈折率nSAを表示部93に表示させる。
ステップST513において、顕微鏡制御部561のリスト作成部67は、第3実施形態におけるステップST350と同様に、記憶部68に記憶された設定用データテーブルDB3と、ステップST511で求めた屈折率nSAに基づいて、屈折率nSAに対応する、CP-d変化比mCP、LP-d変化比mLP、およびL’-d変化比mL’を算出して求める。
ステップST514において、顕微鏡制御部561のリスト作成部67は、共焦点顕微鏡10の設定に関するパラメータリストLS3を作成する。ステップST514では、第3実施形態におけるステップST360と同様の処理が行われる。
ステップST515において、顕微鏡制御部561は、ステップST514で作成したパラメータリストLS3に従って、補正環28の最適補正環位置CPと、対物レンズ26の最適対物レンズ位置LPとを変化させることにより、試料TPのzスタック画像を取得する。
ステップST516において、顕微鏡制御部361は、ステップST414で取得した試料TPのzスタック画像データを情報処理装置90の入出力制御部91へ出力する。入出力制御部91は、顕微鏡制御部361から入力されたzスタック画像データに基づいて、試料TPの3次元的な画像を生成し、表示部93に表示させる。ステップST516では、第3実施形態におけるステップST380と同様の処理が行われる。
第5実施形態によれば、第3実施形態と同様の効果を得ることができる。また、第5実施形態によれば、試料TPの屈折率が未知の場合であっても、ユーザーの操作によって入力部92から入力される屈折率の探索範囲に基づいて、試料TPの屈折率を求めることができる。
上述の第5実施形態において、試料TPのzスタック画像を取得した後、異なる観察領域で同様の試料TPのzスタック画像を取得することが可能である。この場合、例えば、ステップST501~ST503の処理を省略し、ユーザーが観察領域を変える設定を行った後、ステップST504の処理から開始するようにしてもよい。また、第1実施形態の変形例で述べた画像取得方法と同様にして、試料TPのzスタック画像を取得した後、異なる観察領域で同様の試料TPのzスタック画像を取得することで、xy方向の位置が異なる複数の観察領域での試料TPのzスタック画像を並べるタイリングを行うことが可能である。
上述の第5実施形態では、屈折率の探索を行う処理を、第3実施形態に組み込んだ例について説明したが、これに限られるものではなく、第1実施形態や第2実施形態に組み込むことが可能である。
上述の各実施形態において、1種類の設定用データテーブルを作成しているが、これに限られるものではない。例えば、照明光の波長や温度、対物レンズごとに異なる複数種類の設定用データテーブルを作成し、照明光の波長や温度、対物レンズに応じて使い分けるようにしてもよい。
上述の各実施形態において、試料TPの屈折率に関するデータ、画像取得パラメータ、および画像取得範囲は、ユーザーの入力操作によって設定されるが、これに限られるものではない。例えば、これらのデータのうち少なくともいずれかは、記憶部68等に記憶された、以前に試料TPのzスタック画像を取得したときのデータを参照して、自動的に設定されるようにしてもよい。
上述の各実施形態において、補正環28の回転に応じて、収差補正レンズ27が対物レンズ26の光軸AXに沿って移動するように構成されている。例えば、カム構造を利用して、収差補正レンズ27が対物レンズ26の光軸AXに沿って移動するように構成されてもよい。
上述の各実施形態において、対物レンズ26先端からカバーガラスCGまでの距離、カバーガラスCGの厚み、及び観察深さdなどに起因する収差を補正する収差補正素子として、収差補正レンズ27が用いられているが、これに限られるものではない。例えば、収差補正素子として、液体レンズ、デフォーマブルミラーおよび液晶素子等の他の位相変調素子が用いられてもよい。液体レンズは、照明光学系21または検出光学系31、または対物レンズ26内部に配置され、レンズの形状を変化させることにより、収差を補正する。デフォーマブルミラーおよび液晶素子等の位相変調素子は、照明光学系21または検出光学系31に配置され、試料TPに対する照明光(励起光)および、試料TPからの検出光(蛍光)のうち、少なくとも一方の位相を変調することにより、収差を補正する。
位相変調素子には、収差の補正量を変更もしくは調整することが可能な調整部が設けられる。例えば、液体レンズに設けられる調整部は、液体レンズに印加される電圧値を制御することで、レンズの形状を変化させる。これにより、液体レンズによる収差の補正量を変更もしくは調整することができる。デフォーマブルミラーに設けられる調整部は、デフォーマブルミラーに印加される電圧値を制御することで、ミラーの形状を変化させる。これにより、デフォーマブルミラーによる、収差の補正量を変更もしくは調整することができる。液晶素子に設けられる調整部は、液晶素子に印加される電圧値を制御することで、液晶の分布を変化させる。これにより、液晶素子による収差の補正量を変更もしくは調整することができる。
上述の各実施形態において、入力部92および表示部93は、情報処理装置90と別体に設けられた装置であるが、これに限られるものではない。例えば、入力部92は、情報処理装置90と一体的に設けられた装置(例えば、内蔵型のタッチパッド等)であってもよい。入力部92は、表示部93と一体的に設けられた装置(例えば、タッチパネル)であってもよい。表示部93は、情報処理装置90と一体的に設けられた装置であってもよい。
上述の各実施形態において、顕微鏡装置1に共焦点顕微鏡10が設けられているが、これに限られるのではない。例えば、顕微鏡装置に設けられる顕微鏡は、微分干渉顕微鏡、位相差顕微鏡、多光子励起顕微鏡、落射蛍光顕微鏡、超解像顕微鏡、暗視野顕微鏡、熱レンズ顕微鏡等であってもよい。また、顕微鏡装置に設けられる顕微鏡は、倒立顕微鏡に限らず、正立顕微鏡であってもよい。
1 顕微鏡装置
10 共焦点顕微鏡
11 ステージ 12 ステージ駆動部
16 光源ユニット
21 照明光学系
26 対物レンズ
27 収差補正レンズ 28 補正環
31 検出光学系
41 検出部
51 収差補正部
55 補正環駆動部 56 対物レンズ駆動部
61 顕微鏡制御部
62 主制御部 63 画像生成部
65 補正環位置決定部 67 リスト作成部
68 記憶部
90 情報処理装置
361 顕微鏡制御部(第3実施形態)
561 顕微鏡制御部(第5実施形態)
TP 試料
DB1,DB3 設定用データテーブル
LS1~LS3 パラメータリスト
10 共焦点顕微鏡
11 ステージ 12 ステージ駆動部
16 光源ユニット
21 照明光学系
26 対物レンズ
27 収差補正レンズ 28 補正環
31 検出光学系
41 検出部
51 収差補正部
55 補正環駆動部 56 対物レンズ駆動部
61 顕微鏡制御部
62 主制御部 63 画像生成部
65 補正環位置決定部 67 リスト作成部
68 記憶部
90 情報処理装置
361 顕微鏡制御部(第3実施形態)
561 顕微鏡制御部(第5実施形態)
TP 試料
DB1,DB3 設定用データテーブル
LS1~LS3 パラメータリスト
Claims (16)
- 試料を照明する照明光学系と、
前記試料からの光を検出する検出部と、
対物レンズを有し、前記試料からの光を前記検出部に導く検出光学系と、
前記照明光学系および前記検出光学系の少なくとも一方の収差を補正する収差補正部と、
制御部とを備え、
前記制御部は、
前記対物レンズの光軸方向である前記試料の深さ方向の第1の位置における前記収差補正部の補正量に関する情報を、前記検出部で検出された光に基づいて算出し、
前記算出した前記第1の位置における前記収差補正部の補正量に関する情報と、前記試料の屈折率に関する情報とに基づいて、前記第1の位置と異なる第2の位置における前記収差補正部の補正量に関する情報を算出する顕微鏡装置。 - 前記制御部は、
前記第1の位置における前記対物レンズの位置に関する情報を、前記検出部で検出された光に基づいて算出し、
前記算出した前記第1の位置における前記対物レンズの位置に関する情報と、前記試料の屈折率に関する情報とに基づいて、前記第2の位置における前記対物レンズの位置に関する情報を算出する請求項1に記載の顕微鏡装置。 - 前記制御部は、
前記試料の屈折率毎に、前記試料の深さ方向の位置の変化量と前記収差補正部の補正量の変化量との比を示す情報を予めシミュレーションにより算出して記憶し、
前記記憶した情報と、前記算出した前記第1の位置における前記収差補正部の補正量に関する情報と、前記試料の屈折率に関する情報とに基づいて、前記第2の位置における前記収差補正部の補正量に関する情報を算出する請求項1または2に記載の顕微鏡装置。 - 前記制御部は、
前記試料の屈折率毎に、前記試料の深さ方向の位置の変化量と前記対物レンズの変化量との比を示す情報を予めシミュレーションにより算出して記憶し、
前記第1の位置における前記対物レンズの位置に関する情報を、前記検出部で検出された光に基づいて算出し、
前記記憶した情報と、前記算出した前記第1の位置における前記対物レンズの位置に関する情報と、前記試料の屈折率に関する情報とに基づいて、前記第2の位置における前記対物レンズの位置に関する情報を算出する請求項1~3のいずれか一項に記載の顕微鏡装置。 - 前記試料と前記対物レンズとを前記対物レンズの光軸に沿って相対移動させることが可能な駆動部を備え、
前記制御部は、
前記算出した前記第1の位置における前記収差補正部の補正量に関する情報と、前記試料の屈折率に関する情報とに基づいて、前記試料の深さ方向の複数の位置における前記収差補正部の補正量に関する情報を算出し、
前記算出した補正量に基づいて前記収差補正部を制御し、前記駆動部を制御して、前記試料の深さ方向の複数の位置で、前記検出部で検出された光に基づいて前記試料の画像を生成し、表示部に表示させる請求項1~4のいずれか一項に記載の顕微鏡装置。 - 前記制御部は、前記試料の深さ方向の複数の位置で生成した画像を用いて前記試料の3次元画像を生成し、前記表示部に表示させる請求項5に記載の顕微鏡装置。
- 前記制御部は、前記試料の3次元画像を前記試料の深さ方向の位置に関連付けて前記表示部に表示させる請求項6に記載の顕微鏡装置。
- 前記試料と前記対物レンズとを前記対物レンズの光軸に沿って相対移動させることが可能な駆動部を備え、
前記制御部は、
前記算出した前記第1の位置における前記収差補正部の補正量に関する情報と、前記試料の第1の屈折率に関する情報とに基づいて、前記試料の第1の屈折率に関する情報に対応する前記試料の深さ方向の複数の位置における前記収差補正部の補正量に関する情報を算出し、
前記算出した前記第1の位置における前記収差補正部の補正量に関する情報と、前記試料の第2の屈折率に関する情報とに基づいて、前記試料の第2の屈折率に関する情報に対応する前記試料の深さ方向の複数の位置における前記収差補正部の補正量に関する情報を算出し、
前記算出した前記試料の第1の屈折率に関する情報に対応する補正量に基づいて前記収差補正部を制御し、前記駆動部を制御して、前記試料の深さ方向の1以上の位置で前記検出部で検出された光に基づいて前記試料の画像を生成する処理を行い、
前記算出した前記試料の第2の屈折率に関する情報に対応する補正量に基づいて前記収差補正部を制御し、前記駆動部を制御して、前記試料の深さ方向の1以上の位置で前記検出部で検出された光に基づいて前記試料の画像を生成する処理を行い、
前記生成した複数の画像に基づいて前記試料の屈折率を算出する請求項1~4のいずれか一項に記載の顕微鏡装置。 - 前記収差補正部は、補正環を有する請求項1~8のいずれか一項に記載の顕微鏡装置。
- 前記収差補正部の補正量に関する情報は、前記補正環の最適位置に関する情報である請求項9に記載の顕微鏡装置。
- 前記収差補正部は、位相変調素子を有する請求項1~8のいずれか一項に記載の顕微鏡装置。
- 前記位相変調素子は、液体レンズ、デフォーマブルミラー、および液晶素子の少なくとも1つを有する請求項11に記載の顕微鏡装置。
- 前記収差補正部の補正量に関する情報は、前記位相変調素子に印加される電圧値に関する情報である請求項11または12に記載の顕微鏡装置。
- 試料を照明する照明光学系と、前記試料からの光を検出する検出部と、対物レンズを有し、前記試料からの光を前記検出部に導く検出光学系と、前記照明光学系および前記検出光学系の少なくとも一方の収差を補正する収差補正部と、制御部とを備える顕微鏡装置の制御方法であって、
前記対物レンズの光軸方向である前記試料の深さ方向の第1の位置における前記収差補正部の補正量に関する情報を、前記検出部で検出された光に基づいて算出し、前記算出した前記第1の位置における前記収差補正部の補正量に関する情報と、前記試料の屈折率に関する情報とに基づいて、前記第1の位置と異なる第2の位置における前記収差補正部の補正量に関する情報を算出する顕微鏡装置の制御方法。 - 試料を照明する照明光学系と、前記試料からの光を検出する検出部と、対物レンズを有し、前記試料からの光を前記検出部に導く検出光学系と、前記照明光学系および前記検出光学系の少なくとも一方の収差を補正する収差補正部と、制御部とを備える顕微鏡装置の制御プログラムであって、
コンピュータに、前記対物レンズの光軸方向である前記試料の深さ方向の第1の位置における前記収差補正部の補正量に関する情報を、前記検出部で検出された光に基づいて算出し、前記算出した前記第1の位置における前記収差補正部の補正量に関する情報と、前記試料の屈折率に関する情報とに基づいて、前記第1の位置と異なる第2の位置における前記収差補正部の補正量に関する情報を算出する処理を実行させる顕微鏡装置の制御プログラム。 - 試料からの光を検出する検出部と、
対物レンズを有し、前記試料からの光を前記検出部に導く検出光学系と、
前記検出光学系の収差を補正する収差補正部と、
制御部とを備え、
前記制御部は、
前記対物レンズの光軸方向である前記試料の深さ方向の第1の位置における前記収差補正部の補正量に関する情報を、前記検出部で検出された光に基づいて算出し、
前記算出した前記第1の位置における前記収差補正部の補正量に関する情報と、前記試料の屈折率に関する情報とに基づいて、前記第1の位置と異なる第2の位置における前記収差補正部の補正量に関する情報を算出する顕微鏡装置。
Priority Applications (1)
| Application Number | Priority Date | Filing Date | Title |
|---|---|---|---|
| PCT/JP2019/020786 WO2020240638A1 (ja) | 2019-05-24 | 2019-05-24 | 顕微鏡装置、顕微鏡装置の制御方法、および顕微鏡装置の制御プログラム |
Applications Claiming Priority (1)
| Application Number | Priority Date | Filing Date | Title |
|---|---|---|---|
| PCT/JP2019/020786 WO2020240638A1 (ja) | 2019-05-24 | 2019-05-24 | 顕微鏡装置、顕微鏡装置の制御方法、および顕微鏡装置の制御プログラム |
Publications (1)
| Publication Number | Publication Date |
|---|---|
| WO2020240638A1 true WO2020240638A1 (ja) | 2020-12-03 |
Family
ID=73553668
Family Applications (1)
| Application Number | Title | Priority Date | Filing Date |
|---|---|---|---|
| PCT/JP2019/020786 Ceased WO2020240638A1 (ja) | 2019-05-24 | 2019-05-24 | 顕微鏡装置、顕微鏡装置の制御方法、および顕微鏡装置の制御プログラム |
Country Status (1)
| Country | Link |
|---|---|
| WO (1) | WO2020240638A1 (ja) |
Citations (4)
| Publication number | Priority date | Publication date | Assignee | Title |
|---|---|---|---|---|
| JP2005031507A (ja) * | 2003-07-09 | 2005-02-03 | Olympus Corp | 顕微鏡システム、顕微鏡の制御方法、及びプログラム |
| JP2017026666A (ja) * | 2015-07-16 | 2017-02-02 | オリンパス株式会社 | 顕微鏡システム、特定方法、及び、プログラム |
| JP2017505924A (ja) * | 2014-02-12 | 2017-02-23 | ライカ マイクロシステムズ シーエムエス ゲゼルシャフト ミット ベシュレンクテル ハフツングLeica Microsystems CMS GmbH | 立体試料の結像のための方法および顕微鏡 |
| JP2018205069A (ja) * | 2017-06-01 | 2018-12-27 | 株式会社日立製作所 | 光計測装置 |
-
2019
- 2019-05-24 WO PCT/JP2019/020786 patent/WO2020240638A1/ja not_active Ceased
Patent Citations (4)
| Publication number | Priority date | Publication date | Assignee | Title |
|---|---|---|---|---|
| JP2005031507A (ja) * | 2003-07-09 | 2005-02-03 | Olympus Corp | 顕微鏡システム、顕微鏡の制御方法、及びプログラム |
| JP2017505924A (ja) * | 2014-02-12 | 2017-02-23 | ライカ マイクロシステムズ シーエムエス ゲゼルシャフト ミット ベシュレンクテル ハフツングLeica Microsystems CMS GmbH | 立体試料の結像のための方法および顕微鏡 |
| JP2017026666A (ja) * | 2015-07-16 | 2017-02-02 | オリンパス株式会社 | 顕微鏡システム、特定方法、及び、プログラム |
| JP2018205069A (ja) * | 2017-06-01 | 2018-12-27 | 株式会社日立製作所 | 光計測装置 |
Similar Documents
| Publication | Publication Date | Title |
|---|---|---|
| JP5287252B2 (ja) | レーザ走査共焦点顕微鏡 | |
| US11327288B2 (en) | Method for generating an overview image using a large aperture objective | |
| US9575308B2 (en) | Slide scanner with dynamic focus and specimen tilt and method of operation | |
| CN103135220B (zh) | 显微镜照明系统及方法 | |
| US7554664B2 (en) | Laser scanning microscope | |
| JP6241858B2 (ja) | 共焦点顕微鏡 | |
| JP4934281B2 (ja) | 全反射蛍光顕微鏡 | |
| JP2008281395A (ja) | 光学系評価装置、光学系評価方法および光学系評価プログラム | |
| JP2005031507A (ja) | 顕微鏡システム、顕微鏡の制御方法、及びプログラム | |
| US9874736B2 (en) | Apparatus and method for an inclined single plane imaging microscope box (iSPIM box) | |
| Yelin et al. | Large area confocal microscopy | |
| US20200218047A1 (en) | High-resolution scanning microscopy | |
| JP2011118264A (ja) | 顕微鏡装置 | |
| Zhi et al. | Rapid super-resolution line-scanning microscopy through virtually structured detection | |
| JP6173154B2 (ja) | 顕微鏡システム | |
| JP2004133156A (ja) | 共焦点レーザ走査型顕微鏡装置及びそのプログラム | |
| JP7380906B2 (ja) | 顕微鏡装置、顕微鏡装置の試料屈折率測定方法、および顕微鏡装置の試料屈折率測定プログラム | |
| Liu et al. | CompassLSM: axially swept light-sheet microscopy made simple | |
| US20090008539A1 (en) | Method for correcting a control of an optical scanner in a device for mapping a sample by scanning and the device for performing the method | |
| JP2004524577A (ja) | デジタル顕微鏡 | |
| WO2019130372A1 (ja) | 光学分析装置 | |
| JP2011118265A (ja) | 顕微鏡装置 | |
| US20190011478A1 (en) | Observation method using compound microscope including an inverted optical microscope and atomic force microscope, program to perform observation method, and compound microscope | |
| WO2020240639A1 (ja) | 顕微鏡装置、顕微鏡装置の制御方法、および顕微鏡装置の制御プログラム | |
| Nichols et al. | Video-rate scanning confocal microscopy and microendoscopy |
Legal Events
| Date | Code | Title | Description |
|---|---|---|---|
| 121 | Ep: the epo has been informed by wipo that ep was designated in this application |
Ref document number: 19930425 Country of ref document: EP Kind code of ref document: A1 |
|
| NENP | Non-entry into the national phase |
Ref country code: DE |
|
| 122 | Ep: pct application non-entry in european phase |
Ref document number: 19930425 Country of ref document: EP Kind code of ref document: A1 |
|
| NENP | Non-entry into the national phase |
Ref country code: JP |