WO2020240629A1 - データ作成方法、データ作成装置、及びデータ作成プログラム - Google Patents
データ作成方法、データ作成装置、及びデータ作成プログラム Download PDFInfo
- Publication number
- WO2020240629A1 WO2020240629A1 PCT/JP2019/020716 JP2019020716W WO2020240629A1 WO 2020240629 A1 WO2020240629 A1 WO 2020240629A1 JP 2019020716 W JP2019020716 W JP 2019020716W WO 2020240629 A1 WO2020240629 A1 WO 2020240629A1
- Authority
- WO
- WIPO (PCT)
- Prior art keywords
- data
- fundus image
- boundary line
- analysis
- eye
- Prior art date
- Legal status (The legal status is an assumption and is not a legal conclusion. Google has not performed a legal analysis and makes no representation as to the accuracy of the status listed.)
- Ceased
Links
Images







Classifications
-
- A—HUMAN NECESSITIES
- A61—MEDICAL OR VETERINARY SCIENCE; HYGIENE
- A61B—DIAGNOSIS; SURGERY; IDENTIFICATION
- A61B3/00—Apparatus for testing the eyes; Instruments for examining the eyes
- A61B3/10—Objective types, i.e. instruments for examining the eyes independent of the patients' perceptions or reactions
Definitions
- the present invention relates to a data creation method, a data creation device, and a data creation program.
- a glaucoma diagnostic device (US Patent Application Publication No. 6409342) that diagnoses glaucoma based on a fundus image taken by a fundus camera for color imaging is known, and a device that supports the diagnosis of glaucoma is desired. There is.
- the data creation method of the first aspect of the technique of the present disclosure is: Acquiring a fundus image of the eye to be inspected Setting a first boundary line that defines a first range based on the optic nerve head in the fundus image and a second boundary line that defines a second range obtained by expanding the first range. To generate analysis data obtained by analyzing a plurality of pixel values between the first boundary line and the second boundary line in the radial direction starting from the optic nerve head. To generate comparative data comparing the standard data suitable for the eye to be inspected with the analysis data, including.
- the data creation device of the second aspect of the technique of the present disclosure is The acquisition unit that acquires the fundus image of the eye to be inspected, A first boundary line that defines the first range with respect to the optic nerve head in the fundus image and a second boundary line that defines the second range that is an enlargement of the first range are set.
- An analysis unit that generates analysis data obtained by analyzing a plurality of pixel values between the first boundary line and the second boundary line in the radial direction starting from the optic nerve head.
- a comparison unit that generates comparison data comparing the standard data suitable for the eye to be inspected with the analysis data, and a comparison unit. including.
- the data creation program of the third aspect of the technique of the present disclosure Acquiring a fundus image of the fundus of the eye to be inspected Setting a first boundary line that defines a first range based on the optic nerve head in the fundus image and a second boundary line that defines a second range obtained by expanding the first range.
- analysis data obtained by analyzing a plurality of pixel values between the first boundary line and the second boundary line in the radial direction starting from the optic nerve head.
- To generate comparative data comparing the normal eye data suitable for the eye to be inspected with the analysis data and Let the computer run.
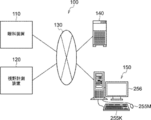
- the ophthalmology system 100 includes an ophthalmology device 110, a visual field measurement device 120, a server device (hereinafter referred to as “server”) 140, an image display device (hereinafter referred to as “viewer”) 150, and the like. It has.
- the ophthalmic apparatus 110 acquires a fundus image of the eye to be inspected.
- the visual field measuring device 120 measures the visual field.
- the server 140 stores the fundus image of the eye to be inspected obtained by the ophthalmic apparatus 110 and the visual field measurement result obtained by the visual field measuring device 120 corresponding to the ID of the subject (also referred to as a patient).
- the viewer 150 displays the fundus image acquired from the server 140, the analysis result obtained by analyzing the fundus image, and the visual field measurement result.
- the ophthalmic apparatus 110, the visual field measuring apparatus 120, the server 140, and the viewer 150 are connected to each other via the network 130.
- the server 140 is an example of the "data creation device" of the technology of the present disclosure.
- the scanning laser ophthalmoscope (Scanning Laser Ophthalmoscope) is referred to as "SLO".
- the horizontal direction is the "X direction”
- the direction perpendicular to the horizontal plane is the "Y direction”
- the direction connecting the above be the "Z direction”. Therefore, the X, Y, and Z directions are perpendicular to each other.
- the ophthalmic apparatus 110 includes an imaging apparatus 14 and a control apparatus 16.
- the photographing device 14 includes an SLO unit 18 and acquires a fundus image of the fundus of the eye to be inspected 12.
- the two-dimensional fundus image acquired by the SLO unit 18 is referred to as an SLO image.
- the control device 16 includes a computer having a CPU (Central Processing Unit (Central Processing Unit)) 16A, a RAM (Random Access Memory) 16B, a ROM (Read-Only memory) 16C, and an input / output (I / O) port 16D. ing.
- CPU Central Processing Unit
- RAM Random Access Memory
- ROM Read-Only memory
- the control device 16 includes an input / display device 16E connected to the CPU 16A via the I / O port 16D.
- the input / display device 16E has a graphic user interface for displaying an image of the eye 12 to be inspected and receiving various instructions from the user.
- a graphic user interface includes a touch panel display.
- control device 16 includes an image processing device 17 connected to the I / O port 16D.
- the image processing device 17 generates a fundus image of the eye to be inspected 12 based on the data obtained by the photographing device 14.
- the control device 16 is connected to the network 130 via a communication interface (not shown).
- the control device 16 of the ophthalmic device 110 includes the input / display device 16E, but the technique of the present disclosure is not limited to this.
- the control device 16 of the ophthalmic apparatus 110 may not include the input / display device 16E, but may include an input / display device that is physically independent of the ophthalmic apparatus 110.
- the display device includes an image processing processor unit that operates under the control of the CPU 16A of the control device 16.
- the image processing processor unit may display an SLO image or the like based on the image signal output instructed by the CPU 16A.
- the photographing device 14 operates under the control of the CPU 16A of the control device 16.
- the photographing device 14 includes an SLO unit 18 and a photographing optical system 19.
- the photographing optical system 19 includes a scanner 22 and a wide-angle optical system 30.
- the scanner 22 two-dimensionally scans the light emitted from the SLO unit 18 in the X direction and the Y direction.
- the scanner 22 may be any optical element capable of deflecting the luminous flux, and a MEMS (Micro Electro Mechanical Systems) scanner can be used. Further, it may be a combination of a polygon mirror, a galvano mirror, and the like.
- the wide-angle optical system 30 includes an objective optical system (not shown in FIG. 2) having a common optical system.
- the objective optical system of the common optical system may be a catadioptric system using a concave mirror such as an elliptical mirror, a catadioptric system using a wide-angle lens or the like, or a catadioptric system combining a concave mirror and a lens. ..
- a wide-angle optical system using an elliptical mirror or a wide-angle lens it is possible to photograph the retina not only in the central part of the fundus but also in the peripheral part of the fundus.
- the wide-angle optical system 30 enables observation in the fundus with a wide field of view (FOV: Field of View) 12A.
- the FOV 12A indicates a range that can be photographed by the photographing device 14.
- FOV12A can be expressed as a viewing angle.
- the viewing angle can be defined by an internal irradiation angle and an external irradiation angle in the present embodiment.
- the external irradiation angle is an irradiation angle in which the irradiation angle of the light flux emitted from the ophthalmic apparatus 110 to the eye 12 to be inspected is defined with reference to the pupil 27.
- the internal irradiation angle is an irradiation angle in which the irradiation angle of the luminous flux irradiated to the fundus F is defined with reference to the center O of the eyeball.
- the external irradiation angle and the internal irradiation angle have a corresponding relationship. For example, when the external irradiation angle is 120 degrees, the internal irradiation angle corresponds to about 160 degrees. In this embodiment, the internal irradiation angle is 200 degrees.
- UWF-SLO fundus image obtained by taking a picture with an internal irradiation angle of 160 degrees or more is referred to as a UWF-SLO fundus image.
- UWF is an abbreviation for Ultra Wide Field (ultra-wide-angle).
- the SLO unit 18 includes a light source 40 for B light (blue light), a light source 42 for G light (green light), a light source 44 for R light (red light), and IR light (infrared light (for example, near infrared light)). It includes a light source 46 and optical systems 48, 50, 52, 54, 56 that reflect or transmit light from the light sources 40, 42, 44, 46 and guide them into one optical path.
- the optical systems 48 and 56 are mirrors, and the optical systems 50, 52 and 54 are beam splitters.
- B light is reflected by the optical system 48, is transmitted through the optical system 50, is reflected by the optical system 54, G light is reflected by the optical systems 50 and 54, and R light is transmitted through the optical systems 52 and 54.
- IR light is reflected by the optical systems 56 and 52 and guided to one optical path, respectively.
- the SLO unit 18 switches a combination of light sources that emit laser light having different wavelengths, such as a mode that emits B light (480 nm), G light (530 nm), and R light (640 nm) and a mode that emits near infrared rays (800 nm). It is configured to be possible.
- FIG. 2 includes four light sources of B light (blue light) light source 40, G light light source 42, R light light source 44, and IR light light source 46, but the technique of the present disclosure is not limited thereto. ..
- the SLO unit 18 may further include a light source for white light and emit light in various modes such as a mode in which only white light is emitted.
- the light incident on the photographing optical system 19 from the SLO unit 18 is scanned in the X direction and the Y direction by the scanner 22.
- the scanning light is applied to the posterior eye portion (fundus) of the eye 12 to be inspected via the wide-angle optical system 30 and the pupil 27.
- the reflected light reflected by the fundus is incident on the SLO unit 18 via the wide-angle optical system 30 and the scanner 22.
- the SLO unit 18 reflects G light and G light among the light transmitted from the fundus of the eye 12 to be examined, the beam splitter 64 which reflects B light and transmits other than B light, and the light transmitted through the beam splitter 64.
- a beam splitter 58 that transmits light other than the above is provided.
- the SLO unit 18 includes a beam splitter 60 that reflects R light and transmits other than R light among the light transmitted through the beam splitter 58.
- the SLO unit 18 includes a beam splitter 62 that reflects IR light among the light transmitted through the beam splitter 60.
- the SLO unit 18 detects the B light detection element 70 that detects the B light reflected by the beam splitter 64, the G light detection element 72 that detects the G light reflected by the beam splitter 58, and the R light reflected by the beam splitter 60.
- the R light detection element 74 and the IR light detection element 76 that detects the IR light reflected by the beam splitter 62 are provided.
- the light incident on the SLO unit 18 via the wide-angle optical system 30 and the scanner 22 is reflected by the beam splitter 64 and received by the B light detection element 70.
- the light is transmitted through the beam splitter 64, reflected by the beam splitter 58, and received by the G light detection element 72.
- the incident light passes through the beam splitters 64 and 58, is reflected by the beam splitter 60, and is received by the R light detection element 74.
- the incident light passes through the beam splitters 64, 58 and 60, is reflected by the beam splitter 62, and is received by the IR photodetector 76.
- the image processing device 17 operating under the control of the CPU 16A uses the signals detected by the B photodetector 70, the G photodetector 72, the R photodetector 74, and the IR photodetector 76 to form a UWF-SLO fundus image. To generate.
- the UWF-SLO fundus image includes a UWF-SLO fundus image (G color fundus image) obtained by photographing the fundus with G light and a UWF-SLO fundus image (R) obtained by photographing the fundus with R light. There is a color fundus image).
- the UWF-SLO fundus image includes a UWF-SLO fundus image (B color fundus image) obtained by photographing the fundus with B light and a UWF-SLO fundus image (IR) obtained by photographing the fundus with IR light. There is a fundus image).
- control device 16 controls the light sources 40, 42, and 44 so as to emit light at the same time.
- a G color fundus image, an R color fundus image, and a B color fundus image in which the positions correspond to each other can be obtained.
- a color fundus image can be obtained by synthesizing a G color fundus image, an R color fundus image, and a B color fundus image.
- the control device 16 controls the light sources 42 and 44 so as to emit light at the same time, and the fundus of the eye to be inspected 12 is simultaneously photographed by the G light and the R light, whereby the G color fundus image and the R color corresponding to each other at each position are photographed.
- a fundus image can be obtained.
- a pseudo-color fundus image in R color and G color can be obtained. It is possible to control the light emission by combining various light sources such as simultaneous shooting of R light and G light, simultaneous shooting of R light and B light, and simultaneous shooting of G light and B light.
- Each image data of B color fundus image, G color fundus image, R color fundus image, IR fundus image, and color fundus image is sent from the ophthalmic apparatus 110 to the server 140 via a communication interface (I / F) (not shown).
- the server 140 stores the data received from the ophthalmic apparatus 110.
- the ophthalmologic apparatus 110 may be a fundus camera as well as the scanning laser ophthalmoscope (SLO) having the wide-angle optical system described above.
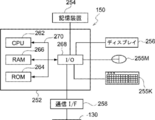
- the viewer 150 includes a computer main body 252.
- the computer body 252 has a CPU 262, a RAM 266, a ROM 264, and an input / output (I / O) port 268 connected to each other via the bus 270.
- a storage device 254, a display 256, a mouse 255M, a keyboard 255K, and a communication interface (I / F) 258 are connected to the input / output (I / O) port 268.
- the storage device 254 is composed of, for example, a non-volatile memory.
- the input / output (I / O) port 268 is connected to the network 130 via the communication interface (I / F) 258. Therefore, the viewer 150 can communicate with the ophthalmic apparatus 110 and the server 140.
- the storage device 254 stores a data creation program described later. Since the configuration of the electrical system of the server 149 is the same as the configuration of the electrical system of the viewer 150, the description thereof will be omitted.
- FIG. 5 is a block diagram showing the configuration of the image processing unit 206.
- the image processing unit 206 includes a fundus image analysis unit 2060, a data comparison unit 2062, a graph creation unit 2064, and a diagnosis support data creation unit 2066.
- FIG. 6 shows a flowchart of the data creation program.
- the CPU 262 of the viewer 150 executes the data creation program, the data creation method shown in the flowchart of FIG. 6 is realized.
- the processing unit 208 accepts the user's input of patient attribute information (eg, age, gender, and race) via the mouse 255M and keyboard 255K.
- the processing unit 208 acquires the fundus image (UWF-SLO fundus image (particularly, color fundus image)) 350 shown in FIG. 8 corresponding to the patient attribute information input in step 302 from the server 140.
- the color fundus image is a UWF-SLO fundus image taken by simultaneously irradiating R light and G light, or R light, G light, and B light.
- the G-color fundus image or the B-light fundus image may be acquired from the server 140.
- the fundus image may be read out not only from the server 140 but also from a storage medium such as a hard disk device connected to the viewer 150. Further, the fundus image taken by the ophthalmologic apparatus 110 may be acquired.
- step 302 input of information indicating which of the left and right eyes 12 to be examined (for example, right eye), patient ID (for example, 0000), patient name (for example, MMM), and the like is also accepted.
- step 306 the image processing unit 206 (particularly, the fundus image analysis unit 2060) analyzes the fundus image 350 (details will be described later).
- step 308 the image processing unit 206 (particularly, the data comparison unit 2062, the graph creation unit 1064, and the diagnosis support data creation unit 2066) performs a comparison process for comparing the analysis result of step 306 with the standard database (details will be described later). ) Is executed.
- step 310 the display control unit 204 generates and displays a display screen 380 (see FIG. 15) based on the comparison process in step 308.
- the fundus image analysis unit 2060 detects the optic disc 352 by pattern matching the predetermined image of the optic disc 352 from the UWF-SLO fundus image 350 shown in FIG. Since the optic disc 352 is the brightest region in the UWF-SLO fundus image 350, the region including the pixel having the largest pixel value in the UWF-SLO fundus image 350 may be detected as the optic disc.
- the fundus image analysis unit 2060 obtains the fundus central region (rectangular (which may be square or elliptical)) including the optic disc 352 from the UWF-SLO fundus image 350. Cut out as the center image 354 (trimming).
- the fundus image analysis unit 2060 extracts the central point 352O and the fovea 356 of the optic nerve head 352 from the central image 354 as shown in FIG. Since the extraction of the center point 352O of the optic nerve head 352 is the brightest position in the center image 354, the position of the pixel having the largest pixel value in the center image 354 is detected as the center point 352O. Further, since the fovea 356 is the darkest region in the central image 354, the position of the pixel having the smallest pixel value in the central image 354 is extracted as the fovea 356.
- step 326 the fundus image analysis unit 2060 sets a reference straight line extending in the direction from the central point 352O of the optic nerve head 352 to the fovea 356, and sets the 0 degree position on the set straight line, as shown in FIG. Set.
- the fundus image analysis unit 2060 sets a circle C1 having a radius R1 and a circle C2 having a radius R2 (> R1) from the center point 352O of the optic disc 352, as shown in FIG.
- the radius R1 of the circle C1 is set to 1.7 times the radius of the optic nerve head 352, and the radius R2 of the circle C2 is set to 2.0 times the radius of the optic nerve head 352.
- the circle C1 is an example of the “first boundary line” and the “first concentric circle” of the technology of the present disclosure
- the circle C2 is the “second boundary line” and the “second concentric circle” of the technology of the present disclosure. Is an example.
- the fundus image analysis unit 2060 converts the pixel value of the central image 354 into only the green pixel value (G pixel value). If the central image 354 is a color fundus image, the fundus image for analysis of only the G pixel value is generated by erasing the R pixel value and the blue pixel value (B pixel value). When the central image 354 is a G-color fundus image, conversion is not necessary because there are originally only G-color pixels. Similarly, when the analysis is performed using the B pixel value, the pixel value of the center image 354 is converted into only the blue pixel value (B pixel value).
- the reason for converting the pixel value of the central image 354 to only the G pixel value is that the G light reaches the back side of the retina, so that there is little reflection on the surface of the retina, and the G color fundus image contains information on the optic nerve fiber layer. This is because it contains. Further, the pixel value of the center image 354 may be converted into only the B pixel value. This is because the B-color fundus image contains information on the optic nerve fiber layer because B light is reflected on the surface of the retina where the optic nerve fiber layer is present. The difference in the thickness of the optic nerve fiber layer (that is, the difference between the optic nerve fiber defective portion and the optic nerve fiber normal portion) appears as a B pixel value and a G pixel value of the color fundus image.
- the normal part of the optic nerve fiber (the part where the optic nerve fiber layer is thick) has a large B pixel value and the G pixel value
- the optic nerve fiber defective part (the part where the optic nerve fiber layer is thin or absent) has the B pixel value and the G pixel value. It is known that each value of the value becomes smaller. Therefore, the optic nerve fiber defect portion can be estimated by creating a pixel value distribution map around the optic nerve head of the B pixel value or the G pixel value.
- the fundus image analysis unit 2060 further extracts a blood vessel portion from the central image 354 obtained by converting the pixel value into a green pixel value, and replaces the pixel value of the extracted blood vessel portion with the pixel value around the blood vessel portion. To do.
- the fundus image analysis unit 2060 sets the angle ⁇ to 1 degree.
- the angle ⁇ is a plurality of reference straight lines extending in the direction from the central point 352O of the optic disc 352 to the fovea 356 and a plurality of angles ⁇ extending radially starting from the central point 352O of the optic disc 352. It is a variable that identifies the angle formed clockwise with each of the straight lines (in this example, one for each degree from 0 degrees to 359 degrees, for a total of 360 lines).
- the fundus image analysis unit 2060 calculates the average pixel value between the circle C1 having a radius R1 and the circle C2 having a radius R2 in the angle ⁇ direction. Specifically, the fundus image analysis unit 2060 starts from the optic disc, where the angle formed by a clockwise angle with a reference straight line extending in the direction from the center point 352O of the optic disc 352 to the fovea 356 is an angle ⁇ . Set a straight line that extends as. The fundus image analysis unit 2060 has a pixel value existing in a portion where the ring-shaped portion between the circle C1 and the circle C2 having the radius R2 in the central image 354 obtained by converting the pixel value into the green pixel value and the set straight line overlap. Calculate the average pixel value of.
- the total value of the pixel values existing in the portion where the ring-shaped portion and the set straight line overlap may be used.
- the average pixel value is calculated every other degree, but it is not limited to once, but it is not limited to once, but it is 0.1 degree, 0.5 degree, or 2 degree, 4 degree, etc. It may be possible to set it.
- step 336 If the angle ⁇ is determined to be 360 degrees in step 336, it means that the average pixel value of 360 pixels from 0 degrees to 359 degrees has been obtained, and the process proceeds to step 340.
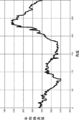
- the fundus image analysis unit 2060 uses the average pixel value and the angle data for each angle from 0 degree to 359 degrees as the green pixel value distribution (Data) around the optic nerve head as the patient's analysis data. It is saved as a data table in the memory (RAM 266).
- Data green pixel value distribution
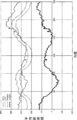
- the fundus image analysis unit 2060 or the graph creation unit 2064 has an angle on the horizontal axis and an average pixel value on the vertical axis, and average pixel values and angle data for each angle of the green pixel value distribution around the optic nerve head of the eye 12 to be inspected.
- a graph (see FIG. 12) showing the relationship with the above may be created, and the created graph may be saved in the memory (RAM 266).
- step 360 the data comparison unit 2062 extracts standard data suitable for the patient attribute input in step 302 (see FIG. 6) from the server 140.
- the standard data is stored in a storage device (not shown) of the server 140.
- the standard data is the average data of the green pixel value distribution around the optic nerve head, which is obtained by performing the analysis process of FIG. 7 on the fundus image of a normal eye. Then, standard data for normal eyes are prepared for each patient attribute (race, age, gender, etc.). Instead of the average data of the green pixel value distribution around the optic nerve head, the total value of the pixel values in the pixel value portion may be used. As described above, the standard data may be statistical values such as the average data and the total value.
- the standard data is not one average standard data (Mid) for each patient attribute, but is lower than the high group standard data (High), which is the average of the group higher than the average standard data (Mid), and the average standard data (Mid).
- step 360 in order to calculate the estimated normal eye data in step 362, the data comparison unit 2062 includes the green pixel value distribution data (Data) around the optic disc, which is the analysis data of the patient, and at least a high value suitable for the patient attribute.
- the group standard data (high) and the low group standard data (Low) are acquired from the server 140 and stored in the RAM 266.
- the data comparison unit 2062 calculates the estimated normal eye data (Standard).
- the estimated normal eye data (Standard) is data generated from the high group standard data (High), the low group standard data (Low), and the pixel value at the 180 ° position of the patient analysis data (Data). .. This is because the 180 ° pixel value is the minimum value in the "green pixel value distribution around the optic nerve head", and the graph shape of the green pixel value distribution around the optic nerve head is estimated based on the 180 ° pixel value. Because it can be done.
- estimated normal eye data can be obtained as follows.
- FIG. 13C is a conceptual diagram showing a calculation method of estimated normal eye data (Standard).
- the data comparison unit 2062 sets the pixel value: Y D 180 of the analysis data (Data) at an angle of 180 ° as the 180 ° value of the estimated normal eye data (Standard): Ys 180 . Then, the data comparison unit 2062 has a pixel value of Y H180 at a 180 ° angle of the high group standard data (High) suitable for the patient attribute, and a 180 ° angle of the low group standard data (Low) suitable for the patient attribute. Pixel value: Y L180 is acquired.
- the data comparison unit 2062 calculates a difference a between Y H180 and Ys 180, and a difference b between Ys 180 and Y L180 respectively. Then, the estimated pixel values of the normal eye data (Standard) at an angle theta Ys theta, high group at an angle theta with the standard data (High) the pixel value of the low group standard data (Low), respectively Y H.theta, and Y Erushita To do.
- the difference between the value: Ys ⁇ and the pixel value of the low group standard data (Low): Y L ⁇ is defined as the difference b'.
- a' Y H ⁇ ⁇ Ys ⁇
- b ' Ys ⁇ - Y L ⁇
- a Y H180- Y s180
- b Y s180- Y L180 Is.
- the pixel value of the angle ⁇ of the estimated normal eye data (Standard): Ys ⁇ can be expressed by an equation. Will be.
- the data comparison unit 2062 substitutes Y H180 and Y L180 , which are pixel values of 180 °, and Y H ⁇ and Y L ⁇ , which are pixel values which are pixel values at an angle ⁇ , into Equation 1, and estimates normal at an angle ⁇ .
- FIG. 13D graphically shows the relationship between the estimated normal eye data (Standard) and the analysis data (Data), the high group standard data (High), and the low group standard data (Low).
- the generated estimated normal eye data (Standard) is stored in the RAM 266 of the viewer 150.
- step 364 the data comparison unit 2062 calculates the difference 1 data (Judge1) between the estimated normal eye data (Standard) and the analysis data (Data) for each angle. Specifically, the data comparison unit 2062 performs a process of subtracting the analysis data (Data) from the estimated normal eye data (Standard) for each angle to calculate the Judge 1.
- the Judge 1 calculated for each angle is stored in the RAM 266 in association with the angle.
- FIG. 13E is a graph showing the relationship between the difference 1 data (Judge 1), the estimated normal eye data (Standard), and the analysis data (Data).
- step 366 the data comparison unit 2062 performs a process of subtracting a predetermined value (for example, 20) from the low group standard data (Low) for each angle, and calculates the danger value data (Danger).
- the calculated danger value data (Danger) is stored in the RAM 266 in association with the angle.
- Danger value data is a value indicating the lower limit of analysis data of normal eyes. Therefore, it is calculated by lowering the low group standard data (Low) by a predetermined value at all angles (offset the predetermined value).
- the predetermined value is set to 20, but a user (for example, an ophthalmologist) may be able to change it.
- the data comparison unit 2062 calculates the difference 2 data (Judge2) between the danger value data (Danger) and the analysis data (Data). Specifically, the data comparison unit 2062 performs a process of subtracting the danger value data (Danger) from the analysis data (Data) for each angle, and calculates the difference 2 data (Judge2). The difference 2 data (Judge2) calculated for each angle is stored in the RAM 266 in association with the angle.
- FIG. 13F is a graph showing the relationship between the low group standard data (Low), the analysis data (Data), the danger value data (Danger), and the difference 2 data (Judge2).
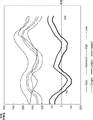
- the graph creation unit 2064 includes estimated normal eye data (Standard), low group standard data (Low), high group standard data (High), analysis data (Data), danger value data (Danger), and difference 1 data.
- Judge1 the difference 2 data (Judge2) is read from the RAM 266. Then, as shown in FIG. 14, a graph is made so as to show the relationship between each data and the angle around the optic nerve head.
- the difference 1 data (Judge1) is an example of the "first comparison data” of the technique of the present disclosure.
- Danger value data (Danger) is an example of "second comparison data” of the technique of the present disclosure.
- the graph shown in FIG. 14 is an example of the “first graph” of the technique of the present disclosure.
- the graph creation unit 2064 may create a simplified version of the graph instead of the graph shown in FIG. 14 or together with the graph shown in FIG.
- the simplified version of the graph is a simplified version of the graph in which at least some of the elements of the graph shown in FIG. 14 are omitted.
- the graph creation unit 2064 may generate the graphs shown in FIGS. 13D, 13E, and 13F described above.
- the simplified version of the graph of FIG. 13E is an example of a "second graph" of the technique of the present disclosure.
- the diagnostic support data creation unit 2066 creates diagnostic data that supports the diagnosis of glaucoma in the eye to be inspected by using the difference 1 data (Judge1) and the difference 2 data (Judge2).
- the procedure for creating glaucoma diagnosis support data is as follows.
- the diagnosis support data creation unit 2066 first specifies an angle at which the difference 1 data (Judge1) is equal to or less than a predetermined value. Specifically, the diagnosis support data creation unit 2066 determines whether or not there is an angle of ⁇ 30 or less (minus 30), for example.
- the difference 1 is a value indicating a "deviation" between the analysis data of the eye to be inspected and the analysis data of the normal eye. When this deviation is equal to or less than a predetermined value, the thickness of the optic nerve fiber layer at the angular position is reduced, and the nerve fiber is damaged.
- the difference 2 data (Judge2) has a positive value close to zero or zero (for example, +5 ⁇ difference). It is determined whether or not 2 ⁇ 0) or a negative value is exhibited.
- the difference 2 is a value indicating a "deviation" between the risk value obtained by subtracting 20 of the standard data and the analysis data of the eye to be inspected. If this deviation is zero or a positive value close to zero or a negative value, the thickness of the optic nerve fiber layer at that angle position is too thin compared to the normal eye, and the visual field is defective. May have appeared.
- the diagnostic support data creation unit 2066 causes the eye to be inspected. Estimate glaucoma and set a flag indicating that the probability of glaucoma is high. A flag of 1 indicates a high probability of glaucoma, and a flag of 0 indicates a high probability of normal eye. Then, the diagnosis support data creation unit 2066 stores the set flag as one of the patient attribute information.
- the diagnosis support data creation unit 2066 When the difference 1 is larger than -30 (when there is no angle to be -30 or less), it indicates that the analysis data of the normal eye has little deviation from the normal eye. Therefore, the diagnosis support data creation unit 2066 has the normal eye. Set the flag indicating that the probability is high to zero. Further, even when the difference 1 is -30 or less and the difference 2 is larger than 5, the diagnosis support data creation unit 2066 presumes that the eye is normal and sets the flag indicating that the probability of being normal eye is high to zero. To do. In this way, it is estimated from both the difference 1 data (Judge1) and the difference 2 data (Judge2) whether or not the patient has glaucoma. Depending on the value of this flag, an index or text indicating whether or not there is a suspicion of glaucoma can be displayed on the display screen 380 of FIG. 15 described later.
- the difference between the patient's analysis data (Data) and the standard data (Standard) is that when Judge1 is positive, the thickness of the optic nerve fiber layer of the patient is thicker than the standard, and when Judge1 is negative. Is presumed to indicate that the patient's optic nerve fiber layer is thinner than normal. This is because when the patient's optic nerve fiber layer is relatively thick, more light is reflected by the more optic nerve fibers and the pixel value is large, whereas when the optic nerve fiber layer is relatively thin, This is because there are fewer optic nerve fibers, less light is reflected, and the pixel value is smaller.
- the display control unit 204 In step 374, the display control unit 204 generates a display screen.
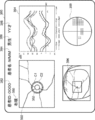
- the display screen 380 has a patient ID display area 382, a patient name display area 384, a gender display area 386, an age display area 388, a left / right identification display area 390, a central image display area 392, and a graph display area. It has 394, a UWF-SLO fundus image display area 396, and a visual field test result map display area 398.
- the patient ID eg 0000
- patient name eg MMM
- gender eg male
- age YY years old
- eye 12 to be inspected are left and right.
- Information indicating any of the above for example, the right eye is accepted.
- the display control unit 204 reads the patient information, the fundus image, the created graph and data from the RAM 266 of the server 140 or the viewer 150, and generates the display screen 380. Based on the input patient information, the display control unit 204 has "0000" in the patient ID display area 382, "MMM” in the patient name display area 384, "male” in the gender display area 386, and the age display area 388. "YY years old", “right eye” is displayed in the left and right identification display area 390.
- the display control unit 204 displays a fundus image of the eye to be inspected (fundus image in which analysis circles C1 and C2 are superimposed and displayed around the optic nerve head 352) in the central image display area 392, and is shown in FIG. 14 in the graph display area 394. Display each graph shown. Further, in the graph display area 394, a graph obtained by analyzing the green pixel value distribution around the optic nerve head is displayed on the fundus images taken at different dates and times, and a plurality of graphs are displayed so as to perform follow-up observation. The graph may be displayed. Further, the display control unit 204 displays the UWF-SLO fundus image in the UWF-SLO fundus image display area 396 and the visual field test result in the visual field test result map display area 398.
- the visual field inspection map is a diagram showing the result of measuring the range that can be seen around when one point is gazed at by using the visual field measuring device 120 (visual field meter).
- the mark "*" in the visual field test result indicates an area that is not visible due to low sensitivity of the retina.
- the display screen 380 may display an index or text indicating whether or not there is a suspicion of glaucoma based on the value of the flag generated by the diagnosis support data creation unit 2066 described above.
- the ophthalmic apparatus 110 may be provided with an optical coherence tomography (OCT, Optical Coherence Tomography).
- OCT optical coherence tomography
- the display screen 380 has an OCT image display area for displaying a tomographic image of the retina taken by OCT, a three-dimensional image of the retina, and a thickness map of the optic nerve fiber layer by performing segmentation processing on the three-dimensional image. It may be.
- the user (ophthalmologist) glaucoma is visualized by visualizing the difference 1 data (Judge 1) and the difference 2 data (Judge 2) obtained by analyzing the distribution of green pixel values around the optic nerve head.
- the user can easily grasp the degree of progression of the lesion in the fundus by considering not only the fundus image but also the analysis result of the green pixel value distribution around the optic nerve head.
- the low group standard data (Low) which is the standard data of the set of subjects whose optic nerve fiber layer is originally a thin type
- the set of subjects whose optic nerve fiber layer is originally a thick type Not only the high group standard data (High) which is the standard data and the green pixel value distribution (Data) around the papillary which is the analysis data are displayed, but also the estimated standard eye data (Standard) and the danger value data (Danger).
- Difference 1 data (Judge1), and difference 2 data (Judge2) are created.
- the fundus image analysis unit 2060 sets a circle C1 having a radius R1 and a circle C2 having a radius R2 (> R1) from the center point 352O of the optic disc 352, as shown in FIG.
- the optic nerve head may extend outside the circle C1. In this case, the distribution of green pixel values around the optic nerve head cannot be analyzed.
- the fundus image analysis unit 2060 sets the radius of the inner third circle C3 that defines the region for acquiring the green pixel value distribution to the radius R3 (> R2> R1) and the outer third circle.
- the radius of the circle C4 of 4 is set to R4 (> R3). Then, the fundus image analysis unit 2060 acquires the green pixel value distribution around the optic nerve head with the circle C3 and the circle C4 as the analysis region.
- Whether or not the optic disc 352 extends outside the circle C1 depends on whether the average value of the pixel values in the region inside the circle C1 is larger than the average value of the pixel values in the region outside the circle C1 in the central image 354.
- the fundus image analysis unit 2060 determines whether or not it is equal to or more than a predetermined value.
- the viewer 150 executes the data creation program, but the technique of the present disclosure is not limited to this, and the ophthalmic apparatus 110, the server 140, or a separately provided computer (not shown) provides the data creation program.
- the ophthalmic apparatus 110 or the server 140 that executes the data creation program is an example of the "data creation apparatus" of the technique of the present disclosure.
- the difference 1 data (Judge1) and the difference 2 data (Judge2) are displayed as a graph as shown in FIG. 14, and the center image is displayed on the display screen 380 as shown in FIG. It has an area 392, a graph display area 394, and a UWF-SLO fundus image display area 396.
- the techniques of the present disclosure are not limited to this.
- the value of the difference 1 data (Judge1) is displayed in red and the value of the difference 2 data (Judge2) is displayed in green on the center image 354 for each angle.
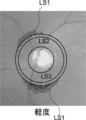
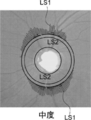
- the first line segment LS1 having a length corresponding to the value of the difference 1 data (Judge1) in the radial direction outside the circle of radius C2 is displayed as a red line segment (solid lines in FIGS. 17A to 17C). Is displayed).
- the second line segment LS2 having a length corresponding to the value of the difference 2 data (Judge2) is displayed as a green line segment (indicated by a dotted line in FIGS. 17A to 17C) superimposed on the first line segment. ..
- the lengths of the first line segment LS1 and the second line segment LS2 are displayed so as to increase as the value of the difference 1 data (Judge1) and the value of the difference 2 data (Judge2) increase.
- 17A to 17C show the value of the difference 1 data (Judge 1) and the value of the difference 2 data (Judge 2) when the glaucoma is mild, moderate, and severe, respectively.
- FIGS. 17A to 17C in the graph of FIG. 14, only the difference 1 data (Judge1) and the difference 2 data (Judge2) at angles where the values are negative are displayed outside the circle C2 in the direction of the angle. .. This makes it easier to intuitively understand the direction in which the optic nerve fiber layer is damaged and the degree of damage.
- the green pixel value distribution around the optic nerve head by the UWF-SLO fundus image is analyzed, but the SLO image in which the region including the optic nerve head is photographed may be analyzed. Further, the fundus image taken by the fundus camera may be analyzed. ⁇ Other variants>
- the data processing may be executed only by a hardware configuration such as FPGA (Field-Programmable Gate Array) or ASIC (Application Specific Integrated Circuit). Some of the data processing may be performed by the software configuration and the rest may be performed by the hardware configuration.
- FPGA Field-Programmable Gate Array
- ASIC Application Specific Integrated Circuit
Landscapes
- Life Sciences & Earth Sciences (AREA)
- Health & Medical Sciences (AREA)
- Medical Informatics (AREA)
- Biophysics (AREA)
- Ophthalmology & Optometry (AREA)
- Engineering & Computer Science (AREA)
- Biomedical Technology (AREA)
- Heart & Thoracic Surgery (AREA)
- Physics & Mathematics (AREA)
- Molecular Biology (AREA)
- Surgery (AREA)
- Animal Behavior & Ethology (AREA)
- General Health & Medical Sciences (AREA)
- Public Health (AREA)
- Veterinary Medicine (AREA)
- Eye Examination Apparatus (AREA)
Abstract
データ作成方法は、被検眼の眼底画像を取得することと、前記眼底画像における視神経乳頭を基準にした第1の範囲を画する第1の境界線と、前記第1の範囲を拡大した第2の範囲を画する第2の境界線を設定することと、前記視神経乳頭を起点とした放射方向における、前記第1の境界線と前記第2の境界線との間の複数の画素値を解析して得られた解析データを生成することと、前記被検眼に適した標準データと前記解析データとを比較した比較データを生成することと、を含む。
Description
本発明は、データ作成方法、データ作成装置、及びデータ作成プログラムに関する。
カラー撮影用の眼底カメラで撮影された眼底像に基づいて、緑内障の診断を行う緑内障診断装置(米国特許出願公開第6409342公報)が知られており、緑内障の診断を支援する装置が望まれている。
本開示の技術の第1の態様のデータ作成方法は、
被検眼の眼底画像を取得することと、
前記眼底画像における視神経乳頭を基準にした第1の範囲を画する第1の境界線と、前記第1の範囲を拡大した第2の範囲を画する第2の境界線を設定することと、
前記視神経乳頭を起点とした放射方向における、前記第1の境界線と前記第2の境界線との間の複数の画素値を解析して得られた解析データを生成することと、
前記被検眼に適した標準データと前記解析データとを比較した比較データを生成することと、
を含む。
被検眼の眼底画像を取得することと、
前記眼底画像における視神経乳頭を基準にした第1の範囲を画する第1の境界線と、前記第1の範囲を拡大した第2の範囲を画する第2の境界線を設定することと、
前記視神経乳頭を起点とした放射方向における、前記第1の境界線と前記第2の境界線との間の複数の画素値を解析して得られた解析データを生成することと、
前記被検眼に適した標準データと前記解析データとを比較した比較データを生成することと、
を含む。
本開示の技術の第2の態様のデータ作成装置は、
被検眼の眼底画像を取得する取得部と、
前記眼底画像における視神経乳頭を基準にした第1の範囲を画する第1の境界線と、前記第1の範囲を拡大した第2の範囲を画する第2の境界線を設定し、
前記視神経乳頭を起点とした放射方向における、前記第1の境界線と前記第2の境界線との間の複数の画素値を解析して得られた解析データを生成する解析部と、
前記被検眼に適した標準データと前記解析データとを比較した比較データを生成する比較部と、
を含む。
被検眼の眼底画像を取得する取得部と、
前記眼底画像における視神経乳頭を基準にした第1の範囲を画する第1の境界線と、前記第1の範囲を拡大した第2の範囲を画する第2の境界線を設定し、
前記視神経乳頭を起点とした放射方向における、前記第1の境界線と前記第2の境界線との間の複数の画素値を解析して得られた解析データを生成する解析部と、
前記被検眼に適した標準データと前記解析データとを比較した比較データを生成する比較部と、
を含む。
本開示の技術の第3の態様のデータ作成プログラムは、
被検眼の眼底の眼底画像を取得することと、
前記眼底画像における視神経乳頭を基準にした第1の範囲を画する第1の境界線と、前記第1の範囲を拡大した第2の範囲を画する第2の境界線を設定することと、
前記視神経乳頭を起点とした放射方向における、前記第1の境界線と前記第2の境界線との間の複数の画素値を解析して得られた解析データを生成することと、
前記被検眼に適した正常眼データと前記解析データとを比較した比較データを生成することと、
をコンピュータに実行させる。
被検眼の眼底の眼底画像を取得することと、
前記眼底画像における視神経乳頭を基準にした第1の範囲を画する第1の境界線と、前記第1の範囲を拡大した第2の範囲を画する第2の境界線を設定することと、
前記視神経乳頭を起点とした放射方向における、前記第1の境界線と前記第2の境界線との間の複数の画素値を解析して得られた解析データを生成することと、
前記被検眼に適した正常眼データと前記解析データとを比較した比較データを生成することと、
をコンピュータに実行させる。
以下、図面を参照して本発明の実施の形態を詳細に説明する。
図1を参照して、眼科システム100の構成を説明する。図1に示すように、眼科システム100は、眼科装置110と、視野計測装置120と、サーバ装置(以下、「サーバ」という)140と、画像表示装置(以下、「ビューワ」という)150と、を備えている。眼科装置110は、被検眼の眼底画像の取得を行う。視野計測装置120は、視野計測を行う。サーバ140は、眼科装置110によって得られた被検眼の眼底画像と、視野計測装置120によって得られた視野計測結果とを、被検者(患者ともいう)のIDに対応して記憶する。ビューワ150は、サーバ140から取得した眼底画像、眼底画像を解析して得られた解析結果や視野計測結果を表示する。
眼科装置110、視野計測装置120、サーバ140、およびビューワ150は、ネットワーク130を介して、相互に接続されている。
サーバ140は、本開示の技術の「データ作成装置」の一例である。
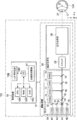
次に、図2を参照して、眼科装置110の構成を説明する。
説明の便宜上、走査型レーザ検眼鏡(Scanning Laser Ophthalmoscope)を「SLO」と称する。
なお、眼科装置110が水平面に設置された場合の水平方向を「X方向」、水平面に対する垂直方向を「Y方向」とし、被検眼12の前眼部の瞳孔27の中心と眼球の中心Oとを結ぶ方向を「Z方向」とする。従って、X方向、Y方向、およびZ方向は互いに垂直である。
眼科装置110は、撮影装置14および制御装置16を含む。撮影装置14は、SLOユニット18を備えており、被検眼12の眼底の眼底画像を取得する。以下、SLOユニット18により取得された二次元眼底画像をSLO画像と称する。
制御装置16は、CPU(Central Processing Unit(中央処理装置))16A、RAM(Random Access Memory)16B、ROM(Read-Only memory)16C、および入出力(I/O)ポート16Dを有するコンピュータを備えている。
制御装置16は、I/Oポート16Dを介してCPU16Aに接続された入力/表示装置16Eを備えている。入力/表示装置16Eは、被検眼12の画像を表示したり、ユーザから各種指示を受け付けたりするグラフィックユーザインターフェースを有する。グラフィックユーザインターフェースとしては、タッチパネル・ディスプレイが挙げられる。
また、制御装置16は、I/Oポート16Dに接続された画像処理装置17を備えている。画像処理装置17は、撮影装置14によって得られたデータに基づき被検眼12の眼底画像を生成する。なお、制御装置16は、図示しない通信インターフェースを介してネットワーク130に接続される。
上記のように、図2では、眼科装置110の制御装置16が入力/表示装置16Eを備えているが、本開示の技術はこれに限定されない。例えば、眼科装置110の制御装置16は入力/表示装置16Eを備えず、眼科装置110とは物理的に独立した別個の入力/表示装置を備えるようにしてもよい。この場合、当該表示装置は、制御装置16のCPU16Aの制御下で動作する画像処理プロセッサユニットを備える。画像処理プロセッサユニットが、CPU16Aの出力指示した画像信号に基づいて、SLO画像等を表示するようにしてもよい。
撮影装置14は、制御装置16のCPU16Aの制御下で作動する。撮影装置14は、SLOユニット18、および撮影光学系19を含む。
撮影光学系19は、スキャナ22、および広角光学系30を含む。スキャナ22は、SLOユニット18から射出された光をX方向、およびY方向に2次元走査する。スキャナ22は、光束を偏向できる光学素子であればよく、MEMS(Micro Electro Mechanical Systems)スキャナを用いることができる。また、ポリゴンミラーや、ガルバノミラー等の組み合わせであってもよい。
広角光学系30は、共通光学系を有する対物光学系(図2では不図示)を含む。なお、共通光学系の対物光学系は、楕円鏡などの凹面ミラーを用いた反射光学系や、広角レンズなどを用いた屈折光学系、あるいは、凹面ミラーやレンズを組み合わせた反射屈折光学系でもよい。楕円鏡や広角レンズなどを用いた広角光学系を用いることにより、眼底中心部だけでなく眼底周辺部の網膜を撮影することが可能となる。
楕円鏡を含むシステムを用いる場合には、国際公開WO2016/103484あるいは国際公開WO2016/103489に記載された楕円鏡を用いたシステムを用いる構成でもよい。国際公開WO2016/103484の開示および国際公開WO2016/103489の開示の各々は、その全体が参照により本明細書に取り込まれる。
広角光学系30によって、眼底において広い視野(FOV:Field of View)12Aでの観察が実現される。FOV12Aは、撮影装置14によって撮影可能な範囲を示している。FOV12Aは、視野角として表現され得る。視野角は、本実施の形態において、内部照射角と外部照射角とで規定され得る。外部照射角とは、眼科装置110から被検眼12へ照射される光束の照射角を、瞳孔27を基準として規定した照射角である。また、内部照射角とは、眼底Fへ照射される光束の照射角を、眼球中心Oを基準として規定した照射角である。外部照射角と内部照射角とは、対応関係にある。例えば、外部照射角が120度の場合、内部照射角は約160度に相当する。本実施の形態では、内部照射角は200度としている。
ここで、内部照射角で160度以上の撮影画角で撮影されて得られたSLO眼底画像をUWF-SLO眼底画像と称する。なお、UWFとは、Ultra Wide Field(超広角)の略称を指す。
SLOユニット18は、B光(青色光)の光源40、G光(緑色光)の光源42、R光(赤色光)の光源44、およびIR光(赤外線(例えば、近赤外光))の光源46と、光源40、42、44、46からの光を、反射又は透過して1つの光路に導く光学系48、50、52、54、56とを備えている。光学系48、56は、ミラーであり、光学系50、52、54は、ビームスプリッタ―である。B光は、光学系48で反射し、光学系50を透過し、光学系54で反射し、G光は、光学系50、54で反射し、R光は、光学系52、54を透過し、IR光は、光学系56、52で反射して、それぞれ1つの光路に導かれる。
SLOユニット18は、B光(480nm)、G光(530nm)、およびR光(640nm)を発するモードと、近赤外線(800nm)を発するモードなど、波長の異なるレーザ光を発する光源の組合せを切り替え可能に構成されている。図2では、B光(青色光)の光源40、G光の光源42、R光の光源44、およびIR光の光源46の4つの光源を備えるが、本開示の技術は、これに限定されない。例えば、SLOユニット18は、更に、白色光の光源を更に備え、白色光のみを発するモード等の種々のモードで光を発するようにしてもよい。
SLOユニット18から撮影光学系19に入射された光は、スキャナ22によってX方向およびY方向に走査される。走査光は広角光学系30および瞳孔27を経由して、被検眼12の後眼部(眼底)に照射される。眼底により反射された反射光は、広角光学系30およびスキャナ22を経由してSLOユニット18へ入射される。
SLOユニット18は、被検眼12の眼底からの光の内、B光を反射し且つB光以外を透過するビームスプリッタ64、ビームスプリッタ64を透過した光の内、G光を反射し且つG光以外を透過するビームスプリッタ58を備えている。SLOユニット18は、ビームスプリッタ58を透過した光の内、R光を反射し且つR光以外を透過するビームスプリッタ60を備えている。SLOユニット18は、ビームスプリッタ60を透過した光の内、IR光を反射するビームスプリッタ62を備えている。SLOユニット18は、ビームスプリッタ64により反射したB光を検出するB光検出素子70、ビームスプリッタ58により反射したG光を検出するG光検出素子72、ビームスプリッタ60により反射したR光を検出するR光検出素子74、およびビームスプリッタ62により反射したIR光を検出するIR光検出素子76を備えている。
広角光学系30およびスキャナ22を経由してSLOユニット18へ入射された光(眼底により反射された反射光)は、B光の場合、ビームスプリッタ64で反射してB光検出素子70により受光され、G光の場合、ビームスプリッタ64を透過し、ビームスプリッタ58で反射してG光検出素子72により受光される。上記入射された光は、R光の場合、ビームスプリッタ64、58を透過し、ビームスプリッタ60で反射してR光検出素子74により受光される。上記入射された光は、IR光の場合、ビームスプリッタ64、58、60を透過し、ビームスプリッタ62で反射してIR光検出素子76により受光される。CPU16Aの制御下で動作する画像処理装置17は、B光検出素子70、G光検出素子72、R光検出素子74、およびIR光検出素子76で検出された信号を用いてUWF-SLO眼底画像を生成する。
UWF-SLO眼底画像には、眼底がG光で撮影されて得られたUWF-SLO眼底画像(G色眼底画像)と、眼底がR光で撮影されて得られたUWF-SLO眼底画像(R色眼底画像)とがある。UWF-SLO眼底画像には、眼底がB光で撮影されて得られたUWF-SLO眼底画像(B色眼底画像)と、眼底がIR光で撮影されて得られたUWF-SLO眼底画像(IR眼底画像)とがある。
また、制御装置16が、同時に発光するように光源40、42、44を制御する。B光、G光およびR光で同時に被検眼12の眼底が撮影されることにより、各位置が互いに対応するG色眼底画像、R色眼底画像、およびB色眼底画像が得られる。G色眼底画像、R色眼底画像、およびB色眼底画像を合成することによりカラー眼底画像が得られる。制御装置16が、同時に発光するように光源42、44を制御し、G光およびR光で同時に被検眼12の眼底が撮影されることにより、各位置が互いに対応するG色眼底画像およびR色眼底画像が得られる。G色眼底画像およびR色眼底画像を合成することによりR色とG色による疑似カラー眼底画像が得られる。
なお、R光とG光の同時撮影、R光とB光の同時撮影、G光とB光の同時撮影など様々な光源の組合せで発光制御することが可能である。
なお、R光とG光の同時撮影、R光とB光の同時撮影、G光とB光の同時撮影など様々な光源の組合せで発光制御することが可能である。
B色眼底画像、G色眼底画像、R色眼底画像、IR眼底画像、カラー眼底画像、の各画像データは、図示しない通信インターフェース(I/F)を介して眼科装置110からサーバ140へ送付される。サーバ140は、眼科装置110から受信したデータを記憶する。
眼科装置110は、上述した広角光学系を有する走査型レーザ検眼鏡(SLO)だけでなく、眼底カメラであってもよい。
眼科装置110は、上述した広角光学系を有する走査型レーザ検眼鏡(SLO)だけでなく、眼底カメラであってもよい。
次に、図3を参照して、ビューワ150の電気系の構成を説明する。図3に示すように、ビューワ150は、コンピュータ本体252を備えている。コンピュータ本体252は、バス270を介して相互に接続されたCPU262、RAM266、ROM264、および入出力(I/O)ポート268を有する。入出力(I/O)ポート268には、記憶装置254、ディスプレイ256、マウス255M、キーボード255K、および通信インターフェース(I/F)258が接続されている。記憶装置254は、例えば、不揮発メモリで構成される。入出力(I/O)ポート268は、通信インターフェース(I/F)258を介して、ネットワーク130に接続されている。従って、ビューワ150は、眼科装置110およびサーバ140と通信することができる。
記憶装置254は、後述するデータ作成プログラムが記憶されている。
なお、サーバ149の電気系の構成は、ビューワ150の電気系の構成と同様であるので、その説明を省略する。
記憶装置254は、後述するデータ作成プログラムが記憶されている。
なお、サーバ149の電気系の構成は、ビューワ150の電気系の構成と同様であるので、その説明を省略する。
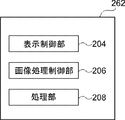
次に、図4を参照して、ビューワ150のCPU262がデータ作成プログラムを実行することで実現される各種機能について説明する。CPU262がデータ作成プログラムを実行することで、CPU262は、図4に示すように、表示制御部204、画像処理部206、および処理部208として機能する。
なお、画像処理部206は、本開示の技術の「解析部」、「比較部」及び「作成部」の一例であり、処理部208は、本開示の技術の「取得部」の一例である。
図5は、画像処理部206の構成を示すブロック図である。画像処理部206は、眼底画像解析部2060、データ比較部2062、グラフ作成部2064及び診断支援データ作成部2066を有する。
なお、画像処理部206は、本開示の技術の「解析部」、「比較部」及び「作成部」の一例であり、処理部208は、本開示の技術の「取得部」の一例である。
図5は、画像処理部206の構成を示すブロック図である。画像処理部206は、眼底画像解析部2060、データ比較部2062、グラフ作成部2064及び診断支援データ作成部2066を有する。
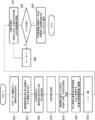
次に、図6を用いて、ビューワ150によるデータ作成処理を詳細に説明する。図6には、データ作成プログラムのフローチャートが示されている。ビューワ150のCPU262がデータ作成プログラムを実行することで、図6のフローチャートに示されたデータ作成方法が実現される。
ステップ302で、処理部208は、ユーザによるマウス255M、キーボード255Kを介した患者属性情報(例えば、年令、性別、及び人種)の入力を受け付ける。ステップ304で、処理部208は、サーバ140から、ステップ302で入力された患者属性情報に対応する図8に示す眼底画像(UWF-SLO眼底画像(特に、カラー眼底画像))350を取得する。カラー眼底画像とはR光とG光、あるいはR光、G光及びB光を同時に照射して撮影されたUWF-SLO眼底画像である。
G色眼底画像、あるいはB光眼底画像をサーバ140から取得するようにしてもよい。
また、サーバ140だけでなくビューワ150に接続されているハードディスク機器などの記憶媒体から眼底画像を読み出すようにしてもよい。さらに、眼科装置110で撮影された眼底画像を取得するようにしてもよい。
G色眼底画像、あるいはB光眼底画像をサーバ140から取得するようにしてもよい。
また、サーバ140だけでなくビューワ150に接続されているハードディスク機器などの記憶媒体から眼底画像を読み出すようにしてもよい。さらに、眼科装置110で撮影された眼底画像を取得するようにしてもよい。
なお、ステップ302では、被検眼12が左右の何れを示す情報(例えば、右眼)、患者ID(例えば、0000)及び患者名(例えば、MMM)等の入力も受け付ける。
ステップ306で、画像処理部206(特に、眼底画像解析部2060)は、眼底画像350を解析処理(詳細は後述)する。
ステップ308で、画像処理部206(特に、データ比較部2062、グラフ作成部1064、及び診断支援データ作成部2066))は、ステップ306の解析結果と標準データベースとを比較する比較処理(詳細は後述)を実行する。
ステップ310で、表示制御部204は、ステップ308での比較処理に基づく表示画面380(図15参照)を生成し、表示する。
次に、図7を参照して、図6のステップ306の眼底画像の解析処理を詳細に説明する。
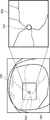
ステップ320で、眼底画像解析部2060は、図8に示すUWF-SLO眼底画像350から、予め定まる視神経乳頭352の画像のパターンマッチングをすることにより、視神経乳頭352を検出する。視神経乳頭352はUWF-SLO眼底画像350において最も明るい領域であるので、UWF-SLO眼底画像350において画素値が最も大きい画素を含む領域を視神経乳頭として検出するようにしてもよい。
ステップ322で、眼底画像解析部2060は、図8に示すように、UWF-SLO眼底画像350から、視神経乳頭352を含む眼底中心領域(長方形(なお、正方形でも、楕円形等でもよい))を中心画像354として切り出す(トリミングを行う)。
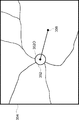
ステップ324で、眼底画像解析部2060は、図9に示すように、中心画像354から、視神経乳頭352の中心点352Oと中心窩356を抽出する。視神経乳頭352の中心点352Oの抽出は、中心画像354のなかで最も明るい位置であるので、中心画像354において画素値が最も大きい画素の位置を中心点352Oとして検出する。また、中心窩356は中心画像354のなかで最も暗い領域であるので、中心画像354において画素値が最も小さい画素の位置を中心窩356として抽出する。
ステップ326で、眼底画像解析部2060は、図9に示すように、視神経乳頭352の中心点352Oから中心窩356への方向に伸びる基準となる直線を設定し、設定した直線に0度位置を設定する。
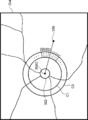
ステップ328で、眼底画像解析部2060は、図10に示すように、視神経乳頭352の中心点352Oから、半径R1の円C1、半径R2(>R1)の円C2を設定する。円C1の半径R1は視神経乳頭352の半径の1.7倍、円C2の半径R2は視神経乳頭352の半径の2.0倍に設定されている。
なお、円C1は、本開示の技術の「第1の境界線」、「第1同心円」の一例であり、円C2は、本開示の技術の「第2の境界線」、「第2同心円」の一例である。
ステップ330で、眼底画像解析部2060は、中心画像354の画素値を緑画素値(G画素値)のみに変換する。中心画像354がカラー眼底画像であれば、R画素値及び青画素値(B画素値)を消去することにより、G画素値のみの解析のための眼底画像が生成される。中心画像354がG色眼底画像の場合は、もともとG色画素しかないので変換は不要である。同様に、なお、B画素値により解析を行う場合は、中心画像354の画素値を、青画素値(B画素値)のみに変換する。
中心画像354の画素値をG画素値のみに変換する理由は、G光は、網膜の裏側まで到達するため、網膜の表面での反射が少なく、G色眼底画像には、視神経繊維層の情報が含まれるためである。また、中心画像354の画素値をB画素値のみに変換するようにしてもよい。B光は視神経繊維層が存在する網膜の表面で反射するので、B色眼底画像には、視神経繊維層の情報が含まれているためである。視神経線維層の厚さの違い(つまり、視神経線維欠損部と視神経線維正常部との違い)は、カラー眼底画像のB画素値とG画素値となって現れる。視神経線維正常部(視神経繊維層が厚い部分)はB画素値及びG画素値の各々の値が大きく、視神経線維欠損部(視神経線維層が薄いあるいは存在しない部分)は、B画素値及びG画素値の各々の値が小さくなることが知られている。よって、B画素値あるいはG画素値の視神経乳頭回りの画素値分布図を作成することにより、視神経線維欠損部を推定することができる。
ステップ330では更に、眼底画像解析部2060は、画素値を緑画素値に変換した中心画像354から血管部分を抽出し、抽出した血管部分の画素値を、当該血管部分の周辺の画素値に置換する。
ステップ332で、眼底画像解析部2060は、角度θに1度をセットする。角度θは、図11に示すように、視神経乳頭352の中心点352Oから中心窩356への方向に伸びる基準となる直線と視神経乳頭352の中心点352Oを起点(0度)として放射状に伸びる複数(本例では、0度~359度までの1度ごとに一本で、合計360本)の直線の各々との時計回りのなす角を識別する変数である。
ステップ334で、眼底画像解析部2060は、角度θ方向の半径R1の円C1、半径R2の円C2の間の平均画素値を算出する。具体的には、眼底画像解析部2060は、視神経乳頭352の中心点352Oから中心窩356への方向に伸びる基準となる直線との時計回りのなす角が、角度θとなる、視神経乳頭を起点として伸びる直線を設定する。眼底画像解析部2060は、画素値を緑画素値に変換した中心画像354における円C1と半径R2の円C2の間のリング状の部分と、設定した直線と、が重なる部分に存在する画素値の平均画素値を算出する。
なお、平均画素値に代えて、上記リング状の部分と、設定した直線と、が重なる部分に存在する画素値の総和値でもよい。
ステップ336で、眼底画像解析部2060は、角度θが360度か否かを判断する。θ=360度と判断されなかった場合には、ステップ338で、眼底画像解析部2060は、角度θに1度を加算したものを、角度θとする(θ←θ+1)。そして、データ作成処理は、ステップ334に戻る。ここでは、1度おきに平均画素値を算出するようにしたが、1度に限らず0.1度や0.5度、あるは2度、4度など診断や研究などの目的に応じて設定できるようにしてもよい。
ステップ336で角度θが360度と判断された場合には、0度から359度までの360個の平均画素値が求められたことになり、ステップ340に進む。
ステップ340で、眼底画像解析部2060は、0度から359度分の各角度についての平均画素値と角度データとを、視神経乳頭周りの緑画素値分布(Data)を、患者の解析データとして、メモリ(RAM266)に、データテーブルとして保存する。
ステップ340で、眼底画像解析部2060は、0度から359度分の各角度についての平均画素値と角度データとを、視神経乳頭周りの緑画素値分布(Data)を、患者の解析データとして、メモリ(RAM266)に、データテーブルとして保存する。
なお、眼底画像解析部2060又はグラフ作成部2064は、横軸に角度、縦軸に平均画素値にとり、被検眼12の視神経乳頭周りの緑画素値分布の各角度についての平均画素値と角度データとの関係を表すグラフ(図12参照)を作成し、作成したグラフを、メモリ(RAM266)に保存してもよい。
次に、図13Aのフローチャートを参照して、図6のステップ308の解析結果と標準データベースとの比較処理を説明する。
ステップ360で、データ比較部2062は、ステップ302(図6参照)で入力された患者属性に適した標準データを、サーバ140から抽出する。標準データはサーバ140の記憶装置(図示せぬ)に記憶されている。
ここで、標準データは、正常眼の眼底画像に対して、図7の解析処理を行うことにより得られた、視神経乳頭周りの緑画素値分布の平均データである。そして、患者属性(人種、年齢、性別など)毎に正常眼の標準データが用意されている。
なお、視神経乳頭周りの緑画素値分布の平均データに代えて、画素値部分における画素値の総和値でもよい。このように、標準データは、上記平均データや上記総和値等の統計値でもよい。
標準データは、患者属性毎に1つの平均標準データ(Mid)ではなく、当該平均標準データ(Mid)より高い群の平均である高群標準データ(High)、当該平均標準データ(Mid)より低い群の平均である低群の標準データ(Low)の3つが用意されている。
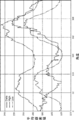
図13Bには、患者の解析データ(Data)、高群標準データ(High)、及び低群標準データ(Low)がそれぞれ、実線、一点鎖線、二点鎖線のグラフで示されている。平均標準データ(Mid)は図示していないが、高群標準データ(High)と低群標準データ(Low)との間に位置する。
ステップ360では、データ比較部2062は、ステップ362で推定正常眼データを算出するために、患者の解析データである視神経乳頭周りの緑画素値分布データ(Data)と、患者属性に適した少なくとも高群標準データ(high)と低群標準データ(Low)とをサーバ140から取得し、RAM266に記憶する。
ステップ362で、データ比較部2062は、推定正常眼データ(Standard)を算出する。推定正常眼データ(Standard)とは、高群標準データ(High)と低群標準データ(Low)と、患者の解析データ(Data)の180°の位置の画素値から、生成されるデータである。これは、180°の画素値が『視神経乳頭周りの緑画素値分布』に置いて最小値であり、180°の画素値を基準にして、視神経乳頭周りの緑画素値分布のグラフ形状が推定できるからである。
具体的には、次のようにして推定正常眼データが得られる。図13Cは、推定正常眼データ(Standard)の計算手法を示した概念図である。
まず、データ比較部2062は、解析データ(Data)の180°の角度における画素値:YD180を推定正常眼データ(Standard)の180°の値:Ys180と設定する。そして、データ比較部2062は、患者属性に適した高群標準データ(High)の180°の角度における画素値:YH180、患者属性に適した低群標準データ(Low)の180°の角度における画素値:YL180を取得する。
次に、データ比較部2062は、YH180とYs180との差aと、Ys180とYL180との差bとをそれぞれ計算する。 次に、角度θにおける推定正常眼データ(Standard)の画素値をYsθ、角度θにおける高群標準データ(High)と低群標準データ(Low)の画素値を、それぞれYHθ、YLθとする。さらに、角度θにおける、高群標準データ(High)の画素値:YHθと推定正常眼データ(Standard)の画素値:Ysθとの差を差a’、推定正常眼データ(Standard)の画素値:Ysθと低群標準データ(Low)の画素値:YLθとの差を差b’とする。
次に、データ比較部2062は、差a’と差b’とが、
a/b=a’/b’
の関係を満たすYsθを推定正常眼データ(Standard)の角度θの画素値として計算する。
ここで、a’=YHθ- Ysθ、
b’ = Ysθ- YLθ
a= YH180 -Ys180 、
b = Ys180- YL180
である。
a/b=a’/b’
の関係を満たすYsθを推定正常眼データ(Standard)の角度θの画素値として計算する。
ここで、a’=YHθ- Ysθ、
b’ = Ysθ- YLθ
a= YH180 -Ys180 、
b = Ys180- YL180
である。
推定正常眼データ(Standard)の角度θの画素値:Ysθを式で表すと、

となる。
となる。
データ比較部2062は、180°の画素値である、YH180とYL180、角度θにおける画素値である画素値である、YHθとYLθを、数式1に代入し、角度θにおける推定正常眼データ(Standard)の画素値:Ysθを計算する。この計算をすべてのθにおいて行うことにより、推定正常眼データ(Standard)のグラフ描画用のデータが作成される。図13Dには、推定正常眼データ(Standard)と、解析データ(Data)、高群標準データ(High)及び低群標準データ(Low)との関係がグラフで示されている。生成された推定正常眼データ(Standard)は、ビューワ150のRAM266に記憶される。
ステップ364で、データ比較部2062は、各角度について、推定正常眼データ(Standard)との解析データ(Data)との差分1データ(Judge1)を計算する。具体的には、データ比較部2062は、各角度について推定正常眼データ(Standard)から解析データ(Data)を減算する処理を行い、Judge1を算出する。各角度について計算されたJudge1は角度と対応付けてRAM266に記憶される。図13Eには、差分1データ(Judge1)と、推定正常眼データ(Standard)と解析データ(Data)との関係がグラフで示されている。
ステップ366で、データ比較部2062は、各角度について、低群標準データ(Low)から所定値(例えば、20)を減算する処理を行い、危険値データ(Danger)を算出する。計算された危険値データ(Danger)は角度と対応付けてRAM266に記憶される。
危険値データ(Danger)は、正常眼の解析データの下限を示す値である。そのため低群標準データ(Low)をすべての角度において所定値下げる(当該所定値をオフセットする)ことで算出される。
ここで、当該所定値は20と設定しているが、ユーザ(例えば、眼科医)が変更できるようにしてもよい。
ステップ368で、データ比較部2062は、危険値データ(Danger)と解析データ(Data)との差分2データ(Judge2)を計算する。具体的には、データ比較部2062は、各角度について、解析データ(Data)から危険値データ(Danger)を減算する処理を行い、差分2データ(Judge2)を算出する。各角度について計算された差分2データ(Judge2)は角度と対応付けてRAM266に記憶される。
図13Fには、低群標準データ(Low)、解析データ(Data)、危険値データ(Danger)と差分2データ(Judge2)との関係がグラフで示されている。
図13Fには、低群標準データ(Low)、解析データ(Data)、危険値データ(Danger)と差分2データ(Judge2)との関係がグラフで示されている。
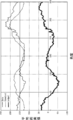
ステップ370で、グラフ作成部2064は、推定正常眼データ(Standard)、低群標準データ(Low)、高群標準データ(High)、解析データ(Data)、危険値データ(Danger)、差分1データ(Judge1)、差分2データ(Judge2)をRAM266から読み出す。
そして、図14に示すように、各データと視神経乳頭回りの角度との関係を示すようにグラフ化する。
差分1データ(Judge1)は本開示の技術の「第1比較データ」の一例である。危険値データ(Danger)は本開示の技術の「第2比較データ」の一例である。図14に示すグラフは本開示の技術の「第1グラフ」の一例である。
そして、図14に示すように、各データと視神経乳頭回りの角度との関係を示すようにグラフ化する。
差分1データ(Judge1)は本開示の技術の「第1比較データ」の一例である。危険値データ(Danger)は本開示の技術の「第2比較データ」の一例である。図14に示すグラフは本開示の技術の「第1グラフ」の一例である。
ステップ370で、グラフ作成部2064は、図14に示すグラフに代え又は図14に示すグラフと共に、簡易版のグラフを作成するようにしてもよい。簡易版のグラフは、図14に示すグラフの要素の少なくともいくつかを省略した簡易版のグラフである。例えば、上述した、図13D、図13E及び図13Fに示すグラフをグラフ作成部2064が生成するようにしてもよい。図13Eの簡易版のグラフは、本開示の技術の「第2グラフ」の一例である。
ステップ372で、診断支援データ作成部2066は、差分1データ(Judge1)と差分2データ(Judge2)を用いて、被検眼の緑内障の診断を支援する診断データを作成する。
緑内障の診断支援データの作成は以下の手順で行われる。
診断支援データ作成部2066は、まず、差分1データ(Judge1)が所定値以下となっている角度を特定する。具体的には、診断支援データ作成部2066は、例えば、-30以下(マイナス30)となっている角度があるか否かを判断する。差分1は被検眼の解析データと正常眼の解析データとの「ずれ」を示す値である。このずれが所定値以下である場合、その角度位置の視神経線維層の厚さが減少しており神経線維のダメージが存在することになる。
診断支援データ作成部2066は、まず、差分1データ(Judge1)が所定値以下となっている角度を特定する。具体的には、診断支援データ作成部2066は、例えば、-30以下(マイナス30)となっている角度があるか否かを判断する。差分1は被検眼の解析データと正常眼の解析データとの「ずれ」を示す値である。このずれが所定値以下である場合、その角度位置の視神経線維層の厚さが減少しており神経線維のダメージが存在することになる。
つぎに、診断支援データ作成部2066は、差分1データ(Judge1)が所定値以下となっている角度において、差分2データ(Judge2)が、ゼロに近い正の値又はゼロ(例えば、+5≦差分2≦0)、あるいは負の値を示すか否かを判断する。差分2は、標準データを20差し引いた危険値と被検眼の解析データとの「ずれ」を示す値である。このずれが、ゼロあるいはゼロに近い正の値や、負の値である場合、その角度位置の視神経線維層の厚さが正常眼に比べて視神経線維層が薄くなりすぎており、視野に欠損が出ている可能性がある。
そして、診断支援データ作成部2066は、差分1が-30以下であり、かつ、差分2がゼロあるいはゼロに近い正の値や、負の値である角度位置が存在する場合は、被検眼が緑内障であると推定し、緑内障である確率が高いことを示すフラグ設定する。フラグが1であれば緑内障である確率が高いことを示し、フラグがゼロであれば正常眼である確率が高いことを示す。そして、診断支援データ作成部2066は、設定したフラグを患者属性情報の一つとして記憶する。
差分1が-30より大きい場合(-30以下となる角度が存在しない場合)は、正常眼の解析データがとのずれが少ないことを示しているため、診断支援データ作成部2066は、正常眼である確率が高いことを示すフラグをゼロに設定する。また、差分1が-30以下で、かつ、差分2が5より大きい場合も、診断支援データ作成部2066は、正常眼と推定し、正常眼である確率が高いことを示すフラグをゼロに設定する。このようにして、差分1データ(Judge1)と差分2データ(Judge2)との双方から緑内障であるか否かの推定がなされる。このフラグの値により、後述する図15の表示画面380に緑内障の疑いがあるか否かを示す指標やテキストを表示するようにすることができる。
また、患者の解析データ(Data)と標準データ(Standard)とに違いがある部分は、Judge1が正の場合には、患者の視神経繊維層の厚さが標準より厚く、Judge1が負の場合には、患者の視神経繊維層の厚さが標準より薄いことを示すものと推測される。なぜなら、患者の視神経繊維層の厚さが比較的厚いと、より多く存在する視神経繊維によりより光が反射され、画素値が大きくなるのに対し、視神経繊維層の厚さが比較的薄いと、視神経繊維がより少なく光が反射されず、画素値が小さくなるからである。
ステップ374では、表示制御部204は、表示画面を生成する。図15に示すように、表示画面380は、患者ID表示領域382、患者名表示領域384、性別表示領域386、年令表示領域388、左右識別表示領域390、中心画像表示領域392、グラフ表示領域394、UWF-SLO眼底画像表示領域396、及び視野検査結果マップ表示領域398を有する。
上記のように、ステップ302(図6参照)で、患者ID(例えば、0000)、患者名(例えば、MMM)、性別(例えば、男性)、年令(YY才)、及び被検眼12が左右の何れを示す情報(例えば、右眼)の入力が受け付けられている。
ステップ374では、表示制御部204は、サーバ140あるはビューワ150のRAM266から、患者情報、眼底画像、作成されたグラフやデータを読出し、表示画面380を生成する。
表示制御部204は、入力された患者情報に基づいて、患者ID表示領域382に「0000」、患者名表示領域384に「MMM」、性別表示領域386に「男性」、年令表示領域388に「YY才」、左右識別表示領域390に「右眼」を表示する。
表示制御部204は、入力された患者情報に基づいて、患者ID表示領域382に「0000」、患者名表示領域384に「MMM」、性別表示領域386に「男性」、年令表示領域388に「YY才」、左右識別表示領域390に「右眼」を表示する。
表示制御部204は、中心画像表示領域392に被検眼の眼底画像(視神経乳頭352の周囲に解析円C1とC2が重畳表示された眼底画像)を表示し、グラフ表示領域394に図14に示されている各グラフを表示する。また、グラフ表示領域394には、異なる日時に撮影された眼底画像に対して、視神経乳頭周りの緑画素値分布を解析することにより得られたグラフを表示させ、経過観察を行うように複数のグラフを表示させるようにしてもよい。
さらに、表示制御部204は、UWF-SLO眼底画像表示領域396にUWF-SLO眼底画像、視野検査結果マップ表示領域398に視野検査結果を表示する。
視野検査マップは、一点を注視したときに周囲に見える範囲を視野計測装置120(視野計)を用いて測定された結果を示す図である。視野検査結果のマーク「※」は網膜の感度が低くなっていて見えていない領域を示している。
さらに、表示制御部204は、UWF-SLO眼底画像表示領域396にUWF-SLO眼底画像、視野検査結果マップ表示領域398に視野検査結果を表示する。
視野検査マップは、一点を注視したときに周囲に見える範囲を視野計測装置120(視野計)を用いて測定された結果を示す図である。視野検査結果のマーク「※」は網膜の感度が低くなっていて見えていない領域を示している。
なお、表示画面380は、前述した診断支援データ作成部2066で生成されたフラグの値により、緑内障の疑いがあるか否かを示す指標やテキストを表示するようにしてもよい。
また、眼科装置110は、光干渉断層計(OCT、Optical Coherence Tomography)を備えるようにしてもよい。この場合、OCTにより撮影された網膜の断層画像や網膜の3次元画像、この3次元画像に対してセグメンテーション処理を行い視神経線維層の厚みマップを表示するOCT画像表示領域を表示画面380に有するようにしてもよい。
以上説明した実施の形態では、視神経乳頭周りの緑画素値分布を解析して得られた、差分1データ(Judge1)と差分2データ(Judge2)を可視化することにより、ユーザ(眼科医)の緑内障診断を支援することができる。ユーザは、眼底画像だけでなく視神経乳頭周りの緑画素値分布の解析結果を考慮することにより、眼底の病変の進行度合の把握を容易に行うことができる。
また、本実施の形態では、視神経線維層がもともと薄いタイプである被検者の集合の標準データである低群標準データ(Low)、視神経線維層がもともと厚いタイプである被検者の集合の標準データである高群標準データ(High)、解析データである乳頭周りの緑画素値分布(Data)だけを表示するのではなく、さらに、推定標準眼データ(Standard)、危険値データ(Danger)、差分1データ(Judge1)、及び差分2データ(Judge2)のグラフを作成している。これらのグラフを見たユーザ(眼科医)は、特に、差分2データ(Judge2)のグラフから、値が0以下の部分があるかどうか、値が0以下の部分でどのくらい0を下回っているかを考慮して、緑内障の診断を行うことが可能となる。
[変形例]
次に、本開示の技術の変形例を説明する。
<第1の変形例>
次に、本開示の技術の変形例を説明する。
<第1の変形例>
上記実施の形態では、眼底画像解析部2060は、図10に示すように、視神経乳頭352の中心点352Oから、半径R1の円C1、半径R2(>R1)の円C2を設定する。
しかし、図16に示すように、視神経乳頭が円C1の外まで拡張している場合がある。この場合には、視神経乳頭周りの緑画素値分布を解析することができない。
そこで、第1の変形例では、眼底画像解析部2060は、緑画素値分布を取得する領域を画定する内側の第3の円C3の半径を半径R3(>R2>R1)に、外側の第4の円C4の半径をR4(>R3)に設定する。そして、眼底画像解析部2060は、円C3と円C4を解析領域とし、視神経乳頭周りの緑画素値分布を取得する。
視神経乳頭352が円C1の外まで拡張しているか否かは、中心画像354において円C1内の領域の画素値の平均値が円C1内の領域の外側の領域の画素値の平均値よりも所定値以上か否かにより、眼底画像解析部2060が判断する。
<第2の変形例>
上記実施の形態では、ビューワ150が、データ作成プログラムを実行しているが、本開示の技術はこれに限定されず、眼科装置110、サーバ140、又は図示しない別に設けたコンピュータが、データ作成プログラムを実行してもよい、この場合、データ作成プログラムを実行する眼科装置110又はサーバ140は、本開示の技術の「データ作成装置」の一例である。
<第3の変形例>
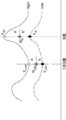
以上説明した実施の形態では、図14に示すように、差分1データ(Judge1)、差分2データ(Judge2)をグラフで表示し、図15に示すように、表示画面380には、中心画像表示領域392、グラフ表示領域394、及びUWF-SLO眼底画像表示領域396を有する。本開示の技術はこれに限定されない。例えば、図17Aから図17Cに示すように、各角度について、差分1データ(Judge1)の値を赤色で、差分2データ(Judge2)の値を緑で中心画像354に重畳表示する。
具体的には、半径C2の円の外側の半径方向に差分1データ(Judge1)の値に応じた長さの第1線分LS1が赤色線分(図17Aから図17Cでは、実線で表示している)で表示される。差分2データ(Judge2)の値に応じた長さの第2線分LS2が緑色線分(図17Aから図17Cでは、点線で表示している)で第1線分に重畳して表示される。差分1データ(Judge1)の値と差分2データ(Judge2)の値が大きくなるに従って第1線分LS1、第2線分LS2の長さが長くなるように表示される。
図17Aから図17Cにはそれぞれ、緑内障が軽度、中度、及び重度の場合の差分1データ(Judge1)の値及び差分2データ(Judge2)の値が示されている。図17Aから図17Cでは、図14のグラフにおいて、値がマイナスとなる角度の差分1データ(Judge1)、差分2データ(Judge2)のみを、当該角度の方向に円C2の外側に表示している。これにより、視神経線維層がダメージを受けている方向とダメージの程度を直感的に理解しやすくなる。
なお、差分1データ(Judge1) と差分2データ(Judge2)の重畳ではなく、差分1データ(Judge1)のみ、あるいは差分2データ(Judge2)のみに切り替えることができるようにしてもよい
<第4の変形例>
上記実施の形態では、UWF-SLO眼底画像による視神経乳頭周りの緑画素値分布を解析しているが、視神経乳頭を含む領域が撮影されているSLO画像を解析するようにしてもよい。また、眼底カメラで撮影された眼底画像を解析するようにしてもよい。
<その他の変形例>
上記実施の形態では、UWF-SLO眼底画像による視神経乳頭周りの緑画素値分布を解析しているが、視神経乳頭を含む領域が撮影されているSLO画像を解析するようにしてもよい。また、眼底カメラで撮影された眼底画像を解析するようにしてもよい。
<その他の変形例>
上記実施の形態~第4の変形例で説明した処理はあくまでも一例である。従って、主旨を逸脱しない範囲内において不要なステップを削除したり、新たなステップを追加したり、処理順序を入れ替えたりしてもよいことは言うまでもない。
また、上記実施の形態~第3の変形例では、コンピュータを利用したソフトウェア構成によりデータ処理が実現される場合を例示したが、本開示の技術はこれに限定されるものではない。例えば、コンピュータを利用したソフトウェア構成に代えて、FPGA(Field-Programmable Gate Array)又はASIC(Application Specific Integrated Circuit)等のハードウェア構成のみによって、データ処理が実行されるようにしてもよい。データ処理のうちの一部の処理がソフトウェア構成により実行され、残りの処理がハードウェア構成によって実行されるようにしてもよい。
Claims (13)
- 被検眼の眼底画像を取得することと、
前記眼底画像における視神経乳頭を基準にした第1の範囲を画する第1の境界線と、前記第1の範囲を拡大した第2の範囲を画する第2の境界線を設定することと、
前記視神経乳頭を起点とした放射方向における、前記第1の境界線と前記第2の境界線との間の複数の画素値を解析して得られた解析データを生成することと、
前記被検眼に適した標準データと前記解析データとを比較した比較データを生成することと、
を含むデータ作成方法。 - 前記標準データは、少なくとも高群標準データと低群標準データを含み、
前記高群標準データと前記低群標準データとに基づいて、推定正常眼データを生成することを含み、
前記比較データの生成は、前記推定正常眼データと前記解析データとを比較することを特徴とする請求項1に記載のデータ作成方法。 - 前記比較データは、前記推定正常眼データと前記解析データの差分である差分データであることを特徴とする請求項2に記載のデータ作成方法。
- 前記比較データは、
前記推定正常眼データと前記解析データの差分である第1比較データと、
前記低群標準データから所定値を減算した第2比較データと、
を含むことを特徴とする請求項2又は請求項3に記載のデータ作成方法。 - 少なくとも、前記解析データ、前記第1比較データ及び第2比較データの関係を示す第1グラフを生成することを含む請求項4に記載のデータ作成方法。
- 少なくとも、前記解析データ及び前記第1比較データの関係を示す第2グラフを生成することと、
を含む請求項5に記載のデータ作成方法。 - 前記第1の境界線は、前記視神経乳頭を中心とした第1同心円であり、
前記第2の境界線は、前記第1同心円より半径が大きい第2同心円である、
請求項1から請求項6の何れか1項に記載のデータ作成方法。 - 前記比較データを表示する比較データ表示エリアと、前記眼底画像を表示する眼底画像エリアとを含む表示画面の画面データを生成することを更に含む、請求項1から請求項7の何れか1項に記載のデータ作成方法。
- 前記表示画面には、さらに視野検査の結果を示す視野検査表示エリアが含まれることを特徴とする請求項8に記載のデータ作成方法。
- 被検眼の眼底画像を取得する取得部と、
前記眼底画像における視神経乳頭を基準にした第1の範囲を画する第1の境界線と、前記第1の範囲を拡大した第2の範囲を画する第2の境界線を設定し、
前記視神経乳頭を起点とした放射方向における、前記第1の境界線と前記第2の境界線との間の複数の画素値を解析して得られた解析データを生成する解析部と、
前記被検眼に適した標準データと前記解析データとを比較した比較データを生成する比較部と、
を含む、データ作成装置。 - 少なくとも、前記解析データ、推定正常眼データと前記解析データの差分である第1比較データ、及び低群標準データから所定値を減算した第2比較データの関係を示す第1グラフを生成する生成部を更に含む請求項10に記載のデータ作成装置。
- 前記生成部は、少なくとも、前記解析データ及び前記第1比較データの関係を示す第2グラフを更に生成する、請求項11に記載のデータ作成装置。
- 被検眼の眼底の眼底画像を取得することと、
前記眼底画像における視神経乳頭を基準にした第1の範囲を画する第1の境界線と、前記第1の範囲を拡大した第2の範囲を画する第2の境界線を設定することと、
前記視神経乳頭を起点とした放射方向における、前記第1の境界線と前記第2の境界線との間の複数の画素値を解析して得られた解析データを生成することと、
前記被検眼に適した正常眼データと前記解析データとを比較した比較データを生成することと、
をコンピュータに実行させるデータ作成プログラム。
Priority Applications (1)
| Application Number | Priority Date | Filing Date | Title |
|---|---|---|---|
| PCT/JP2019/020716 WO2020240629A1 (ja) | 2019-05-24 | 2019-05-24 | データ作成方法、データ作成装置、及びデータ作成プログラム |
Applications Claiming Priority (1)
| Application Number | Priority Date | Filing Date | Title |
|---|---|---|---|
| PCT/JP2019/020716 WO2020240629A1 (ja) | 2019-05-24 | 2019-05-24 | データ作成方法、データ作成装置、及びデータ作成プログラム |
Publications (1)
| Publication Number | Publication Date |
|---|---|
| WO2020240629A1 true WO2020240629A1 (ja) | 2020-12-03 |
Family
ID=73553111
Family Applications (1)
| Application Number | Title | Priority Date | Filing Date |
|---|---|---|---|
| PCT/JP2019/020716 Ceased WO2020240629A1 (ja) | 2019-05-24 | 2019-05-24 | データ作成方法、データ作成装置、及びデータ作成プログラム |
Country Status (1)
| Country | Link |
|---|---|
| WO (1) | WO2020240629A1 (ja) |
Citations (3)
| Publication number | Priority date | Publication date | Assignee | Title |
|---|---|---|---|---|
| JPH05146411A (ja) * | 1990-12-15 | 1993-06-15 | Topcon Corp | 眼底像解析装置 |
| JP2017093855A (ja) * | 2015-11-25 | 2017-06-01 | 株式会社トプコン | 眼科装置 |
| US20180070814A1 (en) * | 2015-03-12 | 2018-03-15 | Gareguin Mikaelian | Systems and methods for combined structure and function evaluation of retina |
-
2019
- 2019-05-24 WO PCT/JP2019/020716 patent/WO2020240629A1/ja not_active Ceased
Patent Citations (3)
| Publication number | Priority date | Publication date | Assignee | Title |
|---|---|---|---|---|
| JPH05146411A (ja) * | 1990-12-15 | 1993-06-15 | Topcon Corp | 眼底像解析装置 |
| US20180070814A1 (en) * | 2015-03-12 | 2018-03-15 | Gareguin Mikaelian | Systems and methods for combined structure and function evaluation of retina |
| JP2017093855A (ja) * | 2015-11-25 | 2017-06-01 | 株式会社トプコン | 眼科装置 |
Non-Patent Citations (1)
| Title |
|---|
| YOSHIMURA,NAGAHISA.: "The Japanese Journal of Ophthalmic Caring, 2011 suppl.", 5 October 2011, MEDICUS SHUPPAN, PUBLISHERS CO., LTD.,, ISBN: 978-4-8408-3710-3, article PRACTICE! A COURSE IN CAPTURING OCT IMAGES, WHICH ARE HELPFUL FOR DIAGNOSIS., pages: 19 - 21 * |
Similar Documents
| Publication | Publication Date | Title |
|---|---|---|
| US12423784B2 (en) | Image processing method, program, ophthalmic device, and choroidal blood vessel image generation method | |
| CN111970957B (zh) | 图像处理方法、计算机可读的存储介质及图像处理装置 | |
| JP2023009530A (ja) | 画像処理方法、画像処理装置、及びプログラム | |
| US20250204776A1 (en) | Image processing method, program, image processing device, and ophthalmic system | |
| JP7521629B2 (ja) | 画像処理方法、画像処理装置、画像処理プログラム、及び血管径算出装置 | |
| JP7726244B2 (ja) | 画像処理方法、及び画像処理装置 | |
| US20250329017A1 (en) | Image processing method, program, image processing device, and ophthalmic system | |
| JP7585800B2 (ja) | 画像処理方法、画像処理装置、及びプログラム | |
| JP7494855B2 (ja) | 画像処理方法、画像処理装置、及び画像処理プログラム | |
| JP6637743B2 (ja) | 眼科装置 | |
| CN115052514A (zh) | 图像处理方法、图像处理装置、以及程序 | |
| WO2021074960A1 (ja) | 画像処理方法、画像処理装置、及び画像処理プログラム | |
| WO2023282339A1 (ja) | 画像処理方法、画像処理プログラム、画像処理装置及び眼科装置 | |
| JP7419946B2 (ja) | 画像処理方法、画像処理装置、及び画像処理プログラム | |
| JP2023066198A (ja) | 情報出力装置、眼底画像撮影装置、情報出力方法、及び情報出力プログラム | |
| WO2021074961A1 (ja) | 画像処理方法、画像処理装置、およびプログラム | |
| WO2021210281A1 (ja) | 画像処理方法、画像処理装置、及び画像処理プログラム | |
| WO2022181729A1 (ja) | 画像処理方法、画像処理装置、及び画像処理プログラム |
Legal Events
| Date | Code | Title | Description |
|---|---|---|---|
| 121 | Ep: the epo has been informed by wipo that ep was designated in this application |
Ref document number: 19930934 Country of ref document: EP Kind code of ref document: A1 |
|
| NENP | Non-entry into the national phase |
Ref country code: DE |
|
| 122 | Ep: pct application non-entry in european phase |
Ref document number: 19930934 Country of ref document: EP Kind code of ref document: A1 |
|
| NENP | Non-entry into the national phase |
Ref country code: JP |