WO2020189741A1 - 信号処理装置及び信号処理方法 - Google Patents
信号処理装置及び信号処理方法 Download PDFInfo
- Publication number
- WO2020189741A1 WO2020189741A1 PCT/JP2020/012134 JP2020012134W WO2020189741A1 WO 2020189741 A1 WO2020189741 A1 WO 2020189741A1 JP 2020012134 W JP2020012134 W JP 2020012134W WO 2020189741 A1 WO2020189741 A1 WO 2020189741A1
- Authority
- WO
- WIPO (PCT)
- Prior art keywords
- signal
- fluorescent particles
- input
- unit
- optical
- Prior art date
- Legal status (The legal status is an assumption and is not a legal conclusion. Google has not performed a legal analysis and makes no representation as to the accuracy of the status listed.)
- Ceased
Links
Images


Classifications
-
- G—PHYSICS
- G06—COMPUTING OR CALCULATING; COUNTING
- G06E—OPTICAL COMPUTING DEVICES
- G06E3/00—Devices not provided for in group G06E1/00, e.g. for processing analogue or hybrid data
-
- G—PHYSICS
- G06—COMPUTING OR CALCULATING; COUNTING
- G06N—COMPUTING ARRANGEMENTS BASED ON SPECIFIC COMPUTATIONAL MODELS
- G06N20/00—Machine learning
Definitions
- the present invention relates to a signal processing device and a signal processing method.
- An object of the present invention is to provide a signal processing device in which a large-scale FRET path is physically mounted, and a signal processing method.
- the signal processing apparatus includes an optical energy network including a plurality of fluorescent particles and configured such that an energy transfer path through the plurality of fluorescent particles is autonomously and randomly determined, and the light.
- a signal input unit that excites at least a part of the plurality of fluorescent particles according to an input signal to be input to the energy network, and a signal input unit that excites some of the fluorescent particles, and then reads an optical signal from the photoenergy network. It includes a signal reading unit and an acquisition unit that acquires a calculation result by the optical energy network based on the optical signal read by the signal reading unit.
- the plurality of fluorescences are received in response to the input of the input signal to the optical energy network configured so that the energy transfer path by the plurality of fluorescent particles is determined autonomously and randomly.
- the optical signal is read from the optical energy network, and the calculation result by the optical energy network is acquired based on the read optical signal.
- signal processing can be executed using an optical energy network based on a large-scale FRET path.
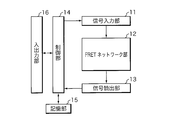
- FIG. 1 is a schematic diagram showing the configuration of the signal processing device according to the present embodiment
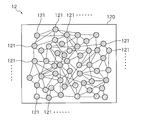
- FIG. 2 is a schematic diagram showing the configuration of the FRET network unit 12.
- the signal processing device according to the present embodiment is a device that performs calculations using an optical energy network in which signals are transmitted by FRET, and is a signal input unit 11, FRET network unit 12, signal reading unit 13, control unit 14, It includes a storage unit 15 and an input / output unit 16.
- the FRET network unit 12 is composed of nanostructures 120 in which a plurality of fluorescent particles 121, 121, ..., 121 are randomly arranged in a solid, a liquid, or an amorphous substance.
- the fluorescent particle 121 may be a fluorescent molecule or a fluorescent material that functions as a quantum dot.
- the nanostructure 120 may have a laminated structure. The number of fluorescent particles 121 arranged in the nanostructure 120 is adjusted so that the distance between adjacent fluorescent particles 121 and 121 is 10 nm or less. For example, volume is the nanostructures 120 of about 1 [mu] m 3 are disposed 106 about the fluorescent particles 121.
- Cy3 having an excitation peak of 550 nm and a fluorescence peak of 570 nm
- a fluorescence peak of 670 nm are used.
- the distance between any two fluorescent particles 121, 121 varies, but if the distance is about 10 nm or less, FRET can occur.
- the FRET generation condition is that not only the distance between the two fluorescent particles 121 and 121 but also the overlap between the emission spectrum on the donor side and the absorption spectrum on the acceptor side is large, and the two fluorescent particles 121 and 121 are appropriate. It is oriented, the fluorescence quantum yield on the donor side is large, and the absorption intensity of the acceptor is large.
- the path through which energy moves between the fluorescent particles 121 and 121 is determined autonomously and randomly. That is, the fluorescent particles 121, 121, ..., 121 in the nanostructure 120 construct an optical energy network through which signals are transmitted by FRET.
- the signal input unit 11 excites at least a part of the fluorescent particles 121, 121, ..., 121 according to the input signal.
- the input signal is a signal to be calculated in the signal processing device, may be generated inside the control unit 14, or may be input from the outside through the input / output unit 16.
- the signal input unit 11 controls the wavelength and time-series light intensity of the light to be irradiated to the nanostructure 120 according to the modulation parameters adjusted according to the input signal, and controls the wavelength and time-series light intensity (hereinafter referred to as light).
- Excitation light is applied to a specific irradiation region of the nanostructure 120.
- the modulation method is arbitrary, and it may be modulated according to a preset rule.
- the irradiation region for irradiating the excitation light is set in advance.
- the energy states of the fluorescent particles 121, 121, ..., 121 included in the irradiation region change from, for example, the ground state to the excited state.
- FRET is generated between the two fluorescent particles 121, 121 that satisfy the above conditions. That is, the excitation energy is transferred from the fluorescent particles 121 on the donor side to the fluorescent particles 121 on the acceptor side.
- Such FRET between the two fluorescent particles 121 and 121 is generated one after another in the fluorescent particles 121, 121, ..., 121 constituting the nanostructure 120. Therefore, after the excitation light is irradiated to the nanostructure 120 by the signal input unit 11, the energy states of the fluorescent particles 121, 121, ..., 121 constituting the nanostructure 120 are other fluorescent particles satisfying the generation conditions. It changes autonomously by FRET from 121, and changes to a state that represents the calculation result.
- the signal reading unit 13 After irradiating the excitation light from the signal input unit 11, the signal reading unit 13 irradiates the excitation light after the timing when the energy states of the fluorescent particles 121, 121, ..., 121 change to the states representing the calculation results (for example, irradiating the excitation light).
- the signal is read from the FRET network unit 12 (after the timing when about 10 to 12 seconds have passed since then).
- the signal reading unit 13 can read a signal from the FRET network unit 12 by performing wavelength decomposition measurement / time decomposition measurement using a spectroscope. As a method of reading a signal from the FRET network unit 12, a known method can be used.
- the reading region for the signal reading unit 13 to read the signal may be set to the entire region of the nanostructure 120, or a part of the region of the nanostructure 120 may be set.
- the signal read by the signal reading unit 13 is a signal of the fluorescence spectrum obtained from the fluorescent particles 121, 121, ..., 121 included in the reading region.
- the signal reading unit 13 outputs the signal read from the FRET network unit 12 to the control unit 14.
- the control unit 14 includes a CPU (Central Processing Unit), a ROM (Read Only Memory), a RAM (Random Access Memory), and the like.
- the CPU of the control unit 14 controls the operation of each hardware unit and executes various calculations by executing various computer programs stored in the ROM or the storage unit 15, and the entire device functions as the signal processing device of the present application. Let me.
- the RAM of the control unit 14 temporarily stores data and the like generated during execution of various computer programs.
- the calculation executed by the control unit 14 is a calculation for learning the relationship between the signal read by the signal reading unit 13 from the FRET network unit 12 and the calculation result by the FRET network unit 12, and the calculation using the result of the learning calculation is used for FRET. It includes an operation of deriving an operation result from a signal read by the network unit 12. These operations will be described in detail later.
- the control unit 14 is not limited to the above configuration, and may be any processing circuit including one or a plurality of CPUs, a multi-core CPU, a GPU (Graphics Processing Unit), a microcomputer, and the like. Further, the control unit 14 may have functions such as a clock for outputting date and time information, a timer for measuring the elapsed time from giving the measurement start instruction to giving the measurement end instruction, and a counter for counting the number.
- the storage unit 15 includes a storage device that uses a memory, an HDD (Hard Disk Drive), or the like.
- the storage unit 15 stores various computer programs executed by the control unit 14, data necessary for executing the computer programs, calculation results by the control unit 14, and the like.
- the computer program stored in the storage unit 15 is a learning program for learning the relationship between the signal read from the FRET network unit 12 by the signal reading unit 13 and the calculation result to be acquired as an output for the input signal, and the learning result. Based on this, it includes a calculation program for converting the signal read by the signal reading unit 13 from the FRET network unit 12 into a calculation result.
- the computer program stored in the storage unit 15 may be provided by a non-temporary recording medium in which the computer program is readablely recorded.
- the recording medium is, for example, a portable memory such as a CD-ROM, a USB memory, an SD (Secure Digital) card, a micro SD card, or a compact flash (registered trademark).
- the control unit 14 can read the computer program from the recording medium using a reading device (not shown), and install the read computer program in the storage unit 15.
- the computer program stored in the storage unit 15 may be provided by communication. In this case, the control unit 14 can acquire a computer program by communicating with an external server (not shown), and can install the acquired computer program in the storage unit 15.
- the input / output unit 16 includes an interface for inputting / outputting various information.
- the input / output unit 16 includes an interface for connecting an input device such as a keyboard and a mouse, and may receive a user's instruction through the connected input device.
- the input / output unit 16 includes an interface for connecting an external computer, and a signal output from the connected external computer may be input.
- the input / output unit 16 may include an interface for connecting an output device such as a liquid crystal display or an organic EL (Electro-Luminescence) display, and output the calculation result or the like by the control unit 14 to the output device.
- an output device such as a liquid crystal display or an organic EL (Electro-Luminescence) display
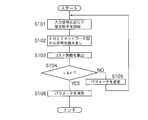
- FIG. 3 is a flowchart illustrating a processing procedure executed by the signal processing apparatus according to the present embodiment in the learning phase.
- the control unit 14 of the signal processing device executes the following processing in the initial state in which learning is not performed, so that the signal read unit 13 reads from the FRET network unit 12 and the calculation result by the FRET network unit 12 Learn the relationship.
- the control unit 14 executes the following processing to read the signal from the FRET network unit 12 and the calculation result by the FRET network unit 12. You may relearn the relationship with.
- the control unit 14 excites at least a part of the fluorescent particles 121, 121, ..., 121 constituting the FRET network unit 12 by controlling the signal input unit 11.
- the input signal to be calculated may be input to the control unit 14 through the input / output unit 16 or may be generated inside the control unit 14.
- the control unit 14 generates a modulation parameter according to the input signal to be calculated, and controls the wavelength and time-series light intensity of the excitation light to be irradiated according to the generated modulation parameter.
- the signal input unit 11 irradiates a predetermined irradiation region of the FRET network unit 12 with excitation light whose wavelength and time-series light intensity are controlled based on the modulation parameters generated by the control unit 14.
- the energy state of the fluorescent particles contained in the irradiation region changes from, for example, the ground state to the excited state.
- FRET is generated between the two fluorescent particles 121, 121 that satisfy the generation conditions.
- the FRET between the fluorescent particles 121 and 121 is generated one after another in the fluorescent particles 121, 121, ..., 121 constituting the nanostructure 120, and is transmitted to the entire nanostructure 120. That is, the energy states of the fluorescent particles 121, 121, ..., 121 are autonomously changed by FRET, and are changed to a state representing the calculation result.
- the signal reading unit 13 reads a signal from the FRET network unit 12 (step S102). This signal is read out after the timing when the energy state of the fluorescent particles 121, 121, ..., 121 changes to the state representing the calculation result (for example, after the timing when about 10 to 12 seconds have elapsed after irradiating the excitation light). You can do it at.
- the signal reading unit 13 can read a signal from the FRET network unit 12 by performing wavelength decomposition measurement / time decomposition measurement using a spectroscope.
- the signal read from the FRET network unit 12 is output to the control unit 14.
- the control unit 14 calculates a cost function set based on the signal read by the signal reading unit 13 and the teacher signal indicating the ideal output with respect to the input signal (step S103).
- the cost function L ( ⁇ k i ⁇ ) for example, represented by the following equation.
- y i (t, ⁇ ) represents a signal read by the signal reading unit 13 from the FRET network unit 12.
- f (x i ) represents a teacher signal indicating an ideal output with respect to the input signal x i .
- the calculation results corresponding to the signal y i (t, ⁇ ) is, F (y i (t, ⁇ ), ⁇ k i ⁇ ) can be written as.
- F is a function for converting the signal y i (t, ⁇ ) into an operation result.
- F may be a linear function or a non-linear function.
- cost function is not limited to the equation of Equation 1, and for example, the cost function represented by the following equation may be used.
- the control unit 14 the calculated value of the cost function L ( ⁇ k i ⁇ ) is equal to or less than the threshold value epsilon (step S104).
- the threshold value ⁇ is a threshold value for the cost function L ( ⁇ k i ⁇ ) to determine whether the convergence, suitable small value is set.
- the control unit 14 changes the parameters ⁇ k i ⁇ (step S105). For example, the control unit 14, holds the value of the cost function L calculated in step S103, the value L n of the current computed cost function L ( ⁇ k i ⁇ ) is the cost function L previously calculated ( ⁇ The parameter ⁇ x i ⁇ may be changed using the gradient method so that it is smaller than the value L n-1 of k i ⁇ ). After changing the parameter ⁇ x i ⁇ , the control unit 14 returns the process to step S101.
- controller 14 determines a parameter ⁇ k i ⁇ used in (step S106). Controller 14 stores the determined ⁇ k i ⁇ in the storage unit 15, the processing of this flowchart is terminated.
- FIG. 4 is a flowchart illustrating a processing procedure executed by the signal processing device according to the present embodiment in the operation phase.
- the control unit 14 of the signal processing device acquires the calculation result of the FRET network unit 12 from the signal read from the signal reading unit 13 by executing the following processing in the operation phase after the learning is completed.
- the control unit 14 controls the signal input unit 11 when the input signal to be calculated is input, so that the fluorescent particles 121, 121, ..., 121 constituting the FRET network unit 12 Excite at least a portion (step S201).
- the input signal to be calculated may be input to the control unit 14 through the input / output unit 16 or may be generated inside the control unit 14.
- the control unit 14 generates a modulation parameter according to the input signal to be calculated, and controls the wavelength and time-series light intensity of the excitation light to be irradiated according to the generated modulation parameter.
- the signal input unit 11 irradiates a predetermined irradiation region of the FRET network unit 12 with excitation light whose wavelength and time-series light intensity are controlled based on the modulation parameters generated by the control unit 14.
- the energy state of the fluorescent particles contained in the irradiation region changes from, for example, the ground state to the excited state.
- FRET is generated between the two fluorescent particles 121, 121 that satisfy the generation conditions.
- the FRET between the fluorescent particles 121 and 121 is generated one after another in the fluorescent particles 121, 121, ..., 121 constituting the nanostructure 120, and is transmitted to the entire nanostructure 120. That is, the energy states of the fluorescent particles 121, 121, ..., 121 are autonomously changed by FRET, and are changed to a state representing the calculation result.
- the signal reading unit 13 reads a signal from the FRET network unit 12 (step S202). This signal is read out after the timing when the energy state of the fluorescent particles 121, 121, ..., 121 changes to the state representing the calculation result (for example, after the timing when about 10 to 12 seconds have elapsed after irradiating the excitation light). You can do it at.
- the signal reading unit 13 can read a signal from the FRET network unit 12 by performing wavelength decomposition measurement / time decomposition measurement using a spectroscope.
- the signal read from the FRET network unit 12 is output to the control unit 14.
- control unit 14 derives the calculation result by the FRET network unit 12 based on the signal output from the signal reading unit 13 (step S203).
- the control unit 14 reads the parameters ⁇ k i ⁇ determined in the learning phase, the function F (y, ⁇ k i ⁇ ) described by the parameter ⁇ k i ⁇ to the signal y i (t, ⁇ ) signal
- the calculation result by the FRET network unit 12 is derived.
- the control unit 14 outputs the derived calculation result through the input / output unit 16 (step S204).
- the signal processing apparatus according to the present embodiment since the physical properties of the fluorescent particles 121 possessed by the FRET network unit 12 are directly used for the calculation, the signal processing apparatus according to the present embodiment is different from the conventional computing apparatus using the electric signal. In comparison, it is possible to realize miniaturization and low power consumption.
- FIG. 5 is a schematic diagram showing the configuration of the FRET network unit 12 in the second embodiment.
- the nanostructure 120 of the FRET network unit 12 in the second embodiment has a laminated structure in which the first layer 120A to the third layer 120C are laminated.
- the first layer 120A contains, for example, fluorescent particles 121A having a fluorescence wavelength of 540 nm
- the second layer 120B contains, for example, fluorescent particles 121B having a fluorescence wavelength of 580 nm
- the third layer 120C contains, for example, fluorescent particles having a fluorescence wavelength of 620 nm. Includes 121C.
- Each of these layers 120A to 120C is formed by spin-coating and then curing a polymer solvent containing fluorescent particles 121A to 121C on a cover glass.
- the fluorescent particles 121A are randomly arranged inside the first layer 120A.
- the fluorescent particles 121B are randomly arranged inside the second layer 120B
- the fluorescent particles 121C are randomly arranged inside the third layer 120C.
- the nanostructure 120 having a three-layer structure has been described as an example in FIG. 5, the nanostructure 120 may be a laminated body having two layers or four or more layers. Further, the nanostructure 120 may not have a layered structure and may have a structure in which fluorescent particles 121A, 121B, 121C are randomly arranged.
- the types of fluorescent particles randomly arranged are not limited to three, and may be two or four or more.
- the number of fluorescent particles 121A to 121C that contribute to energy transfer depends on the location where the excitation light is irradiated, even if the irradiation area of the excitation light is the same. different. For example, when the irradiation regions 111, 112, and 113 shown in FIG. 5 are irradiated with excitation light and fluorescence is observed in each of the observation regions 131, 132, and 133, the fluorescent particles 121A to 121C that contribute to energy transfer in each region. Since the number of particles is different, it is expected that the fluorescence intensity and fluorescence lifetime obtained as observation results will be different in each region.
- FIG. 6 is a diagram for explaining the verification result of verifying the diversity of fluorescence intensity.
- FIG. 6 shows the results of irradiating different regions of the nanostructure 120 shown in FIG. 5 with excitation light and observing the fluorescence intensity in each region.
- the irradiation regions 111, 112, and 113 were circular regions having a diameter of 16 ⁇ m.
- the observation areas 131, 132, and 133 corresponding to the irradiation areas 111, 112, and 113 are square areas having a side of 1 ⁇ m. The distance between the regions was 100 ⁇ m.
- a laser beam having a wavelength of 515 nm was used as the excitation light for irradiating the irradiation regions 111, 112, and 113.
- the diversity of fluorescence intensities was verified by performing wavelength decomposition measurement using a spectroscope.
- the wavelength dependence of the fluorescence intensity observed in each observation region 131, 132, 133 is as shown in the graph shown in the right column of FIG.
- the horizontal axis of each graph indicates the wavelength (nm), and the vertical axis indicates the fluorescence intensity (arbitrary scale).
- the fluorescence intensities observed in the observation regions 131, 132, and 133 have peaks near 540 nm, 580 nm, and 620 nm, indicating that energy transfer occurs between the fluorescent particles.
- the wavelength dependence of the fluorescence intensity differs depending on the observation regions 131, 132, and 133. It is presumed that the difference in fluorescence intensity is due to the difference in the densities of the fluorescent particles 121A, 121B, 121C in each region.
- the signal processing device gives the input signal a spatial modulation pattern, selectively excites the fluorescent particles 121A contained in the first layer 120A, and then reads a signal determined according to the spatial dynamics of the FRET network unit 12. Just put it out.
- FIG. 7 is a diagram for explaining the verification results for verifying the diversity of fluorescence lifetime.
- FIG. 7 shows the results of irradiating different regions of the nanostructure 120 shown in FIG. 5 with excitation light and observing the fluorescence lifetime in each region.
- the irradiation regions 111, 112, and 113 were circular regions having a diameter of 16 ⁇ m, as in the second embodiment.
- the observation areas 131, 132, and 133 corresponding to the irradiation areas 111, 112, and 113 are rectangular areas having a short side of 1 ⁇ m and a long side of 400 ⁇ m. The distance between the regions was 100 ⁇ m.
- a laser beam having a wavelength of 515 nm was used as the excitation light for irradiating the irradiation regions 111, 112, and 113.
- the diversity of fluorescence lifetime was verified by performing time-resolved measurement using a spectroscope.
- the temporal changes in fluorescence intensity observed in each observation area 131, 132, 133 are as shown in the graph shown in the right column of FIG.
- the horizontal axis of each graph shows time (ns), and the vertical axis shows fluorescence intensity (arbitrary scale).
- a curve fitted by the fitting function Aln ( ⁇ t / ⁇ 1) + Bln ( ⁇ t / ⁇ 2)
- ⁇ 1 and ⁇ 2 represent time constants, and their respective values are as shown in FIG. From the graph shown in FIG. 7, it can be seen that the fluorescence lifetimes observed in the observation regions 131, 132, and 133 differ depending on each region. It is presumed that the difference in fluorescence lifetime is due to the length of the energy transfer path caused by the difference in the distribution of the fluorescent particles 121A, 121B, 121C in each region.
- the signal processing device gives the input signal a spatial modulation pattern, selectively excites the fluorescent particles 121A contained in the first layer 120A, and then reads a signal determined according to the time dynamics of the FRET network unit 12. Just put it out.
- FIG. 8 is a diagram for explaining the verification results for verifying the diversity of fluorescence lifetime due to the difference in excitation intensity.
- FIG. 8 shows the results of irradiating the nanostructure 120 shown in FIG. 5 with excitation light having different excitation intensities and observing the fluorescence lifetime in each of them.
- the excitation light to irradiate the nanostructure 120 a laser beam having a wavelength of 510 nm and an intensity of 135 mW was used in the case of strong excitation, and a laser beam having a wavelength of 510 nm and an intensity of 20 mW was used in the case of weak excitation.
- the diversity of fluorescence lifetime was verified by performing time-resolved measurement using a spectroscope.
- the time change of the fluorescence intensity when the fluorescent particles 121A were excited under each excitation condition is as shown in the graph shown in FIG.
- the horizontal axis of each graph shows time (ns), and the vertical axis shows fluorescence intensity (arbitrary scale).
- a curve fitted by the fitting function Aln ( ⁇ t / ⁇ 1) + Bln ( ⁇ t / ⁇ 2) was used.
- the graph on the left side of FIG. 8 shows the fluorescence lifetime when strong excitation is performed, and the graph on the right side shows the fluorescence lifetime when weak excitation is performed.
- the five curves shown in each graph show the results of observation by changing the concentrations of the fluorescent particles 121A to 121C.
- the signal processing device may selectively excite the fluorescent particles 121A to 121C with the excitation intensity defined by the excitation conditions, and then read the signal determined according to the time dynamics of the FRET network unit 12.
Landscapes
- Engineering & Computer Science (AREA)
- Theoretical Computer Science (AREA)
- Software Systems (AREA)
- General Physics & Mathematics (AREA)
- Physics & Mathematics (AREA)
- Data Mining & Analysis (AREA)
- Medical Informatics (AREA)
- Evolutionary Computation (AREA)
- Computing Systems (AREA)
- General Engineering & Computer Science (AREA)
- Computer Vision & Pattern Recognition (AREA)
- Mathematical Physics (AREA)
- Artificial Intelligence (AREA)
- Investigating, Analyzing Materials By Fluorescence Or Luminescence (AREA)
Priority Applications (1)
| Application Number | Priority Date | Filing Date | Title |
|---|---|---|---|
| JP2021507408A JP7505698B2 (ja) | 2019-03-20 | 2020-03-18 | 信号処理装置及び信号処理方法 |
Applications Claiming Priority (2)
| Application Number | Priority Date | Filing Date | Title |
|---|---|---|---|
| JP2019-053527 | 2019-03-20 | ||
| JP2019053527 | 2019-03-20 |
Publications (1)
| Publication Number | Publication Date |
|---|---|
| WO2020189741A1 true WO2020189741A1 (ja) | 2020-09-24 |
Family
ID=72520293
Family Applications (1)
| Application Number | Title | Priority Date | Filing Date |
|---|---|---|---|
| PCT/JP2020/012134 Ceased WO2020189741A1 (ja) | 2019-03-20 | 2020-03-18 | 信号処理装置及び信号処理方法 |
Country Status (2)
| Country | Link |
|---|---|
| JP (1) | JP7505698B2 (https=) |
| WO (1) | WO2020189741A1 (https=) |
Citations (4)
| Publication number | Priority date | Publication date | Assignee | Title |
|---|---|---|---|---|
| JPH02105212A (ja) * | 1988-10-13 | 1990-04-17 | Fujitsu Ltd | 光ニューラルネットワーク |
| JPH05281589A (ja) * | 1992-04-03 | 1993-10-29 | Olympus Optical Co Ltd | 画像処理装置 |
| JPH063723A (ja) * | 1992-06-23 | 1994-01-14 | Olympus Optical Co Ltd | 画像処理装置 |
| JPH10254569A (ja) * | 1997-03-07 | 1998-09-25 | Agency Of Ind Science & Technol | 量子演算素子および量子演算器 |
Family Cites Families (1)
| Publication number | Priority date | Publication date | Assignee | Title |
|---|---|---|---|---|
| IL271386B2 (en) * | 2017-06-16 | 2025-02-01 | Univ Duke | Enhanced resonator networks for label detection, computation, analyte sensing, and tunable random number generation |
-
2020
- 2020-03-18 WO PCT/JP2020/012134 patent/WO2020189741A1/ja not_active Ceased
- 2020-03-18 JP JP2021507408A patent/JP7505698B2/ja active Active
Patent Citations (4)
| Publication number | Priority date | Publication date | Assignee | Title |
|---|---|---|---|---|
| JPH02105212A (ja) * | 1988-10-13 | 1990-04-17 | Fujitsu Ltd | 光ニューラルネットワーク |
| JPH05281589A (ja) * | 1992-04-03 | 1993-10-29 | Olympus Optical Co Ltd | 画像処理装置 |
| JPH063723A (ja) * | 1992-06-23 | 1994-01-14 | Olympus Optical Co Ltd | 画像処理装置 |
| JPH10254569A (ja) * | 1997-03-07 | 1998-09-25 | Agency Of Ind Science & Technol | 量子演算素子および量子演算器 |
Also Published As
| Publication number | Publication date |
|---|---|
| JP7505698B2 (ja) | 2024-06-25 |
| JPWO2020189741A1 (https=) | 2020-09-24 |
Similar Documents
| Publication | Publication Date | Title |
|---|---|---|
| Zhang et al. | High-fidelity single-shot readout of single electron spin in diamond with spin-to-charge conversion | |
| Fregoni et al. | Theoretical challenges in polaritonic chemistry | |
| Ulusoy et al. | Modifying the nonradiative decay dynamics through conical intersections via collective coupling to a cavity mode | |
| Szidarovszky et al. | Conical intersections induced by quantum light: Field-dressed spectra from the weak to the ultrastrong coupling regimes | |
| Bonis‐O'Donnell et al. | Dual near‐infrared two‐photon microscopy for deep‐tissue dopamine nanosensor imaging | |
| Kang et al. | Efficient modeling of organic chromophores for entangled two-photon absorption | |
| Tichauer et al. | Identifying vibrations that control non-adiabatic relaxation of polaritons in strongly coupled molecule–cavity systems | |
| Low et al. | Control and readout of a 13-level trapped ion qudit | |
| Lee et al. | Controlling molecular photoisomerization in photonic cavities through polariton funneling | |
| JP2009515205A (ja) | 物質表現と光表現との間の量子情報変換 | |
| Madsen et al. | Measuring the effective phonon density of states of a quantum dot in cavity quantum electrodynamics | |
| Lee et al. | Anderson localizations and photonic band-tail states observed in compositionally disordered platform | |
| Chng et al. | Mechanism of molecular polariton decoherence in the collective light–matter couplings regime | |
| Rana et al. | Simulating the excited-state dynamics of polaritons with ab initio multiple spawning | |
| Qiao et al. | Brain cell laser powered by deep‐learning‐enhanced laser modes | |
| Robertson et al. | A charge transfer mechanism for optically addressable solid-state spin pairs | |
| Stolow | The three pillars of photo-initiated quantum molecular dynamics | |
| US20250200360A1 (en) | Method and apparatus with organic molecule spectrum prediction | |
| Skripka et al. | Unraveling the myths and mysteries of photon avalanching nanoparticles | |
| Perrella et al. | Engineering photon-photon interactions within rubidium-filled waveguides | |
| EP4699057A1 (en) | Determining a location of a molecular entity at an interaction site of a macromolecule using a quantum computer | |
| WO2020189741A1 (ja) | 信号処理装置及び信号処理方法 | |
| Climent et al. | Cavity-modified chemistry: towards vacuum-field catalysis | |
| US9897536B2 (en) | Differential infra red nanoscopy system and method | |
| Yu et al. | Scalability and high-efficiency of an $(n+ 1) $-qubit Toffoli gate sphere via blockaded Rydberg atoms |
Legal Events
| Date | Code | Title | Description |
|---|---|---|---|
| 121 | Ep: the epo has been informed by wipo that ep was designated in this application |
Ref document number: 20772987 Country of ref document: EP Kind code of ref document: A1 |
|
| ENP | Entry into the national phase |
Ref document number: 2021507408 Country of ref document: JP Kind code of ref document: A |
|
| NENP | Non-entry into the national phase |
Ref country code: DE |
|
| 122 | Ep: pct application non-entry in european phase |
Ref document number: 20772987 Country of ref document: EP Kind code of ref document: A1 |