WO2020145252A1 - Dispositif, procédé et programme d'analyse de données - Google Patents
Dispositif, procédé et programme d'analyse de données Download PDFInfo
- Publication number
- WO2020145252A1 WO2020145252A1 PCT/JP2020/000124 JP2020000124W WO2020145252A1 WO 2020145252 A1 WO2020145252 A1 WO 2020145252A1 JP 2020000124 W JP2020000124 W JP 2020000124W WO 2020145252 A1 WO2020145252 A1 WO 2020145252A1
- Authority
- WO
- WIPO (PCT)
- Prior art keywords
- input
- variable
- output
- value
- data
- Prior art date
Links
- 238000000034 method Methods 0.000 title claims abstract description 96
- 238000007405 data analysis Methods 0.000 title claims abstract description 58
- 238000009826 distribution Methods 0.000 claims description 98
- 238000012417 linear regression Methods 0.000 claims description 25
- 230000001143 conditioned effect Effects 0.000 claims description 11
- 230000006870 function Effects 0.000 description 44
- 238000010586 diagram Methods 0.000 description 7
- 238000004422 calculation algorithm Methods 0.000 description 6
- 239000011159 matrix material Substances 0.000 description 5
- 239000013598 vector Substances 0.000 description 3
- 238000004364 calculation method Methods 0.000 description 2
- 238000005070 sampling Methods 0.000 description 2
- NAWXUBYGYWOOIX-SFHVURJKSA-N (2s)-2-[[4-[2-(2,4-diaminoquinazolin-6-yl)ethyl]benzoyl]amino]-4-methylidenepentanedioic acid Chemical compound C1=CC2=NC(N)=NC(N)=C2C=C1CCC1=CC=C(C(=O)N[C@@H](CC(=C)C(O)=O)C(O)=O)C=C1 NAWXUBYGYWOOIX-SFHVURJKSA-N 0.000 description 1
- 238000002790 cross-validation Methods 0.000 description 1
- 238000009795 derivation Methods 0.000 description 1
- 230000008030 elimination Effects 0.000 description 1
- 238000003379 elimination reaction Methods 0.000 description 1
Images


Classifications
-
- G—PHYSICS
- G06—COMPUTING; CALCULATING OR COUNTING
- G06F—ELECTRIC DIGITAL DATA PROCESSING
- G06F17/00—Digital computing or data processing equipment or methods, specially adapted for specific functions
- G06F17/10—Complex mathematical operations
- G06F17/18—Complex mathematical operations for evaluating statistical data, e.g. average values, frequency distributions, probability functions, regression analysis
-
- G—PHYSICS
- G06—COMPUTING; CALCULATING OR COUNTING
- G06N—COMPUTING ARRANGEMENTS BASED ON SPECIFIC COMPUTATIONAL MODELS
- G06N7/00—Computing arrangements based on specific mathematical models
- G06N7/01—Probabilistic graphical models, e.g. probabilistic networks
-
- G—PHYSICS
- G06—COMPUTING; CALCULATING OR COUNTING
- G06F—ELECTRIC DIGITAL DATA PROCESSING
- G06F16/00—Information retrieval; Database structures therefor; File system structures therefor
-
- G—PHYSICS
- G06—COMPUTING; CALCULATING OR COUNTING
- G06F—ELECTRIC DIGITAL DATA PROCESSING
- G06F18/00—Pattern recognition
- G06F18/20—Analysing
- G06F18/22—Matching criteria, e.g. proximity measures
-
- G—PHYSICS
- G06—COMPUTING; CALCULATING OR COUNTING
- G06N—COMPUTING ARRANGEMENTS BASED ON SPECIFIC COMPUTATIONAL MODELS
- G06N20/00—Machine learning
Definitions
- the present invention relates to a data analysis device, method, and program.
- the Gaussian process (Gaussian) described in Ref. 1 (Carl Edward Rasmussen and Christopher KI Williams. A method called Processes, GP) is widely used. This is a method that can perform regression by defining a function called a kernel that calculates the value corresponding to the similarity between input variables. By properly defining the kernel, not only vectors but also graphs, Various things such as images and documents can be used as input variables.
- the regression problem in recent data analysis requires a technique to handle data that is given as an output variable, not an exact value, but an interval value that indicates the range of the value.
- an output variable not an exact value
- an interval value that indicates the range of the value.
- FIG. 7 is a diagram showing an example of data in which output variables are given as interval values.
- the vertical axis represents the number of passing people per unit time
- the horizontal axis represents time.
- FIG. 7 shows the situation where the input variable is given as a real value, but as described above, there can be various input variables in the Gaussian process, and the present invention is not limited to this example.
- the input variable is a real value
- a case can be considered in which the input variable is also given as an interval value.
- the method described in Non-Patent Document 1 is used to determine the true value of the interval value. By estimating the scalar value, only the output variable can be used as the data given by the interval value.
- the present invention has been made in view of the above circumstances, and by making available input/output data in which the value of an output variable is given as an interval value, the accuracy of prediction of an output variable with respect to an unknown input variable can be improved.
- An object of the present invention is to provide a data analysis device, method, and program that can be improved.
- the data analysis device is provided with a plurality of first input/output data to which the value of the output variable is given and the value of the output variable as an interval value representing a range.
- a data processing unit that performs a process of acquiring data represented by a set of a plurality of second input/output data, and an unknown value using a Gaussian process based on the input variable and the data whose output variable value is unknown.
- a prediction unit that predicts the value of the output variable with respect to the input variable of.
- a data analysis device is the data analysis device according to the first aspect, wherein an estimated value of a true value of the output variable given as the interval value is obtained for each of the second input/output data.
- a latent variable estimation unit that estimates a latent variable that represents a kernel function that represents a similarity between input variables of the first input/output data, an input variable of the first input/output data, and a second input/output data of the second input/output data.
- a kernel function representing a similarity with an input variable a kernel function representing a similarity between input variables of the second input/output data, and a latent value conditioned by the interval value, which is represented using the interval value.
- a latent variable estimation unit that generates a random number as the latent variable according to the cut-normal distribution of the generation probability of a variable is further provided, and the prediction unit includes a value of the output variable of each of the first input/output data and the second value.
- a data analysis apparatus is the data analysis apparatus according to the first aspect, wherein a kernel function indicating a similarity between input variables of the first input/output data and an input of the first input/output data. It is expressed using a kernel function that represents the similarity between a variable and the input variable of the second input/output data, a kernel function that represents the similarity between the input variables of the second input/output data, and the interval value.
- An estimation unit is further included, and the prediction unit is configured to output the output variable of each of the second input/output data based on a normal distribution obtained from an average and a variance of values of the output variable of each of the second input/output data.
- the prediction unit is configured to output the output variable of each of the second input/output data based on a normal distribution obtained from an average and a variance of values of the output variable of each of the second input/output data.
- a data analysis apparatus is the data analysis apparatus according to the first invention, wherein the prediction unit represents the upper limit of the interval value, which represents the similarity between the input variables of the second input/output data.
- the output variable of each of the first input/output data is Value and the posterior probability of the latent interval value of the unknown input variable, given the interval value of each of the second input/output data, and the posterior probability of the latent interval value of the unknown input variable.
- the value of the output variable for the unknown input variable is predicted according to a prediction distribution that represents the posterior probability of the output variable of the unknown input variable given a value conditioned by the interval value.
- a data analysis device is the data analysis device according to the first aspect, wherein the predicting unit sets the value of each output variable of the first input/output data to the first input/output data.
- the upper limit value and the lower limit value of the interval value of each output variable and represents the similarity between the unknown input variable and each of the input variables of the first input/output data and the second input/output data, A kernel function for the upper limit value of the interval value, and a kernel function for the upper limit value of the interval value, which indicates the similarity between the input variables of the first input/output data and the second input/output data;
- An average expressed using the input/output data and the upper limit value of the section value of each output variable of the second input/output data, the unknown input variable, the first input/output data and the second input/output A kernel function for the lower limit of the interval value, which represents the similarity between each of the input variables of the data, and a similarity between the input variables of the first input/
- a predictive distribution that represents the posterior probability of the output variable of the unknown input variable given the value of each output variable of the input/output data and the value conditioned by the interval value of each of the second input/output data. , Predict the value of the output variable for the unknown input variable.
- a data analysis apparatus provides a plurality of first input/output data to which a value of an output variable is given and an interval value in which the value of the output variable represents a range.
- a data processing unit that performs a process of acquiring data represented by a set of a plurality of given second input/output data, and an input variable whose value of an output variable is unknown and the data, using linear regression.
- a predicting unit that predicts a value of an output variable with respect to the unknown input variable, the upper limit of a section value of the input variable and the output variable estimated based on the first input/output data and the second input/output data
- Parameter of linear regression showing the relationship with the value
- parameter of linear regression showing the relationship between the lower limit of the interval value of the input variable and the output variable, each weight parameter of the upper limit value and the lower limit value of the interval value, and the variance parameter
- the average using the parameters of linear regression representing the relationship with the upper limit of the interval value, and from the unknown input variable, the lower limit of the interval value
- a prediction unit that predicts the value of the output variable with respect to the unknown input variable according to a prediction distribution that represents the posterior probability of the output variable of the unknown input variable.
- the data processing unit sets a plurality of first input/output data to which the value of the output variable is given, and the value of the output variable is in a range.
- a Gaussian process is used to predict the value of the output variable for the unknown input variable.
- the program according to the eighth invention causes a computer to function as each unit included in the data analysis device according to any one of the first to sixth inventions.
- the data analysis device, the method, and the program according to the present invention it is possible to use the input/output data in which the value of the output variable is given as the interval value, and thereby the output for the unknown input variable is output.
- the accuracy of predicting variables can be improved.
- linear regression does not require the design of the required feature amount, and can perform accurate estimation.
- FIG. 6 is a flowchart showing an example of the flow of processing by the data analysis processing program according to the first embodiment. It is a block diagram which shows an example of a functional structure of the data analysis apparatus which concerns on 2nd Embodiment. It is a flow chart which shows an example of the flow of processing by the data analysis processing program concerning a 2nd embodiment. It is a figure which shows an example of the data in which an output variable is given by the interval value.
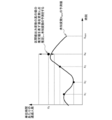
- the first method is, as shown in FIG. 1, an approach of introducing a latent variable representing the true value of the output variable given by the interval value, as in the method of Kashima et al. (Non-Patent Document 2). Is.
- FIG. 1 is a diagram showing an example of a Gaussian process using latent variables.
- the vertical axis represents the number of people passing per unit time
- the horizontal axis represents time.
- the latent variable Z 4 representing the estimated value of the true value of the interval value output variable is estimated, and the output variable is predicted with respect to the unknown input variable x new .
- the second method is an approach that uses the predicted values of two Gaussian processes, as shown in Fig. 2. That is, in this second approach, "a Gaussian process using the upper bound of interval value data" and "a Gaussian process using the lower bound of interval value data" are used.
- the method using the two Gaussian processes is referred to as "scissor Gaussian process”.
- FIG. 2 is a diagram showing an example of the scissors Gaussian process.
- the vertical axis represents the number of passing people per unit time
- the horizontal axis represents time.
- the data of the interval value can be treated as unbounded (for example, data that can be said to be 10 or more, but the upper bound cannot be known and is smaller than infinity). Instead, it is necessary to use computationally expensive latent variable sampling or some approximation before making predictions.
- the interval value data can be handled unless it is bounded (for example, the range is clearly known as 10 or more and 15 or less). Absent. Instead, the predicted value can be output without sampling or approximating the latent variable before the prediction.
- Data D represented as a set of s pieces of input/output data for which an accurate value is known as an output variable and t pieces of input/output data for which the accurate value of the output variable is unknown and which is known,
- x i represents an input variable of the data i
- y i represents an output variable (of which the value is known) of the data i
- x j represents the input variable of the data j
- r j l represents the lower bound of the value taken by the output variable of the data j
- r j u represents the upper bound of the value taken by the output variable of the data j.
- Data to which accurate data is given as an output variable is represented by a subscript i ⁇ sv
- data given as an interval value indicating a range of values is represented by a subscript j ⁇ iv .
- the output variables of the scalar value are collected,
- y j t indicating the value of the output variable of the data j whose value of the output variable is unknown is introduced as a latent variable. That is, y j t is
- K nn is an n ⁇ n variance-covariance matrix
- k dd ′ is a kernel function
- Is represented by k(x d , x d′ ).
- I n an n ⁇ n identity matrix. It can be seen that if f is integrated and erased, the generation probability of y is given by the following equation.
- C nn K nn + ⁇ 2 I n. Due to the nature of the conditional distribution of the Gaussian distribution, the posterior probability of the output variable y * of the unknown input variable x * given y is given by the following Gaussian distribution.
- the probability of P(y s ) generation limited to only data in which the output variable is a scalar value is as follows.
- K ss K ss + ⁇ 2 Insv
- K ss is an s ⁇ s matrix in which the (i, i′) element (i, i′ ⁇ sv ) is k(x i , x i′ ). Further, the probability of y t given y s is
- K tt is a t ⁇ t matrix
- (j, j′) element (j, j′ ⁇ ⁇ iv ) is defined by k(x j , x j′ )
- K st is s ⁇ t It is a matrix
- (i, j′) elements (i ⁇ sv , j ⁇ iv ) are defined by k(x i , x j ).
- TN represents a multidimensional truncated normal distribution
- probability density function is given by the following formula.
- the prediction distribution can be constructed by using.
- the method of generating random numbers that follows the truncated normal distribution is shown in Reference 2 (Stefan Wilhelm and BGManjunath. tmvtnorm: A package for the truncated multivariate normal distribution. sigma, Vol.2, No.2, 2010.). There is.
- Scissors Gaussian process As the second algorithm, a method using two regression analyzes will be described. First, a scissors linear regression method, which is a linear regression version of a method using two Gaussian processes, will be described. This scissors linear regression method is also a method newly proposed by this embodiment.
- the upper and lower bounds and the scalar value y d are modeled as being obtained according to the following normal distribution.
- ⁇ is a parameter to be estimated
- ⁇ ( ⁇ ) is a known function for defining the feature amount
- ⁇ ( ⁇ ) is a delta function.
- the parameters can be estimated by maximizing the following logarithmic objective function with respect to the parameters W, ⁇ , and ⁇ .
- K u and K l are variance-covariance matrices, and their elements are kernel functions, respectively.
- ⁇ , ⁇ 2 , and ⁇ ⁇ 1 can be estimated by maximizing them as an objective function.
- the predicted value y * of the unknown variable can be derived by the following formula using the method of constructing the prediction distribution in the normal Gaussian process and the formula (6c).
- a function f u that defines the input/output relationship between the input variable and the upper bound of the interval value will be written, and a function f l that defines the input/output relationship between the input variable and the lower bound of the interval value.
- f u, f l is respectively Gaussian process. So any subset
- the output variable y u, y l mean respectively a follow isotropic Gaussian distribution f u and f l.
- the predicted distribution of is given by the following Gaussian distribution.
- ⁇ and ⁇ are variables that represent weights.
- FIG. 3 is a block diagram showing an example of a functional configuration of the data analysis device 10A according to the first embodiment.
- the data analysis device 10A according to the present embodiment includes a data processing unit 12, a latent variable estimation unit 14, a prediction unit 16, a recording unit 18, and an input/output unit 20. There is.
- the data analysis device 10A is electrically configured as a computer device including a CPU (Central Processing Unit), a RAM (Random Access Memory), a ROM (Read Only Memory), and the like.
- the ROM stores a data analysis processing program according to this embodiment.
- the above-mentioned data analysis processing program may be installed in advance in the data analysis device 10A, for example.
- the data analysis processing program may be realized by being stored in a non-volatile storage medium or distributed via a network and appropriately installed in the data analysis device 10A.
- the non-volatile storage medium include a CD-ROM (Compact Disc Read Only Memory), a magneto-optical disc, a DVD-ROM (Digital Versatile Disc Read Only Memory), a flash memory, and a memory card.
- a non-volatile storage device is applied to the recording unit 18, for example.
- the recording unit 18 is provided with a data recording unit 18A and a latent variable recording unit 18B.
- the input/output unit 20 is connected to the external device 30 via a network, receives input of data to be analyzed from the external device 30, and outputs the analyzed data to the external device 30.
- the CPU functions as the data processing unit 12, the latent variable estimation unit 14, and the prediction unit 16 by reading and executing the data analysis processing program stored in the ROM.
- FIG. 4 is a flowchart showing an example of the flow of processing by the data analysis processing program according to the first embodiment.
- the data processing unit 12 acquires the above-mentioned data D from the external device 30 via the input/output unit 20 and stores it in the data recording unit 18A.
- the data D is represented as a set of a plurality of first input/output data to which the value of the output variable is given and a plurality of second input/output data to which the value of the output variable is given as an interval value representing a range. It is considered to be the data.
- the latent variable estimation unit 14 receives the data D stored in the data recording unit 18A as an input and estimates the true value of the output variable given as the interval value for each of the plurality of second input/output data.
- the latent variable representing the value is estimated, and the estimated latent variable is stored in the latent variable recording unit 18B.
- a random number is generated according to the cutting normal distribution of the generation probability of the latent variable conditioned by the interval value, which is shown in the above equation (3), and becomes the estimated value of the latent variable.
- This truncated normal distribution is a kernel function that represents the similarity between the input variables of the first input/output data, and a kernel function that represents the similarity between the input variables of the first input/output data and the input variables of the second input/output data.
- step 104 the prediction unit 16 acquires the input variable x * whose output variable value is unknown from the external device 30 via the input/output unit 20.
- the prediction unit 16 uses the unknown input variable x * , the data D stored in the data recording unit 18A, and the latent variable stored in the latent variable recording unit 18B as inputs, and uses the Gaussian process to obtain the unknown value. to predict the value of the output variable y * for the input variable x *.
- a Gaussian distribution that represents the posterior probability of the output variable of the unknown input variable x * given the value of each output variable of the first input/output data and each latent variable of the second input/output data.
- the value of the output variable y * with respect to the unknown input variable x * is predicted according to the prediction distribution represented by using. This predictive distribution is derived using the above-described equation (5) as an example.
- the prediction unit 16 outputs the obtained predicted value of the output variable y * to the external device 30 via the input/output unit 20, and ends the series of processes by the data analysis processing program.
- the method of generating a random number of latent variables is used for the approximate calculation of the posterior distribution of the output variables (including the integral regarding the latent variable), but any method of approximating the integral calculation is used. Good.
- a truncated normal distribution of the generation probability of a latent variable conditioned by an interval value may be approximated by a normal distribution to obtain a prediction distribution.
- the latent variable estimation unit 14 calculates the average and variance of the values of the output variables of the second input/output data based on the truncated normal distribution of the generation probability of the values within the interval values of the second input/output data.
- This truncated normal distribution is, as described above, a kernel function indicating the similarity between the input variables of the first input/output data, the similarity between the input variable of the first input/output data and the input variable of the second input/output data.
- the prediction unit 16 determines the value of each output variable of the first input/output data and the second input/output data based on the normal distribution obtained from the average and variance of the values of each output variable of the second input/output data. according to the prediction distribution representing the unknown input variables x * output variable y * posterior probability of at Moto the value conditioned by section values for each are given in the value of the output variable y * for the unknown input variables x * Predict.
- This predictive distribution is represented by using a normal distribution of the values of the output variables of the second input/output data. This predictive distribution is, for example, the TN (cut normal distribution) in the above equation (4), It is derived using the formula replaced with the approximated normal distribution.
- FIG. 5 is a block diagram showing an example of the functional configuration of the data analysis device 10B according to the second embodiment.
- the data analysis device 10B according to this embodiment includes a data processing unit 12, a prediction unit 22, a recording unit 24, and an input/output unit 26.
- the data analysis device 10B is electrically configured as a computer device including a CPU, a RAM, a ROM, and the like.
- the ROM stores a data analysis processing program according to this embodiment.
- the recording unit 24 is provided with a data recording unit 24A.
- the input/output unit 26 is connected to the external device 30 via a network, receives input of data to be analyzed from the external device 30, and outputs the analyzed data to the external device 30.
- the CPU functions as the data processing unit 12 and the prediction unit 22 by reading and executing the data analysis processing program stored in the ROM.
- FIG. 6 is a flowchart showing an example of the flow of processing by the data analysis processing program according to the second embodiment.
- the data processing unit 12 acquires the above-mentioned data D from the external device 30 via the input/output unit 26 and stores it in the data recording unit 24A.
- the data D is, as described above, the plurality of first input/output data to which the value of the output variable is given and the plurality of second input/output data to which the value of the output variable is given as a section value representing a range.
- the data is expressed as a pair.
- step 112 the prediction unit 22 acquires the input variable x * whose output variable value is unknown from the external device 30 via the input/output unit 20.
- step 114 the prediction unit 22, * unknown input variables x, as input data D stored in the data recording unit 18A, predicts the value of the output variable y * for the unknown input variables x *.
- the value of each output variable of the first input/output data is set to the upper limit value of the interval value of each output variable of the first input/output data. And the lower limit.
- the posterior probability of the output variable of the unknown input variable x * under the condition that the value of each output variable of the first input/output data and the value of each section value of the second input/output data are given.
- the value of the output variable y * for the unknown input variable x * is predicted according to the predicted distribution represented.
- This predictive distribution is a kernel function for the upper limit of the interval value that represents the similarity between the unknown input variable x * and each of the input variables of the first input/output data and the second input/output data, and A kernel function for the upper limit value of the interval value, which represents the similarity between the input variables of the first input/output data and the second input/output data, and the interval value of each output variable of the first input/output data and the second input/output data Upper limit value of, and the lower limit of the interval value, which represents the similarity between the average and unknown input variable x * represented by and each of the input variables of the first input/output data and the second input/output data
- This prediction distribution is derived by using the above-mentioned formula (10) as an example. Then, the prediction unit 22 outputs the obtained predicted value of the output variable y * to the external device 30 via the input/output unit 26, and ends the series of processes by the data analysis processing program.
- a method of predicting by a simple average of the values of two Gaussian processes is used, but a weighted average or a method of using a more complicated function may be used.
- the prediction unit 22 outputs the value of the unknown input variable x * under the condition that the value of each output variable of the first input/output data and the value of each section value of the second input/output data are given.
- the value of the output variable y * with respect to the unknown input variable x * is predicted according to the prediction distribution representing the posterior probability of the variable.
- This predictive distribution is a kernel function for the upper limit of the interval value, which indicates the similarity between the input variables of the second input/output data, and a lower limit of the interval value, which indicates the similarity between the input variables for the second input/output data.
- the predicted distribution is derived by using the above-mentioned equation (7) as an example.
- the prediction unit 22 predicts the value of the output variable y * for the unknown input variable x * using linear regression based on the unknown input variable x * and the data D. Specifically, the prediction unit 22, according to the prediction distribution representing the posterior probability of the unknown input variables x * of output variables, to predict the value of the output variable y * for the unknown input variables x *.
- This predictive distribution is a parameter (parameter w u ) of linear regression that represents the relationship between the input variable and the upper limit of the interval value of the output variable, which is estimated based on the first input/output data and the second input/output data, and the input Parameter of linear regression (parameter w l ) representing the relationship between the variable and the lower limit of the interval value of the output variable, each weight parameter (parameter ⁇ ) of the upper limit and the lower limit of the interval value, and the variance parameter (parameter ⁇ ) ) on the basis, the unknown input variables x *, mean and is calculated using the parameters of the linear regression representing the relationship between the upper limit of the interval values from the unknown input variables x *, and the lower limit value of the interval values It is expressed by the mean calculated using the parameters of linear regression that expresses the relationship between, and the mean obtained from the weight parameters, and the normal distribution expressed using the variance expressed using the weight parameters and variance parameters. It This predictive distribution is derived by using the above-described equations (6a) and (6b)
- the embodiment may be in the form of a program for causing a computer to function as each unit included in the data analysis device.
- the embodiment may be in the form of a computer-readable storage medium storing this program.
- the process according to the embodiment is realized by the software configuration using the computer by executing the program has been described, but the present invention is not limited to this.
- the embodiment may be realized by, for example, a hardware configuration or a combination of a hardware configuration and a software configuration.
- 10A, 10B Data analysis device 12
- Data processing unit 14 Latent variable estimation unit 16, 22 Prediction unit 18, 24 Recording unit 20, 26 Input/output unit 30 External device
Abstract
L'invention concerne un dispositif, un procédé et un programme d'analyse de données qui permettent l'utilisation de données d'entrée/sortie pour lesquelles une valeur de variable de sortie est fournie sous la forme d'une valeur d'intervalle, améliorant ainsi la précision avec laquelle une variable de sortie est prédite par rapport à une variable d'entrée inconnue. Un dispositif 10A d'analyse de données est équipé: d'une unité 12 de traitement de données, qui réalise un processus visant à acquérir des données exprimées comme un ensemble d'une pluralité de premières données d'entrée/sortie pour lesquelles une valeur de variable de sortie est fournie et une pluralité de secondes données d'entrée/sortie pour lesquelles une valeur de variable de sortie est fournie sous la forme d'une valeur d'intervalle représentant une plage; et d'une unité 16 de prédiction qui, d'après les données et une variable d'entrée pour laquelle la valeur de variable de sortie est inconnue, utilise un processus gaussien afin de prédire une valeur de variable de sortie pour la variable d'entrée inconnue.
Priority Applications (1)
| Application Number | Priority Date | Filing Date | Title |
|---|---|---|---|
| US17/421,693 US20220092455A1 (en) | 2019-01-11 | 2020-01-07 | Data analysis device, method, and program |
Applications Claiming Priority (2)
| Application Number | Priority Date | Filing Date | Title |
|---|---|---|---|
| JP2019-003817 | 2019-01-11 | ||
| JP2019003817A JP7172616B2 (ja) | 2019-01-11 | 2019-01-11 | データ解析装置、方法、及びプログラム |
Publications (1)
| Publication Number | Publication Date |
|---|---|
| WO2020145252A1 true WO2020145252A1 (fr) | 2020-07-16 |
Family
ID=71520481
Family Applications (1)
| Application Number | Title | Priority Date | Filing Date |
|---|---|---|---|
| PCT/JP2020/000124 WO2020145252A1 (fr) | 2019-01-11 | 2020-01-07 | Dispositif, procédé et programme d'analyse de données |
Country Status (3)
| Country | Link |
|---|---|
| US (1) | US20220092455A1 (fr) |
| JP (1) | JP7172616B2 (fr) |
| WO (1) | WO2020145252A1 (fr) |
Families Citing this family (1)
| Publication number | Priority date | Publication date | Assignee | Title |
|---|---|---|---|---|
| CN117216576B (zh) * | 2023-10-26 | 2024-03-29 | 山东省地质矿产勘查开发局第六地质大队(山东省第六地质矿产勘查院) | 一种基于高斯混合聚类分析的石墨金矿找矿方法 |
Citations (1)
| Publication number | Priority date | Publication date | Assignee | Title |
|---|---|---|---|---|
| JP2017502390A (ja) * | 2013-12-03 | 2017-01-19 | ローベルト ボッシュ ゲゼルシャフト ミット ベシュレンクテル ハフツング | データに基づく関数モデルを定めるための方法及び装置 |
-
2019
- 2019-01-11 JP JP2019003817A patent/JP7172616B2/ja active Active
-
2020
- 2020-01-07 US US17/421,693 patent/US20220092455A1/en active Pending
- 2020-01-07 WO PCT/JP2020/000124 patent/WO2020145252A1/fr active Application Filing
Patent Citations (1)
| Publication number | Priority date | Publication date | Assignee | Title |
|---|---|---|---|---|
| JP2017502390A (ja) * | 2013-12-03 | 2017-01-19 | ローベルト ボッシュ ゲゼルシャフト ミット ベシュレンクテル ハフツング | データに基づく関数モデルを定めるための方法及び装置 |
Non-Patent Citations (1)
| Title |
|---|
| KASHIMA, HISASHI: "EM method for regression problem in which the objective variable is given in a range", THE JAPANESE SOCIETY FOR ARTIFICIAL INTELLIGENCE, DMSM: SPECIAL INTEREST GROUP ON DATA MINING AND STATISTICAL MATHEMATICS A702, 16 October 2007 (2007-10-16), pages 204 - 212, Retrieved from the Internet <URL:https://jsai.ixsq.nill.ac.jp/ej/?action=repository_uri&item_id=121&file_id=l&file_no=l> [retrieved on 20200331] * |
Also Published As
| Publication number | Publication date |
|---|---|
| JP7172616B2 (ja) | 2022-11-16 |
| JP2020113079A (ja) | 2020-07-27 |
| US20220092455A1 (en) | 2022-03-24 |
Similar Documents
| Publication | Publication Date | Title |
|---|---|---|
| JP7315748B2 (ja) | データ識別器訓練方法、データ識別器訓練装置、プログラム及び訓練方法 | |
| Hans | Bayesian lasso regression | |
| Le Gratiet et al. | Recursive co-kriging model for design of computer experiments with multiple levels of fidelity | |
| Kartal Koc et al. | Model selection in multivariate adaptive regression splines (MARS) using information complexity as the fitness function | |
| Peng et al. | Surrogate modeling immersed probability density evolution method for structural reliability analysis in high dimensions | |
| Takeuchi et al. | Nonparametric conditional density estimation using piecewise-linear solution path of kernel quantile regression | |
| Tschiatschek et al. | On Bayesian network classifiers with reduced precision parameters | |
| US20210300390A1 (en) | Efficient computational inference using gaussian processes | |
| Song et al. | BUAK-AIS: Efficient Bayesian updating with active learning Kriging-based adaptive importance sampling | |
| Anderson et al. | Assessing the convergence and mobility of nations without artificially specified class boundaries | |
| Bonilla et al. | Generic inference in latent Gaussian process models | |
| Wang et al. | A multilevel simulation optimization approach for quantile functions | |
| Gultekin et al. | Online forecasting matrix factorization | |
| WO2020145252A1 (fr) | Dispositif, procédé et programme d'analyse de données | |
| Higuchi et al. | Robust principal component analysis with adaptive selection for tuning parameters | |
| Bonilla et al. | Generic inference in latent Gaussian process models | |
| King et al. | Warped dynamic linear models for time series of counts | |
| Hirt et al. | Scalable bayesian learning for state space models using variational inference with smc samplers | |
| Joseph et al. | A programmable approach to model compression | |
| CA3119351C (fr) | Extension d'apprentissage de noyau profond de rang fini pour la prevision sur de longs horizons temporels | |
| Guan et al. | Fast expectation-maximization algorithms for spatial generalized linear mixed models | |
| Yerlikaya-Özkurt et al. | A review and new contribution on conic multivariate adaptive regression splines (CMARS): a powerful tool for predictive data mining | |
| Fearnhead | Asymptotics of ABC | |
| WO2021052609A1 (fr) | Inférence de calcul efficace | |
| Liu et al. | Accelerating Metropolis-within-Gibbs sampler with localized computations of differential equations |
Legal Events
| Date | Code | Title | Description |
|---|---|---|---|
| 121 | Ep: the epo has been informed by wipo that ep was designated in this application |
Ref document number: 20738296 Country of ref document: EP Kind code of ref document: A1 |
|
| NENP | Non-entry into the national phase |
Ref country code: DE |
|
| 122 | Ep: pct application non-entry in european phase |
Ref document number: 20738296 Country of ref document: EP Kind code of ref document: A1 |