WO2020145252A1 - Data analysis device, method, and program - Google Patents
Data analysis device, method, and program Download PDFInfo
- Publication number
- WO2020145252A1 WO2020145252A1 PCT/JP2020/000124 JP2020000124W WO2020145252A1 WO 2020145252 A1 WO2020145252 A1 WO 2020145252A1 JP 2020000124 W JP2020000124 W JP 2020000124W WO 2020145252 A1 WO2020145252 A1 WO 2020145252A1
- Authority
- WO
- WIPO (PCT)
- Prior art keywords
- input
- variable
- output
- value
- data
- Prior art date
Links
- 238000000034 method Methods 0.000 title claims abstract description 96
- 238000007405 data analysis Methods 0.000 title claims abstract description 58
- 238000009826 distribution Methods 0.000 claims description 98
- 238000012417 linear regression Methods 0.000 claims description 25
- 230000001143 conditioned effect Effects 0.000 claims description 11
- 230000006870 function Effects 0.000 description 44
- 238000010586 diagram Methods 0.000 description 7
- 238000004422 calculation algorithm Methods 0.000 description 6
- 239000011159 matrix material Substances 0.000 description 5
- 239000013598 vector Substances 0.000 description 3
- 238000004364 calculation method Methods 0.000 description 2
- 238000005070 sampling Methods 0.000 description 2
- NAWXUBYGYWOOIX-SFHVURJKSA-N (2s)-2-[[4-[2-(2,4-diaminoquinazolin-6-yl)ethyl]benzoyl]amino]-4-methylidenepentanedioic acid Chemical compound C1=CC2=NC(N)=NC(N)=C2C=C1CCC1=CC=C(C(=O)N[C@@H](CC(=C)C(O)=O)C(O)=O)C=C1 NAWXUBYGYWOOIX-SFHVURJKSA-N 0.000 description 1
- 238000002790 cross-validation Methods 0.000 description 1
- 238000009795 derivation Methods 0.000 description 1
- 230000008030 elimination Effects 0.000 description 1
- 238000003379 elimination reaction Methods 0.000 description 1
Images


Classifications
-
- G—PHYSICS
- G06—COMPUTING; CALCULATING OR COUNTING
- G06F—ELECTRIC DIGITAL DATA PROCESSING
- G06F17/00—Digital computing or data processing equipment or methods, specially adapted for specific functions
- G06F17/10—Complex mathematical operations
- G06F17/18—Complex mathematical operations for evaluating statistical data, e.g. average values, frequency distributions, probability functions, regression analysis
-
- G—PHYSICS
- G06—COMPUTING; CALCULATING OR COUNTING
- G06N—COMPUTING ARRANGEMENTS BASED ON SPECIFIC COMPUTATIONAL MODELS
- G06N7/00—Computing arrangements based on specific mathematical models
- G06N7/01—Probabilistic graphical models, e.g. probabilistic networks
-
- G—PHYSICS
- G06—COMPUTING; CALCULATING OR COUNTING
- G06F—ELECTRIC DIGITAL DATA PROCESSING
- G06F16/00—Information retrieval; Database structures therefor; File system structures therefor
-
- G—PHYSICS
- G06—COMPUTING; CALCULATING OR COUNTING
- G06F—ELECTRIC DIGITAL DATA PROCESSING
- G06F18/00—Pattern recognition
- G06F18/20—Analysing
- G06F18/22—Matching criteria, e.g. proximity measures
-
- G—PHYSICS
- G06—COMPUTING; CALCULATING OR COUNTING
- G06N—COMPUTING ARRANGEMENTS BASED ON SPECIFIC COMPUTATIONAL MODELS
- G06N20/00—Machine learning
Definitions
- the present invention relates to a data analysis device, method, and program.
- the Gaussian process (Gaussian) described in Ref. 1 (Carl Edward Rasmussen and Christopher KI Williams. A method called Processes, GP) is widely used. This is a method that can perform regression by defining a function called a kernel that calculates the value corresponding to the similarity between input variables. By properly defining the kernel, not only vectors but also graphs, Various things such as images and documents can be used as input variables.
- the regression problem in recent data analysis requires a technique to handle data that is given as an output variable, not an exact value, but an interval value that indicates the range of the value.
- an output variable not an exact value
- an interval value that indicates the range of the value.
- FIG. 7 is a diagram showing an example of data in which output variables are given as interval values.
- the vertical axis represents the number of passing people per unit time
- the horizontal axis represents time.
- FIG. 7 shows the situation where the input variable is given as a real value, but as described above, there can be various input variables in the Gaussian process, and the present invention is not limited to this example.
- the input variable is a real value
- a case can be considered in which the input variable is also given as an interval value.
- the method described in Non-Patent Document 1 is used to determine the true value of the interval value. By estimating the scalar value, only the output variable can be used as the data given by the interval value.
- the present invention has been made in view of the above circumstances, and by making available input/output data in which the value of an output variable is given as an interval value, the accuracy of prediction of an output variable with respect to an unknown input variable can be improved.
- An object of the present invention is to provide a data analysis device, method, and program that can be improved.
- the data analysis device is provided with a plurality of first input/output data to which the value of the output variable is given and the value of the output variable as an interval value representing a range.
- a data processing unit that performs a process of acquiring data represented by a set of a plurality of second input/output data, and an unknown value using a Gaussian process based on the input variable and the data whose output variable value is unknown.
- a prediction unit that predicts the value of the output variable with respect to the input variable of.
- a data analysis device is the data analysis device according to the first aspect, wherein an estimated value of a true value of the output variable given as the interval value is obtained for each of the second input/output data.
- a latent variable estimation unit that estimates a latent variable that represents a kernel function that represents a similarity between input variables of the first input/output data, an input variable of the first input/output data, and a second input/output data of the second input/output data.
- a kernel function representing a similarity with an input variable a kernel function representing a similarity between input variables of the second input/output data, and a latent value conditioned by the interval value, which is represented using the interval value.
- a latent variable estimation unit that generates a random number as the latent variable according to the cut-normal distribution of the generation probability of a variable is further provided, and the prediction unit includes a value of the output variable of each of the first input/output data and the second value.
- a data analysis apparatus is the data analysis apparatus according to the first aspect, wherein a kernel function indicating a similarity between input variables of the first input/output data and an input of the first input/output data. It is expressed using a kernel function that represents the similarity between a variable and the input variable of the second input/output data, a kernel function that represents the similarity between the input variables of the second input/output data, and the interval value.
- An estimation unit is further included, and the prediction unit is configured to output the output variable of each of the second input/output data based on a normal distribution obtained from an average and a variance of values of the output variable of each of the second input/output data.
- the prediction unit is configured to output the output variable of each of the second input/output data based on a normal distribution obtained from an average and a variance of values of the output variable of each of the second input/output data.
- a data analysis apparatus is the data analysis apparatus according to the first invention, wherein the prediction unit represents the upper limit of the interval value, which represents the similarity between the input variables of the second input/output data.
- the output variable of each of the first input/output data is Value and the posterior probability of the latent interval value of the unknown input variable, given the interval value of each of the second input/output data, and the posterior probability of the latent interval value of the unknown input variable.
- the value of the output variable for the unknown input variable is predicted according to a prediction distribution that represents the posterior probability of the output variable of the unknown input variable given a value conditioned by the interval value.
- a data analysis device is the data analysis device according to the first aspect, wherein the predicting unit sets the value of each output variable of the first input/output data to the first input/output data.
- the upper limit value and the lower limit value of the interval value of each output variable and represents the similarity between the unknown input variable and each of the input variables of the first input/output data and the second input/output data, A kernel function for the upper limit value of the interval value, and a kernel function for the upper limit value of the interval value, which indicates the similarity between the input variables of the first input/output data and the second input/output data;
- An average expressed using the input/output data and the upper limit value of the section value of each output variable of the second input/output data, the unknown input variable, the first input/output data and the second input/output A kernel function for the lower limit of the interval value, which represents the similarity between each of the input variables of the data, and a similarity between the input variables of the first input/
- a predictive distribution that represents the posterior probability of the output variable of the unknown input variable given the value of each output variable of the input/output data and the value conditioned by the interval value of each of the second input/output data. , Predict the value of the output variable for the unknown input variable.
- a data analysis apparatus provides a plurality of first input/output data to which a value of an output variable is given and an interval value in which the value of the output variable represents a range.
- a data processing unit that performs a process of acquiring data represented by a set of a plurality of given second input/output data, and an input variable whose value of an output variable is unknown and the data, using linear regression.
- a predicting unit that predicts a value of an output variable with respect to the unknown input variable, the upper limit of a section value of the input variable and the output variable estimated based on the first input/output data and the second input/output data
- Parameter of linear regression showing the relationship with the value
- parameter of linear regression showing the relationship between the lower limit of the interval value of the input variable and the output variable, each weight parameter of the upper limit value and the lower limit value of the interval value, and the variance parameter
- the average using the parameters of linear regression representing the relationship with the upper limit of the interval value, and from the unknown input variable, the lower limit of the interval value
- a prediction unit that predicts the value of the output variable with respect to the unknown input variable according to a prediction distribution that represents the posterior probability of the output variable of the unknown input variable.
- the data processing unit sets a plurality of first input/output data to which the value of the output variable is given, and the value of the output variable is in a range.
- a Gaussian process is used to predict the value of the output variable for the unknown input variable.
- the program according to the eighth invention causes a computer to function as each unit included in the data analysis device according to any one of the first to sixth inventions.
- the data analysis device, the method, and the program according to the present invention it is possible to use the input/output data in which the value of the output variable is given as the interval value, and thereby the output for the unknown input variable is output.
- the accuracy of predicting variables can be improved.
- linear regression does not require the design of the required feature amount, and can perform accurate estimation.
- FIG. 6 is a flowchart showing an example of the flow of processing by the data analysis processing program according to the first embodiment. It is a block diagram which shows an example of a functional structure of the data analysis apparatus which concerns on 2nd Embodiment. It is a flow chart which shows an example of the flow of processing by the data analysis processing program concerning a 2nd embodiment. It is a figure which shows an example of the data in which an output variable is given by the interval value.
- the first method is, as shown in FIG. 1, an approach of introducing a latent variable representing the true value of the output variable given by the interval value, as in the method of Kashima et al. (Non-Patent Document 2). Is.
- FIG. 1 is a diagram showing an example of a Gaussian process using latent variables.
- the vertical axis represents the number of people passing per unit time
- the horizontal axis represents time.
- the latent variable Z 4 representing the estimated value of the true value of the interval value output variable is estimated, and the output variable is predicted with respect to the unknown input variable x new .
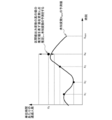
- the second method is an approach that uses the predicted values of two Gaussian processes, as shown in Fig. 2. That is, in this second approach, "a Gaussian process using the upper bound of interval value data" and "a Gaussian process using the lower bound of interval value data" are used.
- the method using the two Gaussian processes is referred to as "scissor Gaussian process”.
- FIG. 2 is a diagram showing an example of the scissors Gaussian process.
- the vertical axis represents the number of passing people per unit time
- the horizontal axis represents time.
- the data of the interval value can be treated as unbounded (for example, data that can be said to be 10 or more, but the upper bound cannot be known and is smaller than infinity). Instead, it is necessary to use computationally expensive latent variable sampling or some approximation before making predictions.
- the interval value data can be handled unless it is bounded (for example, the range is clearly known as 10 or more and 15 or less). Absent. Instead, the predicted value can be output without sampling or approximating the latent variable before the prediction.
- Data D represented as a set of s pieces of input/output data for which an accurate value is known as an output variable and t pieces of input/output data for which the accurate value of the output variable is unknown and which is known,
- x i represents an input variable of the data i
- y i represents an output variable (of which the value is known) of the data i
- x j represents the input variable of the data j
- r j l represents the lower bound of the value taken by the output variable of the data j
- r j u represents the upper bound of the value taken by the output variable of the data j.
- Data to which accurate data is given as an output variable is represented by a subscript i ⁇ sv
- data given as an interval value indicating a range of values is represented by a subscript j ⁇ iv .
- the output variables of the scalar value are collected,
- y j t indicating the value of the output variable of the data j whose value of the output variable is unknown is introduced as a latent variable. That is, y j t is
- K nn is an n ⁇ n variance-covariance matrix
- k dd ′ is a kernel function
- Is represented by k(x d , x d′ ).
- I n an n ⁇ n identity matrix. It can be seen that if f is integrated and erased, the generation probability of y is given by the following equation.
- C nn K nn + ⁇ 2 I n. Due to the nature of the conditional distribution of the Gaussian distribution, the posterior probability of the output variable y * of the unknown input variable x * given y is given by the following Gaussian distribution.
- the probability of P(y s ) generation limited to only data in which the output variable is a scalar value is as follows.
- K ss K ss + ⁇ 2 Insv
- K ss is an s ⁇ s matrix in which the (i, i′) element (i, i′ ⁇ sv ) is k(x i , x i′ ). Further, the probability of y t given y s is
- K tt is a t ⁇ t matrix
- (j, j′) element (j, j′ ⁇ ⁇ iv ) is defined by k(x j , x j′ )
- K st is s ⁇ t It is a matrix
- (i, j′) elements (i ⁇ sv , j ⁇ iv ) are defined by k(x i , x j ).
- TN represents a multidimensional truncated normal distribution
- probability density function is given by the following formula.
- the prediction distribution can be constructed by using.
- the method of generating random numbers that follows the truncated normal distribution is shown in Reference 2 (Stefan Wilhelm and BGManjunath. tmvtnorm: A package for the truncated multivariate normal distribution. sigma, Vol.2, No.2, 2010.). There is.
- Scissors Gaussian process As the second algorithm, a method using two regression analyzes will be described. First, a scissors linear regression method, which is a linear regression version of a method using two Gaussian processes, will be described. This scissors linear regression method is also a method newly proposed by this embodiment.
- the upper and lower bounds and the scalar value y d are modeled as being obtained according to the following normal distribution.
- ⁇ is a parameter to be estimated
- ⁇ ( ⁇ ) is a known function for defining the feature amount
- ⁇ ( ⁇ ) is a delta function.
- the parameters can be estimated by maximizing the following logarithmic objective function with respect to the parameters W, ⁇ , and ⁇ .
- K u and K l are variance-covariance matrices, and their elements are kernel functions, respectively.
- ⁇ , ⁇ 2 , and ⁇ ⁇ 1 can be estimated by maximizing them as an objective function.
- the predicted value y * of the unknown variable can be derived by the following formula using the method of constructing the prediction distribution in the normal Gaussian process and the formula (6c).
- a function f u that defines the input/output relationship between the input variable and the upper bound of the interval value will be written, and a function f l that defines the input/output relationship between the input variable and the lower bound of the interval value.
- f u, f l is respectively Gaussian process. So any subset
- the output variable y u, y l mean respectively a follow isotropic Gaussian distribution f u and f l.
- the predicted distribution of is given by the following Gaussian distribution.
- ⁇ and ⁇ are variables that represent weights.
- FIG. 3 is a block diagram showing an example of a functional configuration of the data analysis device 10A according to the first embodiment.
- the data analysis device 10A according to the present embodiment includes a data processing unit 12, a latent variable estimation unit 14, a prediction unit 16, a recording unit 18, and an input/output unit 20. There is.
- the data analysis device 10A is electrically configured as a computer device including a CPU (Central Processing Unit), a RAM (Random Access Memory), a ROM (Read Only Memory), and the like.
- the ROM stores a data analysis processing program according to this embodiment.
- the above-mentioned data analysis processing program may be installed in advance in the data analysis device 10A, for example.
- the data analysis processing program may be realized by being stored in a non-volatile storage medium or distributed via a network and appropriately installed in the data analysis device 10A.
- the non-volatile storage medium include a CD-ROM (Compact Disc Read Only Memory), a magneto-optical disc, a DVD-ROM (Digital Versatile Disc Read Only Memory), a flash memory, and a memory card.
- a non-volatile storage device is applied to the recording unit 18, for example.
- the recording unit 18 is provided with a data recording unit 18A and a latent variable recording unit 18B.
- the input/output unit 20 is connected to the external device 30 via a network, receives input of data to be analyzed from the external device 30, and outputs the analyzed data to the external device 30.
- the CPU functions as the data processing unit 12, the latent variable estimation unit 14, and the prediction unit 16 by reading and executing the data analysis processing program stored in the ROM.
- FIG. 4 is a flowchart showing an example of the flow of processing by the data analysis processing program according to the first embodiment.
- the data processing unit 12 acquires the above-mentioned data D from the external device 30 via the input/output unit 20 and stores it in the data recording unit 18A.
- the data D is represented as a set of a plurality of first input/output data to which the value of the output variable is given and a plurality of second input/output data to which the value of the output variable is given as an interval value representing a range. It is considered to be the data.
- the latent variable estimation unit 14 receives the data D stored in the data recording unit 18A as an input and estimates the true value of the output variable given as the interval value for each of the plurality of second input/output data.
- the latent variable representing the value is estimated, and the estimated latent variable is stored in the latent variable recording unit 18B.
- a random number is generated according to the cutting normal distribution of the generation probability of the latent variable conditioned by the interval value, which is shown in the above equation (3), and becomes the estimated value of the latent variable.
- This truncated normal distribution is a kernel function that represents the similarity between the input variables of the first input/output data, and a kernel function that represents the similarity between the input variables of the first input/output data and the input variables of the second input/output data.
- step 104 the prediction unit 16 acquires the input variable x * whose output variable value is unknown from the external device 30 via the input/output unit 20.
- the prediction unit 16 uses the unknown input variable x * , the data D stored in the data recording unit 18A, and the latent variable stored in the latent variable recording unit 18B as inputs, and uses the Gaussian process to obtain the unknown value. to predict the value of the output variable y * for the input variable x *.
- a Gaussian distribution that represents the posterior probability of the output variable of the unknown input variable x * given the value of each output variable of the first input/output data and each latent variable of the second input/output data.
- the value of the output variable y * with respect to the unknown input variable x * is predicted according to the prediction distribution represented by using. This predictive distribution is derived using the above-described equation (5) as an example.
- the prediction unit 16 outputs the obtained predicted value of the output variable y * to the external device 30 via the input/output unit 20, and ends the series of processes by the data analysis processing program.
- the method of generating a random number of latent variables is used for the approximate calculation of the posterior distribution of the output variables (including the integral regarding the latent variable), but any method of approximating the integral calculation is used. Good.
- a truncated normal distribution of the generation probability of a latent variable conditioned by an interval value may be approximated by a normal distribution to obtain a prediction distribution.
- the latent variable estimation unit 14 calculates the average and variance of the values of the output variables of the second input/output data based on the truncated normal distribution of the generation probability of the values within the interval values of the second input/output data.
- This truncated normal distribution is, as described above, a kernel function indicating the similarity between the input variables of the first input/output data, the similarity between the input variable of the first input/output data and the input variable of the second input/output data.
- the prediction unit 16 determines the value of each output variable of the first input/output data and the second input/output data based on the normal distribution obtained from the average and variance of the values of each output variable of the second input/output data. according to the prediction distribution representing the unknown input variables x * output variable y * posterior probability of at Moto the value conditioned by section values for each are given in the value of the output variable y * for the unknown input variables x * Predict.
- This predictive distribution is represented by using a normal distribution of the values of the output variables of the second input/output data. This predictive distribution is, for example, the TN (cut normal distribution) in the above equation (4), It is derived using the formula replaced with the approximated normal distribution.
- FIG. 5 is a block diagram showing an example of the functional configuration of the data analysis device 10B according to the second embodiment.
- the data analysis device 10B according to this embodiment includes a data processing unit 12, a prediction unit 22, a recording unit 24, and an input/output unit 26.
- the data analysis device 10B is electrically configured as a computer device including a CPU, a RAM, a ROM, and the like.
- the ROM stores a data analysis processing program according to this embodiment.
- the recording unit 24 is provided with a data recording unit 24A.
- the input/output unit 26 is connected to the external device 30 via a network, receives input of data to be analyzed from the external device 30, and outputs the analyzed data to the external device 30.
- the CPU functions as the data processing unit 12 and the prediction unit 22 by reading and executing the data analysis processing program stored in the ROM.
- FIG. 6 is a flowchart showing an example of the flow of processing by the data analysis processing program according to the second embodiment.
- the data processing unit 12 acquires the above-mentioned data D from the external device 30 via the input/output unit 26 and stores it in the data recording unit 24A.
- the data D is, as described above, the plurality of first input/output data to which the value of the output variable is given and the plurality of second input/output data to which the value of the output variable is given as a section value representing a range.
- the data is expressed as a pair.
- step 112 the prediction unit 22 acquires the input variable x * whose output variable value is unknown from the external device 30 via the input/output unit 20.
- step 114 the prediction unit 22, * unknown input variables x, as input data D stored in the data recording unit 18A, predicts the value of the output variable y * for the unknown input variables x *.
- the value of each output variable of the first input/output data is set to the upper limit value of the interval value of each output variable of the first input/output data. And the lower limit.
- the posterior probability of the output variable of the unknown input variable x * under the condition that the value of each output variable of the first input/output data and the value of each section value of the second input/output data are given.
- the value of the output variable y * for the unknown input variable x * is predicted according to the predicted distribution represented.
- This predictive distribution is a kernel function for the upper limit of the interval value that represents the similarity between the unknown input variable x * and each of the input variables of the first input/output data and the second input/output data, and A kernel function for the upper limit value of the interval value, which represents the similarity between the input variables of the first input/output data and the second input/output data, and the interval value of each output variable of the first input/output data and the second input/output data Upper limit value of, and the lower limit of the interval value, which represents the similarity between the average and unknown input variable x * represented by and each of the input variables of the first input/output data and the second input/output data
- This prediction distribution is derived by using the above-mentioned formula (10) as an example. Then, the prediction unit 22 outputs the obtained predicted value of the output variable y * to the external device 30 via the input/output unit 26, and ends the series of processes by the data analysis processing program.
- a method of predicting by a simple average of the values of two Gaussian processes is used, but a weighted average or a method of using a more complicated function may be used.
- the prediction unit 22 outputs the value of the unknown input variable x * under the condition that the value of each output variable of the first input/output data and the value of each section value of the second input/output data are given.
- the value of the output variable y * with respect to the unknown input variable x * is predicted according to the prediction distribution representing the posterior probability of the variable.
- This predictive distribution is a kernel function for the upper limit of the interval value, which indicates the similarity between the input variables of the second input/output data, and a lower limit of the interval value, which indicates the similarity between the input variables for the second input/output data.
- the predicted distribution is derived by using the above-mentioned equation (7) as an example.
- the prediction unit 22 predicts the value of the output variable y * for the unknown input variable x * using linear regression based on the unknown input variable x * and the data D. Specifically, the prediction unit 22, according to the prediction distribution representing the posterior probability of the unknown input variables x * of output variables, to predict the value of the output variable y * for the unknown input variables x *.
- This predictive distribution is a parameter (parameter w u ) of linear regression that represents the relationship between the input variable and the upper limit of the interval value of the output variable, which is estimated based on the first input/output data and the second input/output data, and the input Parameter of linear regression (parameter w l ) representing the relationship between the variable and the lower limit of the interval value of the output variable, each weight parameter (parameter ⁇ ) of the upper limit and the lower limit of the interval value, and the variance parameter (parameter ⁇ ) ) on the basis, the unknown input variables x *, mean and is calculated using the parameters of the linear regression representing the relationship between the upper limit of the interval values from the unknown input variables x *, and the lower limit value of the interval values It is expressed by the mean calculated using the parameters of linear regression that expresses the relationship between, and the mean obtained from the weight parameters, and the normal distribution expressed using the variance expressed using the weight parameters and variance parameters. It This predictive distribution is derived by using the above-described equations (6a) and (6b)
- the embodiment may be in the form of a program for causing a computer to function as each unit included in the data analysis device.
- the embodiment may be in the form of a computer-readable storage medium storing this program.
- the process according to the embodiment is realized by the software configuration using the computer by executing the program has been described, but the present invention is not limited to this.
- the embodiment may be realized by, for example, a hardware configuration or a combination of a hardware configuration and a software configuration.
- 10A, 10B Data analysis device 12
- Data processing unit 14 Latent variable estimation unit 16, 22 Prediction unit 18, 24 Recording unit 20, 26 Input/output unit 30 External device
Abstract
Provided are a data analysis device, method, and program that enable the use of input/output data for which an output variable value is provided as an interval value, thereby improving the precision with which an output variable is predicted relative to an unknown input variable. A data analysis device 10A is equipped with: a data processing unit 12, which carries out a process for acquiring data expressed as a set of a plurality of first input/output data for which an output variable value is provided and a plurality of second input/output data for which an output variable value is provided as an interval value representing a range; and a prediction unit 16 which, on the basis of the data and an input variable for which the output variable value is unknown, uses a Gaussian process to predict an output variable value for the unknown input variable.
Description
本発明は、データ解析装置、方法、及びプログラムに関する。
The present invention relates to a data analysis device, method, and program.
入力変数xから出力変数yの値を予測する回帰問題において、参考文献1(CarlEdward Rasmussen and Christopher K.I. Williams. Gaussian Processes for Machine Learning. The MIT Press, 2005.)に記載されている、ガウス過程(Gaussian Processes, GP)と呼ばれる手法が広く利用されている。これは、カーネルと呼ばれる入力変数間の類似度に相当する値を計算する関数を定めることで、回帰を行うことができる手法であり、適切にカーネルを定めることでベクトルのみでなく、グラフや、画像、文書など様々なものを入力変数として利用することができる。
In the regression problem that predicts the value of the output variable y from the input variable x, the Gaussian process (Gaussian) described in Ref. 1 (Carl Edward Rasmussen and Christopher KI Williams. A method called Processes, GP) is widely used. This is a method that can perform regression by defining a function called a kernel that calculates the value corresponding to the similarity between input variables. By properly defining the kernel, not only vectors but also graphs, Various things such as images and documents can be used as input variables.
一方、近年のデータ分析における回帰問題では、出力変数として、正確な値ではなく、値がどの範囲にあるかを表す区間値で与えられるデータを扱う技術が必要とされている。一例として、人手やカメラを通して人や車の通過台数を計測する状況を考える。この際、例えば、人の不注意で正確な値が計測できなかった時刻が存在する場合、その時刻の通過台数は記憶から答えられる「3台以上10台以下」のような範囲でしか分からない場合がある。同様に、カメラの要件で計測可能な人数に制限(例えば、10人/秒) がある場合も、制限以上の人数が通過した時刻の通過人数は「10人以上」としか分からない。
On the other hand, the regression problem in recent data analysis requires a technique to handle data that is given as an output variable, not an exact value, but an interval value that indicates the range of the value. As an example, consider a situation in which the number of people or vehicles passing through is measured by human hands or cameras. At this time, for example, when there is a time when an accurate value could not be measured due to the carelessness of a person, the number of passing vehicles at that time can be known only from a range such as "3 to 10 vehicles" that can be answered from memory. There are cases. Similarly, if there is a limit to the number of people that can be measured due to the requirements of the camera (for example, 10 people/second), the number of people who can pass at the time when more than the limit has passed is known to be “10 people or more”.
図7は、出力変数が区間値で与えられるデータの一例を示す図である。
図7において、縦軸は単位時間当たりの通過人数を示し、横軸は時刻を示す。 FIG. 7 is a diagram showing an example of data in which output variables are given as interval values.
In FIG. 7, the vertical axis represents the number of passing people per unit time, and the horizontal axis represents time.
図7において、縦軸は単位時間当たりの通過人数を示し、横軸は時刻を示す。 FIG. 7 is a diagram showing an example of data in which output variables are given as interval values.
In FIG. 7, the vertical axis represents the number of passing people per unit time, and the horizontal axis represents time.
図7では、入力変数が実数値として与えられる状況を示しているが、上述したように、ガウス過程における入力変数は多種多様なものが可能であり、この例に限定されるものではない。また、入力変数が実数値の場合、入力変数も区間値として与えられる場合を考えることができるが、その場合も、例えば、非特許文献1に記載の方法等を用いて、区間値の真のスカラー値を推定しておくことで、出力変数のみが区間値で与えられるデータとすることができる。
FIG. 7 shows the situation where the input variable is given as a real value, but as described above, there can be various input variables in the Gaussian process, and the present invention is not limited to this example. Further, when the input variable is a real value, a case can be considered in which the input variable is also given as an interval value. In that case, for example, the method described in Non-Patent Document 1 is used to determine the true value of the interval value. By estimating the scalar value, only the output variable can be used as the data given by the interval value.
従来のガウス過程による回帰では出力変数が区間値で表現されるデータに適用することができないが、例えば、区間値で表現される出力変数を用いて(ガウス過程ではなく)線形回帰を行う鹿島らの手法が存在する(例えば、非特許文献2を参照)。この手法では、区間値で与えられた出力変数の真の値を表す潜在的な変数を導入し、EM(Expectation Maximization)アルゴリズム、すなわち、潜在変数と線形回帰のパラメタの更新を繰り返すEMアルゴリズムによって推定を行う。
Conventional regression using a Gaussian process cannot be applied to data whose output variables are expressed as interval values.For example, Kashima et al. perform linear regression (not Gaussian process) using output variables expressed as interval values. Method exists (for example, see Non-Patent Document 2). This method introduces a latent variable that represents the true value of the output variable given by the interval value, and estimates it using the EM (Expectation Maximization) algorithm, that is, the EM algorithm that repeatedly updates the latent variable and the parameters of linear regression I do.
しかしながら、上記の手法はカーネルを用いたガウス過程によるアプローチではないため、グラフや、画像、文書などを入力変数として利用できない。また、線形回帰の際に利用する特徴量の設計がなされていないと精度が低下する場合がある。
However, since the above method is not a Gaussian process approach using the kernel, graphs, images, documents, etc. cannot be used as input variables. In addition, the accuracy may decrease if the feature quantity used in the linear regression is not designed.
本発明は、上記の事情に鑑みてなされたものであり、出力変数の値が区間値として与えられた入出力データを利用可能とすることで、未知の入力変数に対する出力変数の予測の精度を向上させることができるデータ解析装置、方法、及びプログラムを提供することを目的とする。
The present invention has been made in view of the above circumstances, and by making available input/output data in which the value of an output variable is given as an interval value, the accuracy of prediction of an output variable with respect to an unknown input variable can be improved. An object of the present invention is to provide a data analysis device, method, and program that can be improved.
上記目的を達成するために、第1の発明に係るデータ解析装置は、出力変数の値が与えられた複数の第1入出力データと、出力変数の値が範囲を表す区間値として与えられた複数の第2入出力データとの組で表されるデータを取得する処理を行うデータ処理部と、出力変数の値が未知の入力変数及び前記データに基づいて、ガウス過程を用いて、前記未知の入力変数に対する出力変数の値を予測する予測部と、を備えている。
In order to achieve the above object, the data analysis device according to the first invention is provided with a plurality of first input/output data to which the value of the output variable is given and the value of the output variable as an interval value representing a range. A data processing unit that performs a process of acquiring data represented by a set of a plurality of second input/output data, and an unknown value using a Gaussian process based on the input variable and the data whose output variable value is unknown. And a prediction unit that predicts the value of the output variable with respect to the input variable of.
また、第2の発明に係るデータ解析装置は、第1の発明に係るデータ解析装置において、前記第2入出力データの各々について、前記区間値として与えられた出力変数の真の値の推定値を表す潜在変数を推定する潜在変数推定部であって、前記第1入出力データの入力変数間の類似度を表すカーネル関数、前記第1入出力データの入力変数と前記第2入出力データの入力変数との間の類似度を表すカーネル関数、前記第2入出力データの入力変数間の類似度を表すカーネル関数、及び前記区間値を用いて表される、前記区間値で条件付けられた潜在変数の生成確率の切断正規分布に従って、前記潜在変数として、乱数を生成する潜在変数推定部を更に備え、前記予測部が、前記第1入出力データの各々の前記出力変数の値及び前記第2入出力データの各々の前記潜在変数が与えられたもとでの前記未知の入力変数の出力変数の事後確率を表すガウス分布を用いて表される予測分布に従って、前記未知の入力変数に対する出力変数の値を予測する。
A data analysis device according to a second aspect of the present invention is the data analysis device according to the first aspect, wherein an estimated value of a true value of the output variable given as the interval value is obtained for each of the second input/output data. Is a latent variable estimation unit that estimates a latent variable that represents a kernel function that represents a similarity between input variables of the first input/output data, an input variable of the first input/output data, and a second input/output data of the second input/output data. A kernel function representing a similarity with an input variable, a kernel function representing a similarity between input variables of the second input/output data, and a latent value conditioned by the interval value, which is represented using the interval value. A latent variable estimation unit that generates a random number as the latent variable according to the cut-normal distribution of the generation probability of a variable is further provided, and the prediction unit includes a value of the output variable of each of the first input/output data and the second value. The value of the output variable for the unknown input variable according to a predictive distribution represented using a Gaussian distribution that represents the posterior probability of the output variable of the unknown input variable given the latent variable of each of the input and output data. Predict.
また、第3の発明に係るデータ解析装置は、第1の発明に係るデータ解析装置において、前記第1入出力データの入力変数間の類似度を表すカーネル関数、前記第1入出力データの入力変数と前記第2入出力データの入力変数との間の類似度を表すカーネル関数、前記第2入出力データの入力変数間の類似度を表すカーネル関数、及び前記区間値を用いて表される、前記第2入出力データの各々の前記区間値内の値の生成確率の切断正規分布に基づいて、前記第2入出力データの各々の前記出力変数の値の平均及び分散を推定する潜在変数推定部を更に備え、前記予測部が、前記第2入出力データの各々の前記出力変数の値の平均及び分散から得られる正規分布に基づいて、前記第2入出力データの各々の前記出力変数の値の正規分布を用いて表される、前記第1入出力データの各々の出力変数の値及び前記第2入出力データの各々の前記区間値で条件付けられた値が与えられたもとでの前記未知の入力変数の出力変数の事後確率を表す予測分布に従って、前記未知の入力変数に対する出力変数の値を予測する。
A data analysis apparatus according to a third aspect of the present invention is the data analysis apparatus according to the first aspect, wherein a kernel function indicating a similarity between input variables of the first input/output data and an input of the first input/output data. It is expressed using a kernel function that represents the similarity between a variable and the input variable of the second input/output data, a kernel function that represents the similarity between the input variables of the second input/output data, and the interval value. A latent variable for estimating an average and a variance of values of the output variables of the second input/output data, based on a truncated normal distribution of generation probabilities of values in the interval values of the second input/output data. An estimation unit is further included, and the prediction unit is configured to output the output variable of each of the second input/output data based on a normal distribution obtained from an average and a variance of values of the output variable of each of the second input/output data. Of the output variables of the first input/output data and the interval value of the second input/output data represented by a normal distribution of the values of The value of the output variable for the unknown input variable is predicted according to the prediction distribution that represents the posterior probability of the output variable of the unknown input variable.
また、第4の発明に係るデータ解析装置は、第1の発明に係るデータ解析装置において、前記予測部が、前記第2入出力データの入力変数間の類似度を表す、前記区間値の上限値についてのカーネル関数と、前記第2入出力データの入力変数間の類似度を表す、前記区間値の下限値についてのカーネル関数とに基づいて、前記第1入出力データの各々の出力変数の値及び前記第2入出力データの各々の前記区間値が与えられたもとでの前記未知の入力変数の潜在的な区間値の事後確率と、前記未知の入力変数の潜在的な区間値の事後確率が与えられたもとでの前記未知の入力変数に対する出力変数の値の事後確率とを用いて表される、前記第1入出力データの各々の出力変数の値及び前記第2入出力データの各々の前記区間値で条件付けられた値が与えられたもとでの前記未知の入力変数の出力変数の事後確率を表す予測分布に従って、前記未知の入力変数に対する出力変数の値を予測する。
A data analysis apparatus according to a fourth invention is the data analysis apparatus according to the first invention, wherein the prediction unit represents the upper limit of the interval value, which represents the similarity between the input variables of the second input/output data. Based on the kernel function for the value and the kernel function for the lower limit value of the interval value, which represents the similarity between the input variables of the second input/output data, the output variable of each of the first input/output data is Value and the posterior probability of the latent interval value of the unknown input variable, given the interval value of each of the second input/output data, and the posterior probability of the latent interval value of the unknown input variable. Of the output variable of the first input/output data and the second input/output data of the first input/output data represented by using the posterior probability of the value of the output variable with respect to the unknown input variable. The value of the output variable for the unknown input variable is predicted according to a prediction distribution that represents the posterior probability of the output variable of the unknown input variable given a value conditioned by the interval value.
また、第5の発明に係るデータ解析装置は、第1の発明に係るデータ解析装置において、前記予測部が、前記第1入出力データの各々の出力変数の値を、前記第1入出力データの各々の出力変数の区間値の上限値及び下限値とし、前記未知の入力変数と、前記第1入出力データ及び前記第2入出力データの入力変数の各々との間の類似度を表す、前記区間値の上限値についてのカーネル関数と、前記第1入出力データ及び前記第2入出力データの入力変数間の類似度を表す、前記区間値の上限値についてのカーネル関数と、前記第1入出力データ及び前記第2入出力データの各々の出力変数の区間値の上限値と、を用いて表される平均、前記未知の入力変数と、前記第1入出力データ及び前記第2入出力データの入力変数の各々との間の類似度を表す、前記区間値の下限値についてのカーネル関数と、前記第1入出力データ及び前記第2入出力データの入力変数間の類似度を表す、前記区間値の下限値についてのカーネル関数と、前記第1入出力データ及び前記第2入出力データの各々の出力変数の区間値の下限値と、を用いて表される平均と、から求められる平均、及び前記第1入出力データ及び前記第2入出力データの入力変数間の類似度を表すカーネル関数を用いて表される分散を用いて表される正規分布で表される、前記第1入出力データの各々の出力変数の値及び前記第2入出力データの各々の前記区間値で条件付けられた値が与えられたもとでの前記未知の入力変数の出力変数の事後確率を表す予測分布に従って、前記未知の入力変数に対する出力変数の値を予測する。
Further, a data analysis device according to a fifth aspect of the present invention is the data analysis device according to the first aspect, wherein the predicting unit sets the value of each output variable of the first input/output data to the first input/output data. The upper limit value and the lower limit value of the interval value of each output variable, and represents the similarity between the unknown input variable and each of the input variables of the first input/output data and the second input/output data, A kernel function for the upper limit value of the interval value, and a kernel function for the upper limit value of the interval value, which indicates the similarity between the input variables of the first input/output data and the second input/output data; An average expressed using the input/output data and the upper limit value of the section value of each output variable of the second input/output data, the unknown input variable, the first input/output data and the second input/output A kernel function for the lower limit of the interval value, which represents the similarity between each of the input variables of the data, and a similarity between the input variables of the first input/output data and the second input/output data, An average represented using a kernel function for the lower limit value of the section value and a lower limit value of the section value of each output variable of the first input/output data and the second input/output data. The first distribution represented by a mean and a normal distribution represented by a variance represented by a kernel function representing a similarity between input variables of the first input/output data and the second input/output data. According to a predictive distribution that represents the posterior probability of the output variable of the unknown input variable given the value of each output variable of the input/output data and the value conditioned by the interval value of each of the second input/output data. , Predict the value of the output variable for the unknown input variable.
一方、上記目的を達成するために、第6の発明に係るデータ解析装置は、出力変数の値が与えられた複数の第1入出力データと、前記出力変数の値が範囲を表す区間値として与えられた複数の第2入出力データとの組で表されるデータを取得する処理を行うデータ処理部と、出力変数の値が未知の入力変数及び前記データに基づいて、線形回帰を用いて、前記未知の入力変数に対する出力変数の値を予測する予測部であって、前記第1入出力データ及び前記第2入出力データに基づいて推定される、入力変数と出力変数の区間値の上限値との関係を表わす線形回帰のパラメタ、入力変数と出力変数の区間値の下限値との関係を表わす線形回帰のパラメタ、区間値の上限値と下限値との各々の重みパラメタ、及び分散パラメタに基づいて、前記未知の入力変数から、前記区間値の上限値との関係を表わす線形回帰のパラメタを用いて計算される平均と、前記未知の入力変数から、前記区間値の下限値との関係を表わす線形回帰のパラメタを用いて計算される平均と、前記重みパラメタとから求められる平均、及び前記重みパラメタと前記分散パラメタを用いて表される分散を用いて表される正規分布で表される、前記未知の入力変数の出力変数の事後確率を表す予測分布に従って、前記未知の入力変数に対する出力変数の値を予測する予測部と、を備えている。
On the other hand, in order to achieve the above-mentioned object, a data analysis apparatus according to a sixth aspect of the present invention provides a plurality of first input/output data to which a value of an output variable is given and an interval value in which the value of the output variable represents a range. A data processing unit that performs a process of acquiring data represented by a set of a plurality of given second input/output data, and an input variable whose value of an output variable is unknown and the data, using linear regression. A predicting unit that predicts a value of an output variable with respect to the unknown input variable, the upper limit of a section value of the input variable and the output variable estimated based on the first input/output data and the second input/output data Parameter of linear regression showing the relationship with the value, parameter of linear regression showing the relationship between the lower limit of the interval value of the input variable and the output variable, each weight parameter of the upper limit value and the lower limit value of the interval value, and the variance parameter Based on, from the unknown input variable, the average calculated using the parameters of linear regression representing the relationship with the upper limit of the interval value, and from the unknown input variable, the lower limit of the interval value A mean calculated from the parameters of linear regression representing the relationship, a mean obtained from the weight parameters, and a normal distribution expressed using the variance expressed using the weight parameters and the variance parameters. And a prediction unit that predicts the value of the output variable with respect to the unknown input variable according to a prediction distribution that represents the posterior probability of the output variable of the unknown input variable.
一方、上記目的を達成するために、第7の発明に係るデータ解析方法は、データ処理部が、出力変数の値が与えられた複数の第1入出力データと、出力変数の値が範囲を表す区間値として与えられた複数の第2入出力データとの組で表されるデータを取得する処理を行うステップと、予測部が、出力変数の値が未知の入力変数及び前記データに基づいて、ガウス過程を用いて、前記未知の入力変数に対する出力変数の値を予測するステップと、を含んでいる。
On the other hand, in order to achieve the above-mentioned object, in a data analysis method according to a seventh aspect of the present invention, the data processing unit sets a plurality of first input/output data to which the value of the output variable is given, and the value of the output variable is in a range. A step of performing a process of acquiring data represented by a set of a plurality of second input/output data given as the interval value represented, and the predicting unit based on the input variable and the data whose output variable value is unknown. , A Gaussian process is used to predict the value of the output variable for the unknown input variable.
更に、上記目的を達成するために、第8の発明に係るプログラムは、コンピュータを、第1~第6のいずれか1の発明に係るデータ解析装置が備える各部として機能させる。
Furthermore, in order to achieve the above object, the program according to the eighth invention causes a computer to function as each unit included in the data analysis device according to any one of the first to sixth inventions.
以上説明したように、本発明に係るデータ解析装置、方法、及びプログラムによれば、出力変数の値が区間値として与えられた入出力データを利用可能とすることで、未知の入力変数に対する出力変数の予測の精度を向上させることができる。
また、カーネルを用いたアプローチをとることにより、線形回帰よりも多様なデータを入力として扱うことができる。
さらに、線形回帰では必要となる特徴量の設計を行う必要がなく、精度の良い推定を行うことができる。 As described above, according to the data analysis device, the method, and the program according to the present invention, it is possible to use the input/output data in which the value of the output variable is given as the interval value, and thereby the output for the unknown input variable is output. The accuracy of predicting variables can be improved.
Also, by taking the approach using the kernel, it is possible to handle more diverse data as input than linear regression.
Furthermore, linear regression does not require the design of the required feature amount, and can perform accurate estimation.
以下、図面を参照して、本発明を実施するための形態の一例について詳細に説明する。
Hereinafter, an example of a mode for carrying out the present invention will be described in detail with reference to the drawings.
本実施形態においては、区間値出力を用いたガウス過程に基づく2つのアルゴリズムを示す。1つ目の手法は、図1に示すように、鹿島らの手法(非特許文献2)と同様に、区間値で与えられた出力変数の真の値を表す潜在的な変数を導入するアプローチである。
In this embodiment, two algorithms based on a Gaussian process using interval value output are shown. The first method is, as shown in FIG. 1, an approach of introducing a latent variable representing the true value of the output variable given by the interval value, as in the method of Kashima et al. (Non-Patent Document 2). Is.
図1は、潜在変数を用いたガウス過程の一例を示す図である。
図1において、縦軸は単位時間当たりの通過人数を示し、横軸は時刻を示す。 FIG. 1 is a diagram showing an example of a Gaussian process using latent variables.
In FIG. 1, the vertical axis represents the number of people passing per unit time, and the horizontal axis represents time.
図1において、縦軸は単位時間当たりの通過人数を示し、横軸は時刻を示す。 FIG. 1 is a diagram showing an example of a Gaussian process using latent variables.
In FIG. 1, the vertical axis represents the number of people passing per unit time, and the horizontal axis represents time.
図1では、区間値出力変数の真の値の推定値を表す潜在変数Z4が推定され、未知の入力変数xnewに対する出力変数の予測が行われる。
In FIG. 1, the latent variable Z 4 representing the estimated value of the true value of the interval value output variable is estimated, and the output variable is predicted with respect to the unknown input variable x new .
次に、2つ目の手法は、図2に示すように、2つのガウス過程の予測値を用いるアプローチである。つまり、この2つ目のアプローチでは、「区間値のデータの上界を用いたガウス過程」と「区間値のデータの下界を用いたガウス過程」とが用いられる。以下、2つのガウス過程を用いた方法を、「はさみこみガウス過程」という。
Next, the second method is an approach that uses the predicted values of two Gaussian processes, as shown in Fig. 2. That is, in this second approach, "a Gaussian process using the upper bound of interval value data" and "a Gaussian process using the lower bound of interval value data" are used. Hereinafter, the method using the two Gaussian processes is referred to as "scissor Gaussian process".
図2は、はさみこみガウス過程の一例を示す図である。
図2において、縦軸は単位時間当たりの通過人数を示し、横軸は時刻を示す。 FIG. 2 is a diagram showing an example of the scissors Gaussian process.
In FIG. 2, the vertical axis represents the number of passing people per unit time, and the horizontal axis represents time.
図2において、縦軸は単位時間当たりの通過人数を示し、横軸は時刻を示す。 FIG. 2 is a diagram showing an example of the scissors Gaussian process.
In FIG. 2, the vertical axis represents the number of passing people per unit time, and the horizontal axis represents time.
図2では、区間が与えられたデータの上界r4
uを用いたガウス過程と、区間が与えられたデータの下界r4
lを用いたガウス過程とが用いられる。そして、これら2つのガウス過程の値を用いて、未知の入力変数xnewに対する出力変数の予測が行われる。
In FIG. 2, a Gaussian process using the upper bound r 4 u of the data given the interval and a Gaussian process using the lower bound r 4 l of the data given the interval are used. Then, using the values of these two Gaussian processes, the prediction of the output variable with respect to the unknown input variable x new is performed.
これら2つのアルゴリズムには、それぞれ長所と短所がある。1つ目のアプローチを用いる場合、区間値のデータは非有界(例えば、10以上なのは分かるが上界は分からず無限大より小さい、としか言えないデータ)であっても扱える。その代わりに予測を行う前に計算量の大きい潜在変数のサンプリングや、なんらかの近似を利用することが必要になる。一方、2つ目のアプローチを用いる場合は、1つ目のアプローチの場合と逆に、区間値のデータは有界(例えば、10以上15以下のように範囲が明確に分かる)でなければ扱えない。その代わりに予測を行う前の潜在変数のサンプリングや近似を行うことなく、予測値を出力することができる。
Each of these two algorithms has its strengths and weaknesses. In the case of using the first approach, the data of the interval value can be treated as unbounded (for example, data that can be said to be 10 or more, but the upper bound cannot be known and is smaller than infinity). Instead, it is necessary to use computationally expensive latent variable sampling or some approximation before making predictions. On the other hand, when using the second approach, conversely to the case of the first approach, the interval value data can be handled unless it is bounded (for example, the range is clearly known as 10 or more and 15 or less). Absent. Instead, the predicted value can be output without sampling or approximating the latent variable before the prediction.
[データの定義]
出力変数として正確な値が分かるs個の入出力データと、出力変数の正確な値は分からず、値のとる範囲が分かるt個の入出力データの組として表されるデータD、つまり、 [Definition of data]
Data D represented as a set of s pieces of input/output data for which an accurate value is known as an output variable and t pieces of input/output data for which the accurate value of the output variable is unknown and which is known,

が与えられているとする。xiはデータiの入力変数、yiはデータiの(値が分かる) 出力変数を表す。xjはデータjの入力変数、rj
lはデータjの出力変数がとる値の下界、rj
uはデータjの出力変数がとる値の上界を表す。出力変数として正確なデータが与えられているデータを添字i∈Ωsv、値の範囲を示す区間値として与えられているデータを添字j∈Ωivで表すこととする。データの総数をn(=s+t)と書き、上記2種類のどちらのデータかを区別しないときは添字dを用いる。また、以後スカラー値の出力変数をまとめて、
Is given. x i represents an input variable of the data i, and y i represents an output variable (of which the value is known) of the data i. x j represents the input variable of the data j, r j l represents the lower bound of the value taken by the output variable of the data j, and r j u represents the upper bound of the value taken by the output variable of the data j. Data to which accurate data is given as an output variable is represented by a subscript iεΩ sv , and data given as an interval value indicating a range of values is represented by a subscript jεΩ iv . The total number of data is written as n (=s+t), and the subscript d is used when it is not necessary to distinguish between the above two types of data. Moreover, after that, the output variables of the scalar value are collected,
と書き、区間値の出力変数の範囲を示す変数を
And write a variable that indicates the range of the output variable of the interval value.

と書く。
Write.
また、潜在変数として出力変数の値が分からないデータjの出力変数の値を示す変数yj
tを導入する。すなわち、yj
tは、
In addition, a variable y j t indicating the value of the output variable of the data j whose value of the output variable is unknown is introduced as a latent variable. That is, y j t is

を満たす。これもまとめて、
Meet This is also summarized,

と書く。さらに、ysとytをまとめて、
Write. In addition, collectively y s and y t,
と書く。
Write.
[1.潜在変数を用いたガウス過程]
ここでは、上述の1つ目のアルゴリズム、すなわち、潜在変数を用いたガウス過程による方法について述べる。この方法では、出力変数yの生成過程として、以下に示すようなモデルを考える。 [1. Gaussian process using latent variables]
Here, the first algorithm described above, that is, the method based on the Gaussian process using latent variables will be described. In this method, the following model is considered as the process of generating the output variable y.
まず、入出力関係を定める関数fがガウス過程に従うとする。fがガウス過程であるとき、任意の部分集合
First, assume that the function f that determines the input/output relationship follows the Gaussian process. an arbitrary subset when f is a Gaussian process
は、次のガウス分布に従う。
Follows the Gaussian distribution
ただし、Knnはn×nの分散共分散行列であり、その(d、d’)要素kdd’はカーネル関数
However, K nn is an n×n variance-covariance matrix, and its (d, d′) element k dd ′ is a kernel function.

を用いて、k(xd、xd’)で表される。
Is represented by k(x d , x d′ ).
次に、出力変数が平均fの等方ガウス分布に従うとする。
Next, assume that the output variable follows an isotropic Gaussian distribution with mean f.

ただし、Inはn×nの単位行列を表す。fを積分消去すれば、yの生成確率が以下の式で与えられることが分かる。
However, I n represents an n×n identity matrix. It can be seen that if f is integrated and erased, the generation probability of y is given by the following equation.
ここで、Cnn=Knn+σ2Inと定義した。ガウス分布の条件付き分布の性質から、yが与えられたもとでの未知の入力変数x*の出力変数y*の事後確率は、以下のガウス分布で与えられる。
Here, was defined as C nn = K nn + σ 2 I n. Due to the nature of the conditional distribution of the Gaussian distribution, the posterior probability of the output variable y * of the unknown input variable x * given y is given by the following Gaussian distribution.

kxは、
k x is

と定義されるn行ベクトルである。出力変数の値がすべて既知である通常の回帰問題であれば、上記式(2)を用いて予測ができる。しかし、今回の問題設定では区間値しか与えられていないデータの出力変数ytの値は分からないため、このままでは予測を行うことができない。そこで、P(y)をより分解してより詳しくみる。
Is an n-row vector defined as In the case of a normal regression problem in which all output variable values are known, the prediction can be performed using the above equation (2). However, in this problem setting, the value of the output variable y t of the data for which only the interval value is given is unknown, and therefore prediction cannot be performed as it is. Therefore, P(y) is decomposed into more details.
式(1)と同様に出力変数がスカラー値で与えられたデータのみに限定したP(ys)の生成確率は、次の通りである。
Similar to the equation (1), the probability of P(y s ) generation limited to only data in which the output variable is a scalar value is as follows.

ただし、Css=Kss+σ2Insv、Kssは(i、i’)要素(i、i’∈Ωsv)がk(xi、xi’)であるs×s行列である。さらに、ysが与えられたもとでのytの確率は以下となる。
However, C ss =K ss +σ 2 Insv , K ss is an s×s matrix in which the (i, i′) element (i, i′εΩ sv ) is k(x i , x i′ ). Further, the probability of y t given y s is

ただし、Kttはt×tの行列であり、(j、j’)要素(j、j’∈Ωiv)がk(xj、xj’)で定義され、Kstはs×tの行列であり、(i、j’)要素(i∈Ωsv、j∈Ωiv)がk(xi、xj)で定義される。
However, K tt is a t×t matrix, and (j, j′) element (j, j′ ∈ Ω iv ) is defined by k(x j , x j′ ), and K st is s×t It is a matrix, and (i, j′) elements (iεΩ sv , jεΩ iv ) are defined by k(x i , x j ).
従って、yivの各要素yjが区間
Therefore, each element y j of y iv
に値をとる確率
Probability of taking
は、
Is

であり、区間値で条件付けられた潜在変数ytの生成確率は、次の式で与えられる。
And the generation probability of the latent variable y t conditioned on the interval value is given by the following equation.
ただし、TNは多次元の切断正規分布を表し、その確率密度関数は以下の式で与えられる。
However, TN represents a multidimensional truncated normal distribution, and its probability density function is given by the following formula.

上記の導出から、yt∈(rl、ru)とysが与えられたもとでの未知入力変数x*の出力変数y*の事後確率は、上述の式(2)、(3)を用いて、
From the above derivation, the posterior probability of the output variable y * of the unknown input variable x * given y t ε(r l , r u ) and y s is given by the above equations (2) and (3). make use of,

と与えられる。ytに関する積分の解析的な計算は困難であるため、予測分布を構成する際には以下に示す乱数生成することによって数値的に得る方法や正規分布による近似を用いる手法が必要となる。
Is given. Since it is difficult to analytically calculate the integral with respect to y t , a method of numerically obtaining by generating the following random numbers or a method of using approximation by a normal distribution is necessary when configuring the prediction distribution.
[1-1.乱数を生成する方法]
この方法では、上述の式(3)の切断正規分布に従う乱数Q個の乱数生成値 [1-1. How to generate random numbers]
In this method, random number generated values of Q random numbers according to the cutting normal distribution of the above-mentioned equation (3)
この方法では、上述の式(3)の切断正規分布に従う乱数Q個の乱数生成値 [1-1. How to generate random numbers]
In this method, random number generated values of Q random numbers according to the cutting normal distribution of the above-mentioned equation (3)

を生成し、定義した
Generated and defined

を使って、式(4)の近似として、
Using, as an approximation of equation (4),

を用いることで予測分布を構成できる。切断正規分布に従う乱数の生成方法は、一例として、参考文献2(Stefan Wilhelm and BGManjunath. tmvtnorm: A package for the truncated multivariate normal distribution. sigma, Vol.2, No.2, 2010.)に示されている。
The prediction distribution can be constructed by using. As an example, the method of generating random numbers that follows the truncated normal distribution is shown in Reference 2 (Stefan Wilhelm and BGManjunath. tmvtnorm: A package for the truncated multivariate normal distribution. sigma, Vol.2, No.2, 2010.). There is.
[1-2.正規分布による近似を利用する方法]
この方法では、切断正規分布を正規分布で近似することで予測分布を構成する。例えば、変分近似とモーメントマッチングを用いる場合、まず変分近似によって式(3)の多次元の切断正規分布を近似することにより、各次元で独立な切断正規分布を得ることができる。 [1-2. Method that uses approximation by normal distribution]
In this method, a predicted distribution is constructed by approximating the truncated normal distribution by a normal distribution. For example, when using variational approximation and moment matching, an independent cutting normal distribution can be obtained in each dimension by first approximating the multidimensional cutting normal distribution of Expression (3) by variational approximation.
例えば、参考文献3(NL. Johnson, S.Kotz, and N.Balakrishnan. Continuous Univariate Probability Distributions,(Vol. 1). John Wiley & Sons Inc., NY, 1994.)に記載の手法のように、1次元の切断正規分布はその平均と分散が解析的に得られることが知られている。そこで、モーメントマッチングによりそれらを平均と分散にもつ正規分布を利用することで近似が可能となる。この近似分布を用いることで予測分布の式中の積分を解析的に解くことができ、予測分布を構成することができる。
For example, like the method described in Reference 3 (NL. Johnson, S.Kotz, and N.Balakrishnan. Continuous Univariate Probability Distributions,(Vol. 1). John Wiley & Sons Inc., NY, 1994.) It is known that the average and variance of the one-dimensional truncated normal distribution can be obtained analytically. Therefore, it is possible to approximate by using a normal distribution that has them as the mean and variance by the moment matching. By using this approximate distribution, the integral in the formula of the predictive distribution can be analytically solved, and the predictive distribution can be configured.
[2.はさみこみガウス過程]
2つ目のアルゴリズムとして、2つの回帰分析を用いた方法について述べる。まず、2つのガウス過程を用いた方法の線形回帰版である、はさみこみ線形回帰手法について述べる。このはさみこみ線形回帰手法も本実施形態により新たに提案する方法である。 [2. Scissors Gaussian process]
As the second algorithm, a method using two regression analyzes will be described. First, a scissors linear regression method, which is a linear regression version of a method using two Gaussian processes, will be described. This scissors linear regression method is also a method newly proposed by this embodiment.
[2-1.はさみこみ線形回帰]
ある入力xdの区間値 [2-1. Scissors linear regression]
Interval value of an input x d
ある入力xdの区間値 [2-1. Scissors linear regression]
Interval value of an input x d
の上界と下界、スカラー値ydが下記の正規分布に従って得られているとしてモデル化する。
The upper and lower bounds and the scalar value y d are modeled as being obtained according to the following normal distribution.

ただし、
However,
は推定対象のパラメタ、βは推定対象のパラメタ、φ(・)は特徴量を定める既知の関数、δ(・)はデルタ関数を表す。なお、上述のデータの定義で述べたようにd∈Ωsvならば、スカラー値ydは観測されているが区間値rdは観測されておらず、d∈Ωivならば、スカラー値は観測されていないが区間値は観測されていることになる。スカラー値のみ観測される場合の区間値rdは、正規分布の和が正規分布であるという性質を用いると次のように周辺化して消去することができる。
Is a parameter to be estimated, β is a parameter to be estimated, φ(·) is a known function for defining the feature amount, and δ(·) is a delta function. As described above in the definition of data, if dεΩ sv , the scalar value y d is observed, but the interval value r d is not observed, and if dεΩ iv , the scalar value is It is not observed, but the interval value is observed. The interval value r d when only scalar values are observed can be eliminated by marginalizing as follows using the property that the sum of normal distributions is a normal distribution.

(6a)
(6a)
この結果を使うと、パラメタが与えられたもとでのデータの生成確率は以下のようにまとめられる。
Using this result, the data generation probabilities under the given parameters can be summarized as follows.

(6b)
(6b)
よって、対数をとった下記の目的関数をパラメタW、α、βに関して最大化することでパラメタが推定できる。
Therefore, the parameters can be estimated by maximizing the following logarithmic objective function with respect to the parameters W, α, and β.

[2-2.はさみこみガウス回帰]
入力変数と区間値の上界の入出力関係を定める関数fu、入力変数と区間値の下界の入出力関係を定める関数flと書く。fu、flがそれぞれガウス過程に従うとする。よって任意の部分集合 [2-2. Scissors Gaussian regression]
A function f u that defines the input/output relationship between the input variable and the upper bound of the interval value will be written, and a function f l that defines the input/output relationship between the input variable and the lower bound of the interval value. f u, f l is respectively Gaussian process. So any subset
は次のガウス分布に従う。
Follows the Gaussian distribution
ただし、Ku、Klは分散共分散行列であり、その要素はそれぞれカーネル関数
However, K u and K l are variance-covariance matrices, and their elements are kernel functions, respectively.
で表される。さらに、区間値の上界と下界yu、ylはそれぞれ平均がfuとflの等方ガウス分布に従うとする。
It is represented by. Furthermore, it is assumed that the upper and lower bounds y u and y l of the interval values follow an isotropic Gaussian distribution whose averages are fu and f l , respectively.
fuとflを積分消去すれば、下記となる。
The integral elimination of f u and f l gives:
最後にスカラー値yが下記の正規分布に従うとする。
Finally, assume that the scalar value y follows the following normal distribution.

(6c)
(6c)
スカラー値のみが観測されたデータi∈Ωsvにおける潜在的な区間値データの集合をzu、zl(これは観測されていない)と書けば、y、rl、ruの生成過程は、
If we write the set of potential interval-valued data in data i ∈ Ω sv in which only scalar values are observed as z u , z l (this is not observed), the generation process of y, r l , r u is ,
と書ける。式中の積分は解析的に計算でき、
Can be written. The integral in the formula can be calculated analytically,

は正規分布となる。α、σ2、γ-1はこれを目的関数として最大化することで推定できる。未知変数の予測値y*は通常のガウス過程における予測分布の構成方法と、上述の式(6c)とを利用して、下記の式により導ける。
Has a normal distribution. α, σ 2 , and γ −1 can be estimated by maximizing them as an objective function. The predicted value y * of the unknown variable can be derived by the following formula using the method of constructing the prediction distribution in the normal Gaussian process and the formula (6c).
なお、ここでは式(6c)を用いた単純な線形ガウスモデルを考えているが、これ自体をガウス過程にしてもよいし、より高次の項までみるモデルを考えてもよい。
Although a simple linear Gaussian model using the equation (6c) is considered here, it may be a Gaussian process itself, or a model looking at higher order terms may be considered.
[2-3.はさみこみガウス回帰(スカラー値を区間値として扱う場合)]
本手法は、上述の[2-2.はさみこみガウス回帰]の方法とほぼ同様であるが、スカラー値も長さゼロの区間値として扱うことでより単純に手法を構築することもできる。表記の簡単化のため、ここでは、出力変数のスカラー値と区間値の上界をまとめてyu、出力変数のスカラー値と区間値の下界をまとめてylと書く。すなわち、 [2-3. Scissors Gaussian regression (when treating scalar values as interval values)]
This method is based on the above [2-2. The method is almost the same as the method of [Scissor Gaussian regression], but the method can be constructed more simply by treating the scalar value as an interval value of zero length. For simplicity of notation, where, y u collectively upper bound of the scalar value and interval values of the output variables, written as y l collectively lower bound of the scalar value and interval values of the output variable. That is,


である。
Is.
入力変数と区間値の上界の入出力関係を定める関数fu、入力変数と区間値の下界の入出力関係を定める関数flと書く。fu、flがそれぞれガウス過程に従うとする。よって任意の部分集合
A function f u that defines the input/output relationship between the input variable and the upper bound of the interval value will be written, and a function f l that defines the input/output relationship between the input variable and the lower bound of the interval value. f u, f l is respectively Gaussian process. So any subset
は次のガウス分布に従う。
Follows the Gaussian distribution

さらに、出力変数yu、ylはそれぞれ平均がfuとflの等方ガウス分布に従うとする。
Further, the output variable y u, y l mean respectively a follow isotropic Gaussian distribution f u and f l.
fuとflを積分消去すれば、
By integrating and eliminating f u and f l ,

となる。ただし、
Becomes However,

よって未知の入力変数x*の出力変数
Therefore, unknown output variable x * output variable

の予測分布は以下のガウス分布で与えられる。
The predicted distribution of is given by the following Gaussian distribution.

ただし、
However,
と定義されるn行ベクトルである。よって、式(8)によって任意の入力変数における出力変数の上界と下界の予測分布が計算できるので、この2つの重み付き和によって、出力変数値が定まるとすることで予測が行える。
Is an n-row vector defined as Therefore, since the prediction distributions of the upper bound and the lower bound of the output variable in an arbitrary input variable can be calculated by the formula (8), the prediction can be performed by assuming that the output variable value is determined by the weighted sum of these two.
α、βは重みを表す変数である。ただし、上述の[2-2.はさみこみガウス回帰]の方法と異なり、スカラー値を区間値として扱う方法では、これらα、βの推定には、交差検証法などを利用する必要がある。値に事前知識がある場合、例えばスカラー値がおおむね上界と下界の平均である、という場合にはその知識に基づいてα=β=1/2と設定すればよい。なお、正規分布に従う変数の線形和も正規分布に従うため、y*の事後分布も正規分布で与えられる。α=β=1/2とした時の事後分布は、以下となる。
α and β are variables that represent weights. However, the above [2-2. Unlike the [Scissors Gaussian regression] method, in the method of treating scalar values as interval values, it is necessary to use a cross-validation method or the like for estimating α and β. If the value has prior knowledge, for example, if the scalar value is roughly the average of the upper bound and the lower bound, then α=β=1/2 may be set based on that knowledge. Since the linear sum of the variables that follow the normal distribution also follows the normal distribution, the posterior distribution of y * is also given by the normal distribution. The posterior distribution when α=β=1/2 is as follows.

上述の手法を用いることで、出力変数の値が、観測された値そのもの、あるいは、値がとる範囲を表す区間値で与えられたものどちらであってもデータとして利用することができるようになる。このため、従来のガウス過程よりも予測の精度を向上させることができる。
By using the above method, it becomes possible to use it as data regardless of whether the value of the output variable is the observed value itself or the value given by the interval value representing the range of the value. .. Therefore, the accuracy of prediction can be improved as compared with the conventional Gaussian process.
[第1の実施形態]
本実施形態では、潜在変数を導入した1つの目のアプローチを実施する場合におけるデータ解析装置について説明する。なお、潜在変数の推定には、上述の[1-1.乱数を生成する方法]、及び、[1-2.正規分布による近似を利用する方法]のいずれかの方法が適用される。 [First Embodiment]
In this embodiment, a data analysis device in the case of implementing the first eye approach in which a latent variable is introduced will be described. Note that the latent variables are estimated by the above-mentioned [1-1. Method for Generating Random Number], and [1-2. Method using approximation by normal distribution] is applied.
図3は、第1の実施形態に係るデータ解析装置10Aの機能的な構成の一例を示すブロック図である。
図3に示すように、本実施形態に係るデータ解析装置10Aは、データ処理部12と、潜在変数推定部14と、予測部16と、記録部18と、入出力部20と、を備えている。 FIG. 3 is a block diagram showing an example of a functional configuration of thedata analysis device 10A according to the first embodiment.
As shown in FIG. 3, thedata analysis device 10A according to the present embodiment includes a data processing unit 12, a latent variable estimation unit 14, a prediction unit 16, a recording unit 18, and an input/output unit 20. There is.
図3に示すように、本実施形態に係るデータ解析装置10Aは、データ処理部12と、潜在変数推定部14と、予測部16と、記録部18と、入出力部20と、を備えている。 FIG. 3 is a block diagram showing an example of a functional configuration of the
As shown in FIG. 3, the
データ解析装置10Aは、電気的には、CPU(Central Processing Unit)、RAM(Random Access Memory)、及びROM(Read Only Memory)等を備えたコンピュータ装置として構成される。なお、ROMには、本実施形態に係るデータ解析処理プログラムが記憶されている。
The data analysis device 10A is electrically configured as a computer device including a CPU (Central Processing Unit), a RAM (Random Access Memory), a ROM (Read Only Memory), and the like. The ROM stores a data analysis processing program according to this embodiment.
上記のデータ解析処理プログラムは、例えば、データ解析装置10Aに予めインストールされていてもよい。このデータ解析処理プログラムは、不揮発性の記憶媒体に記憶して、又は、ネットワークを介して配布して、データ解析装置10Aに適宜インストールすることで実現してもよい。なお、不揮発性の記憶媒体の例としては、CD-ROM(Compact Disc Read Only Memory)、光磁気ディスク、DVD-ROM(Digital Versatile Disc Read Only Memory)、フラッシュメモリ、メモリカード等が挙げられる。
The above-mentioned data analysis processing program may be installed in advance in the data analysis device 10A, for example. The data analysis processing program may be realized by being stored in a non-volatile storage medium or distributed via a network and appropriately installed in the data analysis device 10A. Examples of the non-volatile storage medium include a CD-ROM (Compact Disc Read Only Memory), a magneto-optical disc, a DVD-ROM (Digital Versatile Disc Read Only Memory), a flash memory, and a memory card.
記録部18には、例えば、不揮発性の記憶装置が適用される。記録部18には、データ記録部18A及び潜在変数記録部18Bが設けられている。
A non-volatile storage device is applied to the recording unit 18, for example. The recording unit 18 is provided with a data recording unit 18A and a latent variable recording unit 18B.
入出力部20は、外部装置30とネットワークを介して接続されており、外部装置30から解析対象とするデータの入力を受け付け、解析後のデータを外部装置30に出力する。
The input/output unit 20 is connected to the external device 30 via a network, receives input of data to be analyzed from the external device 30, and outputs the analyzed data to the external device 30.
CPUは、ROMに記憶されているデータ解析処理プログラムを読み込んで実行することにより、上記のデータ処理部12、潜在変数推定部14、及び予測部16として機能する。
The CPU functions as the data processing unit 12, the latent variable estimation unit 14, and the prediction unit 16 by reading and executing the data analysis processing program stored in the ROM.
次に、図4を参照して、第1の実施形態に係るデータ解析装置10Aの作用について説明する。なお、図4は、第1の実施形態に係るデータ解析処理プログラムによる処理の流れの一例を示すフローチャートである。
Next, the operation of the data analysis device 10A according to the first embodiment will be described with reference to FIG. 4. FIG. 4 is a flowchart showing an example of the flow of processing by the data analysis processing program according to the first embodiment.
図4のステップ100では、データ処理部12が、外部装置30から入出力部20を介して、上述のデータDを取得し、データ記録部18Aに格納する。なお、データDとは、出力変数の値が与えられた複数の第1入出力データと、出力変数の値が範囲を表す区間値として与えられた複数の第2入出力データとの組で表されるデータとされる。
In step 100 of FIG. 4, the data processing unit 12 acquires the above-mentioned data D from the external device 30 via the input/output unit 20 and stores it in the data recording unit 18A. The data D is represented as a set of a plurality of first input/output data to which the value of the output variable is given and a plurality of second input/output data to which the value of the output variable is given as an interval value representing a range. It is considered to be the data.
ステップ102では、潜在変数推定部14が、データ記録部18Aに格納されたデータDを入力として、複数の第2入出力データの各々について、区間値として与えられた出力変数の真の値の推定値を表す潜在変数を推定し、推定した潜在変数を潜在変数記録部18Bに格納する。具体的には、上述の[1-1.乱数を生成する方法]で説明したように、上記(3)式に示す、区間値で条件付けられた潜在変数の生成確率の切断正規分布に従って、乱数が生成され、潜在変数の推定値となる。この切断正規分布は、第1入出力データの入力変数間の類似度を表すカーネル関数、第1入出力データの入力変数と第2入出力データの入力変数との間の類似度を表すカーネル関数、第2入出力データの入力変数間の類似度を表すカーネル関数、及び区間値を用いて表される。
In step 102, the latent variable estimation unit 14 receives the data D stored in the data recording unit 18A as an input and estimates the true value of the output variable given as the interval value for each of the plurality of second input/output data. The latent variable representing the value is estimated, and the estimated latent variable is stored in the latent variable recording unit 18B. Specifically, the above [1-1. Method for Generating Random Numbers], a random number is generated according to the cutting normal distribution of the generation probability of the latent variable conditioned by the interval value, which is shown in the above equation (3), and becomes the estimated value of the latent variable. This truncated normal distribution is a kernel function that represents the similarity between the input variables of the first input/output data, and a kernel function that represents the similarity between the input variables of the first input/output data and the input variables of the second input/output data. , A kernel function representing the similarity between the input variables of the second input/output data, and the interval value.
ステップ104では、予測部16が、外部装置30から入出力部20を介して、出力変数の値が未知の入力変数x*を取得する。
In step 104, the prediction unit 16 acquires the input variable x * whose output variable value is unknown from the external device 30 via the input/output unit 20.
ステップ106では、予測部16が、未知の入力変数x*、データ記録部18Aに格納されたデータD、潜在変数記録部18Bに格納された潜在変数を入力として、ガウス過程を用いて、未知の入力変数x*に対する出力変数y*の値を予測する。具体的には、第1入出力データの各々の出力変数の値及び第2入出力データの各々の潜在変数が与えられたもとでの未知の入力変数x*の出力変数の事後確率を表すガウス分布を用いて表される予測分布に従って、未知の入力変数x*に対する出力変数y*の値が予測される。この予測分布は、一例として、上述の式(5)を用いて導出される。そして、予測部16は、得られた出力変数y*の予測値を、入出力部20を介して外部装置30に出力し、本データ解析処理プログラムによる一連の処理を終了する。
In step 106, the prediction unit 16 uses the unknown input variable x * , the data D stored in the data recording unit 18A, and the latent variable stored in the latent variable recording unit 18B as inputs, and uses the Gaussian process to obtain the unknown value. to predict the value of the output variable y * for the input variable x *. Specifically, a Gaussian distribution that represents the posterior probability of the output variable of the unknown input variable x * given the value of each output variable of the first input/output data and each latent variable of the second input/output data. The value of the output variable y * with respect to the unknown input variable x * is predicted according to the prediction distribution represented by using. This predictive distribution is derived using the above-described equation (5) as an example. Then, the prediction unit 16 outputs the obtained predicted value of the output variable y * to the external device 30 via the input/output unit 20, and ends the series of processes by the data analysis processing program.
上記の実施形態では、(潜在変数に関する積分を含む)出力変数の事後分布の近似計算のために、潜在変数を乱数生成する方法を用いているが、積分計算を近似するいかなる方法を用いてもよい。
In the above embodiment, the method of generating a random number of latent variables is used for the approximate calculation of the posterior distribution of the output variables (including the integral regarding the latent variable), but any method of approximating the integral calculation is used. Good.
なお、上述の[1-2.正規分布による近似を利用する方法]で説明したように、区間値で条件付けられた潜在変数の生成確率の切断正規分布を正規分布で近似して予測分布を得るようにしてもよい。この場合、潜在変数推定部14は、第2入出力データの各々の区間値内の値の生成確率の切断正規分布に基づいて、第2入出力データの各々の出力変数の値の平均及び分散を推定する。この切断正規分布は、上述したように、第1入出力データの入力変数間の類似度を表すカーネル関数、第1入出力データの入力変数と第2入出力データの入力変数との間の類似度を表すカーネル関数、第2入出力データの入力変数間の類似度を表すカーネル関数、及び区間値を用いて表される。そして、予測部16は、第2入出力データの各々の出力変数の値の平均及び分散から得られる正規分布に基づいて、第1入出力データの各々の出力変数の値及び第2入出力データの各々の区間値で条件付けられた値が与えられたもとでの未知の入力変数x*の出力変数y*の事後確率を表す予測分布に従って、未知の入力変数x*に対する出力変数y*の値を予測する。この予測分布は、第2入出力データの各々の出力変数の値の正規分布を用いて表される、この予測分布は、一例として、上述の式(4)におけるTN(切断正規分布)を、近似した正規分布で置き換えた式を用いて導出される。
Note that the above [1-2. Method of using approximation by normal distribution], a truncated normal distribution of the generation probability of a latent variable conditioned by an interval value may be approximated by a normal distribution to obtain a prediction distribution. In this case, the latent variable estimation unit 14 calculates the average and variance of the values of the output variables of the second input/output data based on the truncated normal distribution of the generation probability of the values within the interval values of the second input/output data. To estimate. This truncated normal distribution is, as described above, a kernel function indicating the similarity between the input variables of the first input/output data, the similarity between the input variable of the first input/output data and the input variable of the second input/output data. It is expressed using a kernel function that represents the degree, a kernel function that represents the similarity between the input variables of the second input/output data, and an interval value. Then, the prediction unit 16 determines the value of each output variable of the first input/output data and the second input/output data based on the normal distribution obtained from the average and variance of the values of each output variable of the second input/output data. according to the prediction distribution representing the unknown input variables x * output variable y * posterior probability of at Moto the value conditioned by section values for each are given in the value of the output variable y * for the unknown input variables x * Predict. This predictive distribution is represented by using a normal distribution of the values of the output variables of the second input/output data. This predictive distribution is, for example, the TN (cut normal distribution) in the above equation (4), It is derived using the formula replaced with the approximated normal distribution.
[第2の実施形態]
本実施形態では、2つの回帰分析を用いた2つ目のアプローチを実施する場合におけるデータ解析装置について説明する。なお、出力変数の予測には、上述の[2-1.はさみこみ線形回帰]、[2-2.はさみこみガウス回帰]、及び[2-3.はさみこみガウス回帰(スカラー値を区間値として扱う場合)]のいずれかの方法が適用される。 [Second Embodiment]
In the present embodiment, a data analysis device in the case of implementing the second approach using two regression analyzes will be described. Note that the output variables are predicted by the above-mentioned [2-1. Scissors linear regression], [2-2. Scissors Gaussian regression], and [2-3. Scissors Gaussian regression (when treating scalar values as interval values)] either method is applied.
図5は、第2の実施形態に係るデータ解析装置10Bの機能的な構成の一例を示すブロック図である。
図5に示すように、本実施形態に係るデータ解析装置10Bは、データ処理部12と、予測部22と、記録部24と、入出力部26と、を備えている。 FIG. 5 is a block diagram showing an example of the functional configuration of thedata analysis device 10B according to the second embodiment.
As shown in FIG. 5, thedata analysis device 10B according to this embodiment includes a data processing unit 12, a prediction unit 22, a recording unit 24, and an input/output unit 26.
図5に示すように、本実施形態に係るデータ解析装置10Bは、データ処理部12と、予測部22と、記録部24と、入出力部26と、を備えている。 FIG. 5 is a block diagram showing an example of the functional configuration of the
As shown in FIG. 5, the
データ解析装置10Bは、上記第1の実施形態に係るデータ解析装置10Aと同様に、電気的には、CPU、RAM、及びROM等を備えたコンピュータ装置として構成される。なお、ROMには、本実施形態に係るデータ解析処理プログラムが記憶されている。
Like the data analysis device 10A according to the first embodiment, the data analysis device 10B is electrically configured as a computer device including a CPU, a RAM, a ROM, and the like. The ROM stores a data analysis processing program according to this embodiment.
記録部24には、データ記録部24Aが設けられている。
The recording unit 24 is provided with a data recording unit 24A.
入出力部26は、外部装置30とネットワークを介して接続されており、外部装置30から解析対象とするデータの入力を受け付け、解析後のデータを外部装置30に出力する。
The input/output unit 26 is connected to the external device 30 via a network, receives input of data to be analyzed from the external device 30, and outputs the analyzed data to the external device 30.
CPUは、ROMに記憶されているデータ解析処理プログラムを読み込んで実行することにより、上記のデータ処理部12及び予測部22として機能する。
The CPU functions as the data processing unit 12 and the prediction unit 22 by reading and executing the data analysis processing program stored in the ROM.
次に、図6を参照して、第2の実施形態に係るデータ解析装置10Bの作用について説明する。なお、図6は、第2の実施形態に係るデータ解析処理プログラムによる処理の流れの一例を示すフローチャートである。
Next, the operation of the data analysis device 10B according to the second embodiment will be described with reference to FIG. 6. FIG. 6 is a flowchart showing an example of the flow of processing by the data analysis processing program according to the second embodiment.
図6のステップ110では、データ処理部12が、外部装置30から入出力部26を介して、上述のデータDを取得し、データ記録部24Aに格納する。なお、データDとは、上述したように、出力変数の値が与えられた複数の第1入出力データと、出力変数の値が範囲を表す区間値として与えられた複数の第2入出力データとの組で表されるデータとされる。
In step 110 of FIG. 6, the data processing unit 12 acquires the above-mentioned data D from the external device 30 via the input/output unit 26 and stores it in the data recording unit 24A. The data D is, as described above, the plurality of first input/output data to which the value of the output variable is given and the plurality of second input/output data to which the value of the output variable is given as a section value representing a range. The data is expressed as a pair.
ステップ112では、予測部22が、外部装置30から入出力部20を介して、出力変数の値が未知の入力変数x*を取得する。
In step 112, the prediction unit 22 acquires the input variable x * whose output variable value is unknown from the external device 30 via the input/output unit 20.
ステップ114では、予測部22が、未知の入力変数x*、データ記録部18Aに格納されたデータDを入力として、未知の入力変数x*に対する出力変数y*の値を予測する。具体的には、例えば、上述の[2-3.はさみこみガウス回帰(スカラー値を区間値として扱う場合)]で説明したように、第1入出力データの各々の出力変数の値を、第1入出力データの各々の出力変数の区間値の上限値及び下限値とする。この場合、第1入出力データの各々の出力変数の値及び第2入出力データの各々の区間値で条件付けられた値が与えられたもとでの未知の入力変数x*の出力変数の事後確率を表す予測分布に従って、未知の入力変数x*に対する出力変数y*の値を予測する。この予測分布は、未知の入力変数x*と、第1入出力データ及び第2入出力データの入力変数の各々との間の類似度を表す、区間値の上限値についてのカーネル関数と、第1入出力データ及び第2入出力データの入力変数間の類似度を表す、区間値の上限値についてのカーネル関数と、第1入出力データ及び第2入出力データの各々の出力変数の区間値の上限値と、を用いて表される平均、未知の入力変数x*と、第1入出力データ及び第2入出力データの入力変数の各々との間の類似度を表す、区間値の下限値についてのカーネル関数と、第1入出力データ及び第2入出力データの入力変数間の類似度を表す、区間値の下限値についてのカーネル関数と、第1入出力データ及び第2入出力データの各々の出力変数の区間値の下限値と、を用いて表される平均と、から求められる平均、及び、第1入出力データ及び第2入出力データの入力変数間の類似度を表すカーネル関数を用いて表される分散を用いて表される正規分布で表される。この予測分布は、一例として、上述の式(10)を用いて導出される。そして、予測部22は、得られた出力変数y*の予測値を、入出力部26を介して外部装置30に出力し、本データ解析処理プログラムによる一連の処理を終了する。
In step 114, the prediction unit 22, * unknown input variables x, as input data D stored in the data recording unit 18A, predicts the value of the output variable y * for the unknown input variables x *. Specifically, for example, the above [2-3. Scissors Gaussian regression (when treating scalar values as interval values)], the value of each output variable of the first input/output data is set to the upper limit value of the interval value of each output variable of the first input/output data. And the lower limit. In this case, the posterior probability of the output variable of the unknown input variable x * under the condition that the value of each output variable of the first input/output data and the value of each section value of the second input/output data are given. The value of the output variable y * for the unknown input variable x * is predicted according to the predicted distribution represented. This predictive distribution is a kernel function for the upper limit of the interval value that represents the similarity between the unknown input variable x * and each of the input variables of the first input/output data and the second input/output data, and A kernel function for the upper limit value of the interval value, which represents the similarity between the input variables of the first input/output data and the second input/output data, and the interval value of each output variable of the first input/output data and the second input/output data Upper limit value of, and the lower limit of the interval value, which represents the similarity between the average and unknown input variable x * represented by and each of the input variables of the first input/output data and the second input/output data A kernel function for a value and a kernel function for a lower limit value of an interval value that represents the similarity between input variables of the first input/output data and the second input/output data, and the first input/output data and the second input/output data A lower limit value of the interval value of each output variable and an average obtained by using, and a kernel representing the similarity between the input variables of the first input/output data and the second input/output data It is represented by a normal distribution represented by using a variance represented by using a function. This prediction distribution is derived by using the above-mentioned formula (10) as an example. Then, the prediction unit 22 outputs the obtained predicted value of the output variable y * to the external device 30 via the input/output unit 26, and ends the series of processes by the data analysis processing program.
上記の実施形態では、2つのガウス過程の値の単純平均で予測する方法を用いているが、重み付き平均や、より複雑な関数を用いて予測する方法を用いてもよい。
In the above embodiment, a method of predicting by a simple average of the values of two Gaussian processes is used, but a weighted average or a method of using a more complicated function may be used.
なお、上述の[2-2.はさみこみガウス回帰]で説明した方法を用いてもよい。この場合、予測部22は、第1入出力データの各々の出力変数の値及び第2入出力データの各々の区間値で条件付けられた値が与えられたもとでの未知の入力変数x*の出力変数の事後確率を表す予測分布に従って、未知の入力変数x*に対する出力変数y*の値を予測する。この予測分布は、第2入出力データの入力変数間の類似度を表す、区間値の上限値についてのカーネル関数と、第2入出力データの入力変数間の類似度を表す、区間値の下限値についてのカーネル関数とに基づいて、第1入出力データの各々の出力変数の値及び第2入出力データの各々の区間値が与えられたもとでの未知の入力変数x*の潜在的な区間値の事後確率と、未知の入力変数x*の潜在的な区間値の事後確率が与えられたもとでの未知の入力変数x*に対する出力変数y*の値の事後確率とを用いて表される、この予測分布は、一例として、上述の式(7)を用いて導出される。
Note that the above [2-2. The method described in [Scissor Gaussian regression] may be used. In this case, the prediction unit 22 outputs the value of the unknown input variable x * under the condition that the value of each output variable of the first input/output data and the value of each section value of the second input/output data are given. The value of the output variable y * with respect to the unknown input variable x * is predicted according to the prediction distribution representing the posterior probability of the variable. This predictive distribution is a kernel function for the upper limit of the interval value, which indicates the similarity between the input variables of the second input/output data, and a lower limit of the interval value, which indicates the similarity between the input variables for the second input/output data. A potential interval of the unknown input variable x * given the value of each output variable of the first input/output data and each interval value of the second input/output data based on the kernel function for the value represented by using the posterior probability values, and a posterior probability of the output variable y * values for unknown input variables x * in Moto the posterior probability of the potential interval values of unknown input variables x * is given , The predicted distribution is derived by using the above-mentioned equation (7) as an example.
また、上述の[2-1.はさみこみ線形回帰]で説明した方法を用いてもよい。この場合、予測部22は、未知の入力変数x*及びデータDに基づいて、線形回帰を用いて、未知の入力変数x*に対する出力変数y*の値を予測する。具体的に、予測部22は、未知の入力変数x*の出力変数の事後確率を表す予測分布に従って、未知の入力変数x*に対する出力変数y*の値を予測する。この予測分布は、第1入出力データ及び第2入出力データに基づいて推定される、入力変数と出力変数の区間値の上限値との関係を表わす線形回帰のパラメタ(パラメタwu)、入力変数と出力変数の区間値の下限値との関係を表わす線形回帰のパラメタ(パラメタwl)、区間値の上限値と下限値との各々の重みパラメタ(パラメタα)、及び分散パラメタ(パラメタβ)に基づいて、未知の入力変数x*から、区間値の上限値との関係を表わす線形回帰のパラメタを用いて計算される平均と、未知の入力変数x*から、区間値の下限値との関係を表わす線形回帰のパラメタを用いて計算される平均と、重みパラメタとから求められる平均、及び、重みパラメタと分散パラメタを用いて表される分散を用いて表される正規分布で表される。この予測分布は、一例として、上述の式(6a)及び式(6b)を用いて導出される。
In addition, the above-mentioned [2-1. The method described in [Scissor linear regression] may be used. In this case, the prediction unit 22 predicts the value of the output variable y * for the unknown input variable x * using linear regression based on the unknown input variable x * and the data D. Specifically, the prediction unit 22, according to the prediction distribution representing the posterior probability of the unknown input variables x * of output variables, to predict the value of the output variable y * for the unknown input variables x *. This predictive distribution is a parameter (parameter w u ) of linear regression that represents the relationship between the input variable and the upper limit of the interval value of the output variable, which is estimated based on the first input/output data and the second input/output data, and the input Parameter of linear regression (parameter w l ) representing the relationship between the variable and the lower limit of the interval value of the output variable, each weight parameter (parameter α) of the upper limit and the lower limit of the interval value, and the variance parameter (parameter β) ) on the basis, the unknown input variables x *, mean and is calculated using the parameters of the linear regression representing the relationship between the upper limit of the interval values from the unknown input variables x *, and the lower limit value of the interval values It is expressed by the mean calculated using the parameters of linear regression that expresses the relationship between, and the mean obtained from the weight parameters, and the normal distribution expressed using the variance expressed using the weight parameters and variance parameters. It This predictive distribution is derived by using the above-described equations (6a) and (6b) as an example.
以上、実施形態としてデータ解析装置を例示して説明した。実施形態は、コンピュータを、データ解析装置が備える各部として機能させるためのプログラムの形態としてもよい。実施形態は、このプログラムを記憶したコンピュータが読み取り可能な記憶媒体の形態としてもよい。
Above, the data analysis device has been described as an example of the embodiment. The embodiment may be in the form of a program for causing a computer to function as each unit included in the data analysis device. The embodiment may be in the form of a computer-readable storage medium storing this program.
その他、上記実施形態で説明したデータ解析装置の構成は、一例であり、主旨を逸脱しない範囲内において状況に応じて変更してもよい。
In addition, the configuration of the data analysis device described in the above embodiment is an example, and may be changed according to the situation without departing from the spirit of the invention.
また、上記実施形態で説明したプログラムの処理の流れも、一例であり、主旨を逸脱しない範囲内において不要なステップを削除したり、新たなステップを追加したり、処理順序を入れ替えたりしてもよい。
The flow of processing of the program described in the above embodiment is also an example, and unnecessary steps may be deleted, new steps may be added, or the processing order may be changed without departing from the spirit of the invention. Good.
また、上記実施形態では、プログラムを実行することにより、実施形態に係る処理がコンピュータを利用してソフトウェア構成により実現される場合について説明したが、これに限らない。実施形態は、例えば、ハードウェア構成や、ハードウェア構成とソフトウェア構成との組み合わせによって実現してもよい。
Further, in the above-described embodiment, the case where the process according to the embodiment is realized by the software configuration using the computer by executing the program has been described, but the present invention is not limited to this. The embodiment may be realized by, for example, a hardware configuration or a combination of a hardware configuration and a software configuration.
10A、10B データ解析装置
12 データ処理部
14 潜在変数推定部
16、22 予測部
18、24 記録部
20、26 入出力部
30 外部装置 10A, 10BData analysis device 12 Data processing unit 14 Latent variable estimation unit 16, 22 Prediction unit 18, 24 Recording unit 20, 26 Input/output unit 30 External device
12 データ処理部
14 潜在変数推定部
16、22 予測部
18、24 記録部
20、26 入出力部
30 外部装置 10A, 10B
Claims (8)
- 出力変数の値が与えられた複数の第1入出力データと、出力変数の値が範囲を表す区間値として与えられた複数の第2入出力データとの組で表されるデータを取得する処理を行うデータ処理部と、
出力変数の値が未知の入力変数及び前記データに基づいて、ガウス過程を用いて、前記未知の入力変数に対する出力変数の値を予測する予測部と、
を備えたデータ解析装置。 A process of acquiring data represented by a set of a plurality of first input/output data to which a value of an output variable is given and a plurality of second input/output data to which a value of an output variable is given as an interval value representing a range A data processing unit that performs
A predictor that predicts the value of the output variable with respect to the unknown input variable, using a Gaussian process, based on the input variable and the data whose value of the output variable is unknown,
Data analysis device equipped with. - 前記第2入出力データの各々について、前記区間値として与えられた出力変数の真の値の推定値を表す潜在変数を推定する潜在変数推定部であって、
前記第1入出力データの入力変数間の類似度を表すカーネル関数、前記第1入出力データの入力変数と前記第2入出力データの入力変数との間の類似度を表すカーネル関数、前記第2入出力データの入力変数間の類似度を表すカーネル関数、及び前記区間値を用いて表される、前記区間値で条件付けられた潜在変数の生成確率の切断正規分布に従って、前記潜在変数として、乱数を生成する潜在変数推定部を更に備え、
前記予測部は、前記第1入出力データの各々の前記出力変数の値及び前記第2入出力データの各々の前記潜在変数が与えられたもとでの前記未知の入力変数の出力変数の事後確率を表すガウス分布を用いて表される予測分布に従って、前記未知の入力変数に対する出力変数の値を予測する請求項1に記載のデータ解析装置。 A latent variable estimation unit that estimates a latent variable representing an estimated value of a true value of the output variable given as the interval value for each of the second input/output data,
A kernel function representing the similarity between the input variables of the first input/output data, a kernel function representing the similarity between the input variable of the first input/output data and the input variable of the second input/output data, According to a cut-normal distribution of the generation probability of the latent variable conditioned by the interval value, which is represented using the kernel function and the interval value, which represents the similarity between the input variables of the two input/output data, as the latent variable, Further comprising a latent variable estimator for generating random numbers,
The predicting unit calculates posterior probabilities of output variables of the unknown input variable under the values of the output variables of the first input/output data and the latent variables of the second input/output data. The data analysis device according to claim 1, wherein the value of the output variable with respect to the unknown input variable is predicted according to a prediction distribution expressed by using a Gaussian distribution. - 前記第1入出力データの入力変数間の類似度を表すカーネル関数、前記第1入出力データの入力変数と前記第2入出力データの入力変数との間の類似度を表すカーネル関数、前記第2入出力データの入力変数間の類似度を表すカーネル関数、及び前記区間値を用いて表される、前記第2入出力データの各々の前記区間値内の値の生成確率の切断正規分布に基づいて、前記第2入出力データの各々の前記出力変数の値の平均及び分散を推定する潜在変数推定部を更に備え、
前記予測部は、前記第2入出力データの各々の前記出力変数の値の平均及び分散から得られる正規分布に基づいて、前記第2入出力データの各々の前記出力変数の値の正規分布を用いて表される、前記第1入出力データの各々の出力変数の値及び前記第2入出力データの各々の前記区間値で条件付けられた値が与えられたもとでの前記未知の入力変数の出力変数の事後確率を表す予測分布に従って、前記未知の入力変数に対する出力変数の値を予測する請求項1に記載のデータ解析装置。 A kernel function representing the similarity between the input variables of the first input/output data, a kernel function representing the similarity between the input variable of the first input/output data and the input variable of the second input/output data, A kernel function representing the degree of similarity between input variables of two input/output data, and a cut normal distribution of generation probabilities of values in each of the interval values of the second input/output data represented by using the interval value. Further comprising a latent variable estimator that estimates the mean and variance of the values of the output variables of each of the second input/output data,
The predicting unit calculates a normal distribution of the values of the output variables of the second input/output data based on a normal distribution obtained from the average and variance of the values of the output variables of the second input/output data. The output of the unknown input variable under the value of the output variable of each of the first input/output data and the value of the second input/output data conditioned by the interval value of the second input/output data. The data analysis device according to claim 1, wherein the value of the output variable with respect to the unknown input variable is predicted according to a prediction distribution that represents the posterior probability of the variable. - 前記予測部は、
前記第2入出力データの入力変数間の類似度を表す、前記区間値の上限値についてのカーネル関数と、前記第2入出力データの入力変数間の類似度を表す、前記区間値の下限値についてのカーネル関数とに基づいて、
前記第1入出力データの各々の出力変数の値及び前記第2入出力データの各々の前記区間値が与えられたもとでの前記未知の入力変数の潜在的な区間値の事後確率と、
前記未知の入力変数の潜在的な区間値の事後確率が与えられたもとでの前記未知の入力変数に対する出力変数の値の事後確率と
を用いて表される、前記第1入出力データの各々の出力変数の値及び前記第2入出力データの各々の前記区間値で条件付けられた値が与えられたもとでの前記未知の入力変数の出力変数の事後確率を表す予測分布に従って、前記未知の入力変数に対する出力変数の値を予測する請求項1に記載のデータ解析装置。 The prediction unit is
A kernel function for the upper limit of the interval value, which represents the similarity between the input variables of the second input/output data, and a lower limit value of the interval value, which represents the similarity between the input variables of the second input/output data. Based on the kernel function and
Posterior probabilities of potential interval values of the unknown input variable given the value of each output variable of the first input/output data and the interval value of each of the second input/output data,
The posterior probability of the value of the output variable for the unknown input variable given the posterior probability of the potential interval value of the unknown input variable, and The unknown input variable is according to a predictive distribution that represents the posterior probability of the output variable of the unknown input variable given the value of the output variable and the value conditioned by the interval value of each of the second input/output data. The data analysis device according to claim 1, which predicts a value of an output variable with respect to. - 前記予測部は、
前記第1入出力データの各々の出力変数の値を、前記第1入出力データの各々の出力変数の区間値の上限値及び下限値とし、
前記未知の入力変数と、前記第1入出力データ及び前記第2入出力データの入力変数の各々との間の類似度を表す、前記区間値の上限値についてのカーネル関数と、前記第1入出力データ及び前記第2入出力データの入力変数間の類似度を表す、前記区間値の上限値についてのカーネル関数と、前記第1入出力データ及び前記第2入出力データの各々の出力変数の区間値の上限値と、を用いて表される平均、
前記未知の入力変数と、前記第1入出力データ及び前記第2入出力データの入力変数の各々との間の類似度を表す、前記区間値の下限値についてのカーネル関数と、前記第1入出力データ及び前記第2入出力データの入力変数間の類似度を表す、前記区間値の下限値についてのカーネル関数と、前記第1入出力データ及び前記第2入出力データの各々の出力変数の区間値の下限値と、を用いて表される平均と、から求められる平均、及び
前記第1入出力データ及び前記第2入出力データの入力変数間の類似度を表すカーネル関数を用いて表される分散
を用いて表される正規分布で表される、前記第1入出力データの各々の出力変数の値及び前記第2入出力データの各々の前記区間値で条件付けられた値が与えられたもとでの前記未知の入力変数の出力変数の事後確率を表す予測分布に従って、前記未知の入力変数に対する出力変数の値を予測する請求項1に記載のデータ解析装置。 The prediction unit is
The value of each output variable of the first input/output data is the upper limit value and the lower limit value of the section value of each output variable of the first input/output data,
A kernel function for the upper limit of the interval value, which represents the degree of similarity between the unknown input variable and each of the input variables of the first input/output data and the second input/output data; A kernel function for the upper limit of the interval value, which represents the similarity between the output data and the input variables of the second input/output data, and the output variables of the first input/output data and the second input/output data. The upper limit of the interval value, and the average expressed using
A kernel function for the lower limit of the interval value, which represents the similarity between the unknown input variable and each of the input variables of the first input/output data and the second input/output data; A kernel function for the lower limit of the interval value, which represents the similarity between the output data and the input variables of the second input/output data, and the output variables of the first input/output data and the second input/output data. The lower limit of the interval value, and the average obtained by using the average, and a kernel function that represents the similarity between the input variables of the first input/output data and the second input/output data. The value of the output variable of each of the first input/output data and the value conditioned by the interval value of each of the second input/output data represented by a normal distribution represented by The data analysis device according to claim 1, wherein the value of the output variable with respect to the unknown input variable is predicted according to a prediction distribution that represents the posterior probability of the output variable of the unknown input variable under the original condition. - 出力変数の値が与えられた複数の第1入出力データと、前記出力変数の値が範囲を表す区間値として与えられた複数の第2入出力データとの組で表されるデータを取得する処理を行うデータ処理部と、
出力変数の値が未知の入力変数及び前記データに基づいて、線形回帰を用いて、前記未知の入力変数に対する出力変数の値を予測する予測部であって、
前記第1入出力データ及び前記第2入出力データに基づいて推定される、入力変数と出力変数の区間値の上限値との関係を表わす線形回帰のパラメタ、入力変数と出力変数の区間値の下限値との関係を表わす線形回帰のパラメタ、区間値の上限値と下限値との各々の重みパラメタ、及び分散パラメタに基づいて、
前記未知の入力変数から、前記区間値の上限値との関係を表わす線形回帰のパラメタを用いて計算される平均と、前記未知の入力変数から、前記区間値の下限値との関係を表わす線形回帰のパラメタを用いて計算される平均と、前記重みパラメタとから求められる平均、及び
前記重みパラメタと前記分散パラメタを用いて表される分散
を用いて表される正規分布で表される、前記未知の入力変数の出力変数の事後確率を表す予測分布に従って、前記未知の入力変数に対する出力変数の値を予測する予測部と、
を備えたデータ解析装置。 Obtaining data represented by a set of a plurality of first input/output data to which the value of the output variable is given and a plurality of second input/output data to which the value of the output variable is given as an interval value representing a range. A data processing unit that performs processing,
A value of the output variable is based on the unknown input variable and the data, using linear regression, a prediction unit for predicting the value of the output variable for the unknown input variable,
Parameter of linear regression showing the relationship between the upper limit value of the interval value of the input variable and the output variable, which is estimated based on the first input/output data and the second input/output data, of the interval value of the input variable and the output variable Based on the parameters of linear regression showing the relationship with the lower limit value, each weight parameter of the upper limit value and the lower limit value of the interval value, and the variance parameter,
From the unknown input variable, an average calculated using a linear regression parameter that represents the relationship with the upper limit of the interval value, and a linear that represents the relationship from the unknown input variable to the lower limit of the interval value. Mean calculated using the parameters of regression, the average obtained from the weighting parameter, and the variance represented using the weighting parameter and the variance parameter represented by a normal distribution represented by the, According to a prediction distribution that represents the posterior probability of the output variable of the unknown input variable, a prediction unit that predicts the value of the output variable for the unknown input variable,
Data analysis device equipped with. - データ処理部が、出力変数の値が与えられた複数の第1入出力データと、出力変数の値が範囲を表す区間値として与えられた複数の第2入出力データとの組で表されるデータを取得する処理を行うステップと、
予測部が、出力変数の値が未知の入力変数及び前記データに基づいて、ガウス過程を用いて、前記未知の入力変数に対する出力変数の値を予測するステップと、
を含むデータ解析方法。 The data processing unit is represented by a set of a plurality of first input/output data to which the value of the output variable is given and a plurality of second input/output data to which the value of the output variable is given as an interval value representing a range. The step of performing the process of acquiring data,
The predicting unit predicts the value of the output variable with respect to the unknown input variable, using a Gaussian process, based on the input variable whose output variable value is unknown and the data,
Data analysis method including. - コンピュータを、請求項1~6のいずれか1項に記載のデータ解析装置が備える各部として機能させるためのプログラム。 A program for causing a computer to function as each unit included in the data analysis device according to any one of claims 1 to 6.
Priority Applications (1)
| Application Number | Priority Date | Filing Date | Title |
|---|---|---|---|
| US17/421,693 US20220092455A1 (en) | 2019-01-11 | 2020-01-07 | Data analysis device, method, and program |
Applications Claiming Priority (2)
| Application Number | Priority Date | Filing Date | Title |
|---|---|---|---|
| JP2019003817A JP7172616B2 (en) | 2019-01-11 | 2019-01-11 | Data analysis device, method and program |
| JP2019-003817 | 2019-01-11 |
Publications (1)
| Publication Number | Publication Date |
|---|---|
| WO2020145252A1 true WO2020145252A1 (en) | 2020-07-16 |
Family
ID=71520481
Family Applications (1)
| Application Number | Title | Priority Date | Filing Date |
|---|---|---|---|
| PCT/JP2020/000124 WO2020145252A1 (en) | 2019-01-11 | 2020-01-07 | Data analysis device, method, and program |
Country Status (3)
| Country | Link |
|---|---|
| US (1) | US20220092455A1 (en) |
| JP (1) | JP7172616B2 (en) |
| WO (1) | WO2020145252A1 (en) |
Families Citing this family (1)
| Publication number | Priority date | Publication date | Assignee | Title |
|---|---|---|---|---|
| CN117216576B (en) * | 2023-10-26 | 2024-03-29 | 山东省地质矿产勘查开发局第六地质大队(山东省第六地质矿产勘查院) | Graphite gold ore prospecting method based on Gaussian mixture clustering analysis |
Citations (1)
| Publication number | Priority date | Publication date | Assignee | Title |
|---|---|---|---|---|
| JP2017502390A (en) * | 2013-12-03 | 2017-01-19 | ローベルト ボッシュ ゲゼルシャフト ミット ベシュレンクテル ハフツング | Method and apparatus for defining a functional model based on data |
-
2019
- 2019-01-11 JP JP2019003817A patent/JP7172616B2/en active Active
-
2020
- 2020-01-07 WO PCT/JP2020/000124 patent/WO2020145252A1/en active Application Filing
- 2020-01-07 US US17/421,693 patent/US20220092455A1/en active Pending
Patent Citations (1)
| Publication number | Priority date | Publication date | Assignee | Title |
|---|---|---|---|---|
| JP2017502390A (en) * | 2013-12-03 | 2017-01-19 | ローベルト ボッシュ ゲゼルシャフト ミット ベシュレンクテル ハフツング | Method and apparatus for defining a functional model based on data |
Non-Patent Citations (1)
| Title |
|---|
| KASHIMA, HISASHI: "EM method for regression problem in which the objective variable is given in a range", THE JAPANESE SOCIETY FOR ARTIFICIAL INTELLIGENCE, DMSM: SPECIAL INTEREST GROUP ON DATA MINING AND STATISTICAL MATHEMATICS A702, 16 October 2007 (2007-10-16), pages 204 - 212, Retrieved from the Internet <URL:https://jsai.ixsq.nill.ac.jp/ej/?action=repository_uri&item_id=121&file_id=l&file_no=l> [retrieved on 20200331] * |
Also Published As
| Publication number | Publication date |
|---|---|
| JP7172616B2 (en) | 2022-11-16 |
| JP2020113079A (en) | 2020-07-27 |
| US20220092455A1 (en) | 2022-03-24 |
Similar Documents
| Publication | Publication Date | Title |
|---|---|---|
| JP7315748B2 (en) | Data classifier training method, data classifier training device, program and training method | |
| Hans | Bayesian lasso regression | |
| Le Gratiet et al. | Recursive co-kriging model for design of computer experiments with multiple levels of fidelity | |
| Kartal Koc et al. | Model selection in multivariate adaptive regression splines (MARS) using information complexity as the fitness function | |
| Peng et al. | Surrogate modeling immersed probability density evolution method for structural reliability analysis in high dimensions | |
| Takeuchi et al. | Nonparametric conditional density estimation using piecewise-linear solution path of kernel quantile regression | |
| Song et al. | BUAK-AIS: Efficient Bayesian updating with active learning Kriging-based adaptive importance sampling | |
| Anderson et al. | Assessing the convergence and mobility of nations without artificially specified class boundaries | |
| Bonilla et al. | Generic inference in latent Gaussian process models | |
| Wang et al. | A multilevel simulation optimization approach for quantile functions | |
| Gultekin et al. | Online forecasting matrix factorization | |
| WO2020145252A1 (en) | Data analysis device, method, and program | |
| Higuchi et al. | Robust principal component analysis with adaptive selection for tuning parameters | |
| Bonilla et al. | Generic inference in latent Gaussian process models | |
| King et al. | Warped dynamic linear models for time series of counts | |
| Hirt et al. | Scalable bayesian learning for state space models using variational inference with smc samplers | |
| Joseph et al. | A programmable approach to model compression | |
| US20210300390A1 (en) | Efficient computational inference using gaussian processes | |
| CA3119351C (en) | Extending finite rank deep kernel learning to forecasting over long time horizons | |
| Guan et al. | Fast expectation-maximization algorithms for spatial generalized linear mixed models | |
| Fearnhead | Asymptotics of ABC | |
| WO2021052609A1 (en) | Efficient computational inference | |
| Liu et al. | Accelerating Metropolis-within-Gibbs sampler with localized computations of differential equations | |
| Belharbi et al. | Non-parametric uni-modality constraints for deep ordinal classification | |
| US20210342691A1 (en) | System and method for neural time series preprocessing |
Legal Events
| Date | Code | Title | Description |
|---|---|---|---|
| 121 | Ep: the epo has been informed by wipo that ep was designated in this application |
Ref document number: 20738296 Country of ref document: EP Kind code of ref document: A1 |
|
| NENP | Non-entry into the national phase |
Ref country code: DE |
|
| 122 | Ep: pct application non-entry in european phase |
Ref document number: 20738296 Country of ref document: EP Kind code of ref document: A1 |