WO2020071050A1 - 表示装置 - Google Patents
表示装置Info
- Publication number
- WO2020071050A1 WO2020071050A1 PCT/JP2019/034888 JP2019034888W WO2020071050A1 WO 2020071050 A1 WO2020071050 A1 WO 2020071050A1 JP 2019034888 W JP2019034888 W JP 2019034888W WO 2020071050 A1 WO2020071050 A1 WO 2020071050A1
- Authority
- WO
- WIPO (PCT)
- Prior art keywords
- display
- damage
- risk
- information
- damage occurrence
- Prior art date
- Legal status (The legal status is an assumption and is not a legal conclusion. Google has not performed a legal analysis and makes no representation as to the accuracy of the status listed.)
- Ceased
Links
Images


Classifications
-
- A—HUMAN NECESSITIES
- A01—AGRICULTURE; FORESTRY; ANIMAL HUSBANDRY; HUNTING; TRAPPING; FISHING
- A01G—HORTICULTURE; CULTIVATION OF VEGETABLES, FLOWERS, RICE, FRUIT, VINES, HOPS OR SEAWEED; FORESTRY; WATERING
- A01G7/00—Botany in general
-
- G—PHYSICS
- G08—SIGNALLING
- G08B—SIGNALLING SYSTEMS, e.g. PERSONAL CALLING SYSTEMS; ORDER TELEGRAPHS; ALARM SYSTEMS
- G08B31/00—Predictive alarm systems characterised by extrapolation or other computation using updated historic data
Definitions
- the present invention relates to a display device.
- Patent Documents 1 and 2 Techniques for supporting agricultural work using pesticides are disclosed in, for example, Patent Documents 1 and 2. Specifically, Patent Literature 1 discloses a technique for calculating a pesticide spraying plan for maximizing the crop yield. Patent Literature 2 discloses a technique for calculating a spraying date of a pesticide in consideration of “days before harvest”.
- the present invention has been made in view of the above problems, and an object of the present invention is to present a user with a more easily understandable damage occurrence risk and information relating to the damage occurrence risk. To provide a new and improved display device.
- the present invention indicates a possibility that damage to a crop due to an event of interest may occur, and damage estimated based on environmental information about an environment around the crop.
- the first display indicating the occurrence risk, the second display indicating the damage occurrence information on the occurrence of the damage, and the third display indicating the activity information on the activity for suppressing the damage occurrence risk correspond to the same time axis.
- a display device arranged side by side in a display area.
- the damage occurrence risk, the information on the damage occurrence, and the information on the activity for suppressing the damage occurrence risk are arranged side by side in correspondence with the same time axis, so that each information can be viewed in a time series at a glance. You can check.
- the present invention it is possible to present the damage occurrence risk and information related to the damage occurrence risk to the user in a more understandable manner.
- FIG. 1 is an overall view for explaining a technical outline of the present invention.
- 1 is a block diagram illustrating an example of an information processing system to which the present invention has been applied.
- FIG. 3 is a diagram illustrating an example of a display layout in a display area of a display device to which the present invention has been applied.
- FIG. 14 is a diagram illustrating an example of a modification of a display layout in a display area of a display device to which the present invention has been applied.
- FIG. 1 is a diagram showing an entire information processing system 1 to which the present invention is applied.
- the information processing system 1 to which the present invention is applied estimates the risk of damage caused by the event of interest as infection of the pest to the crop, and presents the risk of damage occurrence and information related to the risk of damage occurrence. I do.
- Damage risk refers to the risk that includes the possibility of infection or infection with a pest and the possibility of damage to the infected crop.
- Infection with a pest means that the disease is transmitted to a crop or, in the case of a pest, is parasitic on a crop.
- Damage to a crop means that the crop is infected with the disease, and the disease manifests itself in the crop by completing the incubation period after the infection.
- the incubation period of the insect damage refers to the period from when the insect lays eggs, when the larva hatches to the egg, when the crop is eaten, and the occurrence of the damage is recognized. It is recognized by farmers confirming that they can be eaten by insects.
- the risk of damage occurrence of the present invention is within the period specified by the user, based on the possibility of past infection or future infection, and the effects of pesticides sprayed in the past or pesticides that can be sprayed from now on. It is estimated that crops may be damaged.
- the information processing system 1 of the present invention presents the estimated damage occurrence risk and information related to the damage occurrence risk to the user in an easily understandable manner.
- the information processing system 1 includes a weather server 20, a cultivation sensor 30, an estimation server 40, and a display device 1000.
- the information processing system 1 estimates the damage occurrence risk by processing the information acquired using the weather server 20, the cultivation sensor 30, the display device 1000, and the like in the estimation server 40, and estimates the estimated damage.
- the occurrence risk and information related to the damage occurrence risk are presented on the display device 1000.
- the functional configuration of the information processing system 1 will be described with reference to FIG.
- the information processing system 1 includes the weather server 20, the cultivation sensor 30, the estimation server 40, and the display device 1000, as described above.
- the weather server 20 has a function of outputting environmental information relating to weather in a region where crops are cultivated, which is used by the estimation server 40.
- the environmental information output by the weather server 20 includes temperature, humidity, solar radiation, rainfall, and the like.
- the environment information output by the weather server 20 may be a past value such as a past weather history, or may be a current value. Further, the environmental information may be a predicted value such as a weather forecast.
- the cultivation sensor 30 has a function of outputting environmental information of a space where a crop is cultivated, which is used by the estimation server 40.
- the space where the crop is cultivated may be a space surrounding the place where the crop is cultivated, and may be, for example, an agricultural facility for cultivating the crop such as a greenhouse. As long as the crop is cultivated, it may not be surrounded, and may be an open space such as a field or a rice field.
- Examples of the environmental information include temperature, humidity, solar radiation, carbon dioxide concentration, and moisture content of the soil in which the crop is cultivated.
- the environment information acquired by the cultivation sensor 30 includes not only a current value but also a predicted value and a past value.
- the estimation server 40 includes an acquisition unit 41, an estimation unit 42, and a display information generation unit 43.
- the estimation server 40 has a function of estimating a damage occurrence risk within a period designated by the user based on the environment information and the medicine information acquired by the acquisition unit 41, and generating display information including the damage occurrence risk.
- the acquisition unit 41 has a function of acquiring environmental information, drug information, and the like used for estimating the risk of damage occurrence.
- the acquiring unit 41 acquires environmental information from the weather server 20 or the cultivation sensor 30.
- the acquisition unit 41 may acquire cultivation information that cannot be obtained from the weather server 20 or the cultivation sensor 30 via the display device 1000 described below.
- the cultivation information may be used when estimating the damage occurrence risk, similarly to the environmental information.
- Cultivation information includes, for example, crop varieties, crop cultivation altitude, soil type, soil nutrient status, crop sowing date and time, planting date and time, crop leaf removal status, pesticide spraying history, pesticide Includes information such as aftereffect status, weeding status, tree vigor status, and crop growth stage.
- the above drug information can be used to take the pesticide effect into account when estimating the risk of damage occurrence.
- the drug information may be obtained from literature or a survey.
- the medicine information includes information indicating a temporal effect of the medicine obtained by using the medicine.
- the medicine information may be information indicating a preventive effect or a therapeutic effect on a crop against pests and the like.
- the estimating unit 42 estimates a risk of damage to the crop based on the environmental information and the drug information acquired by the acquiring unit 41.
- the estimating unit 42 creates a damage occurrence risk model using, for example, the record of the occurrence of the disease and the pest of the crop, the history of the application of the pesticide to the crop, the environmental information until the occurrence of the pest and the disease in the crop, and the like.
- the estimating unit 42 estimates the damage risk of the crop by inputting pesticide application information to the crop for which the damage risk is to be newly estimated, environmental information of the crop, and the like. .
- the display information generation unit 43 has a function of generating display information for realizing the presentation of the damage occurrence risk estimated by the estimation unit 42 and the information related to the damage occurrence risk on the display device 1000.
- the information related to the damage occurrence risk includes damage occurrence information and activity information on activities for suppressing the damage occurrence risk.
- the damage occurrence information includes the type of disease and insect damage that has occurred, the date and time of damage occurrence, and the like.
- examples of the types of pests caused by pests include gray mold, leaf mold, powdery mildew, and plague.
- Activities to reduce the risk of damage include activities such as spraying pesticides and other chemicals on crops.
- the activity is not limited to the application of the drug, but also includes an activity other than the application of the drug, such as adjusting the cultivation environment of the crop, for suppressing the risk of causing damage.
- the adjustment of the cultivation environment specifically includes activities such as adjusting the temperature and humidity in the house in house cultivation.
- the pesticide spraying input to the user as an activity for suppressing the damage occurrence risk is described as an example, but information such as machine measurement data that can be obtained without the user may be used.
- the display information generation unit 43 associates the damage occurrence risk, the damage occurrence information, and the activity information with the same time axis so that a display layout is arranged in the display area of the display device 1000. Generate display information. Then, the display information generation unit 43 outputs display information for realizing a display layout in the display area of the display device 1000 to the display device 1000. A specific example of the display layout will be described later.
- the display device 1000 includes a display information acquisition unit 1100, a display unit 1200, and an operation unit 1300.
- the display device 1000 has a function of acquiring display information from the estimation server 40 and displaying the information on the display unit.
- the display device 1000 also has a function that allows the user to make various inputs to the information processing system 1 via the operation unit 1300.
- the display information obtaining unit 1100 has a function of obtaining display information from the estimation server 40 and outputting the display information to the display unit 1200.
- the display unit 1200 has a function of performing a display including a risk of damage occurrence based on the display information.
- the display unit 1200 has a display area, and can display a damage occurrence risk and information related to the damage occurrence risk in the display area.
- the operation unit 1300 has a function that allows a user to perform various inputs to the information processing system 1.
- the user inputs and operates environmental information that is not acquired by the weather server 20 or the cultivation sensor 30, for example, cultivation information.
- the period for estimating the damage occurrence risk may be input by the user.
- the display device 1000 is formed of a device that can visually notify the user of the acquired display information.
- display devices such as CRT (Cathode Ray Tube) display devices, liquid crystal display devices, plasma display devices, EL (electroluminescence) display devices, laser projectors, LED projectors, and lamps.
- the display device 1000 visually displays the display information including the damage occurrence risk obtained by the various processes performed by the estimation server 40 in various formats such as a text, an image, a table, and a graph.
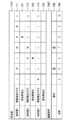
- FIG. 3 is a diagram illustrating an example of a display layout in a display area of the display unit 1200 of the display device 1000.
- the display area is rectangular, and the long side direction is the up-down direction and the short side direction is the left-right direction.
- the display area is rectangular is described as an example.
- the present invention is not limited to such an example, and the display area may have various shapes such as a circular shape and an elliptical shape.
- a main display area 100 in which damage occurrence risk and information related to the damage occurrence risk are displayed, an input display area 200 in which other information is displayed, a pesticide spraying history display area 300, and a pest and disease history display area 400.
- a menu display area 500 capable of shifting the display in the display area to another screen and a page selection display area are arranged vertically.
- a display band 110 to a display band 112 indicating a damage occurrence risk In the main display area 100, a display band 110 to a display band 112 indicating a damage occurrence risk, a display band 120 to a display band 122 indicating a damage occurrence information, a display band 130 indicating activity information for suppressing the damage occurrence risk, are arranged in order from the top in the display area corresponding to the same time axis 140.
- a display band 110 indicating the title of the damage occurrence risk is arranged along the short side direction of the display region, and a lower portion of the display band 110 indicates the damage occurrence risk for each type of pest and disease.
- a display band 111 and a display band 112 are sequentially arranged. At one end (left end) of the display band 111 of the pest 1 is displayed the name of the pest 1 which is the name of the type of the pest.
- the risk display item 111A and the risk display item 111B for displaying the degree are arranged at positions corresponding to the date and time indicated by the time axis 140.
- a display band 112 of the pest 2 is arranged.
- the present invention is not limited to such an example, and may be one type, three or more types, or three or more types.
- a new display band may be displayed below the display band 112 by type.
- the character start position of the type of pest and disease shown in the display band 111 and the display band 112 may be different from the character start position of the title display shown in the display band 110, and may be different from the character start position of the title display shown in the display band 110. It may be started from the right side.
- the risk display item 111A and the risk display item 111B indicating the risk of each day of the damage occurrence risk are represented by a graphic, and the size of the graphic is larger as the damage risk is higher.
- the figure has a circular shape, and the size of the circle is indicated in three stages.
- the circle with the lowest risk of damage occurrence has the smallest diameter
- the circle with the highest risk of damage occurrence has the largest diameter.
- the diameter is shown as a reference for the size of the figure.
- the diameter may be determined as appropriate depending on the figure used.
- the size of the graphic may be determined according to the length of the diameter of a circumscribed circle or an inscribed circle of the graphic.
- the figure not only shows the risk of damage occurrence as the figure is enlarged and reduced, but also, for example, the figure has a plurality of squares, and the area where the squares are painted changes, thereby causing damage.
- the risk may be displayed. Specifically, a plurality of squares are arranged vertically, and the squares to be filled may change according to the risk of damage occurrence. For example, as the risk of occurrence of damage increases, the cells may be painted in order from the bottom in the vertical direction.
- the risk display item 111A has a circular shape, and the inside of the circle is painted black.
- the risk display item 111B has a circular shape, is not painted, and is surrounded by a frame. Such a difference between the risk display item 111A and the risk display item 111B can be determined based on whether the damage occurrence risk is estimated based on a predicted value of the environmental information or based on a past value (including an actually measured value).
- the risk display item 111A indicates the damage occurrence risk estimated using the past value of the environmental information
- the risk display item 111B uses the predicted value of the environmental information, for example, a weather forecast or the like. It shows the estimated risk of damage occurrence.
- the graphic is filled with respect to the past value and the frame of the graphic is displayed with respect to the predicted value.
- the present invention is not limited to such an example, and the display mode may be reversed.
- the risk display item may indicate the damage occurrence risk not only by the size of the graphic, but also by the density of the graphic such as the brightness, saturation, and transparency of the risk display item.
- the brightness of the risk display item may decrease as the damage occurrence risk increases.
- the saturation of the risk display item may decrease as the damage occurrence risk increases.
- the lower the risk of damage occurrence the higher the transparency, the lower the discrimination between the risk display item and the background of the risk display item, and the lower the risk of damage occurrence, the lower the transparency, The discrimination may be increased. In this manner, the damage occurrence risk may be displayed by changing the density at which the figure is painted.
- the risk display item may be not only a figure but also a character. That is, the risk display item may be a display of characters corresponding to the damage occurrence risk. For example, when the damage occurrence risk is in three levels of low, medium, and high, the risk display items may be displayed as characters L, M, and H, respectively.
- a display indicating the title of the damage occurrence information is displayed as a second display.
- a band 120 is arranged.
- a display band 121 for the pest 1 and a display band 122 for the pest 2 which indicate the date and time of occurrence of damage in chronological order for each type of pest, are arranged.
- the type name of the pest and disease are shown, and an occurrence date and time display item 121A for displaying the date and time of the damage occurrence is shown following the type name of the pest and disease.
- the occurrence date and time display item 121A is arranged at a position on the time axis 140 corresponding to the date and time of occurrence of the pest and disease.
- FIG. 3 it is displayed that the pest 1 has occurred on June 17 and that the pest 2 has occurred on June 14.
- damage has occurred in the display band 121 at the date and time when the occurrence date display item 121A is arranged, and no damage has occurred at the date and time when the display of the display item is not arranged. From these displays, for example, the disease and pest 1 that occurred on June 17 is caused by infection around June 10 when the risk of causing the disease and pest 1 is the largest in the display band 111 that displays the damage occurrence risk. It can be considered that damage has occurred.
- the case where the occurrence date and time display item 121A is an asterisk is shown, but the display mode is not limited to this example.
- the display may be different from the risk display item 111A and the risk display item 111B.
- the character start position of the type of pest and disease shown in the display band 121 and the display band 122 may be different from the character start position of the title display shown in the display band 120, and may be different from the character start position of the title display shown in the display band 120. It may be started from the right side.
- a display band 130 indicating an activity for suppressing the risk of causing damage is arranged as a third display.
- a title of an activity for suppressing the risk of damage occurrence is shown, and an activity date / time display item 130A for displaying an activity date / time is shown following the title.
- activity display items are arranged at locations corresponding to June 7 and June 19, respectively.
- a time axis 140 is arranged at the bottom of the main display area 100. Specifically, on the time axis 140, the display band 110, the display band 120, and the display band 130 are arranged in order from the top, and are arranged at the bottom along the display band 130.
- the time axis 140 represents a time change in a short side direction in the display area.
- the time axis 140 is delimited in units of date and time, and indicates from June 4, 2018 to June 21 two days after the current date and time every day.
- the time axis 140 is shown in units of date and time, but may be shown in units of time.
- the time axis 140 can change the displayed time range.
- the time axis from 4 days to 21 days is displayed, and the damage occurrence risk for 18 days is displayed.
- the time axis 140 can be changed by making the displayed time range smaller or larger than 18 days.
- a time before the currently displayed time range can be displayed, or a time after the currently displayed time range can be displayed.
- the user may tap the time axis 140 in the display area and scroll to change the displayed time range by scrolling the displayed range.
- a highlight 150 indicating the position of the current date and time on the time axis 140 is displayed.
- the highlighted display 150 surrounds a display group indicating the same date and time from the display band 111 to the time axis 140 with a rectangular frame. By surrounding it with a rectangular frame, it is easier to grasp the current date and time.
- the figure surrounded by the frame need not be a rectangle.
- the shape may be an ellipse or may be emphasized by hatching or the like without being a rectangular frame.
- a display 160 and a display 170 different from the display of the damage occurrence risk and the like may be displayed above the main display area 100.
- the display 160 may be, for example, a display that displays a title that includes the entire information displayed in the display area. For example, in FIG. 3, since the presentation of the damage occurrence risk is the main display, the display 160 indicates “damage occurrence risk”.
- the display 170 is a display in which the display standard of the time axis 140 can be selected and the displayed time range can be changed.
- June 19, 2018 is displayed on the display 170
- the display band 110 to the display band 130 and the time axis 140 are based on June 19, 15 days before the reference, and The last two days are displayed.
- the date and time of the displayed time axis 140 can be changed by the user tapping the display 170 or the like and selecting the display reference of the time axis 140.
- the reason that the predicted value after the reference date is shown only for about two days is due to the accuracy of the predicted value of the environmental information, and the reliability of the predicted value two days after the current date and time is reduced.
- the range is set to about two days from the current date and time.
- the estimated damage occurrence risk and the time range in which the information related to the damage occurrence risk is presented may be changed based on the accuracy of the predicted value.
- an input display area 200 that allows a user to input activity information and damage occurrence information and includes an input display 210 and an input display 220 is arranged.
- an input display 210 for inputting a pesticide application record of a pesticide application history described later is arranged on the leftmost side, and is arranged rightward of the input display 210 to input a record of a pest and insect occurrence history described later.
- Input display 220 is arranged.
- an example in which two types of input displays are presented has been described. However, the present invention is not limited to such an example, and three or more types of new input displays are input according to information that needs to be input by the user. Following the display 220, they may be sequentially arranged on the right side.
- a pesticide spraying history display area 300 for performing a detailed display of the display band 130 indicating the spraying date and time of the pesticide spraying is arranged.
- a title display 310 indicating the activity content
- an activity date display 311 and an activity type display 312 can be displayed.
- the title display 310 indicates the pesticide spraying record
- the activity date display 311 indicates the pesticide spraying date
- the activity type display 312 indicates the type of the sprayed pesticide. ing.
- an activity day display 311 is shown at the leftmost position in a direction orthogonal to the time axis 140 of the main display area 100.
- the activity day display 311 may display activity days in a wider range than the time range shown on the time axis 140.
- June 4 to 21 are displayed, and June 7 and June 19 are shown as pesticide application days.
- the spraying on June 19 is shown at the top from the top, and the date and time when the pesticide was sprayed is traced back to the date and time when the pesticide was sprayed.
- One day is displayed.
- the four most recent pesticide application days are shown, but the number is not limited to four and may be determined as appropriate.
- the type display 312 of the applied agricultural chemical is shown along with the activity date display 311 in the direction in which the time axis 140 is arranged. That is, in the type display 312, the types of the pesticides sprayed on the activity day display 311 are displayed side by side to the right of the activity day display 311.
- FIG. 3 shows that pesticide 1 was sprayed on June 19, pesticide 2 on June 7, pesticide 3 on May 4, and pesticide 2 on April 1.
- pesticides include, for example, potash green, M7: Bergutto flowable, 17, 12: Justmeat granule wettable powder, and the like.
- the type of the pesticide to be displayed may be any name that allows the user to identify the pesticide, such as the name of the main component of the pesticide, the product name of the sprayed pesticide, and the like.
- a pest and disease history display area 400 that displays details from the display band 120 indicating the occurrence of damage to the display band 122 is arranged.
- a title display 410 indicating the occurrence of damage
- a damage occurrence date display 411 indicating the date and time when the pest damage occurs
- the type display 412 indicates the damage to the crop. The type is displayed.
- a damage occurrence date display 411 is shown at the leftmost position in a direction orthogonal to the direction in which the time axis 140 of the main display area 100 is arranged.
- the damage occurrence date display 411 may display a damage occurrence date in a range wider than the time range indicated on the time axis 140.
- FIG. 3 on the time axis 140 of the main display area 100, June 4 to 21 are displayed, and June 14 and June 17 are shown as damage occurrence dates.
- the damage occurrence on June 17 is shown at the top from the top, and the dates and times when the damage occurred are June 14, January 29, and November 3, 2017, which are the dates and times when the damage occurred. Is shown.
- the last four damage occurrence dates are shown, but the number is not limited to four and may be determined as appropriate.
- a pest and disease type display 412 is shown alongside the damage occurrence date display 411 in the direction in which the time axis 140 is arranged. That is, in the type display 412, the types of the pests displayed on the damage occurrence date display 411 are displayed side by side to the right of the damage occurrence date display 411.
- FIG. 3 shows that the pest 1 on June 17, the pest 2 on June 14, the pest 1 on January 29, and the pest 4 on November 3, 2017 are displayed.
- the main display area 100, the input display area 200, the pesticide application history display area 300, and the pest and disease history display area 400 in the display area are arranged in order from the upper part of the display area to the lower part.
- a menu display area 500 and a page selection display area 600 that allow selection of presenting other display information may be further arranged.
- the display unit 1200 of the display device 1000 may have a function of presenting various information in addition to the above-described display information, and may be capable of selecting display contents in order to appropriately display various information.
- the menu display area 500 may display a display that allows selection to return to a menu display in which various information is summarized as a list.
- the screen can be changed to a menu display screen by, for example, tapping the menu display area 500 by a user or the like.
- the display displayed in the display area can be shifted to the previous screen. For example, a selection is made to display an overview display of a house including environmental information and the like obtained by the cultivation sensor 30.
- FIG. 4 is a diagram showing an example of a modification of the display from the display band 110 to the time axis 140 in the main display area 100 of the display according to the embodiment.
- the display area shown in FIG. 4 is different from the above embodiment in that display items indicating the risk of damage occurrence and display items indicating the occurrence of pests are arranged for each pest, and the display band indicating the application of pesticides is one display for all pests. It corresponds with the display of the belt. Since pesticide spraying can show an effect on each pest, by displaying it in one display band, the display can be presented in a manner that is easy for the user to understand while simplifying the display.
- a display band indicating the damage occurrence risk and the pest and disease occurrence is displayed in each pest and disease item.
- a display band 711 indicating the risk of occurrence of damage and a display band 721 indicating the occurrence of pest are arranged vertically.
- a display band 712 indicating the risk of the occurrence of the pest 2 and a display band 722 indicating the occurrence of the pest are arranged vertically, and below the pest 2, the pest 3 is displayed.
- a display band 713 indicating a damage occurrence risk and a display band 723 indicating a pest occurrence are arranged vertically.
- the risk of damage occurrence is indicated to the user in three stages in terms of characters.
- the letter notation of L, M, and H is displayed, the letter notation of low risk indicates L, the letter notation of high risk indicates H, and the low risk level and the high risk level are displayed.
- the middle-level letter notation in between indicates M.
- a display band 730T indicating the title display of pesticide spraying is shown in the display area further below the damage occurrence risk and the pest damage occurrence of each pest, and a display indicating the pesticide spraying date and time is displayed below the display band 730T.
- a band 730 is arranged.
- a time axis 740 corresponding to the display bands 710T to 730 is arranged along the display band 730.
- the time axis 740 indicates the date and time from the left, and the time axis 740 indicates 4 days to 10 days.
- pesticide spraying was performed on the 5th, the risk of damage to pests 1 was medium level M, the risk of damage to pests 2 was low L, and the risk of damage to pests 3 was low L. It can be seen that it is.
- the damage occurrence risk for each pest and the pest occurrence are shown, and the display of the pesticide spraying corresponding to all the pests is one, and the time axis corresponding to the damage occurrence risk, the pest occurrence and the pesticide spraying is shown. Is displayed, when the types of pests increase, the risk of damage occurrence and information related to the risk of damage damage can be presented to the user more easily.
Landscapes
- Life Sciences & Earth Sciences (AREA)
- Biodiversity & Conservation Biology (AREA)
- Botany (AREA)
- Ecology (AREA)
- Forests & Forestry (AREA)
- Environmental Sciences (AREA)
- Business, Economics & Management (AREA)
- Engineering & Computer Science (AREA)
- Computing Systems (AREA)
- Emergency Management (AREA)
- Physics & Mathematics (AREA)
- General Physics & Mathematics (AREA)
- Catching Or Destruction (AREA)
Abstract
ユーザに対して、より分かりやすく被害発生リスクと該被害発生リスクに関連する情報の呈示を行う。 注目事象に起因する作物への被害が発生する可能性を表し、前記作物の周囲の環境に関する環境情報に基づいて推定された被害発生リスクを示す第1表示と、前記被害の発生に関する被害発生情報を示す第2表示と、前記被害発生リスクを抑制する活動に関する活動情報を示す第3表示と、が同一の時間軸に対応して、表示領域内で並んで配置される、表示装置が提供される。
Description
本発明は、表示装置に関する。
近年、情報通信技術を用いて作物を病虫害から守る技術が研究開発されている。具体的には、センサを用いて作物の環境を観測し、センサから得られる観測結果を用いて病虫害の発生リスクをユーザに呈示する技術がある。病虫害は概して、作物の収穫量および品質を低下させるが、農薬散布により作物被害を抑制することができる。そのため、ユーザは、呈示された病虫害の発生リスクに基づいて農薬を散布することにより、病虫害による作物被害を効果的に低減することができる。
農薬を使用した農作業を支援するための技術については、例えば特許文献1および特許文献2に開示されている。具体的には、特許文献1には、作物の収穫量を最大化するための農薬散布計画を算出するための技術が開示されている。また、特許文献2には、「収穫前日数」を考慮して農薬の散布日を算出するための技術が開示されている。
しかしながら、作物への病害虫の感染のような注目事象に起因する被害発生リスクを推定するために、薬剤の使用により得られた薬剤の効果を考慮するシステムは知られておらず、当然ながら被害発生リスクと該被害発生リスクに関連する情報をユーザに対して分かりやすく呈示する技術は開示されていなかった。そこで、本発明は、上記問題に鑑みてなされたものであり、本発明の目的とするところは、ユーザに対して、より分かりやすく被害発生リスクと該被害発生リスクに関連する情報の呈示を行うことが可能な、新規かつ改良された表示装置を提供することにある。
上記課題を解決するために、本発明のある観点によれば、注目事象に起因する作物への被害が発生する可能性を表し、前記作物の周囲の環境に関する環境情報に基づいて推定された被害発生リスクを示す第1表示と、前記被害の発生に関する被害発生情報を示す第2表示と、前記被害発生リスクを抑制する活動に関する活動情報を示す第3表示と、が同一の時間軸に対応して、表示領域内で並んで配置される、表示装置が提供される。
上記構成により、被害発生リスクと、被害発生に関する情報と、被害発生リスクを抑制する活動に関する情報とが、同一時間軸に対応して並んで配置されることにより、時系列で各情報を一目で確認することができる。
以上説明したように本発明によれば、ユーザに対して、より分かりやすく被害発生リスクと該被害発生リスクに関連する情報の呈示を行うことができる。
以下に添付図面を参照しながら、本発明の好適な実施の形態について詳細に説明する。なお、本明細書及び図面において、実質的に同一の機能構成を有する構成要素については、同一の符号を付することにより重複説明を省略する。
<1.技術概要>
まず、図1を参照して、本発明が適用されたシステムの全体を説明する。図1は、本発明が適用された情報処理システム1の全体を示した図である。本発明が適用された情報処理システム1は、注目事象を病害虫の作物への感染として、該注目事象に起因する被害発生のリスクを推定し、被害発生リスクおよび該被害発生リスクの関連情報を呈示する。
まず、図1を参照して、本発明が適用されたシステムの全体を説明する。図1は、本発明が適用された情報処理システム1の全体を示した図である。本発明が適用された情報処理システム1は、注目事象を病害虫の作物への感染として、該注目事象に起因する被害発生のリスクを推定し、被害発生リスクおよび該被害発生リスクの関連情報を呈示する。
被害発生リスクとは、病害虫に感染するもしくは感染した可能性と、感染が発生した作物に被害が発生する可能性と、を包含したリスクを言う。病害虫に感染とは、病害に作物に感染すること、または、害虫においては作物に寄生することを示す。作物に被害が発生するとは、作物の病害への感染が発生し、感染した後に潜伏期間を終えることで作物へ病害の症状が発症することを言う。なお、虫害においては、虫害の潜伏期間とは、虫が産卵し、卵から幼虫が孵り、作物を食する等して被害の発生が認知されるまでの期間を言い、例えば、虫害は、作物が虫に食べられるのを農家が確認することで認知される。
本発明の被害発生リスクは、過去の感染または未来の感染の発生可能性と、過去に散布された農薬またはこれから散布され得る農薬による農薬の効果と、を踏まえて、ユーザが指定する期間内で作物に被害が発生する可能性が推定される。
本発明の情報処理システム1は、推定された被害発生リスクと該被害発生リスクに関連する情報をユーザに分かりやすく呈示する。
具体的には、情報処理システム1は、気象サーバ20と、栽培センサ30と、推定サーバ40と、表示装置1000と、を備える。情報処理システム1は、気象サーバ20と、栽培センサ30と、表示装置1000等とを用いて取得した情報を、推定サーバ40にて処理することにより、被害発生リスクを推定し、推定された被害発生リスクと、被害発生リスクに関連する情報と、を表示装置1000にて呈示する。
<2.構成>
図2を参照して、情報処理システム1の機能構成を説明する。情報処理システム1は、上述したように、気象サーバ20と、栽培センサ30と、推定サーバ40と、表示装置1000と、を備える。
図2を参照して、情報処理システム1の機能構成を説明する。情報処理システム1は、上述したように、気象サーバ20と、栽培センサ30と、推定サーバ40と、表示装置1000と、を備える。
(気象サーバ)
気象サーバ20は、推定サーバ40にて使用される、作物の栽培を行う地域の気象に関する環境情報を出力する機能を有する。気象サーバ20が出力する環境情報としては、気温、湿度、日射量、雨量等が挙げられる。気象サーバ20によって出力される環境情報は、過去の気象履歴等のような過去値でもよく、現在値であってもよい。また、環境情報は、気象予報などの予測値であってもよい。
気象サーバ20は、推定サーバ40にて使用される、作物の栽培を行う地域の気象に関する環境情報を出力する機能を有する。気象サーバ20が出力する環境情報としては、気温、湿度、日射量、雨量等が挙げられる。気象サーバ20によって出力される環境情報は、過去の気象履歴等のような過去値でもよく、現在値であってもよい。また、環境情報は、気象予報などの予測値であってもよい。
(栽培センサ)
栽培センサ30は、推定サーバ40にて使用される、作物が栽培される空間の環境情報を出力する機能を有する。作物が栽培される空間とは、作物が栽培されている場所を囲む空間であってよく、例えば、ビニールハウス等の作物栽培を行う農業施設であってよい。作物が栽培されている場所であれば、囲まれていなくともよく、畑または田んぼ等の解放された空間であってもよい。環境情報としては、作物の周囲環境の温度、湿度、日射量、二酸化炭素濃度、作物が栽培される土壌の水分率などが挙げられる。栽培センサ30にて取得される環境情報は、現在値のみならず、予測値および過去値も含まれる。
栽培センサ30は、推定サーバ40にて使用される、作物が栽培される空間の環境情報を出力する機能を有する。作物が栽培される空間とは、作物が栽培されている場所を囲む空間であってよく、例えば、ビニールハウス等の作物栽培を行う農業施設であってよい。作物が栽培されている場所であれば、囲まれていなくともよく、畑または田んぼ等の解放された空間であってもよい。環境情報としては、作物の周囲環境の温度、湿度、日射量、二酸化炭素濃度、作物が栽培される土壌の水分率などが挙げられる。栽培センサ30にて取得される環境情報は、現在値のみならず、予測値および過去値も含まれる。
(推定サーバ)
推定サーバ40は、取得部41と、推定部42と、表示情報生成部43と、を備える。推定サーバ40は、取得部41にて取得した環境情報および薬剤情報に基づいて、ユーザが指定する期間内の被害発生リスクを推定し、該被害発生リスクを含む表示情報を生成する機能を有する。
推定サーバ40は、取得部41と、推定部42と、表示情報生成部43と、を備える。推定サーバ40は、取得部41にて取得した環境情報および薬剤情報に基づいて、ユーザが指定する期間内の被害発生リスクを推定し、該被害発生リスクを含む表示情報を生成する機能を有する。
((取得部))
取得部41は、被害発生リスクの推定に使用される環境情報および薬剤情報等を取得する機能を有する。取得部41は、気象サーバ20または栽培センサ30から環境情報を取得する。また、取得部41は、後述する表示装置1000を介して、気象サーバ20または栽培センサ30から得られないような栽培情報を取得してもよい。栽培情報は、環境情報と同様に、被害発生リスクを推定する際に使用されてもよい。栽培情報とは、例えば、作物の品種、作物の栽培場所の標高、土壌の種類、土壌の栄養状態、作物の播種日時、定植日時、作物の葉の摘葉の状況、農薬の散布履歴、農薬の残効状況、除草の状況、樹勢の状況、作物の生育ステージ等の情報を含む。
取得部41は、被害発生リスクの推定に使用される環境情報および薬剤情報等を取得する機能を有する。取得部41は、気象サーバ20または栽培センサ30から環境情報を取得する。また、取得部41は、後述する表示装置1000を介して、気象サーバ20または栽培センサ30から得られないような栽培情報を取得してもよい。栽培情報は、環境情報と同様に、被害発生リスクを推定する際に使用されてもよい。栽培情報とは、例えば、作物の品種、作物の栽培場所の標高、土壌の種類、土壌の栄養状態、作物の播種日時、定植日時、作物の葉の摘葉の状況、農薬の散布履歴、農薬の残効状況、除草の状況、樹勢の状況、作物の生育ステージ等の情報を含む。
上記薬剤情報は、被害発生リスク推定の際に、農薬効果を加味するために使用され得る。薬剤情報は、文献または調査等により取得されてもよい。薬剤情報とは、薬剤の使用により得られる薬剤の経時的な効果を示す情報を含む。また、薬剤情報は、作物に対する病害虫への予防効果または治療効果等を示す情報であってよい。
((推定部))
推定部42は、取得部41にて取得した環境情報および薬剤情報に基づいて、作物への被害発生リスクを推定する。推定部42は、例えば、作物の病虫害発生実績と、該作物への農薬散布履歴、および該作物に病虫害が発生するまでの環境情報等を使用して、被害発生リスクモデルを作成する。この被害発生リスクモデルに対して、推定部42は、新たに被害発生リスクを推定したい作物への農薬散布情報、該作物の環境情報等を入力することで、該作物の被害発生リスクを推定する。
推定部42は、取得部41にて取得した環境情報および薬剤情報に基づいて、作物への被害発生リスクを推定する。推定部42は、例えば、作物の病虫害発生実績と、該作物への農薬散布履歴、および該作物に病虫害が発生するまでの環境情報等を使用して、被害発生リスクモデルを作成する。この被害発生リスクモデルに対して、推定部42は、新たに被害発生リスクを推定したい作物への農薬散布情報、該作物の環境情報等を入力することで、該作物の被害発生リスクを推定する。
((表示情報生成部))
表示情報生成部43は、推定部42にて推定した被害発生リスクと該被害発生リスクに関連する情報の呈示を表示装置1000にて実現するための表示情報を生成する機能を有する。被害発生リスクに関連する情報は、被害発生情報および被害発生リスクを抑制する活動に関する活動情報を含む。被害発生情報は、発生した病虫害の種類、被害発生日時等が挙げられる。例えば、病害虫が引き起こす病虫害の種類として、灰色かび病、葉かび病、うどんこ病、疫病等を挙げることができる。
表示情報生成部43は、推定部42にて推定した被害発生リスクと該被害発生リスクに関連する情報の呈示を表示装置1000にて実現するための表示情報を生成する機能を有する。被害発生リスクに関連する情報は、被害発生情報および被害発生リスクを抑制する活動に関する活動情報を含む。被害発生情報は、発生した病虫害の種類、被害発生日時等が挙げられる。例えば、病害虫が引き起こす病虫害の種類として、灰色かび病、葉かび病、うどんこ病、疫病等を挙げることができる。
被害発生リスクを抑制する活動とは、作物に対する農薬等の薬剤の散布活動を含む。また、該活動とは、薬剤の散布に限らず、作物の栽培環境を調整する等、薬剤の散布以外で、被害発生リスクを抑制するために行われる活動を含む。栽培環境の調整とは、具体的には、ハウス栽培においてハウス内の温度、湿度などを調整する等の活動を含む。本実施形態では、被害発生リスクを抑制する活動としてユーザに入力される農薬散布を例に挙げたが、機械測定データ等、ユーザを介さずに入手できる情報であってもよい。
表示情報生成部43は、被害発生リスクと、被害発生情報と、活動情報とを同一の時間軸に対応させて、表示装置1000の表示領域内で並んで配置される表示レイアウトとなるように、表示情報を生成する。そして、表示情報生成部43は、表示装置1000の表示領域内で表示レイアウトを実現するための表示情報を、表示装置1000へ出力する。なお、表示レイアウトの具体例は後述する。
(表示装置)
表示装置1000は、表示情報取得部1100と、表示部1200と、操作部1300と、を備える。表示装置1000は、推定サーバ40から表示情報を取得して、表示部にて表示を行う機能を有する。また、表示装置1000は、ユーザが、操作部1300を介して、情報処理システム1に対して各種入力が可能な機能も有している。
表示装置1000は、表示情報取得部1100と、表示部1200と、操作部1300と、を備える。表示装置1000は、推定サーバ40から表示情報を取得して、表示部にて表示を行う機能を有する。また、表示装置1000は、ユーザが、操作部1300を介して、情報処理システム1に対して各種入力が可能な機能も有している。
((表示情報取得部)))
表示情報取得部1100は、推定サーバ40から表示情報を取得し、表示部1200に出力する機能を有する。
表示情報取得部1100は、推定サーバ40から表示情報を取得し、表示部1200に出力する機能を有する。
((表示部))
表示部1200は、表示情報に基づいて、被害発生リスクを含む表示を行う機能を有する。表示部1200は、表示領域を有し、表示領域内に被害発生リスクと該被害発生リスクに関連する情報を表示可能である。
表示部1200は、表示情報に基づいて、被害発生リスクを含む表示を行う機能を有する。表示部1200は、表示領域を有し、表示領域内に被害発生リスクと該被害発生リスクに関連する情報を表示可能である。
((操作部))
操作部1300は、ユーザが情報処理システム1に対して各種入力を行うことを可能にする機能を有する。例えば、操作部1300では、気象サーバ20または栽培センサ30にて取得されない環境情報、例えば、栽培情報等がユーザにより入力操作される。また、例えば、被害発生リスクを推定する期間がユーザにより入力操作されてもよい。
操作部1300は、ユーザが情報処理システム1に対して各種入力を行うことを可能にする機能を有する。例えば、操作部1300では、気象サーバ20または栽培センサ30にて取得されない環境情報、例えば、栽培情報等がユーザにより入力操作される。また、例えば、被害発生リスクを推定する期間がユーザにより入力操作されてもよい。
具体的に、表示装置1000は、取得した表示情報をユーザに対して視覚的に通知することが可能な装置で形成される。このような装置として、CRT(Cathode Ray Tube)ディスプレイ装置、液晶ディスプレイ装置、プラズマディスプレイ装置、EL (electroluminescence)ディスプレイ装置、レーザープロジェクタ、LEDプロジェクタ及びランプ等の表示装置がある。表示装置1000は、推定サーバ40が行った各種処理により得られた被害発生リスクを含む表示情報を、テキスト、イメージ、表、グラフ等、様々な形式で視覚的に表示する。
<3.実施例(表示レイアウト)>
図3を参照して、表示装置1000において表示レイアウトの表示を実施した一例を説明する。図3は、表示装置1000の表示部1200の表示領域内における表示レイアウトの一例を示した図である。本実施例では、表示領域が矩形であり、長辺方向を上下方向、短辺方向を左右方向とする。なお、本実施例では表示領域が矩形である場合を一例としたが、係る例に限定されず、表示領域は、円状、楕円形状等多様な形状であってよい。
図3を参照して、表示装置1000において表示レイアウトの表示を実施した一例を説明する。図3は、表示装置1000の表示部1200の表示領域内における表示レイアウトの一例を示した図である。本実施例では、表示領域が矩形であり、長辺方向を上下方向、短辺方向を左右方向とする。なお、本実施例では表示領域が矩形である場合を一例としたが、係る例に限定されず、表示領域は、円状、楕円形状等多様な形状であってよい。
表示領域内では、被害発生リスクと被害発生リスクに関連する情報が表示されるメイン表示領域100と、その他の情報が表示される入力表示領域200、農薬散布履歴表示領域300および病虫害履歴表示領域400、とが、表示領域の上部から順に配置されている。また、表示領域内のメイン表示領域100のさらに上部には、表示領域内の表示を別画面に遷移させることが可能なメニュー表示領域500とページ選択表示領域が上下に並んで配置されている。
(3.1.メイン表示領域)
メイン表示領域100には、被害発生リスクを示す表示帯110から表示帯112と、被害発生情報を示す表示帯120から表示帯122と、被害発生リスクを抑制する活動情報を示す表示帯130と、が同一の時間軸140に対応して、表示領域内で上から順番に並んで配置される。
メイン表示領域100には、被害発生リスクを示す表示帯110から表示帯112と、被害発生情報を示す表示帯120から表示帯122と、被害発生リスクを抑制する活動情報を示す表示帯130と、が同一の時間軸140に対応して、表示領域内で上から順番に並んで配置される。
(3.1.1.第1表示)
メイン表示領域100には、第1表示として、被害発生リスクの題目を示す表示帯110が表示領域の短辺方向にかけて配置され、表示帯110の下部には、病虫害の種類別に被害発生リスクを示す表示帯111および表示帯112が順次配置されている。病虫害1の表示帯111の一側端部側(左端部)には、病虫害の種類名である病虫害1との表示がされ、該病虫害の種類名に続いて、他端にかけて、被害発生リスクの度合いを表示するリスク表示アイテム111Aおよびリスク表示アイテム111Bが時間軸140の示す日時に対応する箇所に配置されている。病虫害2に関しても病虫害1と同様に、病虫害2の表示帯112が配置されている。なお、本実施例では、病虫害の種類が2種類である場合を例示したが、係る例に限定されず、1種類でもよく、3種類以上であってもよく3種類以上の複数種であれば、表示帯112の下部にさらに新たな表示帯が種類別に表示されてもよい。
メイン表示領域100には、第1表示として、被害発生リスクの題目を示す表示帯110が表示領域の短辺方向にかけて配置され、表示帯110の下部には、病虫害の種類別に被害発生リスクを示す表示帯111および表示帯112が順次配置されている。病虫害1の表示帯111の一側端部側(左端部)には、病虫害の種類名である病虫害1との表示がされ、該病虫害の種類名に続いて、他端にかけて、被害発生リスクの度合いを表示するリスク表示アイテム111Aおよびリスク表示アイテム111Bが時間軸140の示す日時に対応する箇所に配置されている。病虫害2に関しても病虫害1と同様に、病虫害2の表示帯112が配置されている。なお、本実施例では、病虫害の種類が2種類である場合を例示したが、係る例に限定されず、1種類でもよく、3種類以上であってもよく3種類以上の複数種であれば、表示帯112の下部にさらに新たな表示帯が種類別に表示されてもよい。
表示帯111および表示帯112に示される病虫害の種類の文字開始位置は、表示帯110に示される題目表示の文字開始位置と異なってよく、表示帯110に示される題目表示の文字開始位置よりも右側から開始されてもよい。このように配置されることで、各病虫害の被害発生リスクの表示が、被害発生リスクの題目表示に包含されていることが一目でわかる。
被害発生リスクの各日のリスクを示すリスク表示アイテム111Aおよびリスク表示アイテム111Bは、図形で表され、被害発生リスクが高いほど図形の大きさが大きい。本実施例では、図形は円形状であり、円の大きさが3段階で示されている。最も被害発生のリスクが低いとされる円の直径が最も小さく、最も被害発生のリスクが高いとされる円の直径が最も大きい。本実施例では、図形が円であるために、例えば図形の大きさの基準として直径を示したが、使用される図形によって適宜決定されてよい。例えば、図形の大きさは、該図形の外接円または内接円の直径の長さに応じて図形の大きさが決められてもよい。
また、該図形は、被害発生リスクを該図形が拡大および縮小して示すだけでなく、例えば、該図形が複数のマス目を有し、マス目が塗りつぶされる面積が変化することで、被害発生リスクの表示を行ってもよい。具体的には、複数のマス目が縦に並んでおり、被害発生リスクに応じて、塗りつぶされるマス目が変化してよい。例えば、被害発生リスクが高まるほど、マス目が縦方向の下から順に塗りつぶされる等してもよい。
リスク表示アイテム111Aは、円形状であり、円の内部を黒で塗りつぶされている。一方で、リスク表示アイテム111Bは、円形状であり、塗りつぶされることはなく、円が枠で囲まれている。このようなリスク表示アイテム111Aおよびリスク表示アイテム111Bの差異は、被害発生リスクが環境情報の予測値による推定か、または過去値(実測値を含む)による推定かによって決められ得る。
図3においては、リスク表示アイテム111Aは、環境情報の過去値を使用して推定された被害発生リスクを示しており、リスク表示アイテム111Bは、環境情報の予測値、例えば、気象予報等を使用して推定された被害発生リスクを示している。なお、本実施例では、過去値に対して、図形の塗りつぶし、予測値に対して図形の枠表示を行ったが、係る例に限定されず、表示態様は、これらで反転されてもよい。
本実施形態では、リスク表示アイテムの一例の図形として円形を挙げて説明した。リスク表示アイテムは、図形の大きさだけではなく、リスク表示アイテムの明度、彩度、透過度等の図形の濃度により被害発生リスクを示してもよい。具体的には、被害発生リスクが高くなるほど、リスク表示アイテムの明度が低下してもよい。また、被害発生リスクが高くなるほど、リスク表示アイテムの彩度が低下してもよい。さらにまた、被害発生リスクが低くなるほど、透過度を上昇させて、リスク表示アイテムと該リスク表示アイテムの背景との識別性を低下させ、被害発生リスクが高くなるほど、透過度を低下させて、該識別性を上昇させてもよい。このように、図形を塗りつぶす濃度を変化させて被害発生リスクを表示してもよい。
他には、リスク表示アイテムは、図形だけではなく、文字であってもよい。つまり、リスク表示アイテムは被害発生リスクに応じた文字の表示であってもよい。例えば、被害発生リスクが低、中、高の3段階である場合には、リスク表示アイテムは、それぞれL、M、Hで文字表示されてもよい。
(3.1.2.第2表示)
次に、表示帯110と表示帯110の詳細(病虫害の種類別の被害発生リスク)を表示する表示帯111および表示帯112の下部には、第2表示として、被害発生情報の題目を示す表示帯120が配置されている。表示帯120の下部には、表示帯110と同様に、病虫害の種類別に時系列で被害発生日時を示す病虫害1の表示帯121および病虫害2の表示帯122が配置されている。表示帯121の左端部には、病虫害の種類名が示され、該病虫害の種類名に続いて、被害発生の日時を表示する発生日時表示アイテム121Aが示されている。
次に、表示帯110と表示帯110の詳細(病虫害の種類別の被害発生リスク)を表示する表示帯111および表示帯112の下部には、第2表示として、被害発生情報の題目を示す表示帯120が配置されている。表示帯120の下部には、表示帯110と同様に、病虫害の種類別に時系列で被害発生日時を示す病虫害1の表示帯121および病虫害2の表示帯122が配置されている。表示帯121の左端部には、病虫害の種類名が示され、該病虫害の種類名に続いて、被害発生の日時を表示する発生日時表示アイテム121Aが示されている。
発生日時表示アイテム121Aは、時間軸140上で病虫害発生日時に対応する位置に配置される。図3では、6月17日に病虫害1が発生したことが表示され、6月14日に病虫害2が発生したことが表示されている。この表示により、表示帯121において、発生日時表示アイテム121Aが配置される日時では、被害が発生し、表示アイテムの表示が配置されない日時では、被害が発生していないことが分かる。これらの表示から、例えば、6月17日に発生した病虫害1は、被害発生リスクを表示する表示帯111において病虫害1の被害発生リスクが最大となっている6月10日あたりの感染に起因する被害発生であると考えることができる。なお、本実施例では、発生日時表示アイテム121Aがアスタリスクである場合を示しているが、表示態様はかかる例に限定されない。例えば、リスク表示アイテム111Aおよびリスク表示アイテム111Bとは異なる表示であればよい。
表示帯121および表示帯122に示される病虫害の種類の文字開始位置は、表示帯120に示される題目表示の文字開始位置と異なってよく、表示帯120に示される題目表示の文字開始位置よりも右側から開始されてもよい。このように配置されることで、表示帯110と同様に、各病虫害の被害発生リスクの表示が、被害発生リスクの題目表示で包含されていることが一目でわかる。
(3.1.3.第3表示)
次に、表示帯120と表示帯120の詳細を表示する表示帯121および表示帯122との下部には、第3表示として、被害発生リスクを抑制する活動を示す表示帯130が配置されている。表示帯130の左端部には、被害発生リスクを抑制する活動の題目が示され、該題目に続いて、活動日時を表示する活動日時表示アイテム130Aが示されている。本実施例では、被害発生リスクを抑制する活動として作物に対する農薬散布を挙げ、農薬が散布された日時では、活動日時表示アイテム130Aが示されている。具体的には、6月7日と6月19日に該当する場所に活動表示アイテムが配置されている。
次に、表示帯120と表示帯120の詳細を表示する表示帯121および表示帯122との下部には、第3表示として、被害発生リスクを抑制する活動を示す表示帯130が配置されている。表示帯130の左端部には、被害発生リスクを抑制する活動の題目が示され、該題目に続いて、活動日時を表示する活動日時表示アイテム130Aが示されている。本実施例では、被害発生リスクを抑制する活動として作物に対する農薬散布を挙げ、農薬が散布された日時では、活動日時表示アイテム130Aが示されている。具体的には、6月7日と6月19日に該当する場所に活動表示アイテムが配置されている。
(3.1.4.時間軸)
メイン表示領域100の最下部には、時間軸140が配置されている。具体的に、時間軸140は、表示帯110と表示帯120と表示帯130とが上部から順に並んで配置され、表示帯130に沿って最下部に配置されている。時間軸140は、表示領域内の短辺方向に時間変化を表す。本実施例では、時間軸140は、日時単位で区切られており、2018年6月4日から1日毎に、現在日時の2日後の6月21日までを示している。なお、本実施例では、時間軸140が日時単位で示されているが、時間単位で示されてもよい。
メイン表示領域100の最下部には、時間軸140が配置されている。具体的に、時間軸140は、表示帯110と表示帯120と表示帯130とが上部から順に並んで配置され、表示帯130に沿って最下部に配置されている。時間軸140は、表示領域内の短辺方向に時間変化を表す。本実施例では、時間軸140は、日時単位で区切られており、2018年6月4日から1日毎に、現在日時の2日後の6月21日までを示している。なお、本実施例では、時間軸140が日時単位で示されているが、時間単位で示されてもよい。
時間軸140は、表示される時間範囲を変更可能である。図3では、時間軸として4日から21日までが表示されており、18日分の被害発生リスクが表示されている。時間軸140は、表示される時間範囲を18日分よりも小さくしたり、大きくしたりして変更可能である。また、18日分の時間範囲を維持したままで、現在表示される時間範囲よりも前の時間を表示したり、現在表示される時間範囲よりも後の時間を表示したりすることができる。例えば、ユーザが表示領域内で時間軸140をタップして、スクロールすることで、表示される範囲がスクロールされることにより、表示される時間範囲が変化してもよい。
さらに時間軸140において、現在の日時が時間軸140のどの位置であるかを示す強調表示150が表示される。強調表示150は、表示帯111から時間軸140までの同一日時を示す表示群を矩形の枠で囲んでいる。矩形枠で囲むことにより、現在の日時をより把握しやすい。なお、枠で囲む図形は矩形でなくてもよい。例えば、楕円であってもよく、矩形の枠でなくともハッチングなどにより強調されてもよい。
メイン表示領域100の上部には、被害発生リスクの表示等とは異なる表示160および表示170が表示されてもよい。表示160は、例えば、表示領域内で表示する情報の全体を包含するような題目を表示する表示であってよい。例えば、図3においては、被害発生リスクの呈示が主な表示であるため、表示160では被害発生リスクと表示されている。
表示170は、時間軸140の表示基準を選択可能で、表示される時間範囲を変化させることができる表示である。図3では、表示170にて、2018年の6月19日が表示されており、表示帯110から表示帯130および時間軸140では、6月19日を基準に、基準前15日間と、基準後2日が表示されている。例えば、ユーザが表示170をタップ等して、時間軸140の表示基準を選択することにより、表示される時間軸140の日時が変更され得る。なお、基準日以降の予測値が2日程度しか示されていないのは、環境情報の予測値の精度によるものであり、現在日時から2日後の予測値の信頼性が低下することから、表示される範囲を現在日時から2日程度としている。このように、推定される被害発生リスクと該被害発生リスクに関連する情報が呈示される時間範囲は、予測値の精度に基づいて変更されてよい。
(3.2.入力表示領域)
メイン表示領域100の下部には、活動情報および被害発生情報に関してユーザの入力を可能とし、入力表示210および入力表示220を含む入力表示領域200が配置される。入力表示領域200では、後述する農薬散布履歴の農薬散布記録を入力するための入力表示210が最も左側に配置され、入力表示210の右方向に並んで、後述する病虫害発生履歴の記録を入力するための入力表示220が配置される。なお、本実施例では、入力表示が2種類呈示される例を示したが、係る例に限定されず、ユーザにより入力が必要な情報に応じて、3種類以上の新たな入力表示が、入力表示220に続いて右側に順次配置されてもよい。
メイン表示領域100の下部には、活動情報および被害発生情報に関してユーザの入力を可能とし、入力表示210および入力表示220を含む入力表示領域200が配置される。入力表示領域200では、後述する農薬散布履歴の農薬散布記録を入力するための入力表示210が最も左側に配置され、入力表示210の右方向に並んで、後述する病虫害発生履歴の記録を入力するための入力表示220が配置される。なお、本実施例では、入力表示が2種類呈示される例を示したが、係る例に限定されず、ユーザにより入力が必要な情報に応じて、3種類以上の新たな入力表示が、入力表示220に続いて右側に順次配置されてもよい。
入力表示領域200の下部には、農薬散布の散布日時を示した表示帯130の詳細表示を行う農薬散布履歴表示領域300が配置される。農薬散布履歴表示領域300では、活動内容を示す題目表示310と、活動日表示311と、活動の種類表示312と、が表示され得る。本実施例では、活動が農薬散布であるため、題目表示310は、農薬散布記録と示され、活動日表示311は農薬散布日、活動の種類表示312は、散布された農薬の種類が表示されている。
(3.3.農薬散布履歴表示領域)
農薬散布履歴表示領域300では、メイン表示領域100の時間軸140とは直交する方向で、最も左側の位置に活動日表示311が示される。活動日表示311は、時間軸140に示される時間範囲よりも広い範囲における活動日を表示してもよい。図3では、メイン表示領域100の時間軸140では、6月4日から21日を表示しており、農薬散布日として、6月7日および6月19日が示されている。一方、活動日表示311では、上部から6月19日の散布を最上段に示し、農薬散布日時を順にさかのぼって、農薬が散布された日時である6月7日、5月4日、4月1日を表示している。なお、本実施例では、直近4件の農薬散布日を示しているが、4件に限らず、表示される件数は適宜決定されてよい。
農薬散布履歴表示領域300では、メイン表示領域100の時間軸140とは直交する方向で、最も左側の位置に活動日表示311が示される。活動日表示311は、時間軸140に示される時間範囲よりも広い範囲における活動日を表示してもよい。図3では、メイン表示領域100の時間軸140では、6月4日から21日を表示しており、農薬散布日として、6月7日および6月19日が示されている。一方、活動日表示311では、上部から6月19日の散布を最上段に示し、農薬散布日時を順にさかのぼって、農薬が散布された日時である6月7日、5月4日、4月1日を表示している。なお、本実施例では、直近4件の農薬散布日を示しているが、4件に限らず、表示される件数は適宜決定されてよい。
また、農薬散布履歴表示領域300では、時間軸140が配置される方向に、活動日表示311と並んで、散布された農薬の種類表示312が示される。つまり、種類表示312では、活動日表示311にて散布された農薬の種類が、活動日表示311の右隣に並んで表示されている。図3では、6月19日に農薬1、6月7日に農薬2、5月4日に農薬3、4月1日に農薬2を散布したことが表示されている。具体的に農薬の種類としては、例えば、カリグリーン、M7:ベルクートフロアブル、17,12:ジャストミート顆粒水和剤、等を挙げることができる。表示される農薬の種類は、農薬の主成分の名称、散布された農薬の商品名等、ユーザが農薬を識別可能な名称であればよい。
(3.4.病虫害履歴表示領域)
農薬散布履歴表示領域300の下部には、被害発生を示した表示帯120から表示帯122について詳細表示を行う病虫害履歴表示領域400が配置される。病虫害履歴表示領域400では、被害発生を示す題目表示410と、被害発生日表示411と、発生した病虫害の種類表示412と、が表示される。本実施例では、病害虫による作物への被害を対象とするため、題目表示410は、病虫害発生記録と示され、被害発生日表示411には病虫害の被害発生日時、種類表示412には、病虫害の種類が表示されている。
農薬散布履歴表示領域300の下部には、被害発生を示した表示帯120から表示帯122について詳細表示を行う病虫害履歴表示領域400が配置される。病虫害履歴表示領域400では、被害発生を示す題目表示410と、被害発生日表示411と、発生した病虫害の種類表示412と、が表示される。本実施例では、病害虫による作物への被害を対象とするため、題目表示410は、病虫害発生記録と示され、被害発生日表示411には病虫害の被害発生日時、種類表示412には、病虫害の種類が表示されている。
病虫害履歴表示領域400では、メイン表示領域100の時間軸140が配置される方向とは直交する方向で、最も左側の位置に被害発生日表示411が示される。被害発生日表示411は、時間軸140に示される時間範囲よりも広い範囲における被害発生日を表示してもよい。図3では、メイン表示領域100の時間軸140では、6月4日から21日を表示しており、被害発生日として、6月14日および6月17日が示されている。被害発生日表示411では、上部から、6月17日の被害発生を最上段に示し、順にさかのぼって、被害が発生した日時である6月14日、1月29日、2017年11月3日を示している。なお、本実施例では、直近4件の被害発生日を示しているが、4件に限らず、表示される件数は適宜決定されてよい。
また、病虫害履歴表示領域400では、時間軸140が配置される方向に、被害発生日表示411と並んで、病虫害の種類表示412が示される。つまり、種類表示412では、被害発生日表示411にて表示された病虫害の種類が、被害発生日表示411の右隣に並んで表示されている。図3では、6月17日に病虫害1、6月14日に病虫害2、1月29日に病虫害1、2017年11月3日に病虫害4が発生したことが表示されている。
ここまでで、表示領域内におけるメイン表示領域100と、入力表示領域200と、農薬散布履歴表示領域300と、病虫害履歴表示領域400とが、表示領域の上部から順に下部に向けて配置される説明を行った。メイン表示領域100よりも上の表示領域には、さらに、他の表示情報を呈示する選択を可能にするメニュー表示領域500およびページ選択表示領域600が配置されてもよい。
(3.5.その他の表示領域)
表示装置1000の表示部1200では、上述した表示情報以外にも多様な情報を呈示する機能を有していてもよく、多様な情報を適宜表示するために、表示内容を選択できてよい。例えば、メニュー表示領域500は、多様な情報を一覧としてまとめたようなメニュー表示に戻るための選択を可能にする表示が表示されてもよい。具体的には、メニュー表示領域500をユーザ等がタップする等により、メニュー表示の画面に遷移することができる。
表示装置1000の表示部1200では、上述した表示情報以外にも多様な情報を呈示する機能を有していてもよく、多様な情報を適宜表示するために、表示内容を選択できてよい。例えば、メニュー表示領域500は、多様な情報を一覧としてまとめたようなメニュー表示に戻るための選択を可能にする表示が表示されてもよい。具体的には、メニュー表示領域500をユーザ等がタップする等により、メニュー表示の画面に遷移することができる。
また、ページ選択表示領域600は、表示領域内で表示される表示をひとつ前の画面に遷移可能とする。例えば、栽培センサ30により得られた環境情報等を含むハウスの概況表示を表示するなどの選択が行われる。
このように、上述した表示レイアウトを表示装置1000の表示領域内で表示することにより、ユーザに対して、より分かりやすく被害発生リスクと該被害発生リスクに関連する情報の呈示できる。
(4.変形例)
次に、図4を参照して、上記実施形態にかかる表示装置による表示の変形例の一例について説明する。図4は、上記実施形態にかかる表示のメイン表示領域100における表示帯110から時間軸140までの表示の変形例の一例を示した図である。
次に、図4を参照して、上記実施形態にかかる表示装置による表示の変形例の一例について説明する。図4は、上記実施形態にかかる表示のメイン表示領域100における表示帯110から時間軸140までの表示の変形例の一例を示した図である。
図4に示す表示領域は、上記実施形態と異なり、被害発生リスクを示す表示アイテムと病虫害発生を示す表示アイテムとが病虫害毎に並び、農薬散布を示す表示帯は全病害虫に対して一つの表示帯の表示で対応している。農薬散布は各病害虫に対して効果を示し得るため、一つの表示帯で表示することで、表示を簡素化しつつユーザに分かりやすく表示を呈示できる。
図4を用いて具体的に説明すると、表示領域には、病虫害と題目表示された表示帯710Tの下には、3つの病害虫の種類が並んで配置されている。各病虫害の項目には、それぞれ被害発生リスクと病虫害発生を示す表示帯が表示される。病害虫1では、被害発生リスクを示す表示帯711と病害虫発生を示す表示帯721が上下に並んで配置される。病害虫1と同様に、病害虫1の下には、病虫害2の被害発生リスクを示す表示帯712と病害虫発生を示す表示帯722が上下に並んで配置され、病害虫2の下には、病虫害3の被害発生リスクを示す表示帯713と病害虫発生を示す表示帯723が上下に並んで配置される。
表示帯711を例に挙げると、被害発生リスクは、文字表記によりリスクが3段階でユーザに示されている。図4の一例では、L、M、Hの文字表記が表示され、リスクが低レベルの文字表記がLを示し、リスクが高レベルの文字表記がHを示し、低いリスクレベルと高いリスクレベルの間の中レベルの文字表記はMを示している。
各病害虫の被害発生リスクと病虫害発生とが示されたさらに下の表示領域には、農薬散布の題目表示を示す表示帯730Tが示され、表示帯730Tの下には、農薬散布日時を示す表示帯730が配置される。
表示帯710Tから表示帯730が並んで配置される最下部には、表示帯710Tから表示帯730に対応する時間軸740が表示帯730に沿って配置される。例えば、時間軸740は、左から日時を示し、時間軸740には4日から10日までが示されている。これによると、5日には農薬散布が行われ、病虫害1の被害発生リスクは中レベルMであり、病虫害2の被害発生リスクは低レベルLであり、病虫害3の被害発生リスクは低レベルLであることがわかる。このように病害虫毎に被害発生リスクと、病虫害発生と、を示し、全病害虫に対応する農薬散布の表示を一つとして、被害発生リスクと、病虫害発生と、農薬散布と、に対応する時間軸と、を表示することで、病虫害の種類が増加する際に、より分かりやすくユーザに対して、被害発生リスクと該被害発生リスクに関連する情報の呈示を行うことができる。
以上、添付図面を参照しながら本発明の好適な実施形態について詳細に説明したが、本発明はかかる例に限定されない。本発明の属する技術の分野における通常の知識を有する者であれば、特許請求の範囲に記載された技術的思想の範疇内において、各種の変更例または修正例に想到し得ることは明らかであり、これらについても、当然に本発明の技術的範囲に属するものと了解される。
1 情報処理システム
20 気象サーバ
30 栽培センサ
40 推定サーバ
41 取得部
42 推定部
43 表示情報生成部
1000 表示装置
1100 表示情報取得部
1200 表示部
1300 操作部
20 気象サーバ
30 栽培センサ
40 推定サーバ
41 取得部
42 推定部
43 表示情報生成部
1000 表示装置
1100 表示情報取得部
1200 表示部
1300 操作部
Claims (11)
- 注目事象に起因する作物への被害が発生する可能性を表し、前記作物の周囲の環境に関する環境情報に基づいて推定された被害発生リスクを示す第1表示と、
前記被害の発生に関する被害発生情報を示す第2表示と、
前記被害発生リスクを抑制する活動に関する活動情報を示す第3表示と、が
同一の時間軸に対応して、表示領域内で並んで配置される、表示装置。 - 前記時間軸は、前記時間軸の時間範囲を変更可能である、請求項1に記載の表示装置。
- 前記第1表示では、前記被害発生リスクが図形で表され、前記被害発生リスクが高いほど前記図形の大きさが大きい、請求項1または2に記載の表示装置。
- 前記図形の表示態様は、前記環境情報が予測値を使用する場合と過去値を使用する場合とによって異なる、請求項3に記載の表示装置。
- 前記第1表示では、前記被害発生リスクが図形で表され、前記被害発生リスクに応じて前記図形の濃度が異なる、請求項1または2に記載の表示装置。
- 前記第1表示では、前記被害発生リスクが文字で表され、前記被害発生リスクに応じて前記文字が異なる、請求項1または2に記載の表示装置。
- 前記注目事象は、前記作物が病害虫に感染することである、請求項1~6のいずれか一項に記載の表示装置。
- 前記被害発生情報および前記被害発生リスクを抑制する前記活動情報を前記表示装置に対して入力可能とする入力表示が配置される、請求項1~7のいずれか一項に記載の表示装置。
- 前記被害発生リスクを抑制する活動とは、農薬を散布する農薬散布であり、
前記第3表示は、前記農薬散布が行われたか否かを示す、請求項7に記載の表示装置。 - 前記農薬散布において、散布された前記農薬の種類を示す情報を含む農薬散布履歴表示が配置される、請求項9に記載の表示装置。
- 前記被害発生情報は、前記被害を発生させた前記病害虫の種類および前記被害が発生した日時の情報であり、
前記第2表示で示される時間範囲よりも前に前記被害を発生させた前記病害虫の種類および前記被害が発生した日時の情報を含む病虫害履歴表示が配置される、請求項7に記載の表示装置。
Applications Claiming Priority (2)
| Application Number | Priority Date | Filing Date | Title |
|---|---|---|---|
| JP2018188524 | 2018-10-03 | ||
| JP2018-188524 | 2018-10-03 |
Publications (1)
| Publication Number | Publication Date |
|---|---|
| WO2020071050A1 true WO2020071050A1 (ja) | 2020-04-09 |
Family
ID=70055139
Family Applications (1)
| Application Number | Title | Priority Date | Filing Date |
|---|---|---|---|
| PCT/JP2019/034888 Ceased WO2020071050A1 (ja) | 2018-10-03 | 2019-09-05 | 表示装置 |
Country Status (1)
| Country | Link |
|---|---|
| WO (1) | WO2020071050A1 (ja) |
Citations (4)
| Publication number | Priority date | Publication date | Assignee | Title |
|---|---|---|---|---|
| US20160202227A1 (en) * | 2015-01-14 | 2016-07-14 | Accenture Global Services Limited | Precision agriculture system |
| JP2016202157A (ja) * | 2015-04-21 | 2016-12-08 | アスザック株式会社 | ピーマン炭疽病発生予察アルゴリズムと判定システム |
| US20180018414A1 (en) * | 2016-07-12 | 2018-01-18 | Tata Consultancy Services Limited | Systems and methods for pest forecasting using historical pesticide usage information |
| WO2018047726A1 (ja) * | 2016-09-07 | 2018-03-15 | ボッシュ株式会社 | 情報処理装置および情報処理システム |
-
2019
- 2019-09-05 WO PCT/JP2019/034888 patent/WO2020071050A1/ja not_active Ceased
Patent Citations (4)
| Publication number | Priority date | Publication date | Assignee | Title |
|---|---|---|---|---|
| US20160202227A1 (en) * | 2015-01-14 | 2016-07-14 | Accenture Global Services Limited | Precision agriculture system |
| JP2016202157A (ja) * | 2015-04-21 | 2016-12-08 | アスザック株式会社 | ピーマン炭疽病発生予察アルゴリズムと判定システム |
| US20180018414A1 (en) * | 2016-07-12 | 2018-01-18 | Tata Consultancy Services Limited | Systems and methods for pest forecasting using historical pesticide usage information |
| WO2018047726A1 (ja) * | 2016-09-07 | 2018-03-15 | ボッシュ株式会社 | 情報処理装置および情報処理システム |
Non-Patent Citations (1)
| Title |
|---|
| 9 June 2017 (2017-06-09), Retrieved from the Internet <URL:https://monoist.atmarkit.co.jp/mn/articles/1706/09/news041.html#1_ys_170> [retrieved on 20191115] * |
Similar Documents
| Publication | Publication Date | Title |
|---|---|---|
| US20230380349A1 (en) | Information processing device and information processing method | |
| JP6252472B2 (ja) | 農作業支援装置および方法、プログラム、記録媒体、並びに農作業支援システム | |
| KR102253523B1 (ko) | 영농 시스템 및 농작업기 | |
| JP7014620B2 (ja) | 営農システム | |
| Xiao et al. | Observed changes in winter wheat phenology in the North China Plain for 1981–2009 | |
| US10475212B2 (en) | Methods for generating soil maps and application prescriptions | |
| JP5525555B2 (ja) | 栽培支援装置、栽培支援システム、栽培支援方法及びプログラム | |
| JP6760069B2 (ja) | 情報処理装置、情報処理方法、及び、プログラム | |
| JP6760068B2 (ja) | 情報処理装置、情報処理方法、及び、プログラム | |
| JP6295452B2 (ja) | 農作物育成支援装置、及びそのプログラム | |
| US20220076014A1 (en) | Information processing device, and information processing system | |
| AU2019309839A1 (en) | Information processing device, information processing method, and program | |
| WO2015173875A1 (ja) | 栽培計画生成方法、栽培計画生成装置、および栽培計画生成プログラム | |
| JP2023150886A (ja) | 情報処理装置、情報処理システム、情報処理プログラムおよび情報処理方法 | |
| JP2016170814A (ja) | 営農システム及び農作業機 | |
| US20140009600A1 (en) | Mobile device, computer product, and information providing method | |
| WO2016039175A1 (ja) | 情報処理装置、情報処理方法、及び、プログラム | |
| JP2016218949A (ja) | 表示装置 | |
| JP7327791B2 (ja) | 農作物の生産支援システム及びほ場別アドバイス表示プログラム | |
| JP2022040342A (ja) | 営農システム | |
| Gopinath et al. | An IoT Based Innovative Agri-Crop Care System | |
| RU2023128459A (ru) | Системы и способы обеспечения представлений полей, содержащих улучшенные сельскохозяйственные карты, имеющие слой данных и данные изображений | |
| JP2025013869A (ja) | 収穫された製品内における作物保護製品残留量の予測 | |
| JP2023097383A (ja) | 作物の管理方法、管理装置、およびプログラム | |
| JP2024085487A (ja) | 栽培支援装置、栽培支援方法及びプログラム |
Legal Events
| Date | Code | Title | Description |
|---|---|---|---|
| 121 | Ep: the epo has been informed by wipo that ep was designated in this application |
Ref document number: 19869547 Country of ref document: EP Kind code of ref document: A1 |
|
| NENP | Non-entry into the national phase |
Ref country code: DE |
|
| 122 | Ep: pct application non-entry in european phase |
Ref document number: 19869547 Country of ref document: EP Kind code of ref document: A1 |
|
| NENP | Non-entry into the national phase |
Ref country code: JP |