WO2020054485A1 - 超音波観測装置、超音波観測装置の作動方法およびコンピュータ読み取り可能な記録媒体 - Google Patents
超音波観測装置、超音波観測装置の作動方法およびコンピュータ読み取り可能な記録媒体 Download PDFInfo
- Publication number
- WO2020054485A1 WO2020054485A1 PCT/JP2019/034478 JP2019034478W WO2020054485A1 WO 2020054485 A1 WO2020054485 A1 WO 2020054485A1 JP 2019034478 W JP2019034478 W JP 2019034478W WO 2020054485 A1 WO2020054485 A1 WO 2020054485A1
- Authority
- WO
- WIPO (PCT)
- Prior art keywords
- ultrasonic
- image data
- unit
- data
- frequency spectrum
- Prior art date
- Legal status (The legal status is an assumption and is not a legal conclusion. Google has not performed a legal analysis and makes no representation as to the accuracy of the status listed.)
- Ceased
Links
Images









Classifications
-
- A—HUMAN NECESSITIES
- A61—MEDICAL OR VETERINARY SCIENCE; HYGIENE
- A61B—DIAGNOSIS; SURGERY; IDENTIFICATION
- A61B8/00—Diagnosis using ultrasonic, sonic or infrasonic waves
- A61B8/08—Clinical applications
- A61B8/0833—Clinical applications involving detecting or locating foreign bodies or organic structures
- A61B8/085—Clinical applications involving detecting or locating foreign bodies or organic structures for locating body or organic structures, e.g. tumours, calculi, blood vessels, nodules
-
- G—PHYSICS
- G01—MEASURING; TESTING
- G01S—RADIO DIRECTION-FINDING; RADIO NAVIGATION; DETERMINING DISTANCE OR VELOCITY BY USE OF RADIO WAVES; LOCATING OR PRESENCE-DETECTING BY USE OF THE REFLECTION OR RERADIATION OF RADIO WAVES; ANALOGOUS ARRANGEMENTS USING OTHER WAVES
- G01S15/00—Systems using the reflection or reradiation of acoustic waves, e.g. sonar systems
- G01S15/88—Sonar systems specially adapted for specific applications
- G01S15/89—Sonar systems specially adapted for specific applications for mapping or imaging
- G01S15/8906—Short-range imaging systems; Acoustic microscope systems using pulse-echo techniques
- G01S15/8909—Short-range imaging systems; Acoustic microscope systems using pulse-echo techniques using a static transducer configuration
- G01S15/8915—Short-range imaging systems; Acoustic microscope systems using pulse-echo techniques using a static transducer configuration using a transducer array
-
- A—HUMAN NECESSITIES
- A61—MEDICAL OR VETERINARY SCIENCE; HYGIENE
- A61B—DIAGNOSIS; SURGERY; IDENTIFICATION
- A61B8/00—Diagnosis using ultrasonic, sonic or infrasonic waves
- A61B8/08—Clinical applications
- A61B8/0833—Clinical applications involving detecting or locating foreign bodies or organic structures
- A61B8/0841—Clinical applications involving detecting or locating foreign bodies or organic structures for locating instruments
-
- A—HUMAN NECESSITIES
- A61—MEDICAL OR VETERINARY SCIENCE; HYGIENE
- A61B—DIAGNOSIS; SURGERY; IDENTIFICATION
- A61B8/00—Diagnosis using ultrasonic, sonic or infrasonic waves
- A61B8/12—Diagnosis using ultrasonic, sonic or infrasonic waves in body cavities or body tracts, e.g. by using catheters
-
- A—HUMAN NECESSITIES
- A61—MEDICAL OR VETERINARY SCIENCE; HYGIENE
- A61B—DIAGNOSIS; SURGERY; IDENTIFICATION
- A61B8/00—Diagnosis using ultrasonic, sonic or infrasonic waves
- A61B8/46—Ultrasonic, sonic or infrasonic diagnostic devices with special arrangements for interfacing with the operator or the patient
- A61B8/461—Displaying means of special interest
- A61B8/463—Displaying means of special interest characterised by displaying multiple images or images and diagnostic data on one display
-
- G—PHYSICS
- G01—MEASURING; TESTING
- G01S—RADIO DIRECTION-FINDING; RADIO NAVIGATION; DETERMINING DISTANCE OR VELOCITY BY USE OF RADIO WAVES; LOCATING OR PRESENCE-DETECTING BY USE OF THE REFLECTION OR RERADIATION OF RADIO WAVES; ANALOGOUS ARRANGEMENTS USING OTHER WAVES
- G01S15/00—Systems using the reflection or reradiation of acoustic waves, e.g. sonar systems
- G01S15/88—Sonar systems specially adapted for specific applications
- G01S15/89—Sonar systems specially adapted for specific applications for mapping or imaging
- G01S15/8906—Short-range imaging systems; Acoustic microscope systems using pulse-echo techniques
- G01S15/8977—Short-range imaging systems; Acoustic microscope systems using pulse-echo techniques using special techniques for image reconstruction, e.g. FFT, geometrical transformations, spatial deconvolution, time deconvolution
-
- G—PHYSICS
- G01—MEASURING; TESTING
- G01S—RADIO DIRECTION-FINDING; RADIO NAVIGATION; DETERMINING DISTANCE OR VELOCITY BY USE OF RADIO WAVES; LOCATING OR PRESENCE-DETECTING BY USE OF THE REFLECTION OR RERADIATION OF RADIO WAVES; ANALOGOUS ARRANGEMENTS USING OTHER WAVES
- G01S7/00—Details of systems according to groups G01S13/00, G01S15/00, G01S17/00
- G01S7/52—Details of systems according to groups G01S13/00, G01S15/00, G01S17/00 of systems according to group G01S15/00
- G01S7/52017—Details of systems according to groups G01S13/00, G01S15/00, G01S17/00 of systems according to group G01S15/00 particularly adapted to short-range imaging
- G01S7/52023—Details of receivers
- G01S7/52033—Gain control of receivers
-
- G—PHYSICS
- G01—MEASURING; TESTING
- G01S—RADIO DIRECTION-FINDING; RADIO NAVIGATION; DETERMINING DISTANCE OR VELOCITY BY USE OF RADIO WAVES; LOCATING OR PRESENCE-DETECTING BY USE OF THE REFLECTION OR RERADIATION OF RADIO WAVES; ANALOGOUS ARRANGEMENTS USING OTHER WAVES
- G01S7/00—Details of systems according to groups G01S13/00, G01S15/00, G01S17/00
- G01S7/52—Details of systems according to groups G01S13/00, G01S15/00, G01S17/00 of systems according to group G01S15/00
- G01S7/52017—Details of systems according to groups G01S13/00, G01S15/00, G01S17/00 of systems according to group G01S15/00 particularly adapted to short-range imaging
- G01S7/52023—Details of receivers
- G01S7/52036—Details of receivers using analysis of echo signal for target characterisation
-
- G—PHYSICS
- G01—MEASURING; TESTING
- G01S—RADIO DIRECTION-FINDING; RADIO NAVIGATION; DETERMINING DISTANCE OR VELOCITY BY USE OF RADIO WAVES; LOCATING OR PRESENCE-DETECTING BY USE OF THE REFLECTION OR RERADIATION OF RADIO WAVES; ANALOGOUS ARRANGEMENTS USING OTHER WAVES
- G01S7/00—Details of systems according to groups G01S13/00, G01S15/00, G01S17/00
- G01S7/52—Details of systems according to groups G01S13/00, G01S15/00, G01S17/00 of systems according to group G01S15/00
- G01S7/52017—Details of systems according to groups G01S13/00, G01S15/00, G01S17/00 of systems according to group G01S15/00 particularly adapted to short-range imaging
- G01S7/52053—Display arrangements
- G01S7/52057—Cathode ray tube displays
- G01S7/52071—Multicolour displays; using colour coding; Optimising colour or information content in displays, e.g. parametric imaging
-
- A—HUMAN NECESSITIES
- A61—MEDICAL OR VETERINARY SCIENCE; HYGIENE
- A61B—DIAGNOSIS; SURGERY; IDENTIFICATION
- A61B18/00—Surgical instruments, devices or methods for transferring non-mechanical forms of energy to or from the body
- A61B2018/00571—Surgical instruments, devices or methods for transferring non-mechanical forms of energy to or from the body for achieving a particular surgical effect
- A61B2018/00595—Cauterization
-
- A—HUMAN NECESSITIES
- A61—MEDICAL OR VETERINARY SCIENCE; HYGIENE
- A61B—DIAGNOSIS; SURGERY; IDENTIFICATION
- A61B90/00—Instruments, implements or accessories specially adapted for surgery or diagnosis and not covered by any of the groups A61B1/00 - A61B50/00, e.g. for luxation treatment or for protecting wound edges
- A61B90/36—Image-producing devices or illumination devices not otherwise provided for
- A61B2090/364—Correlation of different images or relation of image positions in respect to the body
-
- A—HUMAN NECESSITIES
- A61—MEDICAL OR VETERINARY SCIENCE; HYGIENE
- A61B—DIAGNOSIS; SURGERY; IDENTIFICATION
- A61B90/00—Instruments, implements or accessories specially adapted for surgery or diagnosis and not covered by any of the groups A61B1/00 - A61B50/00, e.g. for luxation treatment or for protecting wound edges
- A61B90/36—Image-producing devices or illumination devices not otherwise provided for
- A61B90/37—Surgical systems with images on a monitor during operation
- A61B2090/378—Surgical systems with images on a monitor during operation using ultrasound
-
- A—HUMAN NECESSITIES
- A61—MEDICAL OR VETERINARY SCIENCE; HYGIENE
- A61B—DIAGNOSIS; SURGERY; IDENTIFICATION
- A61B8/00—Diagnosis using ultrasonic, sonic or infrasonic waves
- A61B8/08—Clinical applications
- A61B8/0891—Clinical applications for diagnosis of blood vessels
Definitions
- the present invention relates to an ultrasonic observation apparatus that observes a tissue such as a patient or an animal as a subject using ultrasonic waves, an operation method of the ultrasonic observation apparatus, and a computer-readable recording medium.
- an ultrasonic echo backscattered by the object is received by an ultrasonic transducer, converted into an ultrasonic signal, and the converted ultrasonic wave.
- a technique for forming an image based on a signal is known.
- the scattering of a sound wave is a physical phenomenon in which the sound wave can change its traveling direction by colliding with a particle in a medium and exerting a force on each other (this is called interaction).
- the backscatter refers to a component of the scatter that returns in the direction of the sound source. This phenomenon is generally called reflection, but in the present application, the term backscatter will be used hereinafter.
- the sound source at this time is an ultrasonic vibrator.
- An operator such as a doctor observes or diagnoses a subject by looking at an ultrasonic image based on the ultrasonic signal displayed on the display device.
- the subject may be treated using the ultrasonic probe having the above-described ultrasonic transducer.
- cauterization may be performed by puncturing a subject with a cautery needle while observing the subject using an ultrasonic probe.
- a technique for visualizing difference information between before treatment, during treatment, or after treatment for monitoring treatment and confirming treatment effect is known (for example, see Patent Document 1).
- difference information is generated and displayed using image information before treatment and image information after treatment.
- Examples of image information in Patent Document 1 include information obtained by an ultrasonic transducer, information obtained by an X-ray CT (Computed @ Tomography) apparatus, information obtained by an MRI (Magnetic @ Resonance @ Imaging) apparatus, and the like.
- imaging of soft tissue requires contrast enhancement.
- CT images have poor reproducibility, and no objective difference can be obtained even when compared with each other.
- the posture of the subject with respect to the imaging device may not be the same in different phases. Therefore, the reproducibility of the CT image is poor, and no objective difference can be obtained even when comparing images at different time phases.
- performing a complicated operation to capture a contrast CT image while paying attention to the imaging arrangement during each operation increases the operation time and increases the burden on the patient and the operator.
- MRI apparatus When generating difference information using an MRI apparatus, the same problem as described for an X-ray CT apparatus is involved. Furthermore, the MRI apparatus requires time to capture one set of images, which increases the operation time and increases the burden on patients and operators. Obviously, MRI equipment is not suitable for intraoperative monitoring.
- the present invention has been made in view of the above, and when acquiring a plurality of image information having different time phases, an ultrasonic observation apparatus and an ultrasonic observation apparatus capable of acquiring image information with high reproducibility And a computer-readable recording medium.
- an ultrasonic observation apparatus includes an ultrasonic probe that transmits ultrasonic waves to a subject and receives ultrasonic waves that are backscattered by the subject.
- first frequency spectrum data is obtained for each of a first ultrasonic signal and a second ultrasonic signal whose acquisition time is different from that of the first ultrasonic signal.
- a frequency analysis unit that generates second frequency spectrum data
- a difference feature amount calculation unit that calculates a difference feature amount using a difference between the first frequency spectrum data and the second frequency spectrum data as a feature amount
- An analysis image data generation unit configured to generate analysis image data to which color information according to the difference feature amount is added.
- the difference feature amount calculation unit calculates difference spectrum data representing a difference between the first frequency spectrum data and the second frequency spectrum data.
- the difference feature amount calculating unit calculates a first feature amount by performing a regression analysis of the first frequency spectrum data, and further calculates the second feature amount.
- a regression analysis unit that performs a regression analysis of the spectrum data to calculate a second feature amount;
- a subtraction unit that performs a subtraction process on the first feature amount and the second feature amount to calculate a difference feature amount; It is characterized by having.
- the regression analysis unit approximates a predetermined frequency band in the first and second frequency spectrum data with a linear expression, and an intercept and a slope of the linear expression, In addition, any one of the values of the linear expression at the intermediate frequency of the frequency band is calculated as the difference feature amount.
- the ultrasonic observation apparatus according to the present invention according to the above invention, wherein the first ultrasonic image data is generated based on the first ultrasonic signal, and the second ultrasonic image data is generated based on the second ultrasonic signal.
- An ultrasonic image data generating unit that generates image data, and a position change amount and a position of the subject depicted in the first ultrasound image data with respect to the subject depicted in the second ultrasound image data; And / or a moving amount estimating unit for estimating a moving amount including at least one of the rotation angles, a correcting unit for correcting the first frequency spectrum data according to the moving amount estimated by the moving amount estimating unit, And a superimposing unit that superimposes the analysis image data on the second ultrasonic image data, wherein the difference feature amount calculation unit is configured to correct the first frequency spectrum data after the correction by the correction unit and the second frequency spectrum data. Frequency spectrum And corrects the difference feature amount using the torr data.
- the analysis image data generation unit may be configured to determine each pixel position in the second ultrasonic image data based on the second ultrasonic signal according to a difference feature amount.
- a superimposing unit that generates the analysis image data to which color information is assigned, generates superimposition image data in which the analysis image data is superimposed on the second ultrasound image data, and displays the superimposition image data on a display system of a display device.
- a display image data generation unit that generates display image data by performing a corresponding process.
- An operation method of the ultrasonic observation apparatus includes an ultrasonic observation apparatus that transmits an ultrasonic wave to a subject and receives an ultrasonic signal acquired by an ultrasonic probe that receives an ultrasonic wave backscattered by the subject.
- An operation method of the device wherein the frequency analysis unit includes a first ultrasonic signal and first frequency spectrum data for each of the second ultrasonic signals having different acquisition times from the first ultrasonic signal.
- a frequency analysis step of generating second frequency spectrum data, and a difference feature amount calculation unit calculates a difference feature amount using a difference between the first frequency spectrum data and the second frequency spectrum data as a feature amount.
- a computer-readable recording medium is a non-transitory computer-readable recording medium on which an executable program is recorded, wherein the program instructs a processor to execute:
- the analysis unit generates first frequency spectrum data and second frequency spectrum data for each of the first ultrasonic signal and the second ultrasonic signal having a different acquisition time from the first ultrasonic signal.
- a difference feature amount calculation unit calculates a difference feature amount using a difference between the first frequency spectrum data and the second frequency spectrum data as a feature amount, and an analysis image data generation unit calculates the difference feature amount It is characterized by generating analysis image data to which corresponding color information is added.
- FIG. 1 is a block diagram illustrating a configuration of an ultrasonic diagnostic system including an ultrasonic observation device according to Embodiment 1 of the present invention.
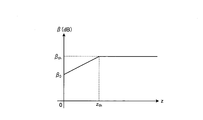
- FIG. 2 is a diagram illustrating a relationship between a reception depth and an amplification factor in an amplification process performed by a transmission / reception unit.
- FIG. 3 is a diagram schematically illustrating a scanning area of the ultrasonic transducer and sound ray data.
- FIG. 4 is a diagram schematically illustrating a data array in RF data on one sound ray of an ultrasonic signal.
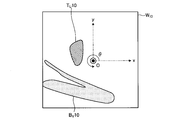
- FIG. 5 is a diagram illustrating an example of a B-mode image before cauterization by a cautery needle.
- FIG. 1 is a block diagram illustrating a configuration of an ultrasonic diagnostic system including an ultrasonic observation device according to Embodiment 1 of the present invention.
- FIG. 2 is a diagram illustrating a relationship between a reception depth and an amplification factor in an amplification process performed by a transmission /
- FIG. 6 is a diagram illustrating an example of a B-mode image during cauterization with a cautery needle.
- FIG. 7 is a diagram illustrating a B-mode image.
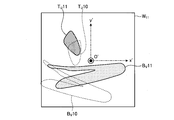
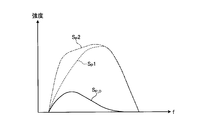
- FIG. 8 is a diagram illustrating the arrangement of blood vessels and tumors in the B-mode image during cauterization shown in FIG. 6 and the B-mode image before cauterization after coordinate conversion shown in FIG.
- FIG. 9 is a diagram illustrating an example of a frequency spectrum before cauterization and a frequency spectrum during cauterization calculated by the frequency analysis unit.
- FIG. 10 is a diagram showing a difference spectrum between a frequency spectrum calculated from RF data before cauterization and a frequency spectrum calculated from RF data during cauterization.
- FIG. 10 is a diagram showing a difference spectrum between a frequency spectrum calculated from RF data before cauterization and a frequency spectrum calculated from RF data during cauterization.
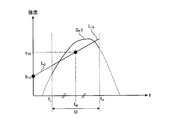
- FIG. 11 is a diagram for explaining calculation of a difference feature amount performed by the regression analysis unit according to Embodiment 1 of the present invention.
- FIG. 12 is a flowchart illustrating an outline of a process performed by the ultrasonic observation apparatus according to Embodiment 1 of the present invention.
- FIG. 13 is a flowchart illustrating an outline of a process executed by the frequency analysis unit of the ultrasonic observation apparatus according to Embodiment 1 of the present invention.
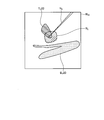
- FIG. 14 is a diagram schematically illustrating a display example of a superimposed image on the display device of the ultrasonic observation apparatus according to Embodiment 1 of the present invention.
- FIG. 12 is a flowchart illustrating an outline of a process performed by the ultrasonic observation apparatus according to Embodiment 1 of the present invention.
- FIG. 13 is a flowchart illustrating an outline of a process executed by the frequency analysis unit of the ultrasonic observation apparatus according to Embodiment 1 of the present invention.
- FIG. 14 is a
- FIG. 15 is a block diagram illustrating a configuration of an ultrasonic diagnostic system including an ultrasonic observation device according to Embodiment 2 of the present invention.
- FIG. 16 is a diagram for explaining calculation of a frequency feature amount using a frequency spectrum before cauterization.
- FIG. 17 is a diagram for explaining calculation of a difference feature amount performed by the difference feature amount calculation unit according to Embodiment 2 of the present invention.
- FIG. 1 is a block diagram illustrating a configuration of an ultrasonic diagnostic system 1 including an ultrasonic observation device 3 according to Embodiment 1 of the present invention.
- An ultrasonic diagnostic system 1 shown in FIG. 1 transmits an ultrasonic wave to a subject, receives an ultrasonic wave backscattered by the subject, and an ultrasonic endoscope 2 connected thereto.
- the ultrasonic endoscope 2 functions as an ultrasonic probe.
- solid arrows indicate transmission of electrical signals related to images
- dashed-dotted arrows indicate transmission of frequency spectrum data or feature values
- dashed arrows indicate control and other electrical signals. It shows the transmission of signals and data.
- the ultrasonic endoscope 2 converts an electric pulse signal received from the ultrasonic observation device 3 into an ultrasonic pulse (acoustic pulse) at the distal end thereof, irradiates the ultrasonic wave to the subject, and scatters the object backward. And an ultrasonic transducer 21 for converting the obtained ultrasonic echo into an electric echo signal expressed by a voltage change.
- the ultrasonic endoscope 2 has a long insertion part into the subject.
- the insertion portion usually has an imaging optical system and an imaging element at its distal end, and when the subject is a tissue inside the human body, the digestive tract (esophagus, stomach, duodenum, large intestine), Alternatively, it can be inserted into the respiratory tract (trachea, bronchi) to image the digestive tract and respiratory organs and surrounding organs (pancreas, gallbladder, bile duct, biliary tract, lymph node, mediastinal organ, blood vessel, etc.).
- the insertion section usually includes a long light guide for guiding illumination light for irradiating the subject during imaging.
- the light guide has a distal end reaching the distal end of the insertion section, and a proximal end connected to a light source device for generating illumination light.
- the ultrasonic observation apparatus 3 includes a transmission / reception unit 301, a B-mode image data generation unit 302, a frequency analysis unit 303, a first switching unit 304, a second switching unit 305, a movement amount estimation unit 306, a reading unit 307, and a difference feature amount calculation.
- the transmission / reception unit 301 is electrically connected to the ultrasonic endoscope 2, transmits a transmission signal (pulse signal) including a high-voltage pulse to the ultrasonic transducer 21 based on a predetermined waveform and transmission timing, and An echo signal, which is an electrical high frequency (RF: Radio Frequency) signal, is received from the acoustic transducer 21, and the echo signal is subjected to A / D conversion processing described later to generate and output digital data (hereinafter, referred to as RF data). I do.
- RF Radio Frequency
- the transmitting / receiving unit 301 amplifies the received echo signal. After performing processing such as filtering on the amplified echo signal, the transmission / reception unit 301 performs sampling at an appropriate sampling frequency (for example, 50 MHz) and performs discretization (so-called A / D conversion processing). Thus, the transmission / reception unit 301 generates discrete RF data from the amplified echo signal, and outputs the RF data to the B-mode image data generation unit 302 and the frequency analysis unit 303.
- an appropriate sampling frequency for example, 50 MHz
- the transmission / reception unit 301 includes a beam combining device corresponding to the plurality of elements. It has a channel circuit.
- the frequency band of the pulse signal transmitted by the transmission / reception unit 301 is a wide band that almost covers the linear response frequency band of the ultrasonic transducer 21 when the ultrasonic transducer 21 performs the electroacoustic conversion of the pulse signal into the ultrasonic pulse. I do.
- the various processing frequency bands of the echo signal in the transmission / reception unit 301 are broadbands that substantially cover the linear response frequency band of the ultrasonic transducer 21 when the ultrasonic transducer 21 performs acoustoelectric conversion of the ultrasonic echo into the echo signal. To Thus, it is possible to perform an accurate approximation when performing a frequency spectrum approximation process described later.
- the B-mode image data generation unit 302 generates B-mode image data based on the RF data received from the transmission / reception unit 301. Specifically, the B-mode image data generation unit 302 performs STC (Sensitivity Time Control) correction to amplify the RF data with a larger reception depth at a higher amplification factor.
- FIG. 2 is a diagram illustrating the relationship between the reception depth and the amplification factor in the amplification processing performed by the transmission / reception unit 301.
- FIG. 2 is a logarithmic graph in which the horizontal axis represents the reception depth z and the vertical axis represents the common logarithm of the amplification factor ⁇ . The unit of the vertical axis is dB (decibel).
- the reception depth z shown in FIG. 2 is an amount calculated based on the elapsed time from the start of reception of ultrasonic waves.
- the amplification factor ⁇ linearly increases from ⁇ 0 to ⁇ th (> ⁇ 0 ) as the reception depth z increases.
- the amplification factor ⁇ takes a constant value ⁇ th when the reception depth z is equal to or larger than the threshold value z th .
- the value of the threshold value z th is a value at which the ultrasonic signal received from the subject is almost attenuated and the noise becomes dominant. Note that the relationship shown in FIG. 2 is stored in the storage unit 314 in advance.
- the B-mode image data generating unit 302 performs band-pass filtering and envelope detection on the RF data to generate data representing the amplitude or intensity of the echo signal.
- the B-mode image data generation unit 302 performs a known process such as logarithmic conversion on the data to generate digital sound ray data.
- the converted data is represented by a decibel value.
- a value proportional to a digit expressing the amplitude or intensity of an echo signal indicating a backscattering intensity of an ultrasonic pulse in a decimal number is arranged along the transmission / reception direction (depth direction) of the ultrasonic pulse.
- FIG. 3 is a diagram schematically showing a scanning area (hereinafter, sometimes simply referred to as a scanning area) of the ultrasonic transducer 21 and sound ray data.
- the scanning area S shown in FIG. 3 has a fan shape.
- the ultrasonic vibrator 21 expresses a path (sound ray) in which the ultrasonic wave reciprocates by a straight line, and expresses sound ray data by points arranged on each sound ray.
- each sound ray is numbered 1, 2, 3,... In order from the start of scanning (right in FIG.
- FIG. 3 corresponds to a case where the ultrasonic transducer 21 is a convex transducer.
- the reception depth of the sound ray data is described as z.
- the B-mode image data generating unit 302 further performs signal processing on the sound ray data using a known technique such as a gain processing and a contrast processing.
- the B-mode image data generation unit 302 performs an interpolation process between the sound ray data after performing coordinate transformation for rearranging the sound ray data so that the generated sound ray data can spatially correctly represent the scanning range. A gap between sound ray data is filled, and B-mode image data is generated.
- the B-mode image is a grayscale image in which the values of R (red), G (green), and B (blue), which are variables when the RGB color system is adopted as the color space, are matched.
- the B-mode image data generation unit 302 outputs the generated B-mode image data to the first switching unit 304.
- the frequency analysis unit 303 performs a fast Fourier transform (FFT: Fast Fourier Transform) on the RF data generated by the transmission / reception unit 301 to perform frequency analysis, thereby calculating frequency spectrum data. Specifically, the frequency analysis unit 303 divides the RF data (line data) of each sound ray generated by the transmission / reception unit 301 into a plurality of pieces at a relatively short predetermined time interval, and separates the RF data (hereinafter, referred to as “RF data”) of each part. By performing FFT processing on the “RF data string”), the frequency spectrum of each part of the sound ray is calculated.
- the “frequency spectrum” refers to “frequency distribution of intensity and voltage amplitude of an echo signal obtained from a certain reception depth z (that is, a certain round trip distance L) obtained by performing FFT processing on an RF data string. Means.
- the frequency analysis unit 303 will be described as an example in which frequency spectrum data (hereinafter, also referred to as frequency spectrum data) is generated based on the frequency component V (f, L) of the voltage amplitude. f is the frequency.
- the frequency analyzing unit 303 (effectively, voltage amplitude of the echo signal) amplitude of the RF data frequency component V (f, L) of the divided by the reference voltage V c, expressed in decibels taking common logarithm (log)
- the frequency spectrum data S (f, L) of the subject given by the following equation (1) is generated by multiplying by an appropriate positive constant ⁇ .
- S (f, L) ⁇ ⁇ log ⁇ V (f, L) / V c ⁇ (1)
- the frequency spectrum of the echo signal tends to differ depending on the properties of the human body tissue scanned by the ultrasonic waves. This is because the frequency spectrum has a correlation with the size, number density, acoustic impedance, and the like of the scatterer that scatters the ultrasonic waves.
- the “characteristics of human body tissue” as used herein refers to characteristics of a tissue such as a malignant tumor (cancer), a benign tumor, an endocrine tumor, a mucinous tumor, a normal tissue, a cyst, and a vasculature.
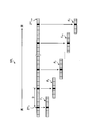
- FIG. 4 is a diagram schematically showing a data array in the RF data on one sound ray SR k of the ultrasonic signal. Rectangle indicated by the white or black in the sound ray SR k is meant data in one sample point. Further, in the RF data on the sound ray SR k , the data located on the right side is the RF data from a deeper part when measured along the sound ray SR k from the ultrasonic transducer 21 (the arrow in FIG. reference). RF data on sound ray SR k, as described above, are sampled from the echo signal by the A / D conversion process in the transmitting and receiving unit 301, a discrete RF data.
- the RF data string has a data number of a power of two.
- the RF data string F K is an abnormal RF data string because the number of data is twelve.
- the frequency analysis unit 303 performs the FFT processing, calculates the frequency component V (f, L) of the voltage amplitude, and calculates the frequency spectrum data S (f, L) is calculated.
- the frequency analysis unit 303 further calculates the frequency spectrum data S (f, L) in all directions by repeating this operation for all sound rays shown in FIG. (Hereinafter, “azimuth” will be described as the direction in which each sound ray data is directed over the entire scanning direction in FIG. 3).
- the first switching unit 304 switches the transmission path of the B-mode image data generated by the B-mode image data generation unit 302 under the control of the control unit 313. Specifically, the first switching unit 304 switches the B-mode image data to the moving amount estimation unit 306 and the superimposition unit 310 or to the superimposition unit 310 and the storage unit 314 (an image data storage unit 314a described later). Output.
- the second switching unit 305 switches the transmission path of the frequency spectrum data generated by the frequency analysis unit 303 under the control of the control unit 313. Specifically, the second switching unit 305 outputs the frequency spectrum data to the difference feature amount calculation unit 308 or switches to the storage unit 314 (a spectrum data storage unit 314b to be described later) to output.
- the movement amount estimating unit 306 estimates the object depicted in the image, or at least a part thereof, using two B-mode image data acquired from the same object at different times. For example, the movement amount of a blood vessel or a tumor as the subject or a part thereof is estimated.
- the moving amount estimating unit 306 estimates the moving amount of the subject between the same subject and different times, for example, before and during cautery.
- the movement amount estimated by the movement amount estimation unit 306 includes the horizontal and vertical movement distances of the B-mode image and the rotation angle of the image.
- the image and frequency spectrum data before cauterization, and various images and various data during cauterization are exemplified, but after the time before cauterization, even after cauterization rather than during cauterization I do not care.
- FIG. 5 is a diagram illustrating an example of a B-mode image before cauterization by a cautery needle.
- FIG. 6 is a diagram illustrating an example of a B-mode image during cauterization with a cautery needle.
- the B-mode image W 10 shown in FIG. 5 the blood vessel (blood vessel image B V 10) and tumor (tumor image T U 10) is depicted.
- a blood vessel (blood vessel image B V 20), a tumor (tumor image T U 20), and a cauterizing needle (cauterizing needle image N E ) are depicted in the B-mode image W 20 shown in FIG.
- the moving amount estimating unit 306 compares the blood vessel image B V 20 of the B mode image W 20 and the tumor image T U 20 (see FIG. 6) during the cauterization with the blood vessel image B V 10 of the B mode image W 10 before the cauterization. And how the tumor image T U 10 (see FIG. 5) moves. Specifically, the movement amount estimating unit 306, the B-mode image W 10 before cauterization, movement in the x-direction, movement in the y-direction, and / or at least one of rotation about the origin While performing the coordinate conversion including, the correlation value between the B-mode image W 10 after the coordinate conversion (to be precise, a B-mode image W 11 described later) and the B-mode image W 20 is calculated.
- the B-mode image W 10 the position change ⁇ x in the x-direction, the position change ⁇ y in the y-direction, just at least one of angular change in the rotation (rotation angle [Delta] [theta]), described as "moving distance”.
- the movement amount used for the estimation by the movement amount estimating unit 306 may be a variety of movement amounts that change in a preset width, a movement amount of a preset pattern, or an operation via the keyboard 5.
- the movement amount set by the user's input may be used.
- B-mode image W 11 Get. 7 is a diagram illustrating a B-mode image W 11.
- FIG. 7 shows this coordinate system O'-x'y 'virtually superimposed for convenience of explanation. Any point of the B-mode image W 10 in FIG. 5 (x, y) 2-variable function the luminance of P 1 (x, y), the luminance of any point of the B-mode image W 11 in FIG.
- Figure 8 is a diagram illustrating a B-mode image W 20 in ablation shown in FIG. 6, the arrangement of blood vessels and tumors in the B-mode image W 11 before cauterization after coordinate transformation shown in Fig.
- Movement amount estimation unit 306 calculates a B-mode image W 11 before cauterization that this coordinate transformation, the correlation value between the B-mode image W 20 in the ablation.
- the movement amounts ( ⁇ x, ⁇ y, ⁇ ) (the order of coordinate conversion is that rotation by the rotation angle ⁇ is the first) include a case where all are zero, that is, a case where no movement is performed.
- any point of the B-mode image W 20 in FIG. 8 (x ', y') 2 the brightness of the variable function P 2 (x ', y' ) is expressed by.
- the moving amount ( ⁇ x, ⁇ y, ⁇ ) the value P 1 of the B-mode image W 11 subjected to coordinate conversion '(x', y ') the value P 2 of the B-mode image W 20
- the correlation value C V ( ⁇ x, ⁇ y, ⁇ ) with (x ′, y ′) is defined by the following equation (4).
- the following expression (6) is obtained by back-calculating the expression (3) with respect to x (x ′, y ′) and y (x ′, y ′).
- the movement amount estimating unit 306 substitutes various values as the movement amounts ( ⁇ x, ⁇ y, ⁇ ) into the right side of Expression (6), and calculates the operation results x (x ′, y ′), y (x ′, y ′) Is further substituted into the right side of the equation (5) to calculate various values of the correlation value C V ( ⁇ x, ⁇ y, ⁇ ).
- equation (5) operation of equation (5) is called the cross-correlation, correlation value C V is maximized when the position and orientation of the B-mode image W 11 and B-mode image W 20 matches.
- the integral symbol ⁇ is used in Expressions (5) and (4), in practice, the movement amount estimating unit 306 performs an operation for obtaining the product sum of the luminance values of the discrete pixels.
- the moving amount estimating unit 306 specifies a moving amount ( ⁇ x 0 , ⁇ y 0 , ⁇ 0 ) that gives the maximum value maxC V among the various calculated correlation values C V ( ⁇ x, ⁇ y, ⁇ ). Then, the movement amount estimating unit 306, the moving amount ( ⁇ x 0, ⁇ y 0, ⁇ 0) and ablation before (blood vessel image B V 10 and tumor image T U 10) in ablation from (blood vessel image B V 20 and tumor The estimated movement amount of the subject up to the image T U 20) is output to the reading unit 307. Note that if the subject does not move in the B-mode images before and during the cauterization, the estimated moving amount is zero.
- the reading unit 307 reads all directions and all depths of the frequency spectrum data S (f, L) acquired before cauterization from the storage unit 314 (spectral data storage unit 314b), and reads the direction of S (f, L). With respect to the orthogonal coordinates x and y defined by the distance and the depth, the coordinate conversion is performed using the movement amount estimated by the movement amount estimation unit 306.
- the reading unit 307 outputs the frequency spectrum data after the coordinate conversion to the difference feature amount calculating unit 308.
- the reading unit 307 functions as a correction unit that corrects the frequency spectrum data before cauterization according to the frequency spectrum data during cauterization.
- the difference feature value calculation unit 308 calculates a difference feature value based on the frequency spectrum data during cauterization calculated by the frequency analysis unit 303 and the frequency spectrum data before cauterization obtained from the reading unit 307 and subjected to coordinate transformation. .
- the difference feature amount calculation unit 308 includes a difference spectrum calculation unit 308a and a regression analysis unit 308b.
- the difference spectrum calculating unit 308a subtracts the frequency spectrum data before and after the ablation and the coordinate transformation from the frequency spectrum data during the ablation while making the azimuth / depth or the orthogonal coordinates defined by them and the frequency coincide. Then, the difference spectrum calculation unit 308a calculates the difference spectrum data obtained by taking the difference as described above.
- FIG. 9 is a diagram illustrating an example of a frequency spectrum before cauterization calculated by the frequency analysis unit 303 and a frequency spectrum during cauterization. Difference spectrum calculating unit 308a, for each frequency, for example, the frequency spectrum data S P 2 obtained during ablation, by calculating the difference between the frequency spectral data S P 1 obtained before ablation, differential spectrum Calculate the data.
- Figure 10 is a diagram showing the frequency spectrum S P 1 calculated from the previous RF data ablation, the differential spectrum S p_D the frequency spectrum S P 2 calculated from RF data in ablation.
- Difference spectrum calculating unit 308a, and the frequency spectrum data S P 2 in ablation by calculating the difference between the frequency spectral data S P 1 before ablation, generates difference spectrum data S p_D shown in FIG. 10.
- the difference spectrum calculation unit 308a calculates difference spectrum data for every direction and every depth.
- the regression analysis unit 308b approximates a plurality of difference spectrum data output from the difference spectrum calculation unit 308a with a straight line, calculates a feature amount of the difference spectrum data (hereinafter, referred to as a difference feature amount) using the straight line, and calculates the difference.
- the feature amount is output to the analysis image data generation unit 309.
- the regression analysis unit 308b performs a simple regression analysis of the frequency spectrum data in the predetermined frequency band, and approximates the frequency spectrum data by a linear expression (regression line), whereby the difference characteristic characterizing the approximated linear expression is obtained. Calculate the amount.
- the simple regression analysis is a regression analysis when there is only one independent variable.
- the independent variable of the simple regression analysis in the present embodiment corresponds to the frequency f.
- FIG. 11 is a diagram for describing calculation of a difference feature amount performed by the regression analysis unit 308b according to Embodiment 1 of the present invention.
- regression analysis unit 308b obtains a regression line L D of the difference spectrum data S p_D perform simple regression analysis in the frequency band U.
- the regression analysis unit 308b calculates the regression of the slope a 1 of the regression line L D , the intercept b 1 , and the center frequency of the frequency band U (ie, “mid band”)
- f M (f L + f H ) / 2.
- c 1 a 1 f M + b 1 is a value on the straight line is calculated as the difference feature quantity.
- the difference spectrum data SP_D is approximated to a linear expression It will be done.
- the slope a 1 and the intercept b 1 indicate the size of the scatterer that scatters the ultrasonic wave, the scattering intensity of the scatterer, and the number density (concentration) of the scatterer. And so on.
- the mid-band fit c 1 gives the voltage amplitude and strength of the echo signal at the center in the effective frequency band.
- mid-band fit c 1 the size of the scatterer, scattering intensity of the scattering body, in addition to the number density of the scatterers is considered to have some correlation with the luminance of the B-mode image.
- the regression analysis unit 308b may approximate frequency spectrum data by a second-order or higher polynomial by regression analysis.
- the frequency analysis unit 303, the difference feature amount calculation unit 308, and the analysis image data generation unit 309 set the analysis range to a specific depth width and azimuth width (that is, in the scanning direction) in the scanning region S illustrated in FIG.
- Each of the above-described processes may be performed only for a region of interest (Region of interest: ROI) delimited by width or the like. If the region of interest is limited to a necessary region, the amount of calculation can be reduced, and the speed of display can be improved.
- the superimposition unit 310 combines the B-mode image data generated by the B-mode image data generation unit 302 with the analysis image data generated by the analysis image data generation unit 309 to generate superimposed image data.
- the display image data generation unit 311 performs predetermined processing such as thinning of data according to the display range of an image on the display device 4 and gradation processing on the superimposed image data or the B-mode image data generated by the superimposition unit 310. Is displayed on the display device 4.
- the input unit 312 generates a selection signal including information on what key and what menu is selected and input according to the operation signal from the keyboard 5 and outputs the selection signal to the control unit 313.
- the keyboard 5 is configured using a plurality of buttons capable of inputting various types of information, and receives input from the operator.
- the keyboard 5 is provided with a touch panel 5a having a display screen.
- the touch panel 5a receives, for example, an input corresponding to the contact position of the operator's finger.
- the keyboard 5 inputs an operation signal including a position (coordinates) touched (contacted) by the operator according to an operation icon displayed on the display screen on the touch panel 5a, a button number for identifying the input button, and the like.
- the touch panel 5a functions as a graphical user interface (GUI) by displaying an ultrasonic image and various information.
- GUI graphical user interface
- As the touch panel there are a resistive type, a capacitive type, an optical type and the like, and any type of touch panel can be applied.
- the control unit 313 reads, from the storage unit 314, information such as an operation program stored in the storage unit 314 and operation parameters and data of each process from the storage unit 314, and executes various operation processes related to the operation method of the ultrasonic observation apparatus 3. By doing so, the ultrasonic observation apparatus 3 is controlled overall.
- the data generation unit 309, the superimposition unit 310, the display image data generation unit 311, the input unit 312, and the control unit 313 are a general-purpose processor such as a CPU (Central Processing Unit) having an arithmetic and control function, or an ASIC (Application Specific Integrated Circuit). Alternatively, it is realized by using a dedicated integrated circuit or the like that executes a specific function such as an FPGA (Field Programmable Gate Array). Note that a plurality of units including at least a part of the above units, including the control unit 313 and the B-mode image data generation unit 302, can be configured using a common general-purpose processor or a dedicated integrated circuit.
- the storage unit 314 stores operation parameters and data of each process.
- the storage unit 314 includes an image data storage unit 314a that stores the B-mode image data generated by the B-mode image data generation unit 302, and the above-described spectrum data storage unit 314b that stores the frequency spectrum data calculated by the frequency analysis unit 303. Having.
- the storage unit 314 is configured using, for example, an HDD (Hard ⁇ Disk ⁇ Drive).
- the storage unit 314 stores, for example, information necessary for the amplification process (the relationship between the amplification factor and the reception depth shown in FIG. 2) and information necessary for the logarithmic conversion process (see Expression (1), for example, ⁇ ). , the value of V c), and stores the window functions required for frequency analysis processing (Hamming, Hanning, the information of Blackman, etc.).
- the storage unit 314 is a non-temporary computer-readable recording medium in which an operation program for executing the operation method of the ultrasonic observation apparatus 3 is installed in advance as an additional memory, for example, a ROM (Read-Only Memory) not shown. ).
- the operation program can be recorded on a computer-readable recording medium such as a portable hard disk, a flash memory, a CD-ROM, a DVD-ROM, and a flexible disk, and widely distributed.
- a computer-readable recording medium such as a portable hard disk, a flash memory, a CD-ROM, a DVD-ROM, and a flexible disk, and widely distributed.
- the various programs described above can also be obtained by downloading via a communication network.
- the communication network referred to here is realized by, for example, an existing public line network, LAN, WAN, or the like, and may be wired or wireless.
- FIG. 12 is a flowchart showing an outline of processing performed by the ultrasonic observation apparatus 3 having the above configuration.
- each unit operates under the control of the control unit 313.
- the first switching unit 304 and the second switching unit 305 are initialized so that the respective output destinations contact the respective lower right terminals shown in FIG. That is, as an initial setting of the ultrasonic observation apparatus 3, the first switching unit 304 outputs the B-mode image data to the superimposing unit 310 and the storage unit 314 (image data storage unit 314a), and the second switching unit 305 outputs the frequency spectrum data.
- the storage unit 314 spectral data storage unit 314b
- step S1 when observation of a subject such as a tissue inside a human body starts, the ultrasonic transducer 21 scans the subject and converts an echo received from the subject into an electrical echo signal.
- the transmission / reception unit 301 receives an echo signal via the ultrasonic endoscope 2.
- the transmission / reception unit 301 amplifies the echo signal.
- the transmission / reception unit 301 samples the echo signal amplified at an appropriate sampling frequency (for example, 50 MHz), discretizes it, generates RF data, and outputs the RF data to the B-mode image data generation unit 302 and the frequency analysis unit 303. .
- an appropriate sampling frequency for example, 50 MHz
- step S2 the B-mode image data generating unit 302 performs amplification (STC correction) of the RF data based on, for example, the relationship between the amplification factor and the reception depth shown in FIG.
- the B-mode image data generation unit 302 generates B-mode image data using the RF data output from the transmission / reception unit 301.
- step S3 the frequency analysis unit 303 calculates frequency spectrum data from the RF data generated in step S2 (frequency analysis step).
- the frequency analysis unit 303 divides the RF data (line data) of each sound ray into a plurality of pieces at a relatively short predetermined time interval, and performs frequency analysis by FFT operation on the RF data of each of the divided sections to thereby obtain all the RF data. Calculate frequency spectrum data for the string.
- FIG. 13 is a flowchart showing an outline of the processing executed by the frequency analysis unit 303 in step S3.
- the frequency analysis processing will be described in detail with reference to the flowchart shown in FIG.
- step S21 the frequency analyzing unit 303, a counter k for identifying the sound ray analyzed and k 0.
- This initial value k 0 is the number of the rightmost sound ray in the analysis range in FIG.
- step S22 the frequency analysis unit 303 sets an initial value Z (k) 0 of a data position (corresponding to the reception depth) Z (k) representing a series of RF data strings acquired for the FFT operation.
- FIG. 4 shows a case where the eighth data position of the sound ray SR k is set as the initial value Z (k) 0 as described above.
- the initial value Z (k) 0 is a data position representing the RF data string at the shallowest in the analysis range on the sound ray SR k .
- the frequency analysis unit 303 acquires the RF data string (step S23), and applies the window function stored in the storage unit 314 to the acquired RF data string (step S24).
- the window function By applying the window function to the RF data string in this way, it is possible to prevent the RF data string from becoming discontinuous at the boundary and to prevent the occurrence of artifacts.
- the frequency analysis unit 303 determines whether or not the RF data string at the data position Z (k) is a normal RF data string (Step S25).
- the RF data string needs to have a power-of-two data number.
- the number of data of the normal RF data string is assumed to be 2 n (n is a positive integer).
- the data position Z (k) is set to be as close as possible to the center of the RF data string to which Z (k) belongs.
- the RF data strings F 1 , F 2 , F 3 ,..., F K-1 are all normal.
- step S25 If the result of the determination in step S25 is that the RF data string at the data position Z (k) is normal (step S25: Yes), the frequency analysis unit 303 proceeds to step S27 described below.
- step S25 If the result of the determination in step S25 is that the RF data string at the data position Z (k) is not normal (step S25: No), the frequency analysis unit 303 inserts zero data into the shortage to convert the normal RF data string. It is generated (step S26).
- the window function is applied to the RF data string determined to be abnormal in step S25 (for example, the RF data string F K in FIG. 5) before adding zero data. Therefore, even if zero data is inserted into the RF data string, data discontinuity does not occur.
- step S26 the frequency analysis unit 303 proceeds to step S27 described below.
- step S27 the frequency analysis unit 303 performs an FFT operation on the RF data string to calculate V (f, L) corresponding to the frequency distribution of the voltage amplitude of the echo signal. After that, the frequency analysis unit 303 performs logarithmic conversion processing on V (f, L) to obtain frequency spectrum data S (f, L) (step S27).
- step S28 the frequency analysis unit 303 changes the data position Z (k) by the step width D. It is assumed that the storage unit 314 previously stores the input value of the operator via the keyboard 5 for the step width D.
- the frequency analysis unit 303 determines whether or not the data position Z (k) is larger than the maximum value Z (k) max of the sound ray SR k (Step S29).
- the maximum value Z (k) max is a data position representing the deepest RF data string in the analysis range on the sound ray SR k .
- the frequency analysis unit 303 increases the counter k by 1 (Step S30). This means that the processing is shifted to the next sound ray.
- the frequency analysis unit 303 returns to Step S23.
- step S31 frequency analysis unit 303
- the counter k is equal to or greater than the maximum value k max (step S31).
- the frequency analysis unit 303 ends a series of frequency analysis processing.
- the frequency analysis unit 303 returns to Step S22.
- the maximum value k max is the number of the leftmost ray in the analysis range in FIG.
- the frequency analysis unit 303 performs a plurality of FFT operations for each (k max- k 0 +1) sound ray in the analysis target area for each depth.
- the result of the FFT operation is stored in storage unit 314 (spectral data storage unit 314b) together with the reception depth and the reception direction.
- Step S2 and step S3 may be performed in reverse order or may be performed in parallel.
- step S ⁇ b> 4 the control unit 313 checks whether a cauterization instruction with a cauterization needle has been input from the operator via a button or a menu (not shown) of the ultrasonic endoscope 2 or the keyboard 5.
- the control unit 313 proceeds to Step S5.
- the control unit 313 proceeds to step S13.
- step S5 the control unit 313 switches the output destinations of the first switching unit 304 and the second switching unit 305. Specifically, by the switching process in step S5, the first switching unit 304 and the second switching unit 305 switch so that each output destination illustrated in FIG. 1 contacts the upper right terminal. That is, first switching section 304 switches from the transmission path output to superimposition section 310 and storage section 314 (image data storage section 314a) to the transmission path output to movement amount estimation section 306 and superposition section 310. Further, the second switching unit 305 switches from the transmission path output to the storage unit 314 (spectral data storage unit 314b) to the transmission path output to the difference feature amount calculation unit 308 (see FIG. 1).
- step S6 the B-mode image data generation unit 302 performs amplification (STC correction) of the RF data received by the transmission / reception unit 301 after the cauterization instruction is input, and generates B-mode image data.
- the RF data obtained here is RF data during cauterization.
- step S7 the frequency analysis unit 303 calculates frequency spectrum data from the RF data generated in step S6.
- the frequency analysis unit 303 divides the RF data (line data) of each sound ray into a plurality of pieces at a relatively short predetermined time interval in the same manner as in step S3 described above, and applies the frequency By performing the analysis, the frequency spectrum data for all the RF data strings is calculated.
- Steps S6 and S7 may be performed in reverse order or may be performed in parallel.
- step S8 the moving amount estimating unit 306 uses the B-mode image before cauterization and the B-mode image during cauterization to extract the subject or a part thereof (blood vessel or tumor) depicted in the B-mode image before cauterization. Is estimated in the B-mode image being cauterized. Then, the reading unit 307 reads the frequency spectrum data acquired before the cauterization from the storage unit 314 (spectral data storage unit 314b), and performs coordinate transformation using the movement amount estimated by the movement amount estimation unit 306. The reading unit 307 outputs the frequency spectrum data after the coordinate conversion to the difference feature amount calculating unit 308.
- step S9 the difference spectrum calculation unit 308a converts the frequency spectrum data obtained before the ablation and after the coordinate conversion from the frequency spectrum data obtained during the ablation into azimuth and depth or orthogonal coordinates defined by each other, Subtract with matching frequencies.
- the difference spectrum calculator 308a calculates difference spectrum data by calculating the difference between the frequency spectrum data for each frequency as described above (see FIG. 10).
- step S10 the regression analysis unit 308b obtains a difference feature amount by calculating a difference feature amount of the difference spectrum data by approximating a plurality of difference spectrum data output from the difference spectrum calculation unit 308a with a straight line. See FIG. 11). Steps S9 and S10 described above correspond to a difference feature amount calculation step.
- step S11 the analysis image data generation unit 309 generates analysis image data in which visual information related to the difference feature amount calculated by the regression analysis unit 308b is assigned to each pixel of the image in the B-mode image data ( Analysis image data generation step).
- step S12 the superimposition unit 310 combines the B-mode image data generated by the B-mode image data generation unit 302 in step S6 with the analysis image data generated by the analysis image data generation unit 309 in step S11, and calculates a difference. It generates superimposed image data in which visual information related to the feature amount is superimposed on each pixel of the image in the B-mode image data, and outputs the superimposed image data to the display image data generation unit 311. After outputting the generated superimposed image data to the display image data generation unit 311, the control unit 313 proceeds to step S14.
- step S4 when there is no cauterization instruction and only the B-mode image data is input (step S4: No), the superimposition unit 310 does not superimpose the analysis image data and directly displays the analysis image data.
- the data is output to the data generator 311 (step S13).
- the control unit 313 After outputting the B-mode image data to the display image data generation unit 311, the control unit 313 proceeds to step S14.
- step S14 the display image data generation unit 311 performs thinning, gradation processing, and the like on the superimposed image data or the B-mode image data generated by the superimposition unit 310 according to the display range of the image on the display device 4. Is performed to generate display image data.
- the control unit 313 causes the display device 4 to display an image corresponding to the display image data (Step S15).
- FIG. 14 shows a display example of an image (called a superimposed image) corresponding to the superimposed image data.
- the ablation region R C generated based on the difference feature quantity, superimposed image W 30 superimposed on the acquired B-mode image during ablation is displayed.
- a superimposed image representing the ablation region can be displayed on the display device 4 in real time.
- step S16 the control unit 313 determines whether the transmitting / receiving unit 301 has received a new echo signal from the ultrasonic endoscope 2. If the control unit 313 determines that the transmission / reception unit 301 has received a new echo signal (step S16: Yes), the control unit 313 proceeds to step S4 and repeats the above-described processing. On the other hand, when the control unit 313 has not received a new echo signal, for example, has not received an echo signal even after a predetermined time has elapsed from the time when the previous echo signal was acquired (step S16: No), The process ends.
- the image and the frequency spectrum data before the ablation and the various images and various data during the ablation are exemplified.
- the image may be after the ablation instead of during the ablation. Absent. This is as described above.
- difference spectrum data is calculated from the frequency spectrum data before cauterization calculated by the frequency analysis unit 303 and the frequency spectrum data during / after cauterization, and the difference spectrum data is calculated.
- the frequency spectrum data before cauterization is based on the movement amount of the subject or a part thereof (blood vessel or tumor) estimated from the B-mode image data before cauterization and the B-mode image data during / after cauterization.
- the coordinate conversion is performed based on the frequency spectrum data during / after the ablation.
- a superimposed image can be acquired only by acquiring echo signals having different time phases. Therefore, when generating a comparison image before and after treatment, an increase in operation time is reduced. It is possible to suppress and reduce the burden on the patient.
- the difference feature amount of the frequency spectrum obtained from the same subject is calculated, the influence of the attenuation of the echo signal is eliminated, and the reproducibility between different time phases is reduced. It is possible to acquire image data expressing a certain objective difference.
- the difference feature amount b (intercept) is used as the difference feature amount, a frequency spectrum at 0 MHz is observed, and image data with further reduced influence of attenuation can be obtained.
- the echo signal is acquired using the same ultrasonic probe before and during / after cauterization, and the frequency spectrum is calculated. It is possible to obtain reproducible image data excluding the influence of a machine difference such as a sensitivity difference.
- the completion of the treatment can be determined by detecting that the difference between the frequency spectrum data is reduced or that the once-largely changed difference is no longer changed. With this detection processing, the operator can grasp the completion of the treatment.
- FIG. 15 is a block diagram showing a configuration of an ultrasonic diagnostic system 1A including an ultrasonic observation device 3A according to Embodiment 2 of the present invention.
- the difference feature amount calculation unit 308 calculates the difference spectrum data and calculates the difference feature amount from the difference spectrum data.
- the difference feature amount calculation unit 308 calculates the difference feature amount.
- the unit 308A calculates a feature amount from the frequency spectrum data before cauterization and the frequency spectrum data during / after cauterization, and calculates a difference feature amount using the feature amount before cauterization and the feature amount during / after cauterization. Is calculated.
- the cautery may be performed after the cautery instead of during the cautery. Therefore, the following description will be made without discriminating between the two.
- the ultrasonic diagnostic system 1A according to the second embodiment includes an ultrasonic observation device 3A instead of the ultrasonic observation device 3 in the configuration of the ultrasonic diagnostic system 1 according to the first embodiment.
- the ultrasonic observation apparatus 3A includes a difference feature value calculation unit 308A instead of the difference feature value calculation unit 308 described above.
- the configuration other than the difference feature amount calculation unit 308A is the same as the configuration of the ultrasonic observation apparatus 3 described above.
- the difference feature amount calculation unit 308 ⁇ / b> A calculates the difference feature amount based on the frequency spectrum data during / after the ablation calculated by the frequency analysis unit 303 and the frequency spectrum data before the ablation obtained from the reading unit 307.
- the difference feature amount calculation unit 308A includes a regression analysis unit 308c and a subtraction unit 308d.
- the regression analysis unit 308c determines the frequency spectrum data before cauterization and the frequency spectrum data during and after cauterization in the same manner as the above-described regression analysis unit 308b, and simply obtains the frequency spectrum data in the predetermined frequency band. By performing a regression analysis and approximating the frequency spectrum data with a linear expression (regression line), a feature amount characterizing the approximated linear expression is calculated. Therefore, the regression analysis unit 308c calculates the feature value before cauterization and the feature value during / after cauterization.
- FIG. 16 is a diagram for explaining calculation of a frequency feature amount using a frequency spectrum before cauterization.
- FIG. 17 is a diagram for explaining calculation of a difference feature amount performed by the difference feature amount calculation unit 308A according to Embodiment 2 of the present invention, and illustrates a regression line calculated from frequency spectrum data before cauterization, It is a figure which shows the regression line calculated from the frequency spectrum data during / after cauterization.
- the regression analysis section 308c is configured to calculate a feature amount a 10, b 10, c 10 from the regression line L 10 that are generated based on the frequency spectrum data S P 1 before ablation, during ablation / calculates a feature amount a 20, b 20, c 20 from the regression line L 20 that are generated based on the frequency spectrum after ablation data S P 2 (see FIG. 9).
- the subtraction unit 308d calculates a difference feature value obtained by calculating a difference between the feature value before cauterization and the feature value during / after cauterization.
- Subtraction unit 308d is, for example, mid band when using a fitting c, a feature quantity c 20 based on the frequency spectrum data S P 2 obtained during ablation, the frequency spectral data obtained before ablation S P 1 as the feature quantity It acquires difference feature quantity by calculating the difference between the feature quantity c 10 based on.
- the frequency spectrum data before cauterization is the subject estimated from B-mode image data before cauterization and B-mode image data during / after cauterization or a part thereof (The coordinate transformation is performed based on the movement amount of a blood vessel or a tumor), and the position with the frequency spectrum data during / after the ablation is associated.
- the second embodiment of the present invention when acquiring a plurality of pieces of image information having different time phases, it is possible to acquire image information with high reproducibility.
- the regression analysis unit 308c may perform attenuation correction on the feature amount calculated from the frequency spectrum data.
- the attenuation amount A (f, z) generated during the reciprocation of the ultrasonic wave between the reception depth 0 and the reception depth z is represented by the linearity of the amplitude before and after the reciprocation of the ultrasonic wave. It can be expressed as change (difference in decibels). It is known that the attenuation amount A (f, z) of the amplitude depends on the frequency when the subject is a living body, and the attenuation is large at a high frequency and small at a low frequency. Particularly, it is empirically known that the frequency is proportional to the frequency in a uniform tissue, and is expressed by the following equation (7).
- a (f, z) 2 ⁇ zf (7)
- the proportionality constant ⁇ is an amount called an attenuation rate.
- z is the reception depth of the ultrasonic wave
- f is the frequency.
- a specific value of the attenuation rate ⁇ is determined according to a part or tissue of the living body. In a normal liver, it is approximately 0.55 dB / cm / MHz. Note that the value of the attenuation rate ⁇ is stored in the storage unit 314 in advance, and the regression analysis unit 308c reads out the value of the attenuation rate ⁇ ⁇ from the storage unit 314 as appropriate and uses it.
- the regression analysis unit 308c An appropriate value of the attenuation rate ⁇ ⁇ corresponding to a site name or a tissue name is read and used for the following attenuation correction. Further, when the ultrasonic observation apparatus 3A directly receives the value of the attenuation rate ⁇ ⁇ from the operator, the regression analysis unit 308c uses the value for the following attenuation correction. When the ultrasonic observation apparatus 3A does not receive any input from the operator, the regression analysis unit 308c uses the above 0.55 dB / cm / MHz for the following attenuation correction.
- the regression analysis unit 308c performs attenuation correction on the calculated feature amounts (for example, the slope a 0 , the intercept b 0 , and the mid-band fit c 0 ) according to the following equations (8) to (10).
- a a 0 + 2 ⁇ z (8)
- b b 0 (9)
- the regression analysis unit 308c performs a larger correction for the inclination and the midband fit as the ultrasound reception depth z is larger.
- the correction for the intercept is an identity transformation. This is because the intercept is a frequency component corresponding to the frequency 0 (Hz) and is not affected by attenuation.
- the regression analysis unit 308c outputs the attenuation-corrected correction feature amounts a, b, and c to the subtraction unit 308d.
- the subtraction unit 308d obtains a difference feature amount by calculating a difference between the corrected feature amount during / after cauterization and the corrected feature amount before cauterization.
- a circuit having each function may be connected to each other via a bus, or some of the functions may be built in a circuit structure of another function. .
- the ultrasonic endoscope 2 having an optical system such as a light guide has been described as an ultrasonic probe.
- the present invention is not limited to the ultrasonic endoscope 2, and an imaging optical system and An ultrasonic probe having no imaging element may be used.
- a small-diameter ultrasonic miniature probe without an optical system may be applied as the ultrasonic probe.
- Ultrasound miniature probes are usually inserted into the biliary tract, bile duct, pancreatic duct, trachea, bronchus, urethra, ureter, and used to observe surrounding organs (pancreas, lung, prostate, bladder, lymph nodes, etc.).
- an extracorporeal ultrasonic probe that irradiates ultrasonic waves from the body surface of the subject may be applied as the ultrasonic probe.
- the extracorporeal ultrasonic probe is usually used in direct contact with the body surface when observing abdominal organs (liver, gall bladder, bladder), breast (particularly mammary gland), and thyroid.
- the ultrasonic transducer 21 may be a linear vibrator, a radial vibrator, or a convex vibrator, as long as the ultrasonic vibrator 21 is of a different model.
- the ultrasonic transducer is a linear transducer, its scanning area is rectangular (rectangular or square).
- the ultrasonic transducer is a radial transducer or a convex transducer, its scanning area is fan-shaped or annular.
- the ultrasonic transducer 21 may be one in which piezoelectric elements are two-dimensionally arranged.
- the ultrasonic endoscope may be one that mechanically scans the ultrasonic vibrator, or provides a plurality of elements as an ultrasonic vibrator in an array, and electronically switches elements involved in transmission and reception.
- electronic scanning may be performed by delaying transmission and reception of each element.
- the ultrasonic probe and the ultrasonic observation device are described as being provided separately, the ultrasonic probe and the ultrasonic observation device may be integrated.
- the ultrasonic observation apparatus As described above, the ultrasonic observation apparatus, the operation method of the ultrasonic observation apparatus, and the computer-readable recording medium according to the present invention provide a highly reproducible image information when acquiring a plurality of pieces of image information having different time phases. Useful to get.
Landscapes
- Engineering & Computer Science (AREA)
- Health & Medical Sciences (AREA)
- Physics & Mathematics (AREA)
- Life Sciences & Earth Sciences (AREA)
- Radar, Positioning & Navigation (AREA)
- Remote Sensing (AREA)
- General Physics & Mathematics (AREA)
- Computer Networks & Wireless Communication (AREA)
- Radiology & Medical Imaging (AREA)
- Public Health (AREA)
- Medical Informatics (AREA)
- Molecular Biology (AREA)
- Surgery (AREA)
- Animal Behavior & Ethology (AREA)
- General Health & Medical Sciences (AREA)
- Heart & Thoracic Surgery (AREA)
- Veterinary Medicine (AREA)
- Acoustics & Sound (AREA)
- Biomedical Technology (AREA)
- Pathology (AREA)
- Nuclear Medicine, Radiotherapy & Molecular Imaging (AREA)
- Biophysics (AREA)
- Vascular Medicine (AREA)
- Ultra Sonic Daignosis Equipment (AREA)
Abstract
本発明にかかる超音波観測装置(3)は、被検体で後方散乱された超音波を受信する超音波プローブ(2)が取得した超音波信号を受信する超音波観測装置(3)において、第1の超音波信号、および該第1の超音波信号とは取得時刻の異なる第2の超音波信号のそれぞれについて第1の周波数スペクトルデータおよび第2の周波数スペクトルデータを生成する周波数解析部(303)と、第1および第2の周波数スペクトルデータの差を特徴量とした差分特徴量を算出する差分特徴量算出部(308)と、差分特徴量に応じた色情報を付与した解析画像データを生成する解析画像データ生成部(309)と、を備える。
Description
本発明は、超音波を用いて患者や動物等の組織を被検体として観測する超音波観測装置、超音波観測装置の作動方法およびコンピュータ読み取り可能な記録媒体に関する。
従来、超音波を用いた生体組織等、被検体の画像化技術として、被検体で後方散乱された超音波エコーを超音波振動子で受信して超音波信号へ変換し、変換された超音波信号に基づいて画像化する技術が知られている。なお、音波の散乱とは、音波が媒体中で粒子と衝突したりして力を及ぼしあうこと(これを相互作用という)によって、音波がその進行方向を変えられる物理現象である。さらに、後方散乱とは、散乱のうち音源の方向に戻ってくる成分のことである。この現象は一般に反射とも言われるが、本願では以下、後方散乱の語を用いる。このときの音源は超音波振動子である。医師等の術者は、表示装置に表示された、超音波信号に基づく超音波画像を見ることによって被検体を観察または診断する。
ところで、上述した超音波振動子を備えた超音波プローブを用いて、被検体の処置を行うことがある。例えば、超音波プローブを用いて被検体を観察しながら、焼灼針を被検体に穿刺して焼灼を行うことがある。この際に、治療のモニタリングや、治療効果の確認のため、治療前と、治療中または治療後との差分情報を視覚化する技術が知られている(例えば、特許文献1を参照)。特許文献1では、治療前の画像情報と、治療後の画像情報とを用いて差分情報を生成し、表示している。特許文献1における画像情報として、超音波振動子により得られる情報や、X線CT(Computed Tomography)装置により得られる情報、MRI(Magnetic Resonance Imaging:核磁気共鳴画像)装置により得られる情報などが挙げられる。
X線CT装置を用いて差分情報を生成する場合、軟部組織の撮像には造影が必要である。しかしながら、そもそも正常組織を繰り返し造影することを想定し、造影剤注入後に全く同じ時相で撮像しても、造影剤の拡散状態を全く同じに揃えることは難しい。まして、異なる時相で造影する場合には、CT画像は再現性が乏しく、互いに比較しても客観的な相違は得られない。さらに、同じ軟部組織の差を観察する必要があるが、異なる時相において、撮像装置に対する被検体の姿勢が同じ配置にならない場合がある。このため、CT画像は再現性が乏しく、異なる時相の画像を比較しても客観的な相違を得られない。そして、術中、都度、撮像配置に注意を払いながら、煩雑な操作を実施して造影CT画像を撮像することは、手術時間の延長を招き患者や術者に負担を増加させる。
MRI装置を用いて差分情報を生成する場合、X線CT装置で述べた課題を伴うことは同じである。さらに、MRI装置は、1セットの画像を撮像するのに時間を要し、手術時間の延長を招いて患者や術者に負担を増加させる。MRI装置も術中のモニタリングには適さないことは自明である。
超音波振動子を用いて差分情報を生成する場合、例えばBモード画像では、超音波の伝播経路に伴って異なる減衰分布や音速分布の影響を受けるため、Bモード画像は再現性が乏しく、互いに比較しても客観的な相違を得られない。まして、治療の異なる時相で造影する場合には、治療に伴って伝播経路の減衰分布や音速分布の変化が生じるため、この課題が顕著に現れる。
また、超音波信号から得られる弾性画像を用いて差分情報を生成する場合、術者が超音波プローブを操作して、超音波振動子により被検体を加圧する必要がある。実際には、超音波振動子の開口面を被検体の表面に当接した上で、超音波プローブへ力を加えることで被検体を加圧することが通例である。しかし、術者による超音波プローブの操作によって毎回同じ力で被検体を加圧することは難しく、再現性が低いため、差分情報の生成には適していない。
本発明は、上記に鑑みてなされたものであって、時相が異なる複数の画像情報を取得する際に、再現性の高い画像情報を取得することができる超音波観測装置、超音波観測装置の作動方法およびコンピュータ読み取り可能な記録媒体を提供することを目的とする。
上述した課題を解決し、目的を達成するために、本発明に係る超音波観測装置は、被検体へ超音波を送信し、該被検体で後方散乱された超音波を受信する超音波プローブが取得した超音波信号を受信する超音波観測装置において、第1の超音波信号、および該第1の超音波信号とは取得時刻の異なる第2の超音波信号のそれぞれについて第1の周波数スペクトルデータおよび第2の周波数スペクトルデータを生成する周波数解析部と、前記第1の周波数スペクトルデータと前記第2の周波数スペクトルデータとの差を特徴量として差分特徴量を算出する差分特徴量算出部と、前記差分特徴量に応じた色情報を付与した解析画像データを生成する解析画像データ生成部と、を備えることを特徴とする。
本発明に係る超音波観測装置は、上記発明において、前記差分特徴量算出部は、前記第1の周波数スペクトルデータと、前記第2の周波数スペクトルデータとの差を表現する差分スペクトルデータを算出する差分スペクトル算出部と、前記差分スペクトルデータの回帰分析を行って差分特徴量を算出する回帰分析部と、を有することを特徴とする。
本発明に係る超音波観測装置は、上記発明において、前記差分特徴量算出部は、前記第1の周波数スペクトルデータの回帰分析を行って第1の特徴量を算出するとともに、前記第2の周波数スペクトルデータの回帰分析を行って第2の特徴量を算出する回帰分析部と、前記第1の特徴量と前記第2の特徴量とを減算処理して差分特徴量を算出する減算部と、を有することを特徴とする。
本発明に係る超音波観測装置は、上記発明において、前記回帰分析部は、前記第1および第2の周波数スペクトルデータにおける所定の周波数帯域を一次式で近似し、前記一次式の切片および傾き、ならびに前記周波数帯域の中間周波数における前記一次式の値のうちのいずれかを前記差分特徴量として算出することを特徴とする。
本発明に係る超音波観測装置は、上記発明において、前記第1の超音波信号に基づいて第1の超音波画像データを生成し、前記第2の超音波信号に基づいて第2の超音波画像データを生成する超音波画像データ生成部と、前記第2の超音波画像データに描出される被検体に対する前記第1の超音波画像データに描出される前記被検体の、位置の変化量および/または回転角の少なくとも一方を含む移動量を推定する移動量推定部と、前記移動量推定部が推定した該移動量に応じて前記第1の周波数スペクトルデータの補正を行う補正部と、前記第2の超音波画像データに前記解析画像データを重畳する重畳部と、をさらに備え、前記差分特徴量算出部は、前記補正部による補正後の第1の周波数スペクトルデータと、前記第2の周波数スペクトルデータとを用いて前記差分特徴量を補正することを特徴とする。
本発明に係る超音波観測装置は、上記発明において、前記解析画像データ生成部は、前記第2の超音波信号に基づく第2の超音波画像データにおける各画素位置に、差分特徴量に応じた色情報を割り当てた前記解析画像データを生成し、前記第2の超音波画像データに前記解析画像データを重畳した重畳画像データを生成する重畳部と、前記重畳画像データを表示装置の表示方式に応じた処理を施して表示画像データを生成する表示画像データ生成部と、をさらに備えることを特徴とする。
本発明に係る超音波観測装置の作動方法は、被検体へ超音波を送信し、該被検体で後方散乱された超音波を受信する超音波プローブが取得した超音波信号を受信する超音波観測装置の作動方法であって、周波数解析部が、第1の超音波信号、および該第1の超音波信号とは取得時刻の異なる第2の超音波信号のそれぞれについて第1の周波数スペクトルデータおよび第2の周波数スペクトルデータを生成する周波数解析ステップと、差分特徴量算出部が、前記第1の周波数スペクトルデータと前記第2の周波数スペクトルデータとの差を特徴量とした差分特徴量を算出する差分特徴量算出ステップと、解析画像データ生成部が、前記差分特徴量に応じた色情報を付与した解析画像データを生成する解析画像データ生成ステップと、を含むことを特徴とする。
本発明に係るコンピュータ読み取り可能な記録媒体は、実行可能なプログラムが記録された非一時的なコンピュータ読み取り可能な記録媒体であって、前記プログラムは、プロセッサに以下を実行するように指示する:周波数解析部が、第1の超音波信号、および該第1の超音波信号とは取得時刻の異なる第2の超音波信号のそれぞれについて第1の周波数スペクトルデータおよび第2の周波数スペクトルデータを生成し、差分特徴量算出部が、前記第1の周波数スペクトルデータと前記第2の周波数スペクトルデータとの差を特徴量とした差分特徴量を算出し、解析画像データ生成部が、前記差分特徴量に応じた色情報を付与した解析画像データを生成することを特徴とする。
本発明によれば、時相が異なる複数の画像情報を取得する際に、再現性の高い画像情報を取得することができるという効果を奏する。
以下、添付図面を参照して、本発明を実施するための形態(以下、「実施の形態」という)を説明する。
(実施の形態1)
図1は、本発明の実施の形態1に係る超音波観測装置3を備えた超音波診断システム1の構成を示すブロック図である。同図に示す超音波診断システム1は、被検体へ超音波を送信し、該被検体で後方散乱された超音波を受信する超音波内視鏡2と、接続された超音波内視鏡2が取得した超音波信号に基づいて超音波画像を生成する超音波観測装置3と、超音波観測装置3が生成した超音波画像を表示する表示装置4と、を備える。本実施の形態では、超音波内視鏡2が、超音波プローブとして作用する。なお、以下に示すブロック図では、実線の矢印が画像にかかる電気信号の伝送を示し、一点鎖線の矢印が周波数スペクトルのデータまたは特徴量の伝送を示し、破線の矢印が制御やその他にかかる電気信号やデータの伝送を示している。
図1は、本発明の実施の形態1に係る超音波観測装置3を備えた超音波診断システム1の構成を示すブロック図である。同図に示す超音波診断システム1は、被検体へ超音波を送信し、該被検体で後方散乱された超音波を受信する超音波内視鏡2と、接続された超音波内視鏡2が取得した超音波信号に基づいて超音波画像を生成する超音波観測装置3と、超音波観測装置3が生成した超音波画像を表示する表示装置4と、を備える。本実施の形態では、超音波内視鏡2が、超音波プローブとして作用する。なお、以下に示すブロック図では、実線の矢印が画像にかかる電気信号の伝送を示し、一点鎖線の矢印が周波数スペクトルのデータまたは特徴量の伝送を示し、破線の矢印が制御やその他にかかる電気信号やデータの伝送を示している。
超音波内視鏡2は、その先端部に、超音波観測装置3から受信した電気的なパルス信号を超音波パルス(音響パルス)に変換して被検体へ照射するとともに、被検体で後方散乱された超音波エコーを電圧変化で表現する電気的なエコー信号に変換する超音波振動子21を有する。
超音波内視鏡2は、被検体への長尺の挿入部を有している。挿入部は、通常はその先端部に、さらに、撮像光学系および撮像素子を有しており、被検体が人体内部の組織である場合には、消化管(食道、胃、十二指腸、大腸)、または呼吸器(気管、気管支)へ挿入され、消化管や呼吸器、その周囲臓器(膵臓、胆嚢、胆管、胆道、リンパ節、縦隔臓器、血管等)を撮像することが可能である。また、挿入部は、通常、撮像時に被検体を照射する照明光を導く長尺のライトガイドを内蔵する。このライトガイドは、その先端部が挿入部の先端まで達している一方、基端部が照明光を発生する光源装置に接続されている。
超音波観測装置3は、送受信部301、Bモード画像データ生成部302、周波数解析部303、第1切替部304、第2切替部305、移動量推定部306、読出部307、差分特徴量算出部308、解析画像データ生成部309、重畳部310、表示画像データ生成部311、入力部312、制御部313、および記憶部314を備える。
送受信部301は、超音波内視鏡2と電気的に接続され、所定の波形および送信タイミングに基づいて高電圧パルスからなる送信信号(パルス信号)を超音波振動子21へ送信するとともに、超音波振動子21から電気的な高周波(RF:Radio Frequency)信号であるエコー信号を受信し、エコー信号に後述のA/D変換処理を施してデジタルデータ(以下、RFデータという)を生成、出力する。
具体的には、送受信部301は、受信したエコー信号を増幅する。送受信部301は、増幅したエコー信号に対してフィルタリング等の処理を施した後、適当なサンプリング周波数(例えば50MHz)でサンプリングして離散化(いわゆるA/D変換処理)する。こうして、送受信部301は、増幅後のエコー信号から離散化されたRFデータを生成し、Bモード画像データ生成部302および周波数解析部303へ出力する。なお、超音波内視鏡2が複数の素子をアレイ状に設けた超音波振動子21を電子的に走査させる構成を有する場合、送受信部301は、複数の素子に対応したビーム合成用の多チャンネル回路を有する。
送受信部301が送信するパルス信号の周波数帯域は、超音波振動子21がパルス信号を超音波パルスへ電気音響変換をする際の、超音波振動子21の線型応答周波数帯域をほぼカバーする広帯域にする。また、送受信部301におけるエコー信号の各種処理周波数帯域は、超音波振動子21が超音波エコーをエコー信号へ音響電気変換する際の、超音波振動子21の線型応答周波数帯域をほぼカバーする広帯域にする。これらにより、後述する周波数スペクトルの近似処理を実行する際、精度のよい近似を行うことが可能となる。
Bモード画像データ生成部302は、送受信部301から受信したRFデータをもとにBモード画像データを生成する。具体的には、Bモード画像データ生成部302は、受信深度が大きいRFデータほど高い増幅率で増幅するSTC(Sensitivity Time Control)補正を行う。図2は、送受信部301が行う増幅処理における受信深度と増幅率との関係を示す図である。図2は、横軸を受信深度zに、縦軸を増幅率βの常用対数をとった対数グラフである。縦軸の単位はdB(デシベル)である。図2に示す受信深度zは、超音波の受信開始時点からの経過時間に基づいて算出される量である。図2に示す対数グラフ上では、増幅率βは、受信深度zが閾値zthより小さい場合、受信深度zの増加に伴ってβ0からβth(>β0)へ線型に増加する。また、増幅率βは、受信深度zが閾値zth以上である場合、一定値βthをとる。閾値zthの値は、被検体から受信する超音波信号がほとんど減衰してしまい、ノイズが支配的になるような値である。なお、図2に示す関係は、予め記憶部314に記憶されている。
さらに、Bモード画像データ生成部302は、RFデータに対してバンドパスフィルタ、包絡線検波を施し、エコー信号の振幅または強度を表すデータを生成する。次に、Bモード画像データ生成部302は、このデータに対数変換など公知の処理を施し、デジタルの音線データを生成する。対数変換では、エコー信号の振幅または強度を表すデータを、基準電圧と呼ばれる特定の電圧Vcで除し、さらにその常用対数をとることで変換する。変換後のデータはデシベル値で表現される。この音線データは、超音波パルスの後方散乱の強さを示すエコー信号の振幅または強度を10進数で表現した桁に比例する値が、超音波パルスの送受信方向(深度方向)に沿って並んだデータである。
図3は、超音波振動子21の走査領域(以下、単に走査領域ということもある)と音線データとを模式的に示す図である。図3に示す走査領域Sは扇形をなしている。なお、図3では、超音波振動子21が、超音波が往復する経路(音線)を直線で、音線データを各音線上に並んだ点で表現している。図3では、後の説明の都合上、各音線に、走査開始(図3右)から順に、1、2、3・・・と番号を付し、1番目の音線をSR1、2番目の音線をSR2、3番目の音線をSR3、・・・、k番目の音線をSRkと定義する。図3は、超音波振動子21がコンベックス振動子である場合に相当している。また、図3では、音線データの受信深度をzとして記載している。超音波振動子21の表面から照射された超音波パルスが受信深度zにある物体内で後方散乱し、超音波エコーとして超音波振動子21へ戻ってきた場合、その往復距離Lと受信深度zとの間には、z=L/2の関係がある。
さらに、Bモード画像データ生成部302は、音線データに対してゲイン処理、コントラスト処理等の公知の技術を用いた信号処理を行う。
Bモード画像データ生成部302は、生成した音線データが走査範囲を空間的に正しく表現できるよう、音線データを並べ直す座標変換を施した後、音線データ間の補間処理を施すことによって音線データ間の空隙を埋め、Bモード画像データを生成する。Bモード画像は、色空間としてRGB表色系を採用した場合の変数であるR(赤)、G(緑)、B(青)の値を一致させたグレースケール画像である。Bモード画像データ生成部302は、生成したBモード画像データを第1切替部304へ出力する。
周波数解析部303は、送受信部301が生成したRFデータに高速フーリエ変換(FFT:Fast Fourier Transform)を施して周波数解析を行うことにより周波数スペクトルのデータを算出する。具体的には、周波数解析部303は、送受信部301が生成した各音線のRFデータ(ラインデータ)を比較的短い所定の時間間隔で複数に区切り、区切った各部分のRFデータ(以下、「RFデータストリング」と呼ぶ)にFFT処理を施すことにより、音線の各部分における周波数スペクトルを算出する。ここでいう「周波数スペクトル」とは、RFデータストリングにFFT処理を施すことによって得られた「ある受信深度z(すなわち、或る往復距離L)から得られるエコー信号の強度や電圧振幅の周波数分布」を意味する。
本実施の形態1では、周波数スペクトルとしてエコー信号の電圧振幅の周波数分布を採用した場合で説明する。周波数解析部303は、電圧振幅の周波数成分V(f,L)をもとに周波数スペクトルのデータ(以下、周波数スペクトルデータともいう)を生成する場合を例として説明する。fは、周波数である。周波数解析部303は、RFデータの振幅(事実上、エコー信号の電圧振幅)の周波数成分V(f,L)を基準電圧Vcで除し、常用対数(log)をとってデシベル単位で表現する対数変換処理を施した後、適当な正の定数αを乗ずることにより、次式(1)で与えられる被検体の周波数スペクトルデータS(f,L)を生成する。
S(f,L)=α・log{V(f,L)/Vc} ・・・(1)
S(f,L)=α・log{V(f,L)/Vc} ・・・(1)
以下、具体的に、周波数解析部303での周波数解析により電圧振幅の周波数成分V(f,L)を求める方法について説明する。一般に、エコー信号の周波数スペクトルは、被検体が人体組織である場合、超音波が走査された人体組織の性状によって異なる傾向を示す。これは、周波数スペクトルが、超音波を散乱する散乱体の大きさ、数密度、音響インピーダンス等と相関を有しているためである。ここでいう「人体組織の性状」とは、例えば悪性腫瘍(癌)、良性腫瘍、内分泌腫瘍、粘液性腫瘍、正常組織、嚢胞、脈管など、組織の特徴のことである。
図4は、超音波信号の1つの音線SRk上のRFデータにおけるデータ配列を模式的に示す図である。音線SRkにおける白抜きまたは黒塗りで示す長方形は、1つのサンプル点におけるデータを意味している。また、音線SRk上のRFデータにおいて、右側に位置するデータほど、超音波振動子21から音線SRkに沿って計った場合の深い箇所からのRFデータである(図4の矢印を参照)。音線SRk上のRFデータは、前述の通り、送受信部301でのA/D変換処理によりエコー信号からサンプリングされ、離散化されたRFデータである。図4では、番号kの音線SRk上のRFデータの8番目のデータ位置を受信深度zの方向の初期値Z(k)
0として設定した場合を示しているが、初期値の位置は任意に設定することができる。周波数解析部303による算出結果は複素数で得られ、記憶部314に格納される。
図4に示すRFデータストリングFj(j=1、2、・・・、K)は、RFデータのうち、FFT処理の対象となる部分、である。一般に、FFT処理を行うためには、RFデータストリングが2のべき乗のデータ数を有している必要がある。この意味で、FK以外のRFデータストリングFj(j=1、2、・・・、K-1)はデータ数が16(=24)で正常なRFデータストリングである。一方、RFデータストリングFKは、データ数が12であるため異常なRFデータストリングである。異常なRFデータストリングに対してFFT処理を行う際には、不足分だけゼロデータを挿入することにより、正常なRFデータストリングを生成する処理を行う。この点については、周波数解析部303の処理を説明する際に詳述する(図13を参照)。この後、周波数解析部303は、前述の通り、FFT処理を実行し、電圧振幅の周波数成分V(f,L)を算出し、前述の式(1)に基づいて周波数スペクトルデータS(f,L)を算出する。周波数解析部303は、さらに、図3に示した全ての音線に対してこの作用を繰り返すことで、全方位に渡って周波数スペクトルデータS(f,L)を算出し、第2切替部305へ出力する(以下、『方位』を、図3の全走査方向に渡り、各音線データが向く方向として説明する)。
第1切替部304は、制御部313の制御のもと、Bモード画像データ生成部302が生成したBモード画像データの伝送経路の切り替えを行う。具体的には、第1切替部304は、Bモード画像データを、移動量推定部306および重畳部310か、または、重畳部310および記憶部314(後述する画像データ記憶部314a)に切り替えて出力する。
第2切替部305は、制御部313の制御のもと、周波数解析部303が生成した周波数スペクトルデータの伝送経路の切り替えを行う。具体的には、第2切替部305は、周波数スペクトルデータを、差分特徴量算出部308に出力するか、または、記憶部314(後述するスペクトルデータ記憶部314b)に切り替えて出力する。
移動量推定部306は、同一被検体から異なる時刻に取得した二つのBモード画像データを用いて、画像内に描出される被検体、もしくはその少なくとも一部を推定する。例えば、被検体もしくはその一部として、血管や腫瘍の移動量を推定する。移動量推定部306は、同一被検体であって時刻の異なる、例えば、焼灼前と焼灼中との間における被検体の移動量を推定する。移動量推定部306が推定する移動量には、Bモード画像の横方向および縦方向の移動距離と、画像の回転角度とを含む。なお、本実施の形態では、焼灼前の画像や周波数スペクトルデータと、焼灼中の各種画像や各種データを用いて例示するが、焼灼前の時点より後であれば、焼灼中ではなく焼灼後でも構わない。
図5は、焼灼針による焼灼前のBモード画像の一例を示す図である。図6は、焼灼針による焼灼中のBモード画像の一例を示す図である。図5に示すBモード画像W10には、血管(血管像BV10)および腫瘍(腫瘍像TU10)が描出されている。また、図6に示すBモード画像W20には、血管(血管像BV20)、腫瘍(腫瘍像TU20)および焼灼針(焼灼針像NE)が描出されている。以下、Bモード画像の横方向をx方向、縦方向をy方向、画像中心Oを原点、画像中心Oを中心に図5のθの方向に回転可能な座標系を用いて説明する。なお、図5には、この座標系O-xyを仮想的にBモード画像W10に重畳して示した。
移動量推定部306は、焼灼中のBモード画像W20の血管像BV20および腫瘍像TU20(図6参照)に対して、焼灼前のBモード画像W10の血管像BV10および腫瘍像TU10(図5参照)がどのように移動しているかを推定する。具体的には、移動量推定部306は、焼灼前のBモード画像W10に、x方向への移動、y方向への移動、および/または原点を中心にした回転の少なくともいずれか一つを含む座標変換を行いながら、座標変換後のBモード画像W10(正確には後述するBモード画像W11)と、Bモード画像W20との相関値を算出する。以下、Bモード画像W10の、x方向の位置変化Δx、y方向の位置変化Δy、回転の角度変化(回転角Δθ)の少なくともいずれか一つを単に、『移動量』として説明する。移動量推定部306が推定に用いる移動量は、予め設定された幅で変化していく種々の移動量や、予め設定されたパターンの移動量を用いてもよいし、キーボード5を経由した術者の入力により設定された移動量を用いてもよい。
移動量推定部306は、図5に示す焼灼前のBモード画像W10を回転角Δθで回転した後、横方向にΔx、縦方向にΔyだけ移動する座標変換を行い、Bモード画像W11を得る。図7は、Bモード画像W11を説明する図である。図7には説明の都合上、この座標系O’-x’y’を仮想的に重畳して示した。図5のBモード画像W10の任意点(x,y)の輝度を2変数関数P1(x,y)、図7のBモード画像W11の任意点(x’,y’)の輝度を2変数関数P1’(x’,y’)で表現する。このとき、下式(2)、下式(3)が成り立つ。
P1’(x’,y’)=P1(x,y)・・・(2)

P1’(x’,y’)=P1(x,y)・・・(2)
図8は、図6に示す焼灼中のBモード画像W20と、図7に示す座標変換後の焼灼前のBモード画像W11における血管および腫瘍の配置を説明する図である。移動量推定部306は、この座標変換した焼灼前のBモード画像W11と、焼灼中のBモード画像W20との相関値を算出する。なお、移動量(Δx,Δy,Δθ)(座標変換の順番は回転角Δθによる回転が先)には、すべてがゼロの場合、すなわち移動させない場合も含む。
図8のBモード画像W20の任意点(x’,y’)の輝度を2変数関数P2(x’,y’)で表現する。移動量推定部306において、移動量(Δx,Δy,Δθ)で座標変換を行ったBモード画像W11の値P1’(x’,y’)と、Bモード画像W20の値P2(x’,y’)との相関値CV(Δx,Δy,Δθ)は、下式(4)により定義される。
CV(Δx,Δy,Δθ)=∬P1’(x’,y’)
・P2(x’,y’)dx’dy’
・・・(4)
式(4)に式(2)を代入して、下式(5)を得る。ここで、xとyはどちらもx’とy’との2変数関数x(x’,y’)、y(x’,y’)と表現される。
CV(Δx,Δy,Δθ)
=∬P1(x(x’,y’),y(x’,y’))
・P2(x’,y’)dx’dy’
・・・(5)
ここで、式(3)をx(x’,y’)、y(x’,y’)について逆算して、下式(6)を得る。

移動量推定部306は、移動量(Δx,Δy,Δθ)として種々の値を式(6)の右辺へ代入し、演算結果x(x’,y’)、y(x’,y’)を、さらに式(5)の右辺へ代入することで、相関値CV(Δx,Δy,Δθ)の種々の値を算出する。一般に、式(5)の演算は相互相関と呼ばれ、Bモード画像W11とBモード画像W20との位置や向きが一致した場合に相関値CVが最大になる。なお、式(5)と式(4)には積分記号∫を用いたが、実際には、移動量推定部306は、離散的な画素の輝度値の積和を求める演算を実行する。
CV(Δx,Δy,Δθ)=∬P1’(x’,y’)
・P2(x’,y’)dx’dy’
・・・(4)
式(4)に式(2)を代入して、下式(5)を得る。ここで、xとyはどちらもx’とy’との2変数関数x(x’,y’)、y(x’,y’)と表現される。
CV(Δx,Δy,Δθ)
=∬P1(x(x’,y’),y(x’,y’))
・P2(x’,y’)dx’dy’
・・・(5)
ここで、式(3)をx(x’,y’)、y(x’,y’)について逆算して、下式(6)を得る。
移動量推定部306は、算出した種々の相関値CV(Δx,Δy,Δθ)のうち、その最大値maxCVを与える移動量(Δx0,Δy0、Δθ0)を特定する。そして、移動量推定部306は、この移動量(Δx0,Δy0、Δθ0)を、焼灼前(血管像BV10および腫瘍像TU10)から焼灼中(血管像BV20および腫瘍像TU20)までの被検体の推定移動量として、読出部307へ出力する。なお、焼灼前と焼灼中とのBモード画像において被検体に動きがなければ、推定移動量はゼロとなる。
記憶部314(スペクトルデータ記憶部314b)は焼灼前に取得した全方位、全深度z(=L/2)で算出された周波数スペクトルデータS(f,L)を記憶しておく。
読出部307は、焼灼前に取得したこの周波数スペクトルデータS(f,L)の全方位と全深度分を記憶部314(スペクトルデータ記憶部314b)から読み出して、S(f,L)の方位と深度で定義される直交座標x、yに関し、移動量推定部306が推定した移動量で座標変換を行う。読出部307は、座標変換後の周波数スペクトルデータを、差分特徴量算出部308に出力する。読出部307は、焼灼前の周波数スペクトルデータを、焼灼中の周波数スペクトルデータに合わせて補正する補正部として機能する。
読出部307は、焼灼前に取得したこの周波数スペクトルデータS(f,L)の全方位と全深度分を記憶部314(スペクトルデータ記憶部314b)から読み出して、S(f,L)の方位と深度で定義される直交座標x、yに関し、移動量推定部306が推定した移動量で座標変換を行う。読出部307は、座標変換後の周波数スペクトルデータを、差分特徴量算出部308に出力する。読出部307は、焼灼前の周波数スペクトルデータを、焼灼中の周波数スペクトルデータに合わせて補正する補正部として機能する。
差分特徴量算出部308は、周波数解析部303が算出した焼灼中の周波数スペクトルデータと、読出部307から取得し、座標変換した焼灼前の周波数スペクトルデータとに基づいて、差分特徴量を算出する。差分特徴量算出部308は、差分スペクトル算出部308aおよび回帰分析部308bを有する。
差分スペクトル算出部308aは、焼灼中の周波数スペクトルデータから、焼灼前かつ座標変換後の周波数スペクトルデータを、互いに方位・深度またはそれらで定義される直交座標や、周波数を一致させて減算する。そして、差分スペクトル算出部308aは、このように差をとった差分スペクトルデータを算出する。図9は、周波数解析部303により算出された焼灼前の周波数スペクトルと焼灼中の周波数スペクトルとの一例を示す図である。差分スペクトル算出部308aは、各周波数について、例えば、焼灼中に得られた周波数スペクトルデータSP2と、焼灼前に得られた周波数スペクトルデータSP1との差分を算出することによって、差分スペクトルデータを算出する。
図10は、焼灼前のRFデータから算出される周波数スペクトルSP1と、焼灼中のRFデータから算出される周波数スペクトルSP2との差分スペクトルSP_Dを示す図である。差分スペクトル算出部308aは、焼灼中の周波数スペクトルデータSP2と、焼灼前の周波数スペクトルデータSP1との差分を算出することによって、図10に示す差分スペクトルデータSP_Dを生成する。差分スペクトル算出部308aは、全方位と全深度ごとに差分スペクトルデータを算出する。
回帰分析部308bは、差分スペクトル算出部308aから出力された複数の差分スペクトルデータを直線で近似し、その直線を用いて差分スペクトルデータの特徴量(以下、差分特徴量という)を算出し、差分特徴量を解析画像データ生成部309へ出力する。
具体的には、回帰分析部308bは、所定周波数帯域における周波数スペクトルデータの単回帰分析を行って周波数スペクトルデータを一次式(回帰直線)で近似することにより、この近似した一次式を特徴付ける差分特徴量を算出する。単回帰分析とは、独立変数が1種類のみの場合の回帰分析である。本実施の形態での単回帰分析の独立変数は周波数fにあたる。
図11は、本発明の実施の形態1に係る回帰分析部308bが行う差分特徴量の算出を説明するための図である。例えば、回帰分析部308bは、周波数帯域Uで単回帰分析を行い差分スペクトルデータSP_Dの回帰直線LDを得る。次に、回帰分析部308bは、回帰直線LDの傾きa1、切片b1、および周波数帯域Uの中心周波数(すなわち、「ミッドバンド」)fM=(fL+fH)/2の回帰直線上の値であるミッドバンドフィット(Mid-band fit)c1=a1fM+b1を差分特徴量として算出する。このように回帰直線LDを特徴付ける一次式のパラメータ(傾きa1、切片b1、ミッドバンドフィットc1)で差分スペクトルデータSP_Dを表現することで、差分スペクトルデータSP_Dを一次式に近似したことになる。
周波数スペクトルのデータから算出される3つの差分特徴量のうち、傾きa1、切片b1は、超音波を散乱する散乱体の大きさ、散乱体の散乱強度、散乱体の数密度(濃度)等と相関を有していると考えられる。ミッドバンドフィットc1は、有効な周波数帯域内の中心におけるエコー信号の電圧振幅や強度を与える。このため、ミッドバンドフィットc1は、散乱体の大きさ、散乱体の散乱強度、散乱体の数密度に加えて、Bモード画像の輝度とある程度の相関を有していると考えられる。なお、回帰分析部308bは、回帰分析によって二次以上の多項式で周波数スペクトルのデータを近似するようにしてもよい。
図1に戻り、解析画像データ生成部309は、差分特徴量算出部308が算出した差分特徴量に応じて視覚情報を付与した解析画像データを生成する。具体的には、解析画像データ生成部309は、回帰分析部308bが算出した差分特徴量に関連する視覚情報をBモード画像データにおける画像の各画素位置に対応して割り当てた解析画像データを生成する。視覚情報としては、例えば色相、彩度、明度、輝度値、R(赤)、G(緑)、B(青)などの所定の表色系を構成する色空間の変数を挙げることができる。次に、解析画像データ生成部309は、例えば図4に示す1つのRFデータストリングFj(j=1、2、・・・、K)のデータ量に比例する深度長と、図3に示す音線間の方位間隔とで定義される画素領域に対し、そのRFデータストリングFjから算出される差分特徴量に関連する視覚情報を割り当てる。
ここで、周波数解析部303、差分特徴量算出部308、解析画像データ生成部309は、解析範囲を、図3に示す走査領域Sのうち、特定の深度幅および方位幅(すなわち、走査方向の幅)などで区切られる関心領域(Region of Interest:ROI)に限定して、上記の各処理を行ってもよい。関心領域を必要な領域に限定すれば、演算量を減らすことができ、表示するための速度を向上することができる。
重畳部310は、Bモード画像データ生成部302が生成したBモード画像データ上に、解析画像データ生成部309が生成した解析画像データを合成して、重畳画像データを生成する。
表示画像データ生成部311は、重畳部310が生成した重畳画像データまたはBモード画像データに対して、表示装置4における画像の表示レンジに応じたデータの間引きや、階調処理などの所定の処理を施した後、表示装置4に表示させる。
入力部312は、キーボード5からの操作信号に応じて、何のキー、何のメニューが選択入力されたのかの情報を含む選択信号を生成し、制御部313へ出力する。
ここで、キーボード5は、各種の情報を入力可能な複数のボタンを用いて構成され、術者からの入力を受け付ける。また、キーボード5には、表示画面を備えたタッチパネル5aが設けられている。タッチパネル5aは、例えば術者の指の接触位置に応じた入力を受け付ける。その後、キーボード5は、タッチパネル5a上で表示画面に表示される操作アイコンに従って術者がタッチ(接触)した位置(座標)や、入力があったボタンを識別するボタン番号等を含む操作信号を入力部312へ出力する。なお、タッチパネル5aは、超音波画像や各種情報を表示することで、グラフィカルユーザインターフェース(GUI)として機能する。タッチパネルとしては、抵抗膜方式、静電容量方式および光学方式等があり、いずれの方式のタッチパネルであっても適用可能である。
制御部313は、記憶部314が記憶、格納する作動プログラム等の情報や各処理の演算パラメータやデータ等を記憶部314から読み出し、超音波観測装置3の作動方法に関連した各種演算処理を実行することによって超音波観測装置3を統括して制御する。
上述した送受信部301、Bモード画像データ生成部302、周波数解析部303、第1切替部304、第2切替部305、移動量推定部306、読出部307、差分特徴量算出部308、解析画像データ生成部309、重畳部310、表示画像データ生成部311、入力部312および制御部313は、演算および制御機能を有するCPU(Central Processing Unit)等の汎用プロセッサ、またはASIC(Application Specific Integrated Circuit)もしくはFPGA(Field Programmable Gate Array)等の特定の機能を実行する専用の集積回路等を用いて実現される。なお、制御部313、Bモード画像データ生成部302をはじめ、上記のうち少なくとも一部を含む複数の部を共通の汎用プロセッサまたは専用の集積回路等を用いて構成することも可能である。
記憶部314は、各処理の演算パラメータやデータ等を記憶する。記憶部314は、Bモード画像データ生成部302が生成したBモード画像データを記憶する画像データ記憶部314aと、周波数解析部303が算出した周波数スペクトルデータを記憶する前述のスペクトルデータ記憶部314bとを有する。記憶部314は、例えば、HDD(Hard Disk Drive)を用いて構成される。
さらに、記憶部314は、上記以外にも、例えば増幅処理に必要な情報(図2に示す増幅率と受信深度との関係)、対数変換処理に必要な情報(式(1)参照、例えばα、Vcの値)、周波数解析処理に必要な窓関数(Hamming、Hanning、Blackman等)の情報等を記憶する。
また、記憶部314は、追加のメモリとして、超音波観測装置3の作動方法を実行するための作動プログラムを予めインストールした非一時的なコンピュータ読み取り可能な記録媒体、例えば図示しないROM(Read Only Memory)を設けている。作動プログラムは、携帯型ハードディスク、フラッシュメモリ、CD-ROM、DVD-ROM、フレキシブルディスク等のコンピュータ読み取り可能な記録媒体に記録して広く流通させることも可能である。なお、上述した各種プログラムは、通信ネットワークを介してダウンロードすることによって取得することも可能である。ここでいう通信ネットワークは、例えば既存の公衆回線網、LAN、WANなどによって実現されるものであり、有線、無線を問わない。
図12は、以上の構成を有する超音波観測装置3が行う処理の概要を示すフローチャートである。以下、制御部313の制御のもと、各部が動作するものとして説明する。なお、第1切替部304と第2切替部305とは、それぞれの出力先が図1に示すそれぞれの右下側の端子に接触するよう、初期設定されている。すなわち、超音波観測装置3の初期設定として、第1切替部304がBモード画像データを重畳部310および記憶部314(画像データ記憶部314a)に出力し、第2切替部305が周波数スペクトルデータを記憶部314(スペクトルデータ記憶部314b)に出力するようになっている。
ステップS1において、人体内部の組織等、被検体に対する観測が始まると、超音波振動子21は被検体を走査し、被検体から受信したエコーを電気的なエコー信号へ変換する。送受信部301は、超音波内視鏡2を経由してエコー信号を受信する。送受信部301は、そのエコー信号の増幅を行う。次に、送受信部301は、適当なサンプリング周波数(例えば50MHz)で増幅されたエコー信号をサンプリングして離散化してRFデータを生成し、Bモード画像データ生成部302および周波数解析部303へ出力する。
ステップS2において、Bモード画像データ生成部302は、例えば図2に示す増幅率と受信深度との関係に基づいてRFデータの増幅(STC補正)を行う。Bモード画像データ生成部302は、送受信部301から出力されたRFデータを用いてBモード画像データを生成する。
ステップS3において、周波数解析部303は、ステップS2で生成されたRFデータから、周波数スペクトルデータを算出する(周波数解析ステップ)。周波数解析部303は、各音線のRFデータ(ラインデータ)を比較的短い所定の時間間隔で複数に区切り、区切った各部分のRFデータにFFT演算による周波数解析を行うことによって全てのRFデータストリングに対する周波数スペクトルデータを算出する。
図13は、ステップS3において周波数解析部303が実行する処理の概要を示すフローチャートである。以下、図13に示すフローチャートを参照して、周波数解析処理を詳細に説明する。
ステップS21において、周波数解析部303は、解析対象の音線を識別するカウンタkをk0とする。この初期値k0は、図3中、解析範囲の最右の音線の番号である。
ステップS22において、周波数解析部303は、FFT演算用に取得する一連のRFデータストリングを代表するデータ位置(受信深度に対応)Z(k)の初期値Z(k)
0を設定する。例えば、図4では、上述したように、音線SRkの8番目のデータ位置を初期値Z(k)
0として設定した場合を示している。この初期値Z(k)
0は、音線SRk上での解析範囲の最浅のRFデータストリングを代表するデータ位置である。
その後、周波数解析部303は、RFデータストリングを取得し(ステップS23)、取得したRFデータストリングに対し、記憶部314が記憶する窓関数を作用させる(ステップS24)。このようにRFデータストリングに対して窓関数を作用させることにより、RFデータストリングが境界で不連続になることを回避し、アーチファクトが発生するのを防止することができる。
続いて、周波数解析部303は、データ位置Z(k)のRFデータストリングが正常なRFデータストリングであるか否かを判定する(ステップS25)。図4を参照した際に説明したように、RFデータストリングは、2のべき乗のデータ数を有している必要がある。以下、正常なRFデータストリングのデータ数を2n(nは正の整数)とする。本実施の形態では、データ位置Z(k)が、できるだけZ(k)が属するRFデータストリングの中心になるよう設定される。具体的には、RFデータストリングのデータ数は2nであるので、Z(k)はそのRFデータストリングの中心に近い2n/2(=2n-1)番目の位置に設定される。この場合、RFデータストリングが正常であるとは、データ位置Z(k)より浅い側に2n-1-1(=Nとする)個のデータがあり、データ位置Z(k)より深い側に2n-1(=Mとする)個のデータがあることを意味する。図4に示す場合、RFデータストリングF1、F2、F3、・・・、FK-1はともに正常である。なお、図4ではn=4(N=7,M=8)の場合を例示している。
ステップS25における判定の結果、データ位置Z(k)のRFデータストリングが正常である場合(ステップS25:Yes)、周波数解析部303は、後述するステップS27へ移行する。
ステップS25における判定の結果、データ位置Z(k)のRFデータストリングが正常でない場合(ステップS25:No)、周波数解析部303は、不足分だけゼロデータを挿入することによって正常なRFデータストリングを生成する(ステップS26)。ステップS25において正常でないと判定されたRFデータストリング(例えば図5のRFデータストリングFK)は、ゼロデータを追加する前に窓関数が作用されている。このため、RFデータストリングにゼロデータを挿入してもデータの不連続は生じない。ステップS26の後、周波数解析部303は、後述するステップS27へ移行する。
ステップS27において、周波数解析部303は、RFデータストリングにFFT演算を施すことにより、エコー信号の電圧振幅の周波数分布に相当するV(f,L)を算出する。その後、周波数解析部303は、V(f,L)に対数変換処理を施して、周波数スペクトルデータS(f,L)を得る(ステップS27)。
ステップS28において、周波数解析部303は、データ位置Z(k)をステップ幅Dで変化させる。ステップ幅Dについて、キーボード5を経由した術者の入力値を記憶部314が予め記憶しているものとする。図4では、D=15の場合を例示している。
その後、周波数解析部303は、データ位置Z(k)が音線SRkにおける最大値Z(k)
maxより大きいか否かを判定する(ステップS29)。この最大値Z(k)
maxは、音線SRk上での解析範囲の最深のRFデータストリングを代表するデータ位置である。データ位置Z(k)が最大値Z(k)
maxより大きい場合(ステップS29:Yes)、周波数解析部303はカウンタkを1増加させる(ステップS30)。これは、処理をとなりの音線へ移すことを意味する。一方、データ位置Z(k)が最大値Z(k)
max以下である場合(ステップS29:No)、周波数解析部303はステップS23へ戻る。
ステップS30の後、周波数解析部303は、カウンタkが最大値kmaxより大きいか否かを判定する(ステップS31)。カウンタkがkmaxより大きい場合(ステップS31:Yes)、周波数解析部303は一連の周波数解析処理を終了する。一方、カウンタkがkmax以下である場合(ステップS31:No)、周波数解析部303はステップS22に戻る。この最大値kmaxは、図3中、解析範囲の最左の音線の番号である。
このようにして、周波数解析部303は、解析対象領域内の(kmax-k0+1)本の音線の各々について深度別に複数回のFFT演算を行う。FFT演算の結果は、受信深度および受信方向とともに記憶部314(スペクトルデータ記憶部314b)に格納される。
なお、これら4種の値k0、kmax、Z(k)
0、Z(k)
maxについては、図3の全走査範囲を含むようなデフォルト値が記憶部314にあらかじめ記憶されており、周波数解析部303は適宜これらの値を読み取って、図13の処理を行う。デフォルト値を読み取った場合、周波数解析部303は全走査範囲に対して周波数解析処理を行う。しかし、この4種の値k0、kmax、Z(k)
0、Z(k)
maxは、キーボード5を経由した術者による関心領域の指示入力によって変更可能である。変更されていた場合、周波数解析部303は指示入力された関心領域においてのみ周波数解析処理を行う。
再び、図12を参照して説明する。ステップS2とステップS3とは、順序が逆であってもよいし、並行して行うようにしてもよい。
ステップS4において、制御部313は、超音波内視鏡2またはキーボード5の図示しないボタンもしくはメニューを介して、術者から焼灼針による焼灼指示が入力されているのか確認する。制御部313は、焼灼指示が入力されている場合(ステップS4:Yes)、ステップS5に移行する。一方、制御部313は、キーボード5から焼灼指示が入力されていない場合(ステップS4:No)、ステップS13に移行する。
ステップS5において、制御部313は、第1切替部304および第2切替部305の出力先を切り替える。具体的には、ステップS5の切り替え処理によって、第1切替部304と第2切替部305とは、図1に示すそれぞれの出力先が右上側の端子に接触するよう、切り替える。すなわち、第1切替部304は、重畳部310および記憶部314(画像データ記憶部314a)に出力する伝送経路から、移動量推定部306および重畳部310に出力する伝送経路に切り替える。また、第2切替部305は、記憶部314(スペクトルデータ記憶部314b)に出力する伝送経路から、差分特徴量算出部308に出力する伝送経路に切り替える(図1参照)。
ステップS6において、Bモード画像データ生成部302は、焼灼指示入力後に送受信部301が受信したRFデータの増幅(STC補正)を行い、Bモード画像データを生成する。ここで得られるRFデータは、焼灼中におけるRFデータである。
ステップS7において、周波数解析部303は、ステップS6で生成されたRFデータから、周波数スペクトルデータを算出する。周波数解析部303は、上述したステップS3と同様にして、各音線のRFデータ(ラインデータ)を比較的短い所定の時間間隔で複数に区切り、区切った各部分のRFデータにFFT演算による周波数解析を行うことによって全てのRFデータストリングに対する周波数スペクトルデータを算出する。なお、ステップS6とステップS7とは、順序が逆であってもよいし、並行して行うようにしてもよい。
ステップS8において、移動量推定部306は、焼灼前のBモード画像と、焼灼中のBモード画像とから、焼灼前のBモード画像に描出されていた被検体もしくはその一部(血管や腫瘍)が、焼灼中のBモード画像においてどれだけ移動したかを推定する。そして、読出部307は、焼灼前に取得した周波数スペクトルデータを記憶部314(スペクトルデータ記憶部314b)から読み出して、移動量推定部306が推定した移動量で座標変換を行う。読出部307は、座標変換後の周波数スペクトルデータを、差分特徴量算出部308に出力する。
ステップS9において、差分スペクトル算出部308aは、焼灼中に得られた周波数スペクトルデータから、焼灼前かつ座標変換後に得られた周波数スペクトルデータを、互いに方位・深度またはそれらで定義される直交座標や、周波数を一致させて減算する。差分スペクトル算出部308aは、このように各周波数について、周波数スペクトルデータの差分を算出することによって、差分スペクトルデータを算出する(図10参照)。
ステップS10において、回帰分析部308bは、差分スペクトル算出部308aから出力された複数の差分スペクトルデータを直線で近似することによって差分スペクトルデータの差分特徴量を算出することによって差分特徴量を取得する(図11参照)。以上ステップS9およびステップS10が、差分特徴量算出ステップに相当する。
ステップS11において、解析画像データ生成部309は、回帰分析部308bが算出した差分特徴量に関連する視覚情報をBモード画像データにおける画像の各画素に対応して割り当てた解析画像データを生成する(解析画像データ生成ステップ)。
ステップS12において、重畳部310は、ステップS6においてBモード画像データ生成部302が生成したBモード画像データと、ステップS11において解析画像データ生成部309が生成した解析画像データとを合成して、差分特徴量に関連する視覚情報をBモード画像データにおける画像の各画素に対して重畳した重畳画像データを生成し、表示画像データ生成部311へ出力する。制御部313は、生成した重畳画像データを表示画像データ生成部311へ出力後、ステップS14に移行する。
ここで、ステップS4において、重畳部310は、焼灼指示がなく、Bモード画像データのみが入力された場合には(ステップS4:No)、解析画像データの重畳は行わずに、そのまま、表示画像データ生成部311へ出力する(ステップS13)。制御部313は、Bモード画像データを表示画像データ生成部311へ出力後、ステップS14に移行する。
ステップS14において、表示画像データ生成部311は、重畳部310が生成した重畳画像データまたはBモード画像データに対して、表示装置4における画像の表示レンジに応じたデータの間引きや、階調処理などの所定の処理を施して表示画像データを生成する。
その後、制御部313は、表示画像データに応じた画像を表示装置4に表示させる(ステップS15)。図14に、重畳画像データに対応する画像(重畳画像という)の表示例示す。表示装置4の表示画面には、差分特徴量に基づいて生成された焼灼領域RCが、焼灼中に取得されたBモード画像に重畳された重畳画像W30が表示される。上述した処理を行うことによって、リアルタイムに焼灼領域を表現した重畳画像を表示装置4に表示することができる。
ステップS16において、制御部313は、送受信部301が、超音波内視鏡2から新たなエコー信号を受信したか否かを判断する。制御部313は、送受信部301が新たなエコー信号を受信したと判断した場合(ステップS16:Yes)、ステップS4に移行して、上述した処理を繰り返す。これに対し、制御部313は、新たなエコー信号を受信していない、例えば、前回エコー信号を取得した時間から所定の時間経過してもエコー信号の受信がない場合(ステップS16:No)、処理を終了する。
本実施の形態1では、焼灼前の画像や周波数スペクトルデータと、焼灼中の各種画像や各種データを用いて例示したが、焼灼前の時点より後であれば、焼灼中ではなく焼灼後でも構わない。この点は上述した通りである。
以上説明した本発明の実施の形態1では、周波数解析部303により算出された焼灼前の周波数スペクトルデータと焼灼中/焼灼後の周波数スペクトルデータとから、差分スペクトルデータを算出し、この差分スペクトルデータから差分特徴量を求めるようにした。この際、焼灼前の周波数スペクトルデータは、焼灼前のBモード画像データと、焼灼中/焼灼後のBモード画像データとから推定される被検体もしくはその一部(血管や腫瘍)の移動量に基づいて座標変換が施されており、焼灼中/焼灼後の周波数スペクトルデータとの位置は対応付いている。このように、本発明の実施の形態1では、時相が異なる複数の画像情報を取得する際に、再現性の高い画像情報を取得することができる。これにより、本実施の形態1によれば、焼灼中/焼灼後のBモード画像上に、焼灼前との差分情報である焼灼領域を正確に表示することが可能となる。
また、本発明の実施の形態1によれば、時相の異なるエコー信号を取得するのみで重畳画像を取得することができるため、治療前後の比較画像を生成する際に、手術時間の増大を抑制し、かつ患者への負担を軽減することが可能となる。
また、本発明の実施の形態1によれば、同じ被検体から取得した周波数スペクトルの差分特徴量を算出するようにしたので、エコー信号の減衰の影響を排除し、異なる時相間において再現性のある、客観的な相違を表現した画像データを取得することが可能となる。特に、差分特徴量として差分特徴量b(切片)を用いれば、0MHzでの周波数スペクトルを観測することとなり、一層減衰の影響を排除した画像データを取得することができる。
また、本発明の実施の形態1によれば、焼灼前と、焼灼中/焼灼後とで同じ超音波プローブを用いてエコー信号を取得し、周波数スペクトルを算出しているため、超音波プローブの感度差等の機体差の影響を排除した再現性のある画像データを取得することが可能となる。
また、本発明の実施の形態1において、周波数スペクトルデータの差分が減少していること、または、一度大きく変化した差分に変化がなくなったことを検知することによって、治療の完了を判断できる。この検知処理により、術者は、治療の完了を把握することが可能となる。
(実施の形態2)
続いて、本発明の実施の形態2について説明する。図15は、本発明の実施の形態2に係る超音波観測装置3Aを備えた超音波診断システム1Aの構成を示すブロック図である。上述した実施の形態1では、差分特徴量算出部308が差分スペクトルデータを算出してこの差分スペクトルデータから差分特徴量を算出するものとして説明したが、本実施の形態2では、差分特徴量算出部308Aが焼灼前の周波数スペクトルデータ、および焼灼中/焼灼後の周波数スペクトルデータから特徴量をそれぞれ算出し、焼灼前の特徴量と、焼灼中/焼灼後の特徴量とを用いて差分特徴量を算出する。なお、本実施の形態でも、焼灼前の時点より後であれば、焼灼中ではなく焼灼後でも構わないため、以下、両者を区別せず、焼灼中/焼灼後と説明する。
続いて、本発明の実施の形態2について説明する。図15は、本発明の実施の形態2に係る超音波観測装置3Aを備えた超音波診断システム1Aの構成を示すブロック図である。上述した実施の形態1では、差分特徴量算出部308が差分スペクトルデータを算出してこの差分スペクトルデータから差分特徴量を算出するものとして説明したが、本実施の形態2では、差分特徴量算出部308Aが焼灼前の周波数スペクトルデータ、および焼灼中/焼灼後の周波数スペクトルデータから特徴量をそれぞれ算出し、焼灼前の特徴量と、焼灼中/焼灼後の特徴量とを用いて差分特徴量を算出する。なお、本実施の形態でも、焼灼前の時点より後であれば、焼灼中ではなく焼灼後でも構わないため、以下、両者を区別せず、焼灼中/焼灼後と説明する。
本実施の形態2に係る超音波診断システム1Aは、上述した実施の形態1に係る超音波診断システム1の構成に対し、超音波観測装置3に代えて超音波観測装置3Aを備える。超音波観測装置3Aは、上述した差分特徴量算出部308に代えて差分特徴量算出部308Aを有している。超音波観測装置3Aにおいて、差分特徴量算出部308A以外の構成は、上述した超音波観測装置3の構成と同じである。
差分特徴量算出部308Aは、周波数解析部303が算出した焼灼中/焼灼後の周波数スペクトルデータと、読出部307から取得した焼灼前の周波数スペクトルデータとに基づいて、差分特徴量を算出する。差分特徴量算出部308Aは、回帰分析部308cおよび減算部308dを有する。
具体的には、回帰分析部308cは、焼灼前の周波数スペクトルデータ、および焼灼中/焼灼後の周波数スペクトルデータについて、上述した回帰分析部308bと同様にして、所定周波数帯域における周波数スペクトルデータの単回帰分析を行って周波数スペクトルデータを一次式(回帰直線)で近似することにより、この近似した一次式を特徴付ける特徴量を算出する。よって、回帰分析部308cは、焼灼前の特徴量、および焼灼中/焼灼後の特徴量を算出することになる。
図16は、焼灼前の周波数スペクトルを用いた周波数特徴量の算出を説明するための図である。例えば、回帰分析部308cは、焼灼前の周波数スペクトルデータS1(図9参照)に対し、周波数帯域Uで単回帰分析を行って、この焼灼前の周波数スペクトルデータS1の回帰直線L10を得る(図16参照)。次に、回帰分析部308cは、回帰直線L10の傾きa10、切片b10、およびミッドバンドフィット(Mid-band fit)c10=a10fM+b10を特徴量として算出する。
図17は、本発明の実施の形態2に係る差分特徴量算出部308Aが行う差分特徴量の算出を説明するための図であって、焼灼前の周波数スペクトルデータから算出される回帰直線と、焼灼中/焼灼後の周波数スペクトルデータから算出される回帰直線とを示す図である。図17に示すように、回帰分析部308cは、焼灼前の周波数スペクトルデータSP1に基づいて生成される回帰直線L10から特徴量a10、b10、c10を算出するとともに、焼灼中/焼灼後の周波数スペクトルデータSP2(図9参照)に基づいて生成される回帰直線L20から特徴量a20、b20、c20を算出する。
減算部308dは、焼灼前の特徴量と、焼灼中/焼灼後の特徴量との差をとった差分特徴量を算出する。減算部308dは、例えば、特徴量としてミッドバンドフィットcを用いる場合、焼灼中に得られた周波数スペクトルデータSP2に基づく特徴量c20と、焼灼前に得られた周波数スペクトルデータSP1に基づく特徴量c10との差分を算出することによって差分特徴量を取得する。
本実施の形態2における重畳画像の生成、表示処理は、ステップS9、S10を上述した処理に置きかえる以外は、図12に示すフローチャートと同じである。
以上説明した本発明の実施の形態2では、周波数解析部303により算出された焼灼前の周波数スペクトルデータと焼灼中/焼灼後の周波数スペクトルデータとから、特徴量をそれぞれ算出し、この特徴量から差分特徴量を求めるようにした。この際、実施の形態1と同様に、焼灼前の周波数スペクトルデータは、焼灼前のBモード画像データと、焼灼中/焼灼後のBモード画像データとから推定される被検体もしくはその一部(血管や腫瘍)の移動量に基づいて座標変換が施されており、焼灼中/焼灼後の周波数スペクトルデータとの位置は対応付いたものとなっている。このように、本発明の実施の形態2では、時相が異なる複数の画像情報を取得する際に、再現性の高い画像情報を取得することができる。これにより、本実施の形態2によれば、焼灼中/焼灼後のBモード画像上に、焼灼前との差分情報である焼灼領域を正確に表示することが可能となる。
なお、上述した実施の形態2において、回帰分析部308cが、周波数スペクトルデータから算出した特徴量に対して減衰補正を行ってもよい。一般に、超音波の振幅は伝播距離に対して指数的に減衰する。従って、振幅を常用対数に対数変換し、デシベル表現にした場合、振幅は往復距離Lに対して線形に減衰し、往復距離がLになるような受信深度z(=L/2)に対しても線形に減衰する。よって、この振幅のデシベル表現下において、超音波が受信深度0と受信深度zとの間を往復する間に生じる減衰量A(f,z)は、超音波が往復する前後の振幅の線形の変化(デシベル表現での差)として表現できる。この振幅の減衰量A(f,z)は、被検体が生体である場合には周波数に依存し、高周波では減衰が大きく、低周波では減衰が小さいことが知られている。特に、一様な組織内では周波数に比例することが経験的に知られており、以下の式(7)で表現される。
A(f,z)=2ζzf ・・・(7)
ここで、比例定数ζは減衰率と呼ばれる量である。また、zは超音波の受信深度であり、fは周波数である。減衰率ζの具体的な値は、被検体が生体である場合、生体の部位や組織に応じて定まる。正常肝では概ね、0.55dB/cm/MHzである。なお、減衰率ζの値は記憶部314に予め記憶されており、回帰分析部308cは適宜、記憶部314から減衰率ζの値を読み出して用いる。超音波観測装置3Aが、超音波内視鏡2による超音波の送信の前に、予め、被検体の部位名や組織名の入力を術者から受けた場合には、回帰分析部308cは、部位名や組織名に対応した減衰率ζの適当な値を読み出し、以下の減衰補正に用いる。さらに、超音波観測装置3Aが、減衰率ζの値を術者から直接受けた場合には、回帰分析部308cは、その値を以下の減衰補正に用いる。超音波観測装置3Aが、一切の入力を術者から受けなかった場合には、回帰分析部308cは、上記0.55dB/cm/MHzを以下の減衰補正に用いる。
A(f,z)=2ζzf ・・・(7)
ここで、比例定数ζは減衰率と呼ばれる量である。また、zは超音波の受信深度であり、fは周波数である。減衰率ζの具体的な値は、被検体が生体である場合、生体の部位や組織に応じて定まる。正常肝では概ね、0.55dB/cm/MHzである。なお、減衰率ζの値は記憶部314に予め記憶されており、回帰分析部308cは適宜、記憶部314から減衰率ζの値を読み出して用いる。超音波観測装置3Aが、超音波内視鏡2による超音波の送信の前に、予め、被検体の部位名や組織名の入力を術者から受けた場合には、回帰分析部308cは、部位名や組織名に対応した減衰率ζの適当な値を読み出し、以下の減衰補正に用いる。さらに、超音波観測装置3Aが、減衰率ζの値を術者から直接受けた場合には、回帰分析部308cは、その値を以下の減衰補正に用いる。超音波観測装置3Aが、一切の入力を術者から受けなかった場合には、回帰分析部308cは、上記0.55dB/cm/MHzを以下の減衰補正に用いる。
回帰分析部308cは、算出した特徴量(例えば、傾きa0、切片b0、ミッドバンドフィットc0とする)に対し、以下に示す式(8)~(10)にしたがって減衰補正を行うことにより、補正特徴量a、b、cを算出する。
a=a0+2ζz ・・・(8)
b=b0 ・・・(9)
c=c0+A(fM,z)=c0+2ζzfM(=afM+b)・・・(10)
式(8)、(10)からも明らかなように、回帰分析部308cは、傾きとミドバンドフィットとに対しては超音波の受信深度zが大きいほど、大きい補正を行う。また、式(9)によれば、切片に関する補正は恒等変換である。これは、切片が周波数0(Hz)に対応する周波数成分であって減衰の影響を受けないためである。
a=a0+2ζz ・・・(8)
b=b0 ・・・(9)
c=c0+A(fM,z)=c0+2ζzfM(=afM+b)・・・(10)
式(8)、(10)からも明らかなように、回帰分析部308cは、傾きとミドバンドフィットとに対しては超音波の受信深度zが大きいほど、大きい補正を行う。また、式(9)によれば、切片に関する補正は恒等変換である。これは、切片が周波数0(Hz)に対応する周波数成分であって減衰の影響を受けないためである。
この後、回帰分析部308cは、これら減衰補正された補正特徴量a、b、cを減算部308dへ出力する。減算部308dは、焼灼中/焼灼後の補正特徴量と、焼灼前の補正特徴量との差分を算出することによって、差分特徴量を取得する。
ここまで、本発明を実施するための形態を説明してきたが、本発明は、上述した実施の形態によってのみ限定されるべきものではない。例えば、超音波観測装置において、各機能を有する回路同士をバスで接続することによって構成してもよいし、一部の機能が他の機能の回路構造に内蔵されるように構成してもよい。
また、本実施の形態1、2では、超音波プローブとしてライトガイド等の光学系を有する超音波内視鏡2を用いて説明したが、超音波内視鏡2に限らず、撮像光学系および撮像素子を有しない超音波プローブであってもよい。さらに、超音波プローブとして、光学系のない細径の超音波ミニチュアプローブを適用してもよい。超音波ミニチュアプローブは、通常、胆道、胆管、膵管、気管、気管支、尿道、尿管へ挿入され、その周囲臓器(膵臓、肺、前立腺、膀胱、リンパ節等)を観察する際に用いられる。
また、超音波プローブとして、被検体の体表から超音波を照射する体外式超音波プローブを適用してもよい。体外式超音波プローブは、通常、腹部臓器(肝臓、胆嚢、膀胱)、乳房(特に乳腺)、甲状腺を観察する際に体表に直接接触させて用いられる。
また、超音波振動子21は、互いに機種が異なっていれば、リニア振動子でもラジアル振動子でもコンベックス振動子でも構わない。超音波振動子がリニア振動子である場合、その走査領域は矩形(長方形、正方形)をなし、超音波振動子がラジアル振動子やコンベックス振動子である場合、その走査領域は扇形や円環状をなす。また、超音波振動子21は、圧電素子が二次元的に配置されるものであってもよい。また、超音波内視鏡は、超音波振動子をメカ的に走査させるものであってもよいし、超音波振動子として複数の素子をアレイ状に設け、送受信にかかわる素子を電子的に切り替えたり、各素子の送受信に遅延をかけたりすることで、電子的に走査させるものであってもよい。
また、超音波プローブと超音波観測装置とは別体で設けられているものとして説明したが、超音波プローブと超音波観測装置とを一体化した構成としてもよい。
このように、本発明は、請求の範囲に記載した技術的思想を逸脱しない範囲内において、様々な実施の形態を含みうるものである。
以上のように、本発明にかかる超音波観測装置、超音波観測装置の作動方法およびコンピュータ読み取り可能な記録媒体は、時相が異なる複数の画像情報を取得する際に、再現性の高い画像情報を取得するのに有用である。
1、1A 超音波診断システム
2 超音波内視鏡
3、3A 超音波観測装置
4 表示装置
21 超音波振動子
301 送受信部
302 Bモード画像データ生成部
303 周波数解析部
304 第1切替部
305 第2切替部
306 移動量推定部
307 読出部
308、308A 差分特徴量算出部
308a 差分スペクトル算出部
308b、308c 回帰分析部
308d 減算部
309 解析画像データ生成部
310 重畳部
311 表示画像データ生成部
312 入力部
313 制御部
314 記憶部
2 超音波内視鏡
3、3A 超音波観測装置
4 表示装置
21 超音波振動子
301 送受信部
302 Bモード画像データ生成部
303 周波数解析部
304 第1切替部
305 第2切替部
306 移動量推定部
307 読出部
308、308A 差分特徴量算出部
308a 差分スペクトル算出部
308b、308c 回帰分析部
308d 減算部
309 解析画像データ生成部
310 重畳部
311 表示画像データ生成部
312 入力部
313 制御部
314 記憶部
Claims (9)
- 被検体へ超音波を送信し、該被検体で後方散乱された超音波を受信する超音波プローブが取得した超音波信号を受信する超音波観測装置において、
第1の超音波信号、および該第1の超音波信号とは取得時刻の異なる第2の超音波信号のそれぞれについて第1の周波数スペクトルデータおよび第2の周波数スペクトルデータを生成する周波数解析部と、
前記第1の周波数スペクトルデータと前記第2の周波数スペクトルデータとの差を特徴量とした差分特徴量を算出する差分特徴量算出部と、
前記差分特徴量に応じた色情報を付与した解析画像データを生成する解析画像データ生成部と、
を備えることを特徴とする超音波観測装置。 - 前記差分特徴量算出部は、
前記第1の周波数スペクトルデータと、前記第2の周波数スペクトルデータとの差を表現する差分スペクトルデータを算出する差分スペクトル算出部と、
前記差分スペクトルデータの回帰分析を行って差分特徴量を算出する回帰分析部と、
を有することを特徴とする請求項1に記載の超音波観測装置。 - 前記差分特徴量算出部は、
前記第1の周波数スペクトルデータの回帰分析を行って第1の特徴量を算出するとともに、前記第2の周波数スペクトルデータの回帰分析を行って第2の特徴量を算出する回帰分析部と、
前記第1の特徴量と前記第2の特徴量とを減算処理して差分特徴量を算出する減算部と、
を有することを特徴とする請求項1に記載の超音波観測装置。 - 前記回帰分析部は、前記第1および第2の周波数スペクトルデータにおける所定の周波数帯域を一次式で近似し、前記一次式の切片および傾き、ならびに前記周波数帯域の中間周波数における前記一次式の値のうちのいずれかを前記差分特徴量として算出する
ことを特徴とする請求項2に記載の超音波観測装置。 - 前記第1の超音波信号に基づいて第1の超音波画像データを生成し、前記第2の超音波信号に基づいて第2の超音波画像データを生成する超音波画像データ生成部と、
前記第2の超音波画像データに描出される被検体に対する前記第1の超音波画像データに描出される前記被検体の、位置の変化量および/または回転角の少なくとも一方を含む移動量を推定する移動量推定部と、
前記移動量推定部が推定した該移動量に応じて前記第1の周波数スペクトルデータの補正を行う補正部と、
前記第2の超音波画像データに前記解析画像データを重畳する重畳部と、
をさらに備え、
前記差分特徴量算出部は、前記補正部による補正後の第1の周波数スペクトルデータと、前記第2の周波数スペクトルデータとを用いて前記差分特徴量を補正する
ことを特徴とする請求項1に記載の超音波観測装置。 - 前記解析画像データ生成部は、前記第2の超音波画像データにおける各画素位置に、補正後の差分特徴量に応じた色情報を割り当てた前記解析画像データを生成し、
前記第2の超音波画像データに前記解析画像データを重畳した重畳画像データを生成する重畳部と、
前記重畳画像データを表示装置の表示方式に応じた処理を施して表示画像データを生成する表示画像データ生成部と、
をさらに備えることを特徴とする請求項5に記載の超音波観測装置。 - 前記解析画像データ生成部は、前記第2の超音波信号に基づく第2の超音波画像データにおける各画素位置に、差分特徴量に応じた色情報を割り当てた前記解析画像データを生成し、
前記第2の超音波画像データに前記解析画像データを重畳した重畳画像データを生成する重畳部と、
前記重畳画像データを表示装置の表示方式に応じた処理を施して表示画像データを生成する表示画像データ生成部と、
をさらに備えることを特徴とする請求項1に記載の超音波観測装置。 - 被検体へ超音波を送信し、該被検体で後方散乱された超音波を受信する超音波プローブが取得した超音波信号を受信する超音波観測装置の作動方法であって、
周波数解析部が、第1の超音波信号、および該第1の超音波信号とは取得時刻の異なる第2の超音波信号のそれぞれについて第1の周波数スペクトルデータおよび第2の周波数スペクトルデータを生成する周波数解析ステップと、
差分特徴量算出部が、前記第1の周波数スペクトルデータと前記第2の周波数スペクトルデータとの差を特徴量とした差分特徴量を算出する差分特徴量算出ステップと、
解析画像データ生成部が、前記差分特徴量に応じた色情報を付与した解析画像データを生成する解析画像データ生成ステップと、
を含むことを特徴とする超音波観測装置の作動方法。 - 実行可能なプログラムが記録された非一時的なコンピュータ読み取り可能な記録媒体であって、前記プログラムは、プロセッサに以下を実行するように指示する:
周波数解析部が、第1の超音波信号、および該第1の超音波信号とは取得時刻の異なる第2の超音波信号のそれぞれについて第1の周波数スペクトルデータおよび第2の周波数スペクトルデータを生成し、
差分特徴量算出部が、前記第1の周波数スペクトルデータと前記第2の周波数スペクトルデータとの差を特徴量とした差分特徴量を算出し、
解析画像データ生成部が、前記差分特徴量に応じた色情報を付与した解析画像データを生成する。
Priority Applications (1)
| Application Number | Priority Date | Filing Date | Title |
|---|---|---|---|
| US17/171,377 US11786211B2 (en) | 2018-09-14 | 2021-02-09 | Ultrasound imaging apparatus, method of operating ultrasound imaging apparatus, computer-readable recording medium, and ultrasound imaging system |
Applications Claiming Priority (2)
| Application Number | Priority Date | Filing Date | Title |
|---|---|---|---|
| JP2018172998A JP7094843B2 (ja) | 2018-09-14 | 2018-09-14 | 超音波観測装置、超音波観測装置の作動方法、コンピュータで読み取り可能な記録媒体および超音波診断システム |
| JP2018-172998 | 2018-09-14 |
Related Child Applications (1)
| Application Number | Title | Priority Date | Filing Date |
|---|---|---|---|
| US17/171,377 Continuation US11786211B2 (en) | 2018-09-14 | 2021-02-09 | Ultrasound imaging apparatus, method of operating ultrasound imaging apparatus, computer-readable recording medium, and ultrasound imaging system |
Publications (1)
| Publication Number | Publication Date |
|---|---|
| WO2020054485A1 true WO2020054485A1 (ja) | 2020-03-19 |
Family
ID=69777587
Family Applications (1)
| Application Number | Title | Priority Date | Filing Date |
|---|---|---|---|
| PCT/JP2019/034478 Ceased WO2020054485A1 (ja) | 2018-09-14 | 2019-09-02 | 超音波観測装置、超音波観測装置の作動方法およびコンピュータ読み取り可能な記録媒体 |
Country Status (3)
| Country | Link |
|---|---|
| US (1) | US11786211B2 (ja) |
| JP (1) | JP7094843B2 (ja) |
| WO (1) | WO2020054485A1 (ja) |
Families Citing this family (2)
| Publication number | Priority date | Publication date | Assignee | Title |
|---|---|---|---|---|
| US11275159B2 (en) | 2019-01-08 | 2022-03-15 | Shenzhen Mindray Bio-Medical Electronics Co., Ltd. | Attenuation estimation using ultrasound |
| CN116584970B (zh) * | 2023-05-17 | 2026-02-24 | 上海博动医疗科技股份有限公司 | 一种超声成像方法、装置、设备、超声成像系统及介质 |
Citations (5)
| Publication number | Priority date | Publication date | Assignee | Title |
|---|---|---|---|---|
| JP2007181698A (ja) * | 2005-12-28 | 2007-07-19 | Medison Co Ltd | 病変を検出するための超音波診断システム |
| JP2010538740A (ja) * | 2007-09-11 | 2010-12-16 | フォーカス サージェリー,インコーポレーテッド | Hifu治療中の組織変化モニタリングのためのシステム及び方法 |
| WO2012063930A1 (ja) * | 2010-11-11 | 2012-05-18 | オリンパスメディカルシステムズ株式会社 | 超音波診断装置、超音波診断装置の作動方法および超音波診断装置の作動プログラム |
| JP2014233305A (ja) * | 2013-05-30 | 2014-12-15 | 国立大学法人 東京大学 | 超音波治療装置 |
| WO2017069068A1 (ja) * | 2015-10-23 | 2017-04-27 | オリンパス株式会社 | 超音波観測装置、超音波観測装置の作動方法および超音波観測装置の作動プログラム |
Family Cites Families (2)
| Publication number | Priority date | Publication date | Assignee | Title |
|---|---|---|---|---|
| JP2013128731A (ja) | 2011-12-22 | 2013-07-04 | Hitachi Medical Corp | 超音波治療装置及び手術支援システム |
| CN105246415B (zh) * | 2013-12-05 | 2018-05-01 | 奥林巴斯株式会社 | 超声波观测装置以及超声波观测装置的动作方法 |
-
2018
- 2018-09-14 JP JP2018172998A patent/JP7094843B2/ja active Active
-
2019
- 2019-09-02 WO PCT/JP2019/034478 patent/WO2020054485A1/ja not_active Ceased
-
2021
- 2021-02-09 US US17/171,377 patent/US11786211B2/en active Active
Patent Citations (5)
| Publication number | Priority date | Publication date | Assignee | Title |
|---|---|---|---|---|
| JP2007181698A (ja) * | 2005-12-28 | 2007-07-19 | Medison Co Ltd | 病変を検出するための超音波診断システム |
| JP2010538740A (ja) * | 2007-09-11 | 2010-12-16 | フォーカス サージェリー,インコーポレーテッド | Hifu治療中の組織変化モニタリングのためのシステム及び方法 |
| WO2012063930A1 (ja) * | 2010-11-11 | 2012-05-18 | オリンパスメディカルシステムズ株式会社 | 超音波診断装置、超音波診断装置の作動方法および超音波診断装置の作動プログラム |
| JP2014233305A (ja) * | 2013-05-30 | 2014-12-15 | 国立大学法人 東京大学 | 超音波治療装置 |
| WO2017069068A1 (ja) * | 2015-10-23 | 2017-04-27 | オリンパス株式会社 | 超音波観測装置、超音波観測装置の作動方法および超音波観測装置の作動プログラム |
Also Published As
| Publication number | Publication date |
|---|---|
| JP7094843B2 (ja) | 2022-07-04 |
| JP2020043928A (ja) | 2020-03-26 |
| US20210161505A1 (en) | 2021-06-03 |
| US11786211B2 (en) | 2023-10-17 |
Similar Documents
| Publication | Publication Date | Title |
|---|---|---|
| CN106068099B (zh) | 超声波观测装置以及超声波观测装置的工作方法 | |
| JP7162477B2 (ja) | 超音波観測装置、超音波観測装置の作動方法および超音波観測装置の作動プログラム | |
| US11786211B2 (en) | Ultrasound imaging apparatus, method of operating ultrasound imaging apparatus, computer-readable recording medium, and ultrasound imaging system | |
| CN108366784A (zh) | 超声波观测装置、超声波观测装置的工作方法以及超声波观测装置的工作程序 | |
| JP6022135B1 (ja) | 超音波診断装置、超音波診断装置の作動方法および超音波診断装置の作動プログラム | |
| JP6010274B1 (ja) | 超音波観測装置、超音波観測装置の作動方法および超音波観測装置の作動プログラム | |
| JP7100160B2 (ja) | 超音波観測装置、超音波観測装置の作動方法および超音波観測装置の作動プログラム | |
| JP6892320B2 (ja) | 超音波観測装置、超音波観測装置の作動方法および超音波観測装置の作動プログラム | |
| JP6253869B2 (ja) | 超音波診断装置、超音波診断装置の作動方法および超音波診断装置の作動プログラム | |
| CN105939672B (zh) | 超声波观测装置以及超声波观测装置的工作方法 | |
| JP6886851B2 (ja) | 超音波観測装置の作動方法、超音波観測装置および超音波観測装置の作動プログラム | |
| JP6530660B2 (ja) | 超音波観測装置、超音波観測装置の作動方法および超音波観測装置の作動プログラム | |
| US20210345990A1 (en) | Ultrasound imaging apparatus, operating method of ultrasound imaging apparatus, and computer-readable recording medium | |
| JP2017217359A (ja) | 超音波観測装置、超音波観測装置の作動方法、及び超音波観測装置の作動プログラム | |
| CN106572843A (zh) | 超声波观测装置、超声波观测装置的工作方法以及超声波观测装置的工作程序 | |
| WO2022054288A1 (ja) | 超音波観測装置、超音波観測装置の作動方法および超音波観測装置の作動プログラム | |
| JP2017217313A (ja) | 超音波観測装置、超音波観測装置の作動方法および超音波観測装置の作動プログラム | |
| WO2021176618A1 (ja) | 超音波画像生成装置、超音波画像生成装置の作動方法、超音波画像生成装置の作動プログラムおよび超音波画像生成回路 |
Legal Events
| Date | Code | Title | Description |
|---|---|---|---|
| 121 | Ep: the epo has been informed by wipo that ep was designated in this application |
Ref document number: 19859561 Country of ref document: EP Kind code of ref document: A1 |
|
| NENP | Non-entry into the national phase |
Ref country code: DE |
|
| 122 | Ep: pct application non-entry in european phase |
Ref document number: 19859561 Country of ref document: EP Kind code of ref document: A1 |