WO2020031532A1 - 性能評価装置、性能評価方法及び性能影響度出力方法 - Google Patents
性能評価装置、性能評価方法及び性能影響度出力方法 Download PDFInfo
- Publication number
- WO2020031532A1 WO2020031532A1 PCT/JP2019/025307 JP2019025307W WO2020031532A1 WO 2020031532 A1 WO2020031532 A1 WO 2020031532A1 JP 2019025307 W JP2019025307 W JP 2019025307W WO 2020031532 A1 WO2020031532 A1 WO 2020031532A1
- Authority
- WO
- WIPO (PCT)
- Prior art keywords
- performance
- parameter
- influence
- function
- given factor
- Prior art date
- Legal status (The legal status is an assumption and is not a legal conclusion. Google has not performed a legal analysis and makes no representation as to the accuracy of the status listed.)
- Ceased
Links
Images

Classifications
-
- F—MECHANICAL ENGINEERING; LIGHTING; HEATING; WEAPONS; BLASTING
- F01—MACHINES OR ENGINES IN GENERAL; ENGINE PLANTS IN GENERAL; STEAM ENGINES
- F01D—NON-POSITIVE DISPLACEMENT MACHINES OR ENGINES, e.g. STEAM TURBINES
- F01D25/00—Component parts, details, or accessories, not provided for in, or of interest apart from, other groups
-
- F—MECHANICAL ENGINEERING; LIGHTING; HEATING; WEAPONS; BLASTING
- F02—COMBUSTION ENGINES; HOT-GAS OR COMBUSTION-PRODUCT ENGINE PLANTS
- F02C—GAS-TURBINE PLANTS; AIR INTAKES FOR JET-PROPULSION PLANTS; CONTROLLING FUEL SUPPLY IN AIR-BREATHING JET-PROPULSION PLANTS
- F02C7/00—Features, components parts, details or accessories, not provided for in, or of interest apart form groups F02C1/00 - F02C6/00; Air intakes for jet-propulsion plants
-
- G—PHYSICS
- G01—MEASURING; TESTING
- G01M—TESTING STATIC OR DYNAMIC BALANCE OF MACHINES OR STRUCTURES; TESTING OF STRUCTURES OR APPARATUS, NOT OTHERWISE PROVIDED FOR
- G01M15/00—Testing of engines
- G01M15/14—Testing gas-turbine engines or jet-propulsion engines
-
- G—PHYSICS
- G01—MEASURING; TESTING
- G01M—TESTING STATIC OR DYNAMIC BALANCE OF MACHINES OR STRUCTURES; TESTING OF STRUCTURES OR APPARATUS, NOT OTHERWISE PROVIDED FOR
- G01M99/00—Subject matter not provided for in other groups of this subclass
-
- G—PHYSICS
- G05—CONTROLLING; REGULATING
- G05B—CONTROL OR REGULATING SYSTEMS IN GENERAL; FUNCTIONAL ELEMENTS OF SUCH SYSTEMS; MONITORING OR TESTING ARRANGEMENTS FOR SUCH SYSTEMS OR ELEMENTS
- G05B23/00—Testing or monitoring of control systems or parts thereof
- G05B23/02—Electric testing or monitoring
-
- Y—GENERAL TAGGING OF NEW TECHNOLOGICAL DEVELOPMENTS; GENERAL TAGGING OF CROSS-SECTIONAL TECHNOLOGIES SPANNING OVER SEVERAL SECTIONS OF THE IPC; TECHNICAL SUBJECTS COVERED BY FORMER USPC CROSS-REFERENCE ART COLLECTIONS [XRACs] AND DIGESTS
- Y02—TECHNOLOGIES OR APPLICATIONS FOR MITIGATION OR ADAPTATION AGAINST CLIMATE CHANGE
- Y02E—REDUCTION OF GREENHOUSE GAS [GHG] EMISSIONS, RELATED TO ENERGY GENERATION, TRANSMISSION OR DISTRIBUTION
- Y02E20/00—Combustion technologies with mitigation potential
- Y02E20/16—Combined cycle power plant [CCPP], or combined cycle gas turbine [CCGT]
Definitions
- the present invention relates to a performance evaluation device, a performance evaluation method, and a performance influence output method.
- Patent Literature 1 discloses that a change in performance of a gas turbine such as a power generation efficiency is determined by using, as variables, an intake air temperature, a compressor outlet pressure, a change amount of a gas turbine output at two times, and a time difference (elapsed time) between the two times.
- the performance of a gas turbine can be modeled using a linear function, and the performance index calculated based on the linear function can be used to exclude effects such as gas turbine output during operation, intake air temperature, compressor outlet pressure, noise, etc. Is described.
- the linear function model described in Patent Literature 1 incorporates elapsed time as a variable and is a model for estimating performance reflecting the influence of performance degradation due to accumulation of operation time.
- elapsed time is a variable for estimating performance reflecting the influence of performance degradation due to accumulation of operation time.
- the linear function model described in Patent Document 1 cannot estimate such performance.
- the present invention provides a performance evaluation device, a performance evaluation method, and a performance influence output method that can solve the above-described problems.
- the performance evaluation device indicates the performance when each of the parameters takes a predetermined value, based on a function indicating a relationship between the performance of the plant and one or more parameters.
- the performance evaluation unit the given factor parameter is an uncontrollable factor included in the operation data collected from the plant and a point indicating the performance corresponding thereto, the given factor parameter Is moved so that at least one of them becomes a predetermined reference value, thereby calculating the standardized performance based on the reference value of the given factor parameter.
- the performance evaluation device includes an operation data acquisition unit that acquires the operation data, a setting reception unit that accepts settings for parameters included in the operation data, and a setting reception unit that includes the operation data.
- a function generation unit that generates a function indicating a relationship between the plurality of parameters and the performance, wherein the setting reception unit receives the selection of the given factor parameter included in the operation data, Forming a given factor parameter group, the function generating unit generates a first function indicating a relationship between the performance included in the operation data and each parameter of the first given factor parameter group, and the performance evaluation unit Sets the value of each parameter of the first given factor parameter group as a respective reference value based on the first function, thereby obtaining the first given factor parameter group. Calculating a first performance value excluding the effect of parameters.
- the setting accepting unit accepts a setting of a parameter that is affected by device deterioration in the first given factor parameter group, and excludes the parameter to set a second given factor.
- the function generation unit forms a parameter group
- the function generation unit generates a second function indicating a relationship between the performance included in the operation data and each parameter of the second given factor parameter group, the performance evaluation unit,
- the second performance value excluding the influence of each parameter of the second given factor parameter group is set by using the value of each parameter of the second given factor parameter group as a reference value based on the second function.
- the performance evaluation unit calculates the difference between the first performance value and the second performance value, and further calculates the deterioration amount of the device.
- the setting accepting unit accepts a setting of one or more maintenance parameters for evaluating the degree of influence among control factor parameters that are controllable factors included in the operation data.
- the function generation unit generates a third function indicating a relationship between the plurality of parameters obtained by adding the maintenance parameter to the first given factor parameter group and the performance, and the performance evaluation unit performs the third function
- the third performance value excluding the influence of the plurality of parameters is calculated by setting the values of the plurality of parameters obtained by adding the maintenance parameter to the first given cause parameter group to the respective reference values based on the first and second parameters.
- the performance evaluation device further includes a performance output unit that outputs a performance value after removing the influence of the given factor parameter calculated by the performance evaluation unit.
- the performance evaluation unit may include: the first performance value excluding the influence of each parameter of the first given factor parameter group calculated based on the first function; The magnitude of the effect of the maintenance parameter on the performance based on the difference between the effect of each parameter of the first given factor parameter group calculated based on the function and the third performance value excluding the effect of the maintenance parameter. Is calculated.
- the performance evaluation unit may determine that the first change amount of the performance value based on the first function in a predetermined period is the second change amount of the performance value based on the third function in the period.
- the degree of influence of the maintenance parameter is calculated based on a value obtained by subtracting the second change amount from the first change amount.
- the apparatus further includes an improvement measure corresponding to the maintenance parameter, and an effect output unit that outputs an effect of the improvement measure based on the degree of influence of the maintenance parameter.
- the performance evaluation method indicates the performance when each of the parameters takes a predetermined value, based on a function indicating a relationship between the performance of the plant and one or more parameters. By moving a point along a multidimensional curved surface indicated by the function so that at least one of the parameters has a predetermined reference value, the performance when the parameter has reached the reference value is calculated.
- a performance evaluation method includes a step of obtaining operation data including a plurality of parameters indicating a state of a plant and performance information, and a given factor parameter that is an uncontrollable factor included in the parameter. And forming a first given factor parameter group, and generating a first function indicating a relationship between the performance included in the operation data and each parameter of the first given factor parameter group. And a first performance excluding an influence of each parameter of the first given factor parameter group by setting a value of each parameter of the first given factor parameter group as a respective reference value based on the first function. Calculating a value.
- the performance evaluation method accepts a setting of one or a plurality of maintenance parameters for evaluating the degree of influence among control factor parameters that are controllable factors included in the operation data. Generating a third function indicating a relationship between the plurality of parameters obtained by adding the maintenance parameter to the first given factor parameter group and the performance; and determining the first given parameter based on the third function. Calculating the third performance value excluding the influence of the plurality of parameters by using the values of the plurality of parameters obtained by adding the maintenance parameters to the factor parameter group as the respective reference values.
- a performance influence output method outputs information on an improvement measure for improving the influence of the maintenance parameter on the performance together with the influence calculated by the above-described performance evaluation method.
- the influence of any factor on the performance of the plant is evaluated, or the original performance of the plant excluding the influence of those factors is evaluated. be able to.
- FIG. 8 is a diagram illustrating an example of a process for excluding an influence of a given factor according to an embodiment of the present invention.
- FIG. 9 is a first diagram illustrating an example of a process for calculating the degree of influence of a control factor according to an embodiment of the present invention.
- FIG. 11 is a second diagram illustrating an example of a process for calculating the degree of influence of a control factor according to an embodiment of the present invention. It is a figure showing an example of an improvement measure to performance degradation related to a control factor and an improvement effect in one embodiment concerning the present invention.
- FIG. 5 is a flowchart illustrating an example of a performance evaluation process according to an embodiment of the present invention. It is a 2nd block diagram of the performance evaluation device in one embodiment of the present invention. 9 is a second flowchart illustrating an example of a performance evaluation process according to an embodiment of the present invention.
- FIG. 1 is a diagram illustrating an example of a hardware configuration of a performance evaluation device according to an embodiment of the present invention.
- FIG. 1 is a schematic diagram of a plant to be subjected to performance evaluation in one embodiment according to the present invention.
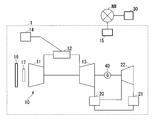
- a plant 1 targeted for performance evaluation in the present embodiment includes, for example, a gas turbine 10, an exhaust heat recovery boiler 20, a condenser 21, a steam turbine 22, a gas turbine 10,
- This is a gas turbine combined cycle power plant including a generator 40 connected to the rotor of the steam turbine 22 and a control device 15 for controlling these devices.
- the gas turbine 10 includes a compressor 11, a combustor 12, and a turbine 13.
- a filter 16 is provided on the upstream side of the flow in which the compressor 11 sucks air so as not to take in substances in the air that cause deterioration, and a GT (gas turbine) inlet is provided to adjust the amount of air sucked.
- a guide valve (IGV: inlet @ guide @ vane) 17 is provided.
- a fuel line for supplying fuel from the fuel supply source 14 to the combustor 12 is connected to the combustor 12.
- the compressor 11 compresses outside air to generate compressed air.
- the combustor 12 mixes the fuel gas and the compressed air generated by the compressor 11 and burns them to generate a high-temperature combustion gas.
- the turbine 13 is driven to rotate by the combustion gas.
- the exhaust port of the turbine 13 is connected to the exhaust heat recovery boiler 20.
- the exhaust heat recovery boiler 20 generates steam using the exhaust heat discharged from the turbine 13 and the water supplied from the condenser 21, and rotates the steam turbine 22 with the generated steam.
- the generator 40 generates electric power by the rotation of the turbine 13 and the steam turbine 22.
- the steam discharged from the steam turbine 22 is returned to water in the condenser 21, and the water is supplied to the exhaust heat recovery boiler 20.
- the control device 15 acquires the operation data of the plant 1 and controls the gas turbine 10 and the steam turbine 22 so that the load of the generator 40 becomes a desired value.
- the operation data of the plant 1 is, for example, measured values of the load, the temperature, the humidity, and the like of the gas turbine 10.
- the operation data includes a control value (such as an opening command value of the IGV 17) generated by the control device 15 for controlling the plant 1.
- the operation data includes values calculated based on the measured values and the control values (estimated values of state quantities that cannot be directly measured, performance of the plant 1, and the like).
- the operation data includes environmental factors such as temperature and humidity, factors that cannot be controlled by the user who operates the plant such as the load of the plant 1 (these factors are collectively referred to as given factors), and control by the user. Factors that can be performed (called control factors or maintenance factors) are included.
- the given factors include, for example, the load of the plant 1, the load of the gas turbine 10, the fuel calories of the fuel gas supplied to the combustor 12, and the supply of the steam from the steam turbine 22 to the condenser 21.
- the temperature of the water (condenser inflow water temperature), the atmospheric pressure of the air sucked by the compressor 11, the temperature, the humidity, and the like.
- the performance evaluation device 30 can perform the performance evaluation of the plant 1 excluding the influence of these given factors on the performance of the plant 1.
- the control factors include, for example, GT inlet pressure loss, GT exhaust pressure loss, GT inlet guide valve angle, compressor efficiency, fuel gas temperature, TCA (turbine cooling air) cooler (cooling that is extracted from the compressor 11 and supplied to the turbine 13).
- the GT inlet pressure loss can be improved by replacing the filter 16, for example.
- GT exhaust pressure loss can be improved by cleaning the exhaust heat recovery boiler 20.
- the GT inlet guide valve angle can be controlled by the control of the control device 15.
- the compressor efficiency can be improved by cleaning the blades of the compressor 11 or the like.
- the fuel gas temperature can be controlled by the control of the control device 15.
- the heat exchange rate of the TCA cooler can be improved by cleaning the heat exchanger of the TCA cooler.
- the degree of vacuum and the condenser temperature of the condenser 21 can be improved by cleaning the condenser 21.
- the performance evaluation device 30 of the present embodiment can evaluate the degree of influence of these control factors on the performance of the plant 1.
- the control device 15 and the performance evaluation device 30 are connected via a network (NW).
- the control device 15 transmits operation data including the given factor, the control factor, and the performance information of the plant 1 to the performance evaluation device 30 via the NW.
- the performance evaluation device 30 calculates the original performance information of the device excluding the influence of the given factor from the performance information.
- the performance evaluation device 30 calculates the difference between the performance information excluding the influence of the control factor from the performance information and the performance information before the exclusion, and calculates the degree of influence of the control factor on the performance of the plant 1.
- FIG. 2 is a block diagram of a performance evaluation device according to an embodiment of the present invention.
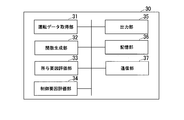
- the performance evaluation device 30 includes an operation data acquisition unit 31, a function generation unit 32, a given factor evaluation unit 33, a control factor evaluation unit 34, an output unit 35, a storage unit 36, and a communication unit 37. ing.
- the operation data acquisition unit 31 acquires the operation data transmitted by the control device 15 and records the operation data in the storage unit 36.
- the function generating unit 32 generates a function or a model indicating the relationship between the performance information and the given factor and the control factor using the operation data.
- the function generation unit 32 generates a function by a statistical method such as a multiple regression analysis or a neural network.
- the given factor evaluation unit 33 excludes the influence of the given factor from the performance information of the plant 1 included in the operation data. Specifically, when the value of the performance value Y1 is y1 when the given factors X1, X2,..., Xn take certain values x1, x2,. Represents a point indicating the relationship of (x1, x2,..., Xn, y1), where the values of the given factors X1 to Xn are reference values determined for each of the given factors X1 to Xn. As described above, the movement is performed along the multidimensional curved surface indicated by the function generated by the function generation unit 32, and the value of the performance value Y1 at the point after the movement is calculated.
- the values of a plurality of pieces of performance information achieved under the conditions of various given factors included in the driving data are aligned with the performance information under one reference condition, and the difference between the given factors is determined. You can compare without worrying. In other words, the influence of a given factor is excluded from a plurality of pieces of performance information, and standardized performance information can be obtained.
- standardization processing will be described with reference to FIG.
- FIG. 3 is a diagram illustrating an example of a process for excluding the influence of a given factor according to an embodiment of the present invention.
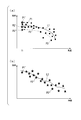
- FIG. 3 shows the relationship between the efficiency of the plant 1 as an example of the performance information and the temperature (air temperature) of the air sucked by the compressor 11 as an example of the given factor.
- the efficiency can be calculated by dividing the output of the plant 1 by the amount of fuel injected into the combustor 12 (fuel flow rate) and fuel calories.
- FIG. 3A is a graph showing the relationship between efficiency (vertical axis) and temperature (horizontal axis).
- the square points represent the relationship between the air temperature included in the operation data acquired at different points in time, the fuel flow rate and the fuel calories included in the operation data, and the efficiency calculated using the output of the plant 1.
- a curve L1 indicates a function generated by the function generating unit 32 from a point indicated by a square by a simple regression analysis or the like. If there are a plurality of given factors, a function can be generated by multiple regression analysis. In general, the plant 1 can operate with higher efficiency as the temperature is lower, and the efficiency decreases as the temperature increases.
- the curve L1 includes such a relationship between the temperature and the efficiency of the plant 1, and does not necessarily indicate the performance of the plant 1 alone. For example, comparing point P1 with point P3, the efficiency at point P1 is higher. However, the performance of the plant 1 at the point P1 is not always higher than the performance of the plant 1 at the point P3. For example, although the performance of the plant 1 at the point P1 is deteriorated compared to the performance at the point P3, the efficiency of the point P1 may be high due to a good operating environment (low temperature). Therefore, the given factor evaluation unit 33 performs a standardization process that excludes the influence of the given factor (temperature).
- the efficiency achieved under various temperatures is standardized by converting the efficiency under the temperature T1 into efficiency.
- the given factor evaluation unit 33 moves each of the points indicated by the squares along the curve L1 such that the temperature value corresponding to each point is T1.
- the point P1 is moved as indicated by a broken arrow.
- the point P1 moves to the star point P1 '.
- the efficiency value at the point P1 ' is the efficiency after standardization (under the temperature T1).
- the points P2 and P3 are moved to the star points P2 'and P3', respectively, according to the dashed arrows extending along the curve L1 from each point.
- the value of the efficiency at the point P2 'after the movement is the efficiency after the standardization at the point P2.
- the value of the efficiency at the point P3 'after the movement is the efficiency after the standardization at the point P3.
- FIG. 3B is a graph showing the relationship between the efficiency (vertical axis) and the time at which the efficiency was obtained (horizontal axis).
- the graph of FIG. 3B is obtained by re-plotting the efficiency values at each time point after the standardization obtained by the above processing on a graph showing the relationship between the time at which the efficiency was achieved and the efficiency.
- the curve L2 is an approximate curve generated by the function generation unit 32 from a point indicated by an asterisk by regression analysis or the like.
- a curve L2 indicates that the efficiency gradually decreases with time. For example, assuming that the points P1 'to P3' are points based on the operation data obtained every month in this order, the performance deteriorates in the order of the points P1 'to P3' over time.
- the curve L2 indicates that the performance of the plant 1 is degraded over time irrespective of the temperature fluctuation during this time.
- ⁇ By setting the value of a given reference factor as a condition for performance evaluation, performance under a desired condition can be estimated. For example, if the operation data of a plant operating in an environment where the annual temperature is 5 ° C to 35 ° C is accumulated, the same type of plant is newly introduced in an area where the temperature is 25 ° C to 30 ° C throughout the year. In this case, the performance information achieved in the environment of 5 ° C. to 35 ° C. by the above processing is standardized to the performance information at a predetermined reference value at 25 ° C. to 30 ° C., so that the performance of the plant in the relevant area is Can be estimated.
- the control factor evaluation unit 34 calculates the degree of influence of the control factor.
- the calculation process of the degree of influence of the control factor will be described with reference to FIG.
- FIG. 4 is a first diagram illustrating an example of a process of calculating the degree of influence of a control factor according to the embodiment of the present invention.
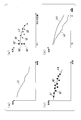
- FIG. 4A shows a graph in which the performance information after removing the influence of the given factor is plotted in time series. This is the same graph as the curve L2 in FIG.
- the function generation unit 32 generates a function indicating the relationship between one or a plurality of control factors and a given factor including the parameters excluded in the step described with reference to FIG. 3 and the performance information by a method such as a multiple regression analysis.
- the given factor evaluation unit 33 performs the standardization process for excluding the effect of the given factor from the result of the multiple regression analysis.
- the control factor evaluation unit 34 performs a process of excluding the influence of the control factor.
- FIG. 4B shows a graph in which the relationship between GT inlet pressure loss (control factor) and efficiency is extracted from the multidimensional curved surface obtained as a result of the multiple regression analysis (curve L3).
- the control factor evaluation unit 34 calculates the points Q1 to Q3 represented by the relationship between the control factor and the performance information in the same manner as the given factor evaluation unit 33, using the value of the control factor parameter. Is processed along the curved surface of the function (curve L3) until the reference value (Pr1) is reached.
- the efficiency at points Q1 'to Q3' is a value after standardization, that is, the efficiency when the value of the GT inlet pressure loss is Pr1. If the GT inlet pressure loss is large, the efficiency also decreases. For example, the efficiency at point Q3 is an efficiency including a performance decrease due to a greater GT inlet pressure loss than the efficiency shown at point Q1.
- the points Q1 'to Q3' excluding the influence of the GT inlet pressure loss can be calculated from the efficiencies indicated by the points Q1 to Q3.
- FIG. 4C shows a graph in which performance values excluding the influences of environmental factors and control factors are plotted in time series.
- the curve L4 is an approximate curve generated by the function generation unit 32 from the plotted points by regression analysis or the like.
- the control factor evaluation unit 34 compares the difference between the curve L2 obtained by excluding only the influence of the given factor and the curve L4 obtained by excluding the effect of the control factor in addition to the given factor, and (Eg, GT inlet pressure loss) is calculated.
- FIG. 4D shows a graph comparing the curves L2 and L4.
- Curve L2 includes the effect of GT inlet pressure loss. As the operation time of the plant 1 increases, the GT inlet pressure loss increases due to clogging of the filter 16 and the like.
- the efficiency of the curve L2 includes a decrease due to an increase in the GT inlet pressure loss
- the decrease in the efficiency of the curve L2 is larger than that of the curve L4. This difference in efficiency is due to the GT inlet pressure loss.
- the GT inlet pressure loss is a control factor and is controllable. For example, if the GT 16 pressure loss is improved by replacing the filter 16 at the time T1, the efficiency of the plant 1 is reduced, for example. There is a possibility that the efficiency indicated by the curve L4 can be improved.
- the control factor evaluation unit 34 calculates the amount of change in performance between two time points (T1, T2) before the exclusion of the influence of the control factor and the change in performance between the same two time points after the exclusion of the influence of the control factor. The difference is calculated by comparing the amount. The calculated difference is the degree of influence of the control factor.
- FIG. 5 is a second diagram illustrating an example of a process of calculating the degree of influence of a control factor according to the embodiment of the present invention.
- FIG. 5 shows an example of a performance curve (solid line) obtained by excluding only the influence of a given factor and an example of a performance curve (dashed line) obtained by excluding the effects of a given factor and a control factor (GT inlet pressure loss).
- GT inlet pressure loss a control factor
- the control factor evaluation unit 34 calculates the difference between 0.5 and 0.2, and sets 0.3 as the degree of influence of the GT inlet pressure loss.
- the control factor evaluation unit 34 specifies that the improvement measure for the reduction in efficiency is replacement of the filter 16, and sets the improvement effect to the same value 0.3 as the calculated degree of influence.
- the control factor evaluation unit 34 may add the fuel price or the like to 0.3%, calculate a cost (fuel cost) that can be saved during this time, and use this cost as the degree of influence.
- Improvement measures are predetermined for each control factor.
- the improvement measures for the control factors other than the GT inlet pressure loss are, for example, the improvement measures for the GT exhaust pressure loss are cleaning of the exhaust heat recovery boiler 20, and the improvement measures for the compressor efficiency are the cleaning of the blades of the compressor 11, etc. It is.
- the control factor evaluation unit 34 performs the above-described calculation processing of the degree of influence and the processing of identifying the improvement measure for each of the plurality of control factors, calculates the degree of influence of each control factor, Identify the improvement effects of the introduction.
- the control factor evaluation unit 34 may perform the calculation process of the degree of influence and the process of specifying the improvement measure in units of the plurality of control factors as one group. Good.
- the fact that there is a strong correlation between a plurality of control factors means that, for example, when a lot of dust in the air is contained, the filter 16 is easily clogged between the GT inlet pressure loss and the compressor efficiency (GT inlet). Pressure loss increases) and the compressor is also easily contaminated (compressor efficiency decreases). Further, from the viewpoint of efficiency, when the GT inlet pressure loss simply increases or when the efficiency of the compressor 11 decreases.
- the function generation unit 32 generates a function including a relationship between two parameters of GT inlet pressure loss and compressor efficiency and performance information.
- the control factor evaluation unit 34 performs a process of simultaneously standardizing the two parameters, and determines the difference between the performance information when the values of the two parameters of the GT inlet pressure loss and the compressor efficiency are equalized to the reference value and the performance information before the standardization.
- the degree of influence of the control factor is evaluated by calculation. If the air in the operating environment of the plant contains a large amount of dust, the value of the degree of influence increases.
- the user can plan replacement of the filter 16 and cleaning of the compressor 11 based on the evaluation result.
- the control factor evaluator 34 specifies a specific combination of the two. Improvement measures may be presented. If the air in the operating environment of the plant is not in an air state (including a large amount of dust, etc.) that strongly affects the correlation between the GT inlet pressure loss and the compressor efficiency, the control factor evaluation unit 34 determines whether the two control factors correspond to each other. The degree of influence calculated for the combination does not become a large value. In that case, the user considers the execution of another improvement measure having a large impact.
- the output unit 35 outputs a graph of the performance information after removing the influence of the given factor (for example, FIG. 3B).
- the user can grasp the original performance of the equipment of the plant 1 and the change in the performance (such as the degree of deterioration) by looking at the performance curve excluding the influence of the given factor.
- the output unit 35 performs comparison output between a graph excluding only the influence of the given factor illustrated in FIG. 5 and a graph excluding the influence of the given factor and the control factor.
- the output unit 35 displays a list of the improvement measures identified by the control factor evaluation unit 34 and the improvement effects, for example, ranked in descending order of improvement effect.
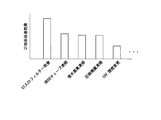
- FIG. 6 is a diagram illustrating an example of an improvement measure for performance deterioration related to a control factor and an improvement effect according to the embodiment of the present invention.
- FIG. 6 shows a list of improvement measures and improvement effects.
- replacement of the GT inlet filter (filter 16), cleaning of the HRSG (exhaust heat recovery boiler 20) tube, and the like are displayed in order from the left, together with the respective improvement effects, in order from the improvement measure with the highest performance improvement effect. Have been.
- the user can see the list to understand how much the performance of the plant 1 can be improved by taking care of the control factors.
- the improvement effect is a value based on each degree of influence, and in the example of FIG.
- the output unit 35 may also display, for example, the costs (various costs, the time required for introduction, the loss due to power generation stoppage at the time of introduction, etc.) required to introduce the improvement measures beside the bar graph of the improvement effect. . The user can consider the introduction of the improvement measures more comprehensively while considering the cost.
- the storage unit 36 stores the operation data, the function generated by the function generation unit 32, the graph after excluding the influence of the given factor, the graph after excluding the effect of the given factor and the control factor, and the effect for each control factor.
- a correspondence table between degrees, control factors and improvement measures is stored.
- the communication unit 37 performs data communication with the control device 15. Since the communication unit 37 can acquire operation data from the plant 1 in real time, the performance evaluation device 30 can appropriately evaluate the current performance of the plant 1 based on the latest operation data. For example, a change in performance of the plant 1 excluding the influence of a given factor can be grasped every day. Since deterioration of performance due to control factors can be grasped in real time, improvement measures can be introduced at appropriate timing to maintain performance.
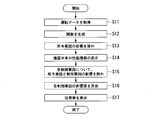
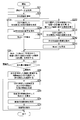
- FIG. 7 is a flowchart illustrating an example of the performance evaluation process according to the embodiment of the present invention.
- the flow of the performance evaluation process will be described with reference to FIG.
- the operation data acquisition unit 31 acquires operation data from the control device 15 via the communication unit 37 (Step S11).
- the operation data includes parameters of given factors such as load and temperature of the plant 1, parameters of control factors such as GT inlet pressure loss, and performance information about the plant 1 such as efficiency of the gas turbine 10.
- the performance information may be obtained by acquiring operation data necessary for calculating the performance information and calculating the performance data on the performance evaluation device 30 side.
- the operation data acquisition unit 31 records the acquired operation data in the storage unit 36.
- the function generation unit 32 generates a function (step S12).
- the function generating unit 32 reads, from the storage unit 36, a large number of sets of operation data including a plurality of given factors, a plurality of control factors, and one piece of performance information at the same time point, and generates a function indicating the relationship between them. .
- a method such as a multiple regression analysis or a neural network can be used to generate the function.
- the function generation unit 32 records the generated function in the storage unit 36.
- the given factor evaluation unit 33 excludes the influence of the given factor from the performance information by using the function obtained by the multiple regression analysis or the like (step S13). Specifically, as described with reference to FIG. 3, the given factor evaluation unit 33 includes the load on the plant 1, the load on the gas turbine 10, the fuel calories, the condenser inflow water temperature, the atmospheric pressure, the temperature, the humidity, and the like. Of the given factor parameter is normalized to exclude the influence of the difference in the value of the given factor parameter on the performance information. The given factor evaluation unit 33 records the standardized value of each given factor, the value of the control factor, and the performance information after the standardization in the storage unit 36 in association with each other.
- the output unit 35 displays the original performance information of the device excluding the influence of the given factor (step S14).
- the output unit 35 acquires the performance information after removing the influence of the given factor from the storage unit 36, and displays and visualizes, for example, the graph illustrated in FIG. 3B.
- the user can grasp the original performance and the degree of deterioration of the equipment of the plant 1. For example, in the case where a part of the equipment is damaged, even if the change in performance due to the damage is difficult to confirm due to the fluctuation of the given factor, the performance information after excluding the influence of the given factor Is displayed, a change in performance can be accurately detected.
- step S15 a process of excluding the influence of each given factor and control factor from the performance information is performed (step S15).
- the given factor evaluation unit 33 performs a process of standardizing each of the given factor parameters.
- the control factor evaluation unit 34 performs a process of standardizing the control factor parameter for one of the control factors.
- the control factor evaluator 34 performs, for example, individual standardization processing for each of the GT inlet pressure loss, GT exhaust pressure loss, GT inlet guide valve angle, compressor efficiency, fuel gas temperature, TCA cooler heat exchange rate, and condenser vacuum degree. I do.
- the control factor evaluation unit 34 calculates, for each control factor, the performance information excluding the influence of the control factor and the given factor on the performance information, the value of each standardized given factor, the value of each standardized control factor, and , And the values of other control factors are recorded in the storage unit 36 in association with each other.
- control factor evaluation unit 34 calculates the degree of influence of each control factor (step S16). For example, when calculating the degree of influence of the GT inlet pressure loss, the control factor evaluating unit 34 calculates performance information (performance A) excluding the influence of the given factor calculated in step S15 and the effect on the performance of the GT inlet pressure loss, The difference from the performance information (performance B) excluding the influence on the performance of the given factor calculated in step S13 is calculated to calculate the degree of influence. More specifically, as described with reference to FIG. 5, the control factor evaluation unit 34 calculates the difference between the change amount of the performance A and the change amount of the performance B at two time points.
- the control factor evaluation unit 34 calculates the degree of influence not only on the GT inlet pressure loss but also on other control factors such as the GT exhaust pressure loss, the GT inlet guide valve angle, and the compressor efficiency.
- the control factor evaluation unit 34 records the calculated influence degree in the storage unit 36 for each control factor. If there is a relationship between the control factor and the performance deterioration, the degree of influence of the control factor becomes a larger value (for example, the change over time of the performance information after the exclusion of the influence of the control factor is larger than the change over time of the performance information before the exclusion). Is smaller, the degree of influence is small when there is no effect on performance degradation.
- the output unit 35 displays a remedy (Step S17). Specifically, the output unit 35 displays a graph in which improvement measures such as those illustrated in FIG. 6 are ranked in order of influence (in order of improvement effect). This allows the user to understand which control factors affect the performance and the degree of the influence.
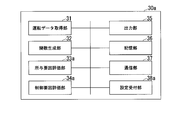
- FIG. 8 is a second block diagram of the performance evaluation device in one embodiment according to the present invention.
- the performance evaluation device 30a includes an operation data acquisition unit 31, a function generation unit 32, a given factor evaluation unit 33a, a control factor evaluation unit 34a, an output unit 35, a storage unit 36, a communication unit 37, And a receiving unit 38a.
- the setting receiving unit 38a receives setting of parameters related to performance evaluation. For example, the setting receiving unit 38a receives a setting of a parameter of a given factor (first given factor parameter group) whose influence on performance is to be excluded. The setting receiving unit 38a receives a setting of a parameter that is affected by the deterioration of the equipment constituting the plant 1 in the first given factor parameter group. The setting receiving unit 38a receives setting of a parameter (maintenance parameter) of a control factor whose effect on performance is to be grasped.
- the function generation unit 32 generates a function indicating a relationship between the performance of the plant 1 included in the operation data and a given factor included in the operation data. For example, the function generating unit 32 generates a first function indicating a relationship between each parameter of the first given factor parameter group and performance. The function generation unit 32 generates a second function indicating the relationship between each parameter of the second given factor parameter group obtained by excluding the parameter affected by the deterioration of the device from the first given factor parameter group and the performance of the plant 1. I do. The function generating unit 32 generates a third function indicating a relationship between a plurality of parameters obtained by adding a maintenance parameter to the first given factor parameter group and the performance of the plant 1.
- the given factor evaluation unit 33a based on the performance generated by the function generation unit 32 and the first function indicating the relationship between the parameters of the first given factor parameter group, as in the first embodiment, The performance of the plant 1 excluding the influence of each parameter is calculated by setting the value to a reference value defined for each. Similarly, the given factor evaluator 33a sets the value of each parameter of the second given factor parameter group to a respective reference value based on the second function, so that the influence of each parameter of the plant 1 is eliminated. Calculate performance.
- the control factor evaluation unit 34a based on the third function generated by the function generation unit 32 by adding the maintenance parameter to the first given factor parameter group, as in the first embodiment, By setting the values of the group and the added maintenance parameter to reference values defined for each, the performance of the plant 1 excluding the influence of each parameter and the maintenance parameter of the first given factor parameter group is calculated.
- the control factor evaluation unit 34a performs the performance of the plant 1 excluding the influence of each parameter of the first given factor parameter group and the maintenance parameter, and the performance of the plant 1 excluding the influence of each parameter of the first given factor parameter group. Then, the degree of influence of the maintenance parameter is calculated based on the difference.
- FIG. 9 is a second flowchart illustrating an example of the performance evaluation process according to the embodiment of the present invention. Processing similar to that in FIG. 7 will be described briefly.
- the operation data acquisition unit 31 acquires time-series operation data from the control device 15 via the communication unit 37 (Step S21).
- the operation data includes parameters of given factors such as load of plant 1, temperature, filter 16 differential pressure (pressure difference before and after filter 16), parameters of control factors such as GT inlet pressure loss, and efficiency of plant 1.
- performance information on the plant 1 for a predetermined period for example, three months is included.
- the user selects any given factor (step S22) and inputs it to the performance evaluation device 30a.
- the user specifies, from the selected given factors, a given factor related to equipment that affects the performance degradation of the plant 1 to be examined, and inputs the specified given factor to the performance evaluation device 30a.
- a given factor related to equipment that affects the performance degradation of the plant 1 to be examined For example, the user selects and inputs “load”, “atmospheric pressure”, “temperature”, “humidity”, and “filter 16 differential pressure” as arbitrary given factors, and among these, influences on performance degradation are selected.
- “Filter 16 differential pressure” is specified as a parameter related to a certain device, and is input to the performance evaluation device 30a.
- the given factor related to the device that affects the performance degradation is also a parameter that is affected by the degradation of the device (the filter 16).
- the setting receiving unit 38a acquires each parameter of the given factor input by the user.
- the setting reception unit 38a forms an arbitrary given factor selected
- the given factor evaluation unit 33a instructs the function generation unit 32 to generate a function indicating the relationship between the given factor selected in step S22 and the performance.
- the function generation unit 32 determines each parameter (in the above example, “load”, “atmospheric pressure”, “temperature”, “humidity”, and “filter 16 differential pressure”) and performance (for example, “filter 16 differential pressure”) in the first given factor parameter group. Efficiency)) from the operating data.
- the function generating unit 32 generates a function (first function) indicating the relationship between each parameter of the first given factor parameter group and the performance based on the extracted data (step S231). For example, the function generator 32 performs multiple regression analysis with the objective variable being “efficiency” and the explanatory variables being “load”, “atmospheric pressure”, “temperature”, “humidity”, and “filter 16 differential pressure”.
- One function f1 is calculated.
- the given factor evaluation unit 33a performs a standardization process on each parameter of the first given factor parameter group selected in step S22, and excludes the influence of each given factor (step S241). For example, when the efficiency of the plant 1 greatly fluctuates according to the load (for example, the performance is good when operating at the rated load, and the performance decreases when operating at the partial load), the first function f1 indicates Since the performance of three months (for example, the efficiency of the plant 1 obtained by dividing the output of the plant 1 by the fuel calorie and the fuel flow rate) is affected by the load fluctuation, the influence of the load fluctuation must be excluded. For example, the original performance of the plant 1 cannot be grasped.
- the given factor evaluation unit 33a performs a standardization process on the parameter “load” of the first function f1 using, for example, an average value of loads for three months as a reference value. Similarly, a standardization process is performed on the other parameters of the first given factor parameter group, so that the effects of all the parameters included in the first given factor parameter group are excluded.
- a model (Model 1) indicating the parameters and the performance of the plant 1 is calculated (step S251). Model1 includes each parameter and performance of the first given factor parameter group after the standardization processing.
- the performance evaluation device 30a executes the following processes of steps S222 to S252 separately from the processes of steps S231 to S251. That is, the setting reception unit 38a excludes a factor related to a device (device for which deterioration is to be examined) whose effect on performance is to be examined among the given factors selected by the user in step S22 (step S222). In the above example, the setting receiving unit 38a excludes “filter 16 differential pressure” from “load”, “atmospheric pressure”, “air temperature”, “humidity”, and “filter 16 differential pressure”. The setting receiving unit 38a forms, as a second given factor parameter group, a parameter group obtained by removing parameters related to the device from the first given factor parameter group.
- the given factor evaluation unit 33a instructs the function generation unit 32 to generate a function indicating the relationship between the given factor (second given factor parameter group) selected in step S222 and the performance.
- the function generation unit 32 calculates the parameters (“load”, “atmospheric pressure”, “temperature”, “humidity”) and performance (eg, “efficiency”) of the second given factor parameter group in the operation data. Extract from The function generating unit 32 generates a function (second function) indicating a relationship between each parameter of the second given factor parameter group and the performance based on the extracted data (step S232). For example, the function generation unit 32 calculates a second function f2 by performing multiple regression analysis with the objective variable being “efficiency” and the explanatory variables being “load”, “atmospheric pressure”, “temperature”, and “humidity”.
- the given factor evaluation unit 33a excludes the influence of each given factor by performing a standardization process on the value of each parameter of the second given factor parameter group (step S242).
- a standardization process is performed on each parameter using the same reference value as in step S241.
- the given factor evaluation unit 33a generates a model (Model2) including each parameter and performance of the second given factor parameter group when the influence on all parameters included in the second given factor parameter group is excluded. It is calculated (step S252).
- the given factor evaluation unit 33a specifies the influence (deterioration amount) of the factor of the device on the performance from the difference between Model1 and Model2 (Step S26).
- Model 1 includes the efficiency excluding the influence of each parameter of the first given factor parameter group including “filter 16 differential pressure”
- Model 2 includes the second given factor parameter group excluding “filter 16 differential pressure”.
- the given factor evaluation unit 33a calculates a difference between the efficiency indicated by Model1 and the efficiency indicated by Model2, and identifies the difference as an effect of a factor relating to the device (“filter 16 differential pressure”) on performance.
- the given factor evaluation unit 33a compares the specified effect (deterioration amount) on performance with a predetermined threshold (step S27). If the deterioration amount is within the threshold, the processing of this flowchart ends.
- the control factor evaluation unit 34a specifies the device related to the parameter of the given factor whose deterioration amount is outside the threshold value, and selects the control factor related to the device and the device selected in step S22.
- the giving factor is selected (step S28).
- the device related to the parameter of the given factor (“filter 16 differential pressure”) whose deterioration amount has exceeded the threshold is “filter 16”, and the control factor related to the device is “GT inlet pressure loss”. is there.
- the correspondence between a given factor that affects the performance degradation, a device, and a control factor related to the device is predetermined.
- control factor evaluation unit 34a causes the function generation unit 32 to generate a function of the control factor (maintenance parameter) selected in step S28, a given factor (each parameter of the first given factor parameter group), and performance.
- the function generation unit 32 adds the parameter of “GT inlet pressure loss” to the first given factor parameter group selected in step S22, and indicates a function indicating the relationship between the plurality of added parameters and the performance of the plant 1 (
- a third function is generated (step S29).
- the function generation unit 32 sets the objective variable as “efficiency” and the explanatory variables as “load”, “atmospheric pressure”, “temperature”, “humidity”, “filter 16 differential pressure”, and “GT inlet pressure loss”.
- a third function f3 is calculated by performing a regression analysis.
- the control factor evaluation unit 34a excludes the influence of each parameter by setting each of the values of the maintenance parameters in addition to each parameter of the first given factor parameter group to a predetermined reference value. For example, when the performance of the plant 1 fluctuates in accordance with the “GT inlet pressure loss”, the performance of the plant 1 for three months indicates an increase in the GT inlet pressure loss (clogging of the filter 16 due to an increase in the operation time of the plant 1). And the pressure loss gradually increases).
- the performance value calculated by the first function f1 includes an effect of a decrease in the performance of the plant 1 due to an increase in the GT inlet pressure loss.
- the control factor evaluation unit 34a sets all parameters included in the first given factor parameter group as A model (Model 3) including each parameter and performance when the influence on the maintenance parameter is excluded is calculated (step S30).
- a standardization process is performed on each parameter of the first given factor parameter group using the same reference value as in step S241.
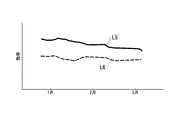
- control factor evaluation unit 34a specifies an improvement effect of the device (step S31). For example, the control factor evaluation unit 34a calculates the degree of influence of the control factor (maintenance parameter), and specifies an improvement effect based on the degree of influence. The control factor evaluation unit 34a may calculate the difference between Model1 and Model3 as the degree of influence. For example, the control factor evaluating unit 34a calculates the first factor calculated by performing the standardization process on each parameter of the first given factor parameter group based on the first function f1 in a predetermined period (three months from January to March).
- a third performance value calculated by performing a standardization process on a first given factor parameter group and a maintenance parameter based on a change amount of a performance value (performance B: for example, a solid line graph L5 in FIG. 5) and a third function f3.
- Performance B for example, a solid line graph L5 in FIG. 5
- a third function f3. (Performance A: For example, a difference from the change amount of the broken line graph L6 in FIG. 5) may be calculated.
- the device is a device corresponding to the “given factor related to the device that affects the performance degradation” input in step S22.
- the decrease in efficiency (0.5%) indicated by the graph L5 includes the effect of the fluctuation of the GT inlet pressure loss during this period, and the decrease in efficiency (0%) indicated by the graph L6. .2%) excludes the effect of fluctuations in GT inlet pressure loss during this period.
- the difference (0.3%) between the performance degradation of the graph L5 and the performance of the graph L6 is the influence of the GT inlet pressure loss.
- the GT inlet pressure loss in March is larger than the GT inlet pressure loss in January, and the output efficiency of the plant 1 is much lower in March than in January due to the effect of the GT inlet pressure loss. It is considered to indicate that.
- the control factor evaluation unit 34a calculates the difference between 0.5 and 0.2, and sets 0.3 as the degree of influence of the GT inlet pressure loss.
- the control factor evaluation unit 34a specifies that the improvement measure for the efficiency reduction is replacement of the filter 16, and specifies that the improvement effect is the same value 0.3 as the calculated degree of influence.
- the control factor evaluation unit 34a may add the fuel price or the like to 0.3%, calculate the cost (fuel cost) that can be saved during this time, and specify this cost as the degree of influence or the improvement effect.
- the output unit 35 displays a remedy (Step S32). Specifically, the output unit 35 displays a graph in which improvement measures such as those illustrated in FIG. 6 are ranked in order of influence (in order of improvement effect). This allows the user to understand which control factors affect the performance and the degree of the influence. By obtaining the latest operation data from the plant 1 as needed through the communication unit 37 and performing the processing of steps S21 to S32, it is possible to grasp the maintenance work necessary for the current plant.
- step S22 the user specifies other given factors whose effect on performance is to be examined, and by repeating the same processing, it is possible to calculate an improvement effect for other control factors.
- the control factor evaluator 34a similarly calculates the maintenance parameters other than the GT inlet pressure loss such as the GT exhaust pressure loss, the GT inlet guide valve angle, and the compressor efficiency at two time points (for example, January and March).
- the difference between the change amount of the first performance value (performance B) and the change amount of the third performance value (performance A) is calculated.
- the control factor evaluation unit 34a records the calculated degree of influence in the storage unit 36 for each control factor. If there is a relationship between the control factor and the performance degradation as in the above example, the change with time (second change amount) of the performance after excluding the influence of the control factor is the change with time of the performance before the exclusion. (First change amount).
- step S28 when there is a group of control factors having a strong correlation of the degree of influence on the performance of the plant 1, the process from step S28 may be performed by adding the group to the explanatory variable for each group. For example, when the correlation between the GT inlet pressure loss and the compressor efficiency is strong, the multiple regression analysis is performed by adding the GT inlet pressure loss and the compressor efficiency in addition to the first given factor parameter group. Then, in addition to the first given factor parameter group, a standardization process is performed on the maintenance parameters “GT inlet pressure loss” and “compressor efficiency” to calculate the degree of influence of “GT inlet pressure loss” and “compressor efficiency”. .
- the given factors and control factors are not limited to those exemplified above. For example, by performing a process of calculating the degree of influence on a control factor whose contribution to performance is unknown, it can be used for the purpose of finding out what control factor parameter contributes to performance. Not only for the control factor, but also for a given factor, comparing the performance information before and after excluding the effect of the given factor on the performance, determines how much the given factor affects the performance. You can check.
- the function generator 32 generates a function f4 indicating the relationship between “atmospheric pressure”, “humidity”, “load”, and “efficiency”.
- the given factor evaluation unit 33a calculates the efficiency (performance B) when the value of “load” is set to each reference value.
- the function generation unit 32 adds a parameter “temperature” of a given factor, and generates a function f4 ′ indicating a relationship between “atmospheric pressure”, “humidity”, “load”, “temperature” and “efficiency”. I do.
- the given factor evaluation unit 33a calculates the efficiency (performance A) when the values of “load” and “temperature” are set to the respective reference values.
- the given factor evaluation unit 33a calculates the difference between the change amount of the performance A and the change amount of the performance B during the three months, thereby calculating the degree of influence of the given factor “air temperature” on the performance. it can.
- the performance information after excluding the influence of the given factor is further examined for the degree of influence of control acceptance.
- the processing for calculating the degree of influence of the control information is not limited to this.
- the influence of the control factor is calculated without excluding the influence of the given factor, and by comparing them, the environment where the temperature is high can be calculated. It is possible to distinguish between a control factor that is effective (having a large influence) in (summer) and a control factor that is effective in an environment with low temperature (winter). For example, when the humidity is high, the filter 16 is quickly clogged. By calculating the degree of influence of the GT inlet pressure loss based on the operation data at the time when the humidity is high, it is possible to plan the replacement timing of the filter 16 and the like.
- the output unit 35 may output a graph (for example, a graph L6 in FIG. 5) after removing the influence of the control factor as well as the given factor. Thereby, the user can confirm a change in performance after excluding the influence of the control factor. For example, when a plant is introduced in an environment where the GT inlet pressure loss is high, the performance after the introduction can be estimated by standardizing the performance data to a reference value having a high GT inlet pressure loss.
- FIG. 10 is a diagram illustrating an example of a hardware configuration of a performance evaluation device according to an embodiment of the present invention.
- the computer 900 is, for example, a PC (Personal Computer) or a server terminal device including a CPU 901, a main storage device 902, an auxiliary storage device 903, an input / output interface 904, and a communication interface 905.
- the above-described performance evaluation devices 30 and 30a are mounted on a computer 900.
- the operation of each processing unit described above is stored in the auxiliary storage device 903 in the form of a program.
- the CPU 901 reads out the program from the auxiliary storage device 903, expands the program in the main storage device 902, and executes the above processing according to the program.
- the CPU 901 secures a storage area corresponding to the storage unit 36 in the main storage device 902 according to a program.
- the CPU 901 secures a storage area for storing data being processed in the auxiliary storage device 903 according to a program.
- the auxiliary storage device 903 is an example of a non-transitory tangible medium.
- Other examples of the non-transitory tangible medium include a magnetic disk, a magneto-optical disk, a CD-ROM, a DVD-ROM, and a semiconductor memory connected via the input / output interface 904.
- this program is distributed to the computer 900 via a communication line, the computer 900 that has received the program may load the program into the main storage device 902 and execute the above processing.
- the program may be for realizing some of the functions described above.
- the program may be a program that realizes the above-described function in combination with another program already stored in the auxiliary storage device 903, that is, a so-called difference file (difference program).
- the given factor evaluation units 33 and 33a and the control factor evaluation units 34 and 34a are examples of a performance evaluation unit.
- a decrease of 0.5% in the efficiency of the plant 1 illustrated in FIG. 5 is an example of the first change amount, and a decrease of 0.2% is an example of the second change amount.
- the output unit 35 is an example of a performance output unit and an effect output unit.
- GT inlet pressure loss is an example of a maintenance parameter.
- the influence of any factor on the performance of the plant is evaluated, or the original performance of the plant excluding the influence of those factors is evaluated. be able to.
Landscapes
- Engineering & Computer Science (AREA)
- Physics & Mathematics (AREA)
- General Physics & Mathematics (AREA)
- Chemical & Material Sciences (AREA)
- Combustion & Propulsion (AREA)
- Mechanical Engineering (AREA)
- General Engineering & Computer Science (AREA)
- Automation & Control Theory (AREA)
- Testing Of Devices, Machine Parts, Or Other Structures Thereof (AREA)
- Testing Of Engines (AREA)
- Testing And Monitoring For Control Systems (AREA)
Abstract
プラントの性能に対する任意の要因の影響を評価することができる性能評価装置を提供する。性能評価装置は、プラントの性能と一つまたは複数のパラメータとの関係を示す関数に基づいて、前記パラメータの各々が所定の値をとるときの前記性能を示す点を、前記関数が示す多次元曲面に沿って、前記パラメータの少なくとも一つが所定の基準値となるように移動させることによって、当該パラメータが前記基準値となったときの前記性能を算出する性能評価部、を備える。
Description
本発明は、性能評価装置、性能評価方法及び性能影響度出力方法に関する。
本願は、2018年8月6日に、日本に出願された特願2018-147952号に基づき優先権を主張し、その内容をここに援用する。
本願は、2018年8月6日に、日本に出願された特願2018-147952号に基づき優先権を主張し、その内容をここに援用する。
プラントの性能評価を行う場合、プラントの運転環境が性能に与える影響を考慮する必要がある。例えば、同じプラントの現在と半年前の運転効率を比較する場合、気温、湿度などを同じ条件にして比較することが望ましい。
特許文献1には、発電効率等のガスタービンの性能の変化を、2つの時刻における吸気温度、圧縮機出口圧力、ガスタービン出力の変化量と、2つの時刻の時間差(経過時間)を変数とする一次関数でモデル化することや、一次関数に基づいて算出した性能指数から、運転中のガスタービン出力、吸気温度、圧縮機出口圧力などの影響やノイズなどを除外して、ガスタービンの性能を評価することが記載されている。
特許文献1に記載の1次関数モデルは、経過時間が変数として組み込まれており、運転時間の累積による性能劣化の影響を反映した性能を推定するモデルである。しかし、プラントの性能評価を行う場合、経年劣化を考慮した性能の把握だけでなく、どのような要因が性能に影響を与え、その要因を変化させた場合にプラントの性能がどのように変化するかを把握したい場合がある。例えば、ある気温A℃で運転しているプラントが、気温B℃の環境でどのような性能を示すかを評価したい場合がある。あるいは、例えば、プラントのある部品の性能がメンテナンスによって向上することが分かっている場合、現在のプラントにそのメンテナンスを行うと、プラント全体でどのような性能になるかを知りたい場合がある。特許文献1に記載の1次関数モデルでは、このような性能を推定することができない。
本発明は、上述の課題を解決することのできる性能評価装置、性能評価方法及び性能影響度出力方法を提供する。
本発明の一態様によれば、性能評価装置は、プラントの性能と一つまたは複数のパラメータとの関係を示す関数に基づいて、前記パラメータの各々が所定の値をとるときの前記性能を示す点を、前記関数が示す多次元曲面に沿って、前記パラメータの少なくとも一つが所定の基準値となるように移動させることによって、当該パラメータが前記基準値となったときの前記性能を算出する性能評価部、を備える。
本発明の一態様によれば、前記性能評価部は、前記プラントから収集した運転データに含まれる制御できない要因である所与要因パラメータとそれに対応する前記性能を示す点を、前記所与要因パラメータの少なくとも一つが所定の基準値となるように移動させることによって、当該所与要因パラメータの前記基準値に基づいて標準化した前記性能を算出する。
本発明の一態様によれば、前記性能評価装置は、前記運転データを取得する運転データ取得部と、前記運転データに含まれるパラメータについての設定を受け付ける設定受付部と、前記運転データに含まれる複数の前記パラメータと前記性能との関係を示す関数を生成する関数生成部と、をさらに備え、前記設定受付部は、前記運転データに含まれる前記所与要因パラメータの選択を受け付け、第1所与要因パラメータ群を形成し、前記関数生成部は、前記運転データに含まれる前記性能と前記第1所与要因パラメータ群の各パラメータとの関係を示す第1関数を生成し、前記性能評価部は、前記第1関数に基づいて前記第1所与要因パラメータ群の各パラメータの値をそれぞれの基準値とすることにより前記第1所与要因パラメータ群の各パラメータの影響を除外した第1性能値を算出する。
本発明の一態様によれば、前記設定受付部は、前記第1所与要因パラメータ群のうち、機器の劣化の影響を受けるパラメータの設定を受け付け、当該パラメータを除外して第2所与要因パラメータ群を形成し、前記関数生成部は、前記運転データに含まれる前記性能と前記第2所与要因パラメータ群の各パラメータとの関係を示す第2関数を生成し、前記性能評価部は、前記第2関数に基づいて前記第2所与要因パラメータ群の各パラメータの値をそれぞれの基準値とすることにより前記第2所与要因パラメータ群の各パラメータの影響を除外した第2性能値を算出し、前記性能評価部において、前記第1性能値と前記第2性能値の差分を算出し、前記機器の劣化量をさらに算出する。
本発明の一態様によれば、前記設定受付部は、前記運転データに含まれる制御可能な要因である制御要因パラメータのうち、その影響度を評価する一つまたは複数の保守パラメータの設定を受け付け、前記関数生成部は、前記第1所与要因パラメータ群に前記保守パラメータを加えた複数のパラメータと前記性能との関係を示す第3関数を生成し、前記性能評価部は、前記第3関数に基づいて前記第1所与要因パラメータ群に前記保守パラメータを加えた前記複数のパラメータの値をそれぞれの基準値とすることにより前記複数のパラメータの影響を除外した第3性能値を算出する。
本発明の一態様によれば、前記性能評価装置は、前記性能評価部が算出した前記所与要因パラメータの影響を除外した後の性能値を出力する性能出力部をさらに備える。
本発明の一態様によれば、前記性能評価部は、前記第1関数に基づいて算出した前記第1所与要因パラメータ群の各パラメータの影響を除外した前記第1性能値と、前記第3関数に基づいて算出した前記第1所与要因パラメータ群の各パラメータの影響および前記保守パラメータの影響を除外した前記第3性能値との差に基づいて、前記保守パラメータの前記性能に対する影響の大きさを算出する。
本発明の一態様によれば、前記性能評価部は、所定の期間における前記第1関数に基づく前記性能値の第1変化量が、当該期間における前記第3関数に基づく前記性能値の第2変化量より大きい場合、前記第1変化量から前記第2変化量を減じた値に基づいて、前記保守パラメータの影響度を算出する。
本発明の一態様によれば、前記保守パラメータに対応する改善策と、前記保守パラメータの影響度に基づく前記改善策の効果を出力する効果出力部をさらに備える。
本発明の一態様によれば、性能評価方法は、プラントの性能と一つまたは複数のパラメータとの関係を示す関数に基づいて、前記パラメータの各々が所定の値をとるときの前記性能を示す点を、前記関数が示す多次元曲面に沿って、前記パラメータの少なくとも一つが所定の基準値となるように移動させることによって、当該パラメータが前記基準値となったときの前記性能を算出する。
本発明の一態様によれば、性能評価方法は、プラントの状態を示す複数のパラメータと性能の情報を含む運転データを取得するステップと、前記パラメータに含まれる制御できない要因である所与要因パラメータの選択を受け付け、第1所与要因パラメータ群を形成するステップと、前記運転データに含まれる前記性能と前記第1所与要因パラメータ群の各パラメータとの関係を示す第1関数を生成するステップと、前記第1関数に基づいて前記第1所与要因パラメータ群の各パラメータの値をそれぞれの基準値とすることにより前記第1所与要因パラメータ群の各パラメータの影響を除外した第1性能値を算出するステップと、を有する。
本発明の一態様によれば、前記性能評価方法は、前記運転データに含まれる制御可能な要因である制御要因パラメータのうち、その影響度を評価する一つまたは複数の保守パラメータの設定を受け付けるステップと、前記第1所与要因パラメータ群に前記保守パラメータを加えた複数のパラメータと前記性能との関係を示す第3関数を生成するステップと、前記第3関数に基づいて前記第1所与要因パラメータ群に前記保守パラメータを加えた前記複数のパラメータの値をそれぞれの基準値とすることにより前記複数のパラメータの影響を除外した第3性能値を算出するステップと、をさらに有する。
本発明の一態様によれば、性能影響度出力方法は、上記の性能評価方法によって算出した影響度とともに前記保守パラメータの前記性能に対する影響を改善する改善策の情報を出力する。
上記した性能評価装置、性能評価方法及び性能影響度出力方法によれば、プラントの性能に対する任意の要因の影響を評価したり、それらの要因の影響を除外したプラント本来の性能を評価したりすることができる。
<第一実施形態>
以下、本発明の一実施形態によるプラントの性能評価方法について図1~図7を参照して説明する。
図1は、本発明に係る一実施形態における性能評価の対象とするプラントの模式図である。
図1に示すように、本実施形態において性能評価の対象とするプラント1は、例えば、ガスタービン10と、排熱回収ボイラー20と、復水器21と、蒸気タービン22と、ガスタービン10および蒸気タービン22のロータと接続された発電機40と、これら各機器を制御する制御装置15と、を備えるガスタービンコンバインドサイクル発電プラントである。
以下、本発明の一実施形態によるプラントの性能評価方法について図1~図7を参照して説明する。
図1は、本発明に係る一実施形態における性能評価の対象とするプラントの模式図である。
図1に示すように、本実施形態において性能評価の対象とするプラント1は、例えば、ガスタービン10と、排熱回収ボイラー20と、復水器21と、蒸気タービン22と、ガスタービン10および蒸気タービン22のロータと接続された発電機40と、これら各機器を制御する制御装置15と、を備えるガスタービンコンバインドサイクル発電プラントである。
ガスタービン10は、圧縮機11と、燃焼器12と、タービン13と、を備えている。圧縮機11が空気を吸入する流れの上流側には、劣化の原因となる空気中の物質を取り込まないようにフィルター16が設けられ、空気の吸入量を調整するためにGT(ガスタービン)入口案内弁(IGV:inlet guide vane)17が設けられる。燃焼器12には、燃料供給源14からの燃料を燃焼器12に供給する燃料ラインが接続されている。圧縮機11は外気を圧縮して圧縮空気を生成する。燃焼器12は、燃料ガスと圧縮機11が生成した圧縮空気を混合して燃焼させ高温の燃焼ガスを生成する。タービン13は、燃焼ガスにより回転駆動する。タービン13の排気口は排熱回収ボイラー20と接続されている。排熱回収ボイラー20は、タービン13から排出される排熱と、復水器21から供給された水を利用して蒸気を生成し、この蒸気で蒸気タービン22を回転駆動させる。タービン13と蒸気タービン22の回転により、発電機40が発電する。蒸気タービン22から排出された蒸気は復水器21で水に戻され、この水は、排熱回収ボイラー20へ供給される。
制御装置15は、プラント1の運転データを取得し、発電機40の負荷が所望の値となるように、ガスタービン10および蒸気タービン22の制御を行う。プラント1の運転データとは、例えば、ガスタービン10の負荷、気温、湿度などの計測値である。運転データには、制御装置15が、プラント1を制御するために生成した制御値(IGV17の開度指令値など)が含まれる。運転データは、計測値や制御値に基づいて演算された値(直接計測できない状態量の推定値や、プラント1の性能など)を含む。
運転データには、気温、湿度などの環境要因や、プラント1の負荷などプラントを運用するユーザ側で制御することができない要因(これらをまとめて所与要因と呼ぶ)と、ユーザ側で制御することができる要因(制御要因または保守要因と呼ぶ)が含まれている。
所与要因とは、例えば、プラント1の負荷、ガスタービン10の負荷、燃焼器12に供給される燃料ガスの燃料カロリー、蒸気タービン22からの蒸気を冷却するために復水器21へ供給する水の温度(復水器流入水温)、圧縮機11が吸入する空気の大気圧、温度、湿度等である。後述するように性能評価装置30は、これらの所与要因がプラント1の性能に与える影響を除外して、プラント1の性能評価を行うことができる。
制御要因とは、例えば、GT入口圧損、GT排気圧損、GT入口案内弁角度、圧縮機効率、燃料ガス温度、TCA(turbine cooling air)クーラ(圧縮機11から抽気してタービン13に供給する冷却空気を冷却するクーラ)の熱交換率、復水器21の真空度や復水温度などである。GT入口圧損は、例えば、フィルター16の交換により改善が可能である。GT排気圧損は、排熱回収ボイラー20の清掃により改善が可能である。GT入口案内弁角度は、制御装置15の制御により制御可能である。圧縮機効率は、圧縮機11の翼の洗浄等により改善が可能である。燃料ガス温度は、制御装置15の制御により制御可能である。TCAクーラの熱交換率はTCAクーラの熱交換器の清掃などにより改善が可能である。復水器21の真空度や復水温度は復水器21の清掃により改善が可能である。後述するように本実施形態の性能評価装置30は、これらの制御要因が、プラント1の性能に与える影響度を評価することができる。
図1に示すように制御装置15と性能評価装置30とは、ネットワーク(NW)を介して接続されている。制御装置15は、所与要因と制御要因とプラント1の性能情報を含む運転データを、NWを介して性能評価装置30へ送信する。性能評価装置30は、運転データを取得すると、性能情報から所与要因の影響を除外した機器本来の性能情報を算出する。性能評価装置30は、性能情報から制御要因の影響を除外した性能情報と、除外前の性能情報の差を算出して制御要因のプラント1の性能への影響度を算出する。次に図2を用いて、性能評価装置30について説明する。
図2は、本発明に係る一実施形態における性能評価装置のブロック図である。
性能評価装置30は、運転データ取得部31と、関数生成部32と、所与要因評価部33と、制御要因評価部34と、出力部35と、記憶部36と、通信部37とを備えている。
性能評価装置30は、運転データ取得部31と、関数生成部32と、所与要因評価部33と、制御要因評価部34と、出力部35と、記憶部36と、通信部37とを備えている。
運転データ取得部31は、制御装置15が送信した運転データを取得し、その運転データを記憶部36に記録する。
関数生成部32は、運転データを用いて、性能情報と、所与要因および制御要因との関係を示す関数やモデルを生成する。関数生成部32は、重回帰分析やニューラルネットワークなどの統計的手法により関数を生成する。
関数生成部32は、運転データを用いて、性能情報と、所与要因および制御要因との関係を示す関数やモデルを生成する。関数生成部32は、重回帰分析やニューラルネットワークなどの統計的手法により関数を生成する。
(所与要因の影響の除外)
所与要因評価部33は、運転データに含まれるプラント1の性能情報から、所与要因の影響を除外する。具体的には、所与要因X1、X2、・・・、Xnがある値x1、x2、・・・、xnをとるときに性能値Y1の値がy1だった場合、所与要因評価部33は、(x1、x2、・・・、xn、y1)の関係を示す点を、所与要因X1~Xnの各々の値が、所与要因X1~Xnの各々について定められた基準値となるように、関数生成部32が生成した関数が示す多次元曲面に沿って移動させ、移動後の点における性能値Y1の値を算出する。これにより、例えば、運転データに含まれる様々な所与要因の条件下で達成された複数の性能情報の値が、基準となる1つの条件下における性能情報に揃えられ、所与要因の差を気にすることなく比較可能となる。換言すれば、複数の性能情報から、所与要因の影響が除外され、標準化された性能情報を得ることができる。ここで、図3を用いて上記の標準化処理の一例について説明する。
所与要因評価部33は、運転データに含まれるプラント1の性能情報から、所与要因の影響を除外する。具体的には、所与要因X1、X2、・・・、Xnがある値x1、x2、・・・、xnをとるときに性能値Y1の値がy1だった場合、所与要因評価部33は、(x1、x2、・・・、xn、y1)の関係を示す点を、所与要因X1~Xnの各々の値が、所与要因X1~Xnの各々について定められた基準値となるように、関数生成部32が生成した関数が示す多次元曲面に沿って移動させ、移動後の点における性能値Y1の値を算出する。これにより、例えば、運転データに含まれる様々な所与要因の条件下で達成された複数の性能情報の値が、基準となる1つの条件下における性能情報に揃えられ、所与要因の差を気にすることなく比較可能となる。換言すれば、複数の性能情報から、所与要因の影響が除外され、標準化された性能情報を得ることができる。ここで、図3を用いて上記の標準化処理の一例について説明する。
図3は、本発明に係る一実施形態における所与要因の影響を除外する処理の一例を説明する図である。
図3に性能情報の一例としてプラント1の効率、所与要因の一例として圧縮機11が吸入する空気の温度(気温)を取り上げ、これらの関係を示す。説明の便宜のため、性能情報と1つの所与要因の関係を例に説明を行うが、所与要因パラメータの種類は複数あってよい。効率は、プラント1の出力を燃焼器12への燃料の投入量(燃料流量)および燃料カロリーで除算することで演算することができる。
図3に性能情報の一例としてプラント1の効率、所与要因の一例として圧縮機11が吸入する空気の温度(気温)を取り上げ、これらの関係を示す。説明の便宜のため、性能情報と1つの所与要因の関係を例に説明を行うが、所与要因パラメータの種類は複数あってよい。効率は、プラント1の出力を燃焼器12への燃料の投入量(燃料流量)および燃料カロリーで除算することで演算することができる。
図3(a)は、効率(縦軸)と温度(横軸)の関係を示すグラフである。図中、四角印の点は、異なる時点に取得された運転データに含まれる気温と、運転データに含まれる燃料の流量および燃料カロリーおよびプラント1の出力を用いて演算により求めた効率との関係をプロットしたものである。曲線L1は、関数生成部32が、四角印の点から単回帰分析などにより生成した関数を示す。所与要因が複数存在する場合には、重回帰分析により関数を生成することができる。一般にプラント1は、気温が低い程、高効率の運転が可能となり、気温が上昇すると効率が低下する。曲線L1は、このような気温とプラント1の効率の関係を含んでおり、プラント1単体の性能を必ずしも示していない。例えば、点P1と点P3を比較すると、点P1の時点の方が、効率が高い。しかし、点P1の時点のプラント1の性能が、点P3の時点のプラント1の性能よりも高いとは限らない。例えば、点P1の時点のプラント1の性能は点P3時点の性能に比べ劣化しているが、運転環境が良い(気温が低い)ために点P1の効率が高くなっている可能性がある。そこで、所与要因評価部33は、所与要因(気温)の影響を除外する標準化処理を行う。例えば、気温T1を基準値として、様々な気温下で達成された効率を、気温T1の下での効率に換算することにより標準化を行う。この場合、所与要因評価部33は、全ての四角印の点のそれぞれを、各点に対応する気温の値がT1となるように、曲線L1に沿って移動させる。例えば、点P1の場合、破線矢印のように点P1を移動させる。その結果、点P1は星印の点P1´へ移動する。点P1´における効率の値が、標準化後の(気温T1下での)効率である。点P2、点P3の場合も同様に、各点から曲線L1に沿って伸びる破線矢印に従って、それぞれ星印の点P2´、点P3´まで移動させる。移動後の点P2´における効率の値が、点P2時点における標準化後の効率である。移動後の点P3´における効率の値が、点P3時点における標準化後の効率である。このように同じ気温下での効率に揃えることで、気温の影響を受けずに効率の比較が可能になる。
図3(b)は、効率(縦軸)とその効率が得られた時間(横軸)の関係を示すグラフである。図3(b)のグラフは、上記処理により得られた標準化後の各時点における効率の値を、その効率を達成した時間と効率の関係を示すグラフ上にプロットしなおしたものである。曲線L2は、関数生成部32が、星印の点から回帰分析などにより生成した近似曲線である。曲線L2は、時間の経過に従って効率が徐々に低下していることを示している。例えば、点P1´~P3´が、この順番で1か月ごとに得られた運転データに基づく点であるとすると、時間の経過とともに点P1´~P3´の順で性能が劣化していることが分かる。つまり、曲線L2は、この間の気温の変動に関係なくプラント1の性能が、時間の経過とともに劣化していることを示している。
このように所与要因の影響を除外することによって、環境要因などに影響されないプラント1自体の性能の評価が可能になる。例えば、図3(b)に示すように性能情報の経時的な変化を算出することで、プラント1自体の性能の経年変化をとらえることが可能になる。
このように所与要因の影響を除外することによって、環境要因などに影響されないプラント1自体の性能の評価が可能になる。例えば、図3(b)に示すように性能情報の経時的な変化を算出することで、プラント1自体の性能の経年変化をとらえることが可能になる。
基準となる所与要因の値を、性能評価をしたい条件にすることで、所望の条件下での性能を推定することができる。例えば、年間の気温が5℃~35℃の環境で運転しているプラントの運転データが蓄積されている場合、同じ種類のプラントを、年間を通じて気温が25℃~30℃の地域で新たに導入する場合など、上記の処理によって、5℃~35℃の環境で達成された性能情報を、25℃~30℃における所定の基準値における性能情報に標準化することで、当該地域でのプラントの性能を推定することができる。
(制御要因の影響度)
制御要因評価部34は、制御要因の影響度を算出する。図4を用いて制御要因の影響度の算出処理について説明する。
図4は、本発明に係る一実施形態における制御要因の影響度を算出する処理の一例を説明する第1の図である。
図4(a)に所与要因の影響を除外した後の性能情報を時系列に沿ってプロットしたグラフを示す。これは図3(b)の曲線L2と同じグラフである。
制御要因評価部34は、制御要因の影響度を算出する。図4を用いて制御要因の影響度の算出処理について説明する。
図4は、本発明に係る一実施形態における制御要因の影響度を算出する処理の一例を説明する第1の図である。
図4(a)に所与要因の影響を除外した後の性能情報を時系列に沿ってプロットしたグラフを示す。これは図3(b)の曲線L2と同じグラフである。
まず、関数生成部32が、一つまたは複数の制御要因と図3で説明した工程で除外したパラメータを含む所与要因と性能情報との関係を示す関数を重回帰分析などの手法により生成する。上記の説明の通り、所与要因評価部33は、重回帰分析の結果から所与要因の影響を除外する標準化処理を行う。制御要因評価部34が、制御要因の影響を除外する処理を行う。説明の便宜のため、図4(b)に重回帰分析した結果得られた多次元曲面から、GT入口圧損(制御要因)と効率の関係を抽出したグラフを示す(曲線L3)。制御要因評価部34は、この関数(曲線L3)に基づいて、所与要因評価部33と同様にして、制御要因と性能情報の関係で表される点Q1~Q3を、制御要因パラメータの値が基準値(Pr1)となるまで、関数の曲面(曲線L3)に沿って移動させて制御要因について標準化する処理を行う。点Q1´~Q3´における効率が標準化後の値、つまり、GT入口圧損の値がPr1だとした場合の効率である。GT入口圧損が大きいと効率も低下する。例えば点Q3の効率は、点Q1が示す効率に比べて、より大きなGT入口圧損による性能低下を含んだ効率である。GT入口圧損について設定された所定の基準値Pr1に標準化することで、点Q1~Q3が示す効率から、GT入口圧損の影響を除外した点Q1´~Q3´を算出することができる。
次に図4(c)に、環境要因および制御要因の影響を除外した性能値を時系列に沿ってプロットしたグラフを示す。曲線L4は、関数生成部32が、プロットした点から回帰分析などにより生成した近似曲線である。
次に制御要因評価部34は、所与要因の影響だけを除外して得られる曲線L2と所与要因に加え制御要因の影響を除外して得られる曲線L4の差を比較して、制御要因(例えばGT入口圧損)の影響度を算出する。図4(d)に曲線L2と曲線L4を比較したグラフを示す。曲線L2は、GT入口圧損の影響を含んでいる。プラント1の運転時間の増加に伴い、フィルター16の目詰まりなどによりGT入口圧損は増大する。曲線L2の効率には、GT入口圧損の増大による低下分が含まれるため、時間T1における効率と時間T2における効率を比較すると、曲線L2における効率の低下は、曲線L4に比べ大きい。この効率の差は、GT入口圧損による差である。上記のようにGT入口圧損は制御要因であり、制御可能であるから、例えば、時間T1の時点でフィルター16の交換等を行ってGT入口圧損を改善するならば、プラント1の効率を、例えば曲線L4が示す効率に向上できる可能性がある。制御要因評価部34は、制御要因の影響除外前における2つの時点(T1、T2)の間で生じる性能の変化量と、制御要因の影響除外後における同じ2つの時点の間で生じる性能の変化量とを比較して、その差を算出する。算出された差が、当該制御要因の影響度である。
次に制御要因評価部34は、所与要因の影響だけを除外して得られる曲線L2と所与要因に加え制御要因の影響を除外して得られる曲線L4の差を比較して、制御要因(例えばGT入口圧損)の影響度を算出する。図4(d)に曲線L2と曲線L4を比較したグラフを示す。曲線L2は、GT入口圧損の影響を含んでいる。プラント1の運転時間の増加に伴い、フィルター16の目詰まりなどによりGT入口圧損は増大する。曲線L2の効率には、GT入口圧損の増大による低下分が含まれるため、時間T1における効率と時間T2における効率を比較すると、曲線L2における効率の低下は、曲線L4に比べ大きい。この効率の差は、GT入口圧損による差である。上記のようにGT入口圧損は制御要因であり、制御可能であるから、例えば、時間T1の時点でフィルター16の交換等を行ってGT入口圧損を改善するならば、プラント1の効率を、例えば曲線L4が示す効率に向上できる可能性がある。制御要因評価部34は、制御要因の影響除外前における2つの時点(T1、T2)の間で生じる性能の変化量と、制御要因の影響除外後における同じ2つの時点の間で生じる性能の変化量とを比較して、その差を算出する。算出された差が、当該制御要因の影響度である。
図5は、本発明に係る一実施形態における制御要因の影響度を算出する処理の一例を説明する第2の図である。
図5に所与要因の影響のみを除外して得られる性能曲線(実線)と所与要因および制御要因(GT入口圧損)の影響を除外して得られる性能曲線(破線)の一例を示す。この例では、所与要因の影響のみを除外した場合、1月から3月の3か月間でGT効率が0.5%低下している。一方、所与要因および制御要因の影響を除外した場合、1月から3月の3か月間でGT効率が0.2%低下している。これは、仮に3月のGT入口圧損が1月のはじめのGT入口圧損と同じであれば、0.3%効率が改善する可能性があることを意味している。例えば、3か月前にフィルター16を交換することにより、この間の性能の向上を見込むことができる。制御要因評価部34は、0.5と0.2の差を計算し、0.3をGT入口圧損の影響度とする。制御要因評価部34は、この効率低下に対する改善策がフィルター16の交換であることを特定し、その改善効果を算出した影響度と同じ値0.3とする。あるいは、制御要因評価部34は、0.3%に燃料価格などを積算して、この間に節約できるコスト(燃料費)を算出してこのコストを影響度としてもよい。
図5に所与要因の影響のみを除外して得られる性能曲線(実線)と所与要因および制御要因(GT入口圧損)の影響を除外して得られる性能曲線(破線)の一例を示す。この例では、所与要因の影響のみを除外した場合、1月から3月の3か月間でGT効率が0.5%低下している。一方、所与要因および制御要因の影響を除外した場合、1月から3月の3か月間でGT効率が0.2%低下している。これは、仮に3月のGT入口圧損が1月のはじめのGT入口圧損と同じであれば、0.3%効率が改善する可能性があることを意味している。例えば、3か月前にフィルター16を交換することにより、この間の性能の向上を見込むことができる。制御要因評価部34は、0.5と0.2の差を計算し、0.3をGT入口圧損の影響度とする。制御要因評価部34は、この効率低下に対する改善策がフィルター16の交換であることを特定し、その改善効果を算出した影響度と同じ値0.3とする。あるいは、制御要因評価部34は、0.3%に燃料価格などを積算して、この間に節約できるコスト(燃料費)を算出してこのコストを影響度としてもよい。
制御要因ごとに改善策は予め定められている。GT入口圧損以外の制御要因に対する改善策は、上記した通り、例えば、GT排気圧損に対する改善策は排熱回収ボイラー20の清掃であり、圧縮機効率に対する改善策は圧縮機11の翼の洗浄等である。
制御要因評価部34は、複数の制御要因のそれぞれに対して上記のような影響度の算出処理、改善策の特定処理を行い、各制御要因の影響度を算出し、改善策と改善策の導入による改善効果の特定を行う。
複数の制御要因の間に強い相関がある場合、制御要因評価部34は、複数の制御要因を1つのグループとして、このグループ単位で、影響度の算出処理、改善策の特定処理を行ってもよい。複数の制御要因の間に強い相関があるとは、例えば、空気中の粉塵が多く含まれている場合、GT入口圧損と圧縮機効率との間に、フィルター16の目詰まりしやすく(GT入口圧損が上昇する)、圧縮機も汚れやすい(圧縮機効率が低下する)との相関があり、さらに効率の観点から、単にGT入口圧損が上昇した場合や、圧縮機11の効率が低下した場合よりも、GT入口圧損の上昇と圧縮機効率の低下が同時に生じた場合に、より大きな影響がGTに効率に及ぶような場合のことである。このような相関がある制御要因の組み合わせについては、まず、関数生成部32が、GT入口圧損と圧縮機効率の2つのパラメータと性能情報との関係を含む関数を生成する。制御要因評価部34が2つのパラメータについて同時に標準化する処理を行って、GT入口圧損と圧縮機効率の2つのパラメータの値を基準値に揃えたときの性能情報と標準化前の性能情報の差を算出するようにして制御要因の影響度を評価する。もし、プラントの運転環境の空気が、粉塵を多く含むようであれば、この影響度の値は大きくなる。ユーザは、この評価結果に基づいて、フィルター16の交換や圧縮機11の洗浄を計画することができる。フィルター16の交換や圧縮機11の洗浄以外に、GT入口圧損と圧縮機効率が同時に低下するような事態に対する有効な改善策があれば、制御要因評価部34は、この2つの組合せに特有の改善策を提示してもよい。プラントの運転環境の空気が、GT入口圧損と圧縮機効率の相関関係に強く働きかけるような空気の状態(粉塵を多く含む等)ではない場合、制御要因評価部34が、この2つの制御要因の組み合わせについて算出する影響度は大きな値とはならない。その場合、ユーザは、他の影響度の大きな改善策の実行を検討する。
(評価結果の出力)
出力部35は、所与要因の影響を除外した後の性能情報のグラフ(例えば図3(b))を出力する。ユーザは、所与要因の影響を除外した性能曲線を見て、プラント1の機器本来の性能や、性能の変化(劣化の程度など)を把握することができる。出力部35は、図5に例示する所与要因の影響のみを除外したグラフと、所与要因および制御要因の影響を除外したグラフとの対比出力などを行う。
出力部35は、制御要因評価部34が特定した改善策とその改善効果の一覧を、例えば改善効果が大きいものから順にランキングして表示する。
出力部35は、所与要因の影響を除外した後の性能情報のグラフ(例えば図3(b))を出力する。ユーザは、所与要因の影響を除外した性能曲線を見て、プラント1の機器本来の性能や、性能の変化(劣化の程度など)を把握することができる。出力部35は、図5に例示する所与要因の影響のみを除外したグラフと、所与要因および制御要因の影響を除外したグラフとの対比出力などを行う。
出力部35は、制御要因評価部34が特定した改善策とその改善効果の一覧を、例えば改善効果が大きいものから順にランキングして表示する。
図6は、本発明に係る一実施形態における制御要因に関係する性能劣化への改善策と改善効果の一例を示す図である。
図6に改善策と改善効果の一覧を示す。図6に示す例では、性能改善効果が高い改善策から順に、GT入口フィルター(フィルター16)取替、HRSG(排熱回収ボイラー20)チューブ清掃等が、それぞれの改善効果とともに左から順に並べて表示されている。ユーザは、この一覧を見て、制御要因に対する手当てによってどの程度プラント1の性能を向上することができるかを把握することができる。改善効果とは、それぞれの影響度に基づく値であって、図5の例であれば、GT入口圧損の影響度の0.3%をそのままGT入口フィルターの改善効果としても良いし、0.3%に対応するコスト(燃料費)を改善効果としてもよい。
出力部35は、例えば、改善効果の棒グラフの横に、改善策導入に要するコスト(諸々の費用、導入に係る時間、導入時の発電停止による損失など)を併せて表示するようにしてもよい。ユーザは、コストを考慮しながら、より総合的に、改善策の導入を検討することができる。
図6に改善策と改善効果の一覧を示す。図6に示す例では、性能改善効果が高い改善策から順に、GT入口フィルター(フィルター16)取替、HRSG(排熱回収ボイラー20)チューブ清掃等が、それぞれの改善効果とともに左から順に並べて表示されている。ユーザは、この一覧を見て、制御要因に対する手当てによってどの程度プラント1の性能を向上することができるかを把握することができる。改善効果とは、それぞれの影響度に基づく値であって、図5の例であれば、GT入口圧損の影響度の0.3%をそのままGT入口フィルターの改善効果としても良いし、0.3%に対応するコスト(燃料費)を改善効果としてもよい。
出力部35は、例えば、改善効果の棒グラフの横に、改善策導入に要するコスト(諸々の費用、導入に係る時間、導入時の発電停止による損失など)を併せて表示するようにしてもよい。ユーザは、コストを考慮しながら、より総合的に、改善策の導入を検討することができる。
記憶部36は、運転データや、関数生成部32が生成した関数、所与要因の影響を除外した後のグラフ、所与要因および制御要因の影響を除外した後のグラフ、制御要因ごとの影響度、制御要因と改善策の対応表などを記憶する。
通信部37は、制御装置15とのデータ通信を行う。通信部37によって、リアルタイムにプラント1から運転データを取得することができるので、性能評価装置30は、最新の運転データに基づいて、適宜、現在のプラント1の性能評価を行うことができる。例えば、所与要因の影響を除外したプラント1の性能の変化を日々把握することができる。制御要因による性能の劣化をリアルタイムに把握することができるので、適切なタイミングで改善策を導入し、性能の維持を図ることができる。
図7は、本発明の一実施形態における性能評価処理の一例を示すフローチャートである。図7を用いて性能評価処理の流れについて説明する。
まず、運転データ取得部31が、通信部37を介して、制御装置15から運転データを取得する(ステップS11)。運転データには、プラント1の負荷、気温などの所与要因のパラメータと、GT入口圧損などの制御要因のパラメータと、ガスタービン10の効率などのプラント1に関する性能情報が含まれている。性能情報については、性能情報の演算に必要な運転データを取得して性能評価装置30側で演算して求めてもよい。運転データ取得部31は、取得した運転データを記憶部36に記録する。
まず、運転データ取得部31が、通信部37を介して、制御装置15から運転データを取得する(ステップS11)。運転データには、プラント1の負荷、気温などの所与要因のパラメータと、GT入口圧損などの制御要因のパラメータと、ガスタービン10の効率などのプラント1に関する性能情報が含まれている。性能情報については、性能情報の演算に必要な運転データを取得して性能評価装置30側で演算して求めてもよい。運転データ取得部31は、取得した運転データを記憶部36に記録する。
次に関数生成部32が、関数を生成する(ステップS12)。関数生成部32は、記憶部36から、同じ時点における複数の所与要因、複数の制御要因、1つの性能情報をセットとする運転データを多数セット読み出して、これらの関係を示す関数を生成する。関数の生成には、重回帰分析やニューラルネットワーク等の手法を用いることができる。関数生成部32は、生成した関数を記憶部36に記録する。
次に所与要因評価部33が、重回帰分析等により求めた関数を用いて、性能情報から所与要因の影響を除外する(ステップS13)。具体的には、図3を用いて説明したように、所与要因評価部33は、プラント1の負荷、ガスタービン10の負荷、燃料カロリー、復水器流入水温、大気圧、気温、湿度等の所与要因パラメータのうちの任意のパラメータについて標準化する処理を行って、所与要因パラメータの値の違いが性能情報に与える影響を除外する。所与要因評価部33は、標準化した各所与要因の値と、制御要因の値と、標準化後の性能情報とを対応付けて記憶部36に記録する。
出力部35は、所与要因の影響を除外した、機器本来の性能情報を表示する(ステップS14)。出力部35は、記憶部36から所与要因の影響を除外した後の性能情報を取得し、例えば、図3(b)で例示したグラフを表示し可視化する。これにより、ユーザは、プラント1の機器本来の性能、劣化度などを把握することができる。例えば、機器の一部が損傷しているような場合に、その損傷による性能の変化が所与要因の変動などにより確認しにくいような状況でも、所与要因の影響を除外した後の性能情報の表示を行うことにより、性能の変化を的確に検出することができる。
次に重回帰分析等により求めた関数を用いて、性能情報から各所与要因と制御要因の影響を除外する処理を行う(ステップS15)。具体的には、図3、図4を用いて説明したように、所与要因評価部33が、所与要因パラメータのそれぞれについて標準化する処理を行う。制御要因評価部34が、制御要因のうちの1つについて、当該制御要因パラメータについて標準化する処理を行う。制御要因評価部34は、例えば、GT入口圧損、GT排気圧損、GT入口案内弁角度、圧縮機効率、燃料ガス温度、TCAクーラ熱交換率、復水器真空度の各々について、個別に標準化処理を行う。制御要因評価部34は、各々の制御要因ごとに、当該制御要因と所与要因の性能情報に対する影響を除外した性能情報を、標準化した各所与要因の値と、標準化した各制御要因の値と、他の制御要因の値とを対応付けて記憶部36に記録する。
次に制御要因評価部34は、各制御要因の影響度を算出する(ステップS16)。例えば、制御要因評価部34は、GT入口圧損の影響度を算出する場合、ステップS15にて算出した所与要因による影響とGT入口圧損の性能に対する影響を除外した性能情報(性能A)と、ステップS13で算出した所与要因の性能に対する影響を除外した性能情報(性能B)との差を計算して、影響度を算出する。より具体的には、図5を用いて説明したように、制御要因評価部34は、2つの時点における性能Aの変化量と性能Bの変化量の差を計算する。制御要因評価部34は、GT入口圧損だけでなく、GT排気圧損、GT入口案内弁角度、圧縮機効率などの他の制御要因についてもそれぞれ影響度を算出する。制御要因評価部34は、算出した影響度を制御要因別に記憶部36に記録する。もし制御要因と性能劣化に関係がある場合、その制御要因の影響度はより大きな値となり(例えば、制御要因の影響除外後の性能情報の経時的変化が除外前の性能情報の経時的変化よりもより小さくなる)、性能劣化に影響がない場合には、影響度は小さな値となる。
次に出力部35が、改善策を表示する(ステップS17)。具体的には、出力部35は、図6に例示したような改善策を影響度順(改善効果順)にランキングしたグラフを表示する。これによりユーザは、どの制御要因が性能に影響するか、その影響の程度がどの程度かを把握することができる。
<第二実施形態>
以下、本発明の第二実施形態による性能評価装置について図8~図10、図5、図6を参照して説明する。
図8は、本発明に係る一実施形態における性能評価装置の第2のブロック図である。
第二実施形態に係る構成のうち、第一実施形態に係る性能評価装置30を構成する機能部と同じものには同じ符号を付し、それらの説明を省略する。
性能評価装置30aは、運転データ取得部31と、関数生成部32と、所与要因評価部33aと、制御要因評価部34aと、出力部35と、記憶部36と、通信部37と、設定受付部38aとを備えている。
以下、本発明の第二実施形態による性能評価装置について図8~図10、図5、図6を参照して説明する。
図8は、本発明に係る一実施形態における性能評価装置の第2のブロック図である。
第二実施形態に係る構成のうち、第一実施形態に係る性能評価装置30を構成する機能部と同じものには同じ符号を付し、それらの説明を省略する。
性能評価装置30aは、運転データ取得部31と、関数生成部32と、所与要因評価部33aと、制御要因評価部34aと、出力部35と、記憶部36と、通信部37と、設定受付部38aとを備えている。
設定受付部38aは、性能評価に関係するパラメータの設定を受け付ける。例えば、設定受付部38aは、性能への影響を除外したい所与要因のパラメータ(第1所与要因パラメータ群)の設定を受け付ける。設定受付部38aは、第1所与要因パラメータ群のうち、プラント1を構成する機器の劣化の影響を受けるパラメータの設定を受け付ける。設定受付部38aは、性能への影響を把握したい制御要因のパラメータ(保守パラメータ)の設定を受け付ける。
関数生成部32は、運転データに含まれるプラント1の性能と、運転データに含まれる所与要因との関係を示す関数を生成する。例えば、関数生成部32は、第1所与要因パラメータ群の各パラメータと性能との関係を示す第1関数を生成する。関数生成部32は、第1所与要因パラメータ群から機器の劣化の影響を受けるパラメータを除いた第2所与要因パラメータ群の各パラメータとプラント1の性能との関係を示す第2関数を生成する。関数生成部32は、第1所与要因パラメータ群に保守パラメータを加えた複数のパラメータとプラント1の性能との関係を示す第3関数を生成する。
所与要因評価部33aは、関数生成部32が生成した性能と第1所与要因パラメータ群の各パラメータの関係を示す第1関数に基づいて、第一実施形態と同様にして、各パラメータの値をそれぞれについて定められた基準値とすることにより、各パラメータの影響を除外したプラント1の性能を算出する。同様に、所与要因評価部33aは、第2関数に基づいて、第2所与要因パラメータ群の各パラメータの値をそれぞれの基準値とすることにより、各パラメータの影響を除外したプラント1の性能を算出する。
制御要因評価部34aは、関数生成部32が第1所与要因パラメータ群に保守パラメータを追加して生成した第3関数に基づいて、第一実施形態と同様にして、第1所与要因パラメータ群および追加した保守パラメータの値をそれぞれについて定められた基準値とすることにより、第1所与要因パラメータ群の各パラメータおよび保守パラメータの影響を除外したプラント1の性能を算出する。制御要因評価部34aは、第1所与要因パラメータ群の各パラメータおよび保守パラメータの影響を除外したプラント1の性能と、第1所与要因パラメータ群の各パラメータの影響を除外したプラント1の性能との差に基づいて、保守パラメータの影響度を算出する。
次に図9を用いて第二実施形態における性能評価処理について説明する。
図9は、本発明の一実施形態における性能評価処理の一例を示す第2のフローチャートである。図7と同様の処理については簡単に説明する。
まず、運転データ取得部31が、通信部37を介して、制御装置15から時系列の運転データを取得する(ステップS21)。運転データには、プラント1の負荷、気温、フィルター16差圧(フィルター16の前後での圧力差)などの所与要因のパラメータと、GT入口圧損などの制御要因のパラメータと、プラント1の効率などのプラント1に関する性能情報が所定期間分(例えば、3か月分)含まれている。
図9は、本発明の一実施形態における性能評価処理の一例を示す第2のフローチャートである。図7と同様の処理については簡単に説明する。
まず、運転データ取得部31が、通信部37を介して、制御装置15から時系列の運転データを取得する(ステップS21)。運転データには、プラント1の負荷、気温、フィルター16差圧(フィルター16の前後での圧力差)などの所与要因のパラメータと、GT入口圧損などの制御要因のパラメータと、プラント1の効率などのプラント1に関する性能情報が所定期間分(例えば、3か月分)含まれている。
次にユーザが、任意の所与要因を選択して(ステップS22)、性能評価装置30aに入力する。ユーザは、選択した所与要因の中から、調べたいプラント1の性能の劣化に影響のある機器に関する所与要因を特定し、特定した所与要因を性能評価装置30aに入力する。例えば、ユーザは、任意の所与要因として「負荷」、「大気圧」、「気温」、「湿度」、「フィルター16差圧」を選択して入力し、これらのうち性能の劣化に影響のある機器に関するパラメータとして「フィルター16差圧」を特定して性能評価装置30aに入力する。性能の劣化に影響のある機器に関する所与要因とは、当該機器(フィルター16)の劣化の影響を受けるパラメータでもある。設定受付部38aは、ユーザが入力した所与要因の各パラメータを取得する。設定受付部38aは、ユーザが選択した任意の所与要因を、第1所与要因パラメータ群として形成する。
次に所与要因評価部33aが、関数生成部32にステップS22で選択した所与要因と性能との関係を示す関数を生成するように指示する。関数生成部32は、第1所与要因パラメータ群の各パラメータ(上記例では「負荷」、「大気圧」、「気温」、「湿度」、「フィルター16差圧」)と性能(例えば、「効率」)とを運転データから抽出する。関数生成部32は、抽出したデータに基づいて、第1所与要因パラメータ群の各パラメータと性能との関係を示す関数(第1関数)を生成する(ステップS231)。例えば、関数生成部32は、目的変数を「効率」、説明変数を「負荷」、「大気圧」、「気温」、「湿度」、「フィルター16差圧」として、重回帰分析を行って第1関数f1を算出する。
次に、所与要因評価部33aは、ステップS22で選択した第1所与要因パラメータ群の各パラメータについて標準化処理を行って、各所与要因の影響を除外する(ステップS241)。例えば、プラント1の効率が、負荷に応じて大きく変動する場合(例えば、定格負荷で運転する場合は性能が良く、部分負荷で運転する場合は性能が低下する等)、第1関数f1が示す3か月分の性能(例えば、プラント1の出力を燃料カロリーと燃料流量で除算して得られるプラント1の効率)は、この負荷の変動の影響を受けるため、負荷変動の影響を除外しなければ、プラント1の本来の性能が把握できない。そこで、所与要因評価部33aは、第1関数f1のパラメータ「負荷」について、例えば、3か月間の負荷の平均値などを基準値とする標準化処理を行う。同様に第1所与要因パラメータ群の他のパラメータについても標準化処理を行うことにより、第1所与要因パラメータ群に含まれる全てのパラメータについての影響を除外したときの第1所与要因パラメータ群の各パラメータとプラント1の性能を示すモデル(Model1)を算出する(ステップS251)。Model1は、標準化処理後の第1所与要因パラメータ群の各パラメータと性能を含む。
性能評価装置30aは、ステップS231~ステップS251の処理とは別に、以下のステップS222~ステップS252の処理を実行する。
つまり、設定受付部38aは、ステップS22でユーザが選択した所与要因のうち性能への影響を調べたい機器(劣化を調べたい機器)に関する要因を除く(ステップS222)。上記例であれば、設定受付部38aは、「負荷」、「大気圧」、「気温」、「湿度」、「フィルター16差圧」から「フィルター16差圧」を除く。設定受付部38aは、第1所与要因パラメータ群から機器に関するパラメータを除いたパラメータ群を、第2所与要因パラメータ群として形成する。
つまり、設定受付部38aは、ステップS22でユーザが選択した所与要因のうち性能への影響を調べたい機器(劣化を調べたい機器)に関する要因を除く(ステップS222)。上記例であれば、設定受付部38aは、「負荷」、「大気圧」、「気温」、「湿度」、「フィルター16差圧」から「フィルター16差圧」を除く。設定受付部38aは、第1所与要因パラメータ群から機器に関するパラメータを除いたパラメータ群を、第2所与要因パラメータ群として形成する。
次に所与要因評価部33aが、関数生成部32にステップS222で選択した所与要因(第2所与要因パラメータ群)と性能との関係を示す関数を生成するように指示する。関数生成部32は、第2所与要因パラメータ群の各パラメータ(上記例では「負荷」、「大気圧」、「気温」、「湿度」)と性能(例えば、「効率」)とを運転データから抽出する。関数生成部32は、抽出したデータに基づいて、第2所与要因パラメータ群の各パラメータと性能との関係を示す関数(第2関数)を生成する(ステップS232)。例えば、関数生成部32は、目的変数を「効率」、説明変数を「負荷」、「大気圧」、「気温」、「湿度」として、重回帰分析を行って第2関数f2を算出する。
次に、所与要因評価部33aは、第2所与要因パラメータ群の各パラメータの値について標準化処理を行うことにより、各所与要因の影響を除外する(ステップS242)。ステップS242では、各パラメータに対して、ステップS241と同じ値の基準値を用いて標準化処理を行う。次に所与要因評価部33aは、第2所与要因パラメータ群に含まれる全てのパラメータについての影響を除外したときの第2所与要因パラメータ群の各パラメータと性能を含むモデル(Model2)を算出する(ステップS252)。
次に所与要因評価部33aは、Model1とModel2の差分から、機器に関する要因の性能への影響(劣化量)を特定する(ステップS26)。上記のようにModel1は「フィルター16差圧」を含む第1所与要因パラメータ群の各パラメータの影響を除外した効率を含み、Model2は「フィルター16差圧」を除く第2所与要因パラメータ群の各パラメータの影響を除外した効率を含む。従って、所与要因評価部33aは、Model1が示す効率とModel2が示す効率との差分を算出して、この差分を機器に関する要因(「フィルター16差圧」)が性能に与える影響として特定する。性能への影響を特定すると、次に所与要因評価部33aは、特定した性能への影響(劣化量)を、所定の閾値と比較する(ステップS27)。劣化量が閾値内の場合、本フローチャートの処理を終了する。
劣化量が閾値外の場合、制御要因評価部34aは、劣化量が閾値外となった所与要因のパラメータに関係する機器を特定し、当該機器に関連する制御要因とステップS22で選択した所与要因を選択する(ステップS28)。上記例では、劣化量が閾値外となった所与要因のパラメータ(「フィルター16差圧」)に関係する機器は「フィルター16」であり、機器に関連する制御要因は「GT入口圧損」である。性能の劣化に影響のある所与要因と、機器と、機器に関連する制御要因の対応関係は予め定められている。
次に制御要因評価部34aは、関数生成部32にステップS28で選択した制御要因(保守パラメータ)および所与要因(第1所与要因パラメータ群の各パラメータ)と性能の関数を生成するように指示する。関数生成部32は、「GT入口圧損」のパラメータを、ステップS22で選択した第1所与要因パラメータ群に追加して、追加後の複数のパラメータとプラント1の性能との関係を示す関数(第3関数)を生成する(ステップS29)。例えば、関数生成部32は、目的変数を「効率」、説明変数を「負荷」、「大気圧」、「気温」、「湿度」、「フィルター16差圧」、「GT入口圧損」として、重回帰分析を行って第3関数f3を算出する。
次に制御要因評価部34aは、第1所与要因パラメータ群の各パラメータに加え、保守パラメータの値のそれぞれを所定の基準値にすることにより、各パラメータの影響を除外する。例えば、プラント1の性能が「GT入口圧損」に応じて変動する場合、プラント1の3か月間の性能は、GT入口圧損の増大(プラント1の運転時間の増加に伴いフィルター16に詰まり等が生じ、徐々に圧損が大きくなる)の影響を受ける。例えば、第1関数f1によって算出される性能値は、GT入口圧損の増大によるプラント1の性能低下の影響を含んでいる。そこで、GT入口圧損の性能に対する影響度を把握するため、GT入口圧損をパラメータに含んだ第3関数f3において、制御要因評価部34aは、第1所与要因パラメータ群に含まれる全てのパラメータおよび保守パラメータについての影響を除外したときの各パラメータと性能を含むモデル(Model3)を算出する(ステップS30)。ステップS30では、第1所与要因パラメータ群の各パラメータに対して、ステップS241と同じ値の基準値を用いて標準化処理を行う。
次に、制御要因評価部34aは、機器の改善効果を特定する(ステップS31)。例えば、制御要因評価部34aは、制御要因(保守パラメータ)の影響度を算出し、影響度に基づいて改善効果を特定する。制御要因評価部34aは、Model1とModel3の差分を、影響度として算出してもよい。例えば、制御要因評価部34aは、所定期間(1月から3月の3か月間)における第1関数f1に基づいて第1所与要因パラメータ群の各パラメータについて標準化処理を行って算出した第1性能値(性能B:例えば、図5の実線のグラフL5)の変化量と、第3関数f3に基づいて第1所与要因パラメータ群および保守パラメータについて標準化処理を行って算出した第3性能値(性能A:例えば、図5の破線のグラフL6)の変化量との差を算出してもよい。機器とは、ステップS22で入力された「性能の劣化に影響のある機器に関する所与要因」に対応する機器である。
図5の例では、上述のようにグラフL5が示す効率の低下(0.5%)は、この間のGT入口圧損の変動の影響を含んだものであり、グラフL6が示す効率の低下(0.2%)は、この間のGT入口圧損の変動の影響を除外したものである。グラフL5とグラフL6の性能低下の差(0.3%)は、GT入口圧損の影響分である。この結果は、例えば、1月のGT入口圧損よりも3月のGT入口圧損が大きく、プラント1の出力効率は、GT入口圧損の影響によって1月よりも3月の方が大きく低下していることを示していると考えられる。GT入口圧損は制御要因であるから、必要なメンテナンス(フィルター16の交換)を行ってGT入口圧損を改善すれば、この間の効率の劣化をグラフL6が示す程度の低下に抑えられる可能性がある。制御要因評価部34aは、0.5と0.2の差を計算し、0.3をGT入口圧損の影響度とする。制御要因評価部34aは、この効率低下に対する改善策がフィルター16の交換であることを特定し、その改善効果を算出した影響度と同じ値0.3であると特定する。あるいは、制御要因評価部34aは、0.3%に燃料価格などを積算して、この間に節約できるコスト(燃料費)を算出してこのコストを影響度や改善効果として特定してもよい。
次に出力部35が、改善策を表示する(ステップS32)。具体的には、出力部35は、図6に例示したような改善策を影響度順(改善効果順)にランキングしたグラフを表示する。これによりユーザは、どの制御要因が性能に影響するか、その影響の程度がどの程度かを把握することができる。通信部37を通じてプラント1から最新の運転データを随時取得し、ステップS21~ステップS32の処理を行うことで、現在のプラントに必要な保守作業を把握することができる。
ステップS22にて、ユーザが性能への影響を調べたい他の所与要因を特定し、同様の処理を繰り返すことにより、他の制御要因についても改善効果を算出することができる。例えば、制御要因評価部34aは、GT排気圧損、GT入口案内弁角度、圧縮機効率などのGT入口圧損以外の他の保守パラメータについても同様に、2つの時点(例えば1月と3月)における第1性能値(性能B)の変化量と第3性能値(性能A)の変化量の差を計算する。制御要因評価部34aは、算出した影響度を制御要因別に記憶部36に記録する。上記例のように、もし制御要因と性能の劣化に関係がある場合、その制御要因の影響を除外した後の性能の経時的変化(第2変化量)は、除外前の性能の経時的変化(第1変化量)よりも小さくなる。
ステップS28にて、プラント1の性能への影響度の相関が強い制御要因のグループが存在する場合、そのグループ単位で説明変数に追加して、ステップS28以降の処理を行ってもよい。例えば、GT入口圧損と圧縮機効率の相関が強い場合、第1所与要因パラメータ群に加えてGT入口圧損と圧縮機効率を追加して重回帰分析を行う。そして、第1所与要因パラメータ群に加え、保守パラメータ「GT入口圧損」および「圧縮機効率」についても標準化処理を行って、「GT入口圧損」および「圧縮機効率」の影響度を算出する。
所与要因、制御要因は、上記例示したものに限定されない。例えば、性能への寄与が未知である制御要因について、影響度を算出する処理を行うことで、どのような制御要因パラメータが性能に寄与するかを発見する目的にも活用することができる。制御要因に限らず、所与要因についても、その所与要因の性能への影響を除外する前と後の性能情報を比較することで、その所与要因がどの程度、性能に影響するかを確認することができる。
例えば、関数生成部32が、「大気圧」、「湿度」、「負荷」と「効率」との関係を示す関数f4を生成する。次に所与要因評価部33aが、「負荷」の値をそれぞれの基準値にしたときの効率(性能B)を算出する。次に関数生成部32が、所与要因のパラメータ「気温」を追加し、「大気圧」、「湿度」、「負荷」、「気温」と「効率」との関係を示す関数f4´を生成する。次に所与要因評価部33aが、「負荷」および「気温」の値をそれぞれの基準値にしたときの効率(性能A)を算出する。所与要因評価部33aが、3か月間における性能Aの変化量と、性能Bの変化量との差を算出することにより、所与要因「気温」が性能に与える影響度を算出することができる。
上記処理では、所与要因の影響を除外した後の性能情報について、さらに制御容認の影響度を調べる処理とした。このような処理方法であれば、所与要因の影響が排除された、より純粋な制御要因の影響度および改善策による改善効果を算出することができる。例えば、負荷の変動などの外乱があったとしても外乱の影響を低減した状態で制御要因の影響度を算出することができる。これにより、改善策を講じた場合の費用対効果を正確に把握することができる。
しかし、制御情報の影響度を算出する処理はこれに限定されない。例えば、夏に収集した運転データと冬に収集した運転データのそれぞれについて、所与要因の影響を除外せずに、制御要因の影響度を算出し、それらを比較することで、気温が高い環境(夏)で有効な(影響度が大きい)制御要因と、気温が低い環境(冬)で有効な制御要因とを区別することができる。例えば、フィルター16は、湿度が高いと目詰まりが早くなる。湿度が高い時期の運転データに基づいて、GT入口圧損の影響度を算出することで、フィルター16の交換タイミングなどを計画することができる。
出力部35は、所与要因と同様に制御要因についても、影響を除外した後のグラフ(例えば、図5のグラフL6)を出力してもよい。これにより、ユーザは、制御要因の影響を除外した後の性能の変化などを確認することができる。例えば、GT入口圧損が高い環境にプラントを導入するような場合、性能データを、GT入口圧損が高い基準値に標準化することで、導入後の性能を推定することができる。
従来、プラントの性能を評価する場合、環境要因の影響を算出する理論に基づく補正式などを作成して、この補正式によって環境要因の影響などを除外することが一般的である。このような評価処理の場合、気温、湿度などの要因ごとに補正式が必要となったり、プラントごとにその環境に合わせた補正式にカスタマイズする必要があったりするために処理コストが大きくなることが多い。これに対し、第一実施形態、第二実施形態の性能評価方法によれば、性能への影響が予測される各種パラメータ(所与要因、制御要因)を含む運転データを取得し、性能へ影響する要因を特定すれば、パラメータごとの補正式の作成を行うことなく、環境要因などの影響を除外したプラントの性能評価が可能となる。プラントごとに補正式のカスタマイズなどを行うことなく、汎用的な性能評価が可能である。性能への影響が未知な各種パラメータ(所与要因、制御要因)について標準化処理を行うことで、そのパラメータの性能への感度を調べることができる。
図10は、本発明の一実施形態における性能評価装置のハードウェア構成の一例を示す図である。
コンピュータ900は、CPU901、主記憶装置902、補助記憶装置903、入出力インタフェース904、通信インタフェース905を備える例えばPC(Personal Computer)やサーバ端末装置である。上述の性能評価装置30,30aは、コンピュータ900に実装される。そして、上述した各処理部の動作は、プログラムの形式で補助記憶装置903に記憶されている。CPU901は、プログラムを補助記憶装置903から読み出して主記憶装置902に展開し、当該プログラムに従って上記処理を実行する。CPU901は、プログラムに従って、記憶部36に対応する記憶領域を主記憶装置902に確保する。CPU901は、プログラムに従って、処理中のデータを記憶する記憶領域を補助記憶装置903に確保する。
コンピュータ900は、CPU901、主記憶装置902、補助記憶装置903、入出力インタフェース904、通信インタフェース905を備える例えばPC(Personal Computer)やサーバ端末装置である。上述の性能評価装置30,30aは、コンピュータ900に実装される。そして、上述した各処理部の動作は、プログラムの形式で補助記憶装置903に記憶されている。CPU901は、プログラムを補助記憶装置903から読み出して主記憶装置902に展開し、当該プログラムに従って上記処理を実行する。CPU901は、プログラムに従って、記憶部36に対応する記憶領域を主記憶装置902に確保する。CPU901は、プログラムに従って、処理中のデータを記憶する記憶領域を補助記憶装置903に確保する。
少なくとも1つの実施形態において、補助記憶装置903は、一時的でない有形の媒体の一例である。一時的でない有形の媒体の他の例としては、入出力インタフェース904を介して接続される磁気ディスク、光磁気ディスク、CD-ROM、DVD-ROM、半導体メモリ等が挙げられる。このプログラムが通信回線によってコンピュータ900に配信される場合、配信を受けたコンピュータ900が当該プログラムを主記憶装置902に展開し、上記処理を実行しても良い。当該プログラムは、前述した機能の一部を実現するためのものであっても良い。さらに、当該プログラムは、前述した機能を補助記憶装置903に既に記憶されている他のプログラムとの組み合わせで実現するもの、いわゆる差分ファイル(差分プログラム)であっても良い。
その他、本発明の趣旨を逸脱しない範囲で、上記した実施の形態における構成要素を周知の構成要素に置き換えることは適宜可能である。この発明の技術範囲は上記の実施形態に限られるものではなく、本発明の趣旨を逸脱しない範囲において種々の変更を加えることが可能である。
所与要因評価部33,33a、制御要因評価部34,34aは、性能評価部の一例である。図5で例示したプラント1の効率の0.5%の低下は第1変化量、0.2%の低下は第2変化量の一例である。出力部35は、性能出力部および効果出力部の一例である。GT入口圧損は保守パラメータの一例である。
所与要因評価部33,33a、制御要因評価部34,34aは、性能評価部の一例である。図5で例示したプラント1の効率の0.5%の低下は第1変化量、0.2%の低下は第2変化量の一例である。出力部35は、性能出力部および効果出力部の一例である。GT入口圧損は保守パラメータの一例である。
上記した性能評価装置、性能評価方法及び性能影響度出力方法によれば、プラントの性能に対する任意の要因の影響を評価したり、それらの要因の影響を除外したプラント本来の性能を評価したりすることができる。
1 プラント
10 ガスタービン
11 圧縮機
12 燃焼器
13 タービン
14 燃料供給源
15 制御装置
16 フィルター
17 GT入口案内弁
20 排熱回収ボイラー
21 復水器
22 蒸気タービン
30 性能評価装置
31 運転データ取得部
32 関数生成部
33、33a 所与要因評価部
34、34a 制御要因評価部
35 出力部
36 記憶部
37 通信部
38a 設定受付部
40 発電機
900 コンピュータ
901 CPU
902 主記憶装置
903 補助記憶装置
904 入出力インタフェース
905 通信インタフェース
10 ガスタービン
11 圧縮機
12 燃焼器
13 タービン
14 燃料供給源
15 制御装置
16 フィルター
17 GT入口案内弁
20 排熱回収ボイラー
21 復水器
22 蒸気タービン
30 性能評価装置
31 運転データ取得部
32 関数生成部
33、33a 所与要因評価部
34、34a 制御要因評価部
35 出力部
36 記憶部
37 通信部
38a 設定受付部
40 発電機
900 コンピュータ
901 CPU
902 主記憶装置
903 補助記憶装置
904 入出力インタフェース
905 通信インタフェース
Claims (13)
- プラントの性能と一つまたは複数のパラメータとの関係を示す関数に基づいて、前記パラメータの各々が所定の値をとるときの前記性能を示す点を、前記関数が示す多次元曲面に沿って、前記パラメータの少なくとも一つが所定の基準値となるように移動させることによって、当該パラメータが前記基準値となったときの前記性能を算出する性能評価部、
を備える性能評価装置。 - 前記性能評価部は、
前記プラントから収集した運転データに含まれる制御できない要因である所与要因パラメータとそれに対応する前記性能を示す点を、前記所与要因パラメータの少なくとも一つが所定の基準値となるように移動させることによって、当該所与要因パラメータの前記基準値に基づいて標準化した前記性能を算出する、
請求項1に記載の性能評価装置。 - 前記運転データを取得する運転データ取得部と、
前記運転データに含まれるパラメータについての設定を受け付ける設定受付部と、
前記運転データに含まれる複数の前記パラメータと前記性能との関係を示す関数を生成する関数生成部と、
をさらに備え、
前記設定受付部は、前記運転データに含まれる前記所与要因パラメータの選択を受け付け、第1所与要因パラメータ群を形成し、
前記関数生成部は、前記運転データに含まれる前記性能と前記第1所与要因パラメータ群の各パラメータとの関係を示す第1関数を生成し、
前記性能評価部は、前記第1関数に基づいて前記第1所与要因パラメータ群の各パラメータの値をそれぞれの基準値とすることにより前記第1所与要因パラメータ群の各パラメータの影響を除外した第1性能値を算出する、
請求項2に記載の性能評価装置。 - 前記設定受付部は、前記第1所与要因パラメータ群のうち、機器の劣化の影響を受けるパラメータの設定を受け付け、当該パラメータを除外して第2所与要因パラメータ群を形成し、
前記関数生成部は、前記運転データに含まれる前記性能と前記第2所与要因パラメータ群の各パラメータとの関係を示す第2関数を生成し、
前記性能評価部は、前記第2関数に基づいて前記第2所与要因パラメータ群の各パラメータの値をそれぞれの基準値とすることにより前記第2所与要因パラメータ群の各パラメータの影響を除外した第2性能値を算出し、
前記性能評価部において、前記第1性能値と前記第2性能値の差分を算出し、前記機器の劣化量をさらに算出する、
請求項3に記載の性能評価装置。 - 前記設定受付部は、前記運転データに含まれる制御可能な要因である制御要因パラメータのうち、その影響度を評価する一つまたは複数の保守パラメータの設定を受け付け、
前記関数生成部は、前記第1所与要因パラメータ群に前記保守パラメータを加えた複数のパラメータと前記性能との関係を示す第3関数を生成し、
前記性能評価部は、前記第3関数に基づいて前記第1所与要因パラメータ群の各パラメータに前記保守パラメータを加えた前記複数のパラメータの値をそれぞれの基準値とすることにより前記複数のパラメータの影響を除外した第3性能値を算出する、
請求項3または請求項4に記載の性能評価装置。 - 前記性能評価部が算出した前記所与要因パラメータの影響を除外した後の性能値を出力する性能出力部、
をさらに備える請求項3から請求項5の何れか1項に記載の性能評価装置。 - 前記性能評価部は、前記第1関数に基づいて算出した前記第1所与要因パラメータ群の各パラメータの影響を除外した前記第1性能値と、前記第3関数に基づいて算出した前記第1所与要因パラメータ群の各パラメータの影響および前記保守パラメータの影響を除外した前記第3性能値との差に基づいて、前記保守パラメータの前記性能に対する影響の大きさを算出する、
請求項5に記載の性能評価装置。 - 前記性能評価部は、所定の期間における前記第1関数に基づく前記第1性能値の第1変化量が、当該期間における前記第3関数に基づく前記第3性能値の第2変化量より大きい場合、前記第1変化量から前記第2変化量を減じた値に基づいて、前記保守パラメータの影響度を算出する、
請求項7に記載の性能評価装置。 - 前記保守パラメータに対応する改善策と、前記保守パラメータの影響度に基づく前記改善策の効果を出力する効果出力部、
をさらに備える請求項8に記載の性能評価装置。 - プラントの性能と一つまたは複数のパラメータとの関係を示す関数に基づいて、前記パラメータの各々が所定の値をとるときの前記性能を示す点を、前記関数が示す多次元曲面に沿って、前記パラメータの少なくとも一つが所定の基準値となるように移動させることによって、当該パラメータが前記基準値となったときの前記性能を算出する、
性能評価方法。 - プラントの状態を示す複数のパラメータと性能の情報を含む運転データを取得するステップと、
前記パラメータに含まれる制御できない要因である所与要因パラメータの選択を受け付け、第1所与要因パラメータ群を形成するステップと、
前記運転データに含まれる前記性能と前記第1所与要因パラメータ群の各パラメータとの関係を示す第1関数を生成するステップと、
前記第1関数に基づいて前記第1所与要因パラメータ群の各パラメータの値をそれぞれの基準値とすることにより前記第1所与要因パラメータ群の各パラメータの影響を除外した第1性能値を算出するステップと、
を有する性能評価方法。 - 前記運転データに含まれる制御可能な要因である制御要因パラメータのうち、その影響度を評価する一つまたは複数の保守パラメータの設定を受け付けるステップと、
前記第1所与要因パラメータ群に前記保守パラメータを加えた複数のパラメータと前記性能との関係を示す第3関数を生成するステップと、
前記第3関数に基づいて前記第1所与要因パラメータ群に前記保守パラメータを加えた前記複数のパラメータの値をそれぞれの基準値とすることにより前記複数のパラメータの影響を除外した第3性能値を算出するステップと、
をさらに有する請求項11に記載の性能評価方法。 - 請求項12の性能評価方法によって算出した影響度とともに前記保守パラメータの前記性能に対する影響を改善する改善策の情報を出力する、
性能影響度出力方法。
Applications Claiming Priority (2)
| Application Number | Priority Date | Filing Date | Title |
|---|---|---|---|
| JP2018-147952 | 2018-08-06 | ||
| JP2018147952A JP7014686B2 (ja) | 2018-08-06 | 2018-08-06 | 性能評価装置、性能評価方法及び性能影響度出力方法 |
Publications (1)
| Publication Number | Publication Date |
|---|---|
| WO2020031532A1 true WO2020031532A1 (ja) | 2020-02-13 |
Family
ID=69413483
Family Applications (1)
| Application Number | Title | Priority Date | Filing Date |
|---|---|---|---|
| PCT/JP2019/025307 Ceased WO2020031532A1 (ja) | 2018-08-06 | 2019-06-26 | 性能評価装置、性能評価方法及び性能影響度出力方法 |
Country Status (2)
| Country | Link |
|---|---|
| JP (1) | JP7014686B2 (ja) |
| WO (1) | WO2020031532A1 (ja) |
Families Citing this family (4)
| Publication number | Priority date | Publication date | Assignee | Title |
|---|---|---|---|---|
| JP7137592B2 (ja) * | 2020-05-16 | 2022-09-14 | 三菱電機株式会社 | 劣化診断システム、劣化診断装置および劣化診断プログラム |
| JP7542487B2 (ja) * | 2021-05-11 | 2024-08-30 | 三菱重工業株式会社 | 感度カーブ学習装置、その学習方法、性能値算出装置、および、その性能値算出方法 |
| WO2023047841A1 (ja) | 2021-09-22 | 2023-03-30 | 三菱重工業株式会社 | 機器の性能評価装置、機器の性能評価方法及び機器の性能評価プログラム |
| JP7458357B2 (ja) | 2021-09-24 | 2024-03-29 | 三菱パワー株式会社 | モデル学習装置、性能評価装置、モデル学習方法、及びプログラム |
Citations (5)
| Publication number | Priority date | Publication date | Assignee | Title |
|---|---|---|---|---|
| JP2007107446A (ja) * | 2005-10-13 | 2007-04-26 | Hitachi Ltd | ガスタービンの性能診断方法及び診断システム |
| JP2011106467A (ja) * | 2011-02-28 | 2011-06-02 | Hitachi Ltd | ガスタービンの性能診断システムにおける表示画面の表示方法 |
| JP2012008782A (ja) * | 2010-06-24 | 2012-01-12 | Mitsubishi Heavy Ind Ltd | プラントの機能を診断する方法、及びプラント監視装置 |
| JP2012021487A (ja) * | 2010-07-15 | 2012-02-02 | Central Res Inst Of Electric Power Ind | 熱効率解析方法及び熱効率解析プログラム |
| KR20130069333A (ko) * | 2012-08-29 | 2013-06-26 | 이범제 | 실시간 발전기 공급능력 산정 방법 |
Family Cites Families (10)
| Publication number | Priority date | Publication date | Assignee | Title |
|---|---|---|---|---|
| US4794535A (en) * | 1986-08-18 | 1988-12-27 | Automated Decisions, Inc. | Method for determining economic drill bit utilization |
| DE19907454A1 (de) * | 1999-02-22 | 2000-08-24 | Schenck Vibro Gmbh | Verfahren zur modellbasierten schwingungsdiagnostischen Überwachung rotierender Maschinen |
| JP3922426B2 (ja) * | 2001-09-14 | 2007-05-30 | 石川島播磨重工業株式会社 | ガスタービンの性能診断方法 |
| JP4176777B2 (ja) * | 2006-03-23 | 2008-11-05 | 三菱重工業株式会社 | ガスタービン高温部品のき裂進展予測方法及びこの方法を用いたき裂進展予測装置 |
| JP4762088B2 (ja) * | 2006-08-31 | 2011-08-31 | 株式会社東芝 | プロセス異常診断装置 |
| JP5061744B2 (ja) * | 2007-06-15 | 2012-10-31 | 横河電機株式会社 | 状況解析システムおよび状況解析方法 |
| US9323234B2 (en) * | 2009-06-10 | 2016-04-26 | Fisher-Rosemount Systems, Inc. | Predicted fault analysis |
| JP5793299B2 (ja) * | 2010-12-28 | 2015-10-14 | 株式会社東芝 | プロセス監視診断装置 |
| US20170315960A1 (en) * | 2014-11-19 | 2017-11-02 | Nec Corporation | Factor analysis apparatus, factor analysis method and recording medium, and factor analysis system |
| JP6740157B2 (ja) * | 2017-03-13 | 2020-08-12 | 株式会社東芝 | 解析装置、解析方法、及び、プログラム |
-
2018
- 2018-08-06 JP JP2018147952A patent/JP7014686B2/ja active Active
-
2019
- 2019-06-26 WO PCT/JP2019/025307 patent/WO2020031532A1/ja not_active Ceased
Patent Citations (5)
| Publication number | Priority date | Publication date | Assignee | Title |
|---|---|---|---|---|
| JP2007107446A (ja) * | 2005-10-13 | 2007-04-26 | Hitachi Ltd | ガスタービンの性能診断方法及び診断システム |
| JP2012008782A (ja) * | 2010-06-24 | 2012-01-12 | Mitsubishi Heavy Ind Ltd | プラントの機能を診断する方法、及びプラント監視装置 |
| JP2012021487A (ja) * | 2010-07-15 | 2012-02-02 | Central Res Inst Of Electric Power Ind | 熱効率解析方法及び熱効率解析プログラム |
| JP2011106467A (ja) * | 2011-02-28 | 2011-06-02 | Hitachi Ltd | ガスタービンの性能診断システムにおける表示画面の表示方法 |
| KR20130069333A (ko) * | 2012-08-29 | 2013-06-26 | 이범제 | 실시간 발전기 공급능력 산정 방법 |
Also Published As
| Publication number | Publication date |
|---|---|
| JP7014686B2 (ja) | 2022-02-01 |
| JP2020024119A (ja) | 2020-02-13 |
Similar Documents
| Publication | Publication Date | Title |
|---|---|---|
| JP4361582B2 (ja) | ガスタービンの性能診断方法及び性能診断システム | |
| CN106404403B (zh) | 用于涡轮机的分析的方法和系统 | |
| US7190149B2 (en) | Method and apparatus for determining actual reactive capability curves | |
| US10852805B2 (en) | Data center total resource utilization efficiency (TRUE) system and method | |
| CN1837767B (zh) | 降级系统的健康参数或症状的估计 | |
| JP2020024119A (ja) | 性能評価装置、性能評価方法及び性能影響度出力方法 | |
| JP5715377B2 (ja) | タービン運転劣化判定システム及び方法 | |
| CN102982488A (zh) | 用于实现发电厂操作的统计比较的自动化系统和方法 | |
| JP6511702B2 (ja) | 監視装置、対象装置の監視方法、およびプログラム | |
| EP3051075A1 (en) | Wash timing based on turbine operating parameters | |
| US11847007B2 (en) | Data center total resource utilization efficiency (TRUE) system and method | |
| JP6416610B2 (ja) | プラント機器の保守計画システム及び方法 | |
| Tsoutsanis et al. | Part-Load performance of gas turbines: Part II—multi-point Adaptation with compressor map generation and GA optimization | |
| JP2006057595A (ja) | ガスタービンの性能診断システム及び性能診断方法 | |
| JP4468282B2 (ja) | ガスタービンの性能診断方法及び診断システム | |
| CN108073145A (zh) | 运转支援装置以及程序 | |
| JP2007002673A (ja) | ガスタービン性能の分析予測方法 | |
| JP6554162B2 (ja) | 発電プラント性能評価方法及び発電プラント性能評価プログラム | |
| CN118035857A (zh) | 一种具有风险规避的航空发动机寿命预测和维护方法 | |
| EP3373233A1 (en) | Scheduling maintenance to reduce degradation of a power generation system | |
| KR20190072813A (ko) | 고압 펌프 고장 예지 방법 및 시스템 | |
| CN113513412B (zh) | 通过改变多个燃气涡轮的分流负载来对气体循环发电厂操作进行建模和控制 | |
| JP5653786B2 (ja) | 異常検出装置 | |
| JP2005248848A (ja) | ガスタービン診断方法及び装置 | |
| JP2012021487A (ja) | 熱効率解析方法及び熱効率解析プログラム |
Legal Events
| Date | Code | Title | Description |
|---|---|---|---|
| 121 | Ep: the epo has been informed by wipo that ep was designated in this application |
Ref document number: 19846827 Country of ref document: EP Kind code of ref document: A1 |
|
| NENP | Non-entry into the national phase |
Ref country code: DE |
|
| 122 | Ep: pct application non-entry in european phase |
Ref document number: 19846827 Country of ref document: EP Kind code of ref document: A1 |