WO2020009150A1 - Appareil de spectroscopie à transformée de fourier à balayage grande vitesse et procédé de spectroscopie - Google Patents
Appareil de spectroscopie à transformée de fourier à balayage grande vitesse et procédé de spectroscopie Download PDFInfo
- Publication number
- WO2020009150A1 WO2020009150A1 PCT/JP2019/026469 JP2019026469W WO2020009150A1 WO 2020009150 A1 WO2020009150 A1 WO 2020009150A1 JP 2019026469 W JP2019026469 W JP 2019026469W WO 2020009150 A1 WO2020009150 A1 WO 2020009150A1
- Authority
- WO
- WIPO (PCT)
- Prior art keywords
- light
- scanning
- fourier transform
- mirror
- phase shift
- Prior art date
Links
- 238000009615 fourier-transform spectroscopy Methods 0.000 title claims abstract description 25
- 238000004611 spectroscopical analysis Methods 0.000 title claims abstract description 10
- 238000001228 spectrum Methods 0.000 claims abstract description 59
- 230000003287 optical effect Effects 0.000 claims abstract description 53
- 230000003111 delayed effect Effects 0.000 claims abstract description 9
- 238000001514 detection method Methods 0.000 claims abstract description 9
- 230000010363 phase shift Effects 0.000 claims description 89
- 238000012937 correction Methods 0.000 claims description 40
- 230000003595 spectral effect Effects 0.000 claims description 29
- 238000012360 testing method Methods 0.000 claims description 26
- 238000000034 method Methods 0.000 claims description 17
- 238000010801 machine learning Methods 0.000 claims description 7
- 239000013078 crystal Substances 0.000 claims description 4
- 239000012071 phase Substances 0.000 description 35
- 238000005259 measurement Methods 0.000 description 28
- 238000010586 diagram Methods 0.000 description 20
- 238000004847 absorption spectroscopy Methods 0.000 description 19
- 238000012986 modification Methods 0.000 description 12
- 230000004048 modification Effects 0.000 description 12
- 230000008859 change Effects 0.000 description 11
- 230000001427 coherent effect Effects 0.000 description 7
- 230000007246 mechanism Effects 0.000 description 6
- 238000001845 vibrational spectrum Methods 0.000 description 6
- 238000005033 Fourier transform infrared spectroscopy Methods 0.000 description 5
- 238000001069 Raman spectroscopy Methods 0.000 description 5
- 238000011088 calibration curve Methods 0.000 description 5
- 230000006870 function Effects 0.000 description 5
- 230000010287 polarization Effects 0.000 description 5
- 238000002485 combustion reaction Methods 0.000 description 4
- 239000000835 fiber Substances 0.000 description 4
- 238000003331 infrared imaging Methods 0.000 description 4
- 238000010521 absorption reaction Methods 0.000 description 3
- 238000004364 calculation method Methods 0.000 description 3
- 238000000335 coherent Raman spectroscopy Methods 0.000 description 3
- 239000002360 explosive Substances 0.000 description 3
- 238000001914 filtration Methods 0.000 description 3
- 238000005457 optimization Methods 0.000 description 3
- 238000012216 screening Methods 0.000 description 3
- 238000000411 transmission spectrum Methods 0.000 description 3
- 238000004458 analytical method Methods 0.000 description 2
- 230000007613 environmental effect Effects 0.000 description 2
- 238000002474 experimental method Methods 0.000 description 2
- 230000006872 improvement Effects 0.000 description 2
- 230000001678 irradiating effect Effects 0.000 description 2
- 239000000463 material Substances 0.000 description 2
- 230000008569 process Effects 0.000 description 2
- 230000001902 propagating effect Effects 0.000 description 2
- 235000021067 refined food Nutrition 0.000 description 2
- 230000002269 spontaneous effect Effects 0.000 description 2
- 230000001131 transforming effect Effects 0.000 description 2
- 230000007704 transition Effects 0.000 description 2
- 229910000530 Gallium indium arsenide Inorganic materials 0.000 description 1
- 238000013459 approach Methods 0.000 description 1
- 239000007864 aqueous solution Substances 0.000 description 1
- 230000005540 biological transmission Effects 0.000 description 1
- 238000006243 chemical reaction Methods 0.000 description 1
- 238000000354 decomposition reaction Methods 0.000 description 1
- 230000001934 delay Effects 0.000 description 1
- 235000014113 dietary fatty acids Nutrition 0.000 description 1
- 239000006185 dispersion Substances 0.000 description 1
- 230000005684 electric field Effects 0.000 description 1
- 238000005516 engineering process Methods 0.000 description 1
- 229930195729 fatty acid Natural products 0.000 description 1
- 239000000194 fatty acid Substances 0.000 description 1
- 150000004665 fatty acids Chemical class 0.000 description 1
- 235000013305 food Nutrition 0.000 description 1
- PCHJSUWPFVWCPO-UHFFFAOYSA-N gold Chemical compound [Au] PCHJSUWPFVWCPO-UHFFFAOYSA-N 0.000 description 1
- 239000010931 gold Substances 0.000 description 1
- 229910052737 gold Inorganic materials 0.000 description 1
- 239000013056 hazardous product Substances 0.000 description 1
- 230000006698 induction Effects 0.000 description 1
- 238000007689 inspection Methods 0.000 description 1
- 230000002452 interceptive effect Effects 0.000 description 1
- 238000002372 labelling Methods 0.000 description 1
- 239000007791 liquid phase Substances 0.000 description 1
- 238000000691 measurement method Methods 0.000 description 1
- 230000005275 molecular electronic transition Effects 0.000 description 1
- 238000012544 monitoring process Methods 0.000 description 1
- 230000000737 periodic effect Effects 0.000 description 1
- 238000012545 processing Methods 0.000 description 1
- 238000005070 sampling Methods 0.000 description 1
- 239000004065 semiconductor Substances 0.000 description 1
- 238000000926 separation method Methods 0.000 description 1
- 239000007790 solid phase Substances 0.000 description 1
- CCEKAJIANROZEO-UHFFFAOYSA-N sulfluramid Chemical group CCNS(=O)(=O)C(F)(F)C(F)(F)C(F)(F)C(F)(F)C(F)(F)C(F)(F)C(F)(F)C(F)(F)F CCEKAJIANROZEO-UHFFFAOYSA-N 0.000 description 1
- 230000002123 temporal effect Effects 0.000 description 1
- 235000010692 trans-unsaturated fatty acids Nutrition 0.000 description 1
- 238000002834 transmittance Methods 0.000 description 1
Images


Classifications
-
- G—PHYSICS
- G01—MEASURING; TESTING
- G01J—MEASUREMENT OF INTENSITY, VELOCITY, SPECTRAL CONTENT, POLARISATION, PHASE OR PULSE CHARACTERISTICS OF INFRARED, VISIBLE OR ULTRAVIOLET LIGHT; COLORIMETRY; RADIATION PYROMETRY
- G01J3/00—Spectrometry; Spectrophotometry; Monochromators; Measuring colours
- G01J3/02—Details
- G01J3/0205—Optical elements not provided otherwise, e.g. optical manifolds, diffusers, windows
- G01J3/021—Optical elements not provided otherwise, e.g. optical manifolds, diffusers, windows using plane or convex mirrors, parallel phase plates, or particular reflectors
-
- G—PHYSICS
- G01—MEASURING; TESTING
- G01J—MEASUREMENT OF INTENSITY, VELOCITY, SPECTRAL CONTENT, POLARISATION, PHASE OR PULSE CHARACTERISTICS OF INFRARED, VISIBLE OR ULTRAVIOLET LIGHT; COLORIMETRY; RADIATION PYROMETRY
- G01J3/00—Spectrometry; Spectrophotometry; Monochromators; Measuring colours
- G01J3/02—Details
- G01J3/0205—Optical elements not provided otherwise, e.g. optical manifolds, diffusers, windows
- G01J3/0224—Optical elements not provided otherwise, e.g. optical manifolds, diffusers, windows using polarising or depolarising elements
-
- G—PHYSICS
- G01—MEASURING; TESTING
- G01J—MEASUREMENT OF INTENSITY, VELOCITY, SPECTRAL CONTENT, POLARISATION, PHASE OR PULSE CHARACTERISTICS OF INFRARED, VISIBLE OR ULTRAVIOLET LIGHT; COLORIMETRY; RADIATION PYROMETRY
- G01J3/00—Spectrometry; Spectrophotometry; Monochromators; Measuring colours
- G01J3/02—Details
- G01J3/0297—Constructional arrangements for removing other types of optical noise or for performing calibration
-
- G—PHYSICS
- G01—MEASURING; TESTING
- G01J—MEASUREMENT OF INTENSITY, VELOCITY, SPECTRAL CONTENT, POLARISATION, PHASE OR PULSE CHARACTERISTICS OF INFRARED, VISIBLE OR ULTRAVIOLET LIGHT; COLORIMETRY; RADIATION PYROMETRY
- G01J3/00—Spectrometry; Spectrophotometry; Monochromators; Measuring colours
- G01J3/12—Generating the spectrum; Monochromators
- G01J3/18—Generating the spectrum; Monochromators using diffraction elements, e.g. grating
-
- G—PHYSICS
- G01—MEASURING; TESTING
- G01J—MEASUREMENT OF INTENSITY, VELOCITY, SPECTRAL CONTENT, POLARISATION, PHASE OR PULSE CHARACTERISTICS OF INFRARED, VISIBLE OR ULTRAVIOLET LIGHT; COLORIMETRY; RADIATION PYROMETRY
- G01J3/00—Spectrometry; Spectrophotometry; Monochromators; Measuring colours
- G01J3/28—Investigating the spectrum
- G01J3/45—Interferometric spectrometry
- G01J3/453—Interferometric spectrometry by correlation of the amplitudes
- G01J3/4535—Devices with moving mirror
-
- G—PHYSICS
- G01—MEASURING; TESTING
- G01J—MEASUREMENT OF INTENSITY, VELOCITY, SPECTRAL CONTENT, POLARISATION, PHASE OR PULSE CHARACTERISTICS OF INFRARED, VISIBLE OR ULTRAVIOLET LIGHT; COLORIMETRY; RADIATION PYROMETRY
- G01J3/00—Spectrometry; Spectrophotometry; Monochromators; Measuring colours
- G01J3/28—Investigating the spectrum
- G01J3/45—Interferometric spectrometry
- G01J3/453—Interferometric spectrometry by correlation of the amplitudes
- G01J2003/4534—Interferometer on illuminating side
Definitions
- the present invention relates to a Fourier-transform spectroscopy apparatus and a spectroscopy method, and more particularly, to a Fourier-transform spectroscopy apparatus and a spectroscopy method for realizing high-speed absorption spectroscopy with faster scanning.
- FT-IR Fourier transform infrared spectroscopy
- FT-CARS Fourier transform coherent anti-Stokes Raman scattering
- the Fourier transform spectroscopy In the Fourier transform spectroscopy, light emitted from a light source is split by a beam splitter into reference light propagating through a first arm having a fixed mirror and scanning light propagating through a second arm having a movable mirror. An interference wave is generated using a Michelson interferometer that combines the reference light reflected by the fixed mirror of the arm and the scanning light reflected by the movable mirror of the second arm with a beam splitter, and the interference wave is detected. Irradiation.
- the Michelson interferometer the movable mirror is moved in one direction to change the optical path length of the second arm so that the scanning light is delayed with respect to the reference light, thereby interfering with the interference wave. A ferrogram is generated, and a molecular vibration spectrum is obtained by performing a Fourier transform on the interferogram.
- FT-IR In such Fourier transform spectroscopy, FT-IR generates an interferogram of transmitted light generated by the transmission of an interference wave through a test object, and performs a Fourier transform on the interferogram to perform molecular vibration of the test object. Spectrum.
- FT-CARS spectroscopy an interferogram of anti-Stokes light emitted by coherent anti-Stokes Raman scattering generated in a test object due to irradiation with an interference wave is generated, and the interferogram is subjected to Fourier transform. As a result, the molecular vibration spectrum of the test object is obtained.
- the interferogram is generated by delaying the scanning light with respect to the reference light using the Michelson interferometer, and the molecular vibration spectrum is obtained by performing the Fourier transform on the interferogram. Have gained.
- Fourier transform spectroscopy a broadband light spectrum is obtained, and absorption of the test object can be obtained.
- an interferogram is generated by changing the optical path length between the first arm and the second arm by moving the position of the movable mirror at the time of measurement.
- the generation rate of the ferogram is limited, and it is difficult to improve the acquisition rate of the molecular vibration spectrum.
- Patent Document 2 in the second arm, a scanning mirror is arranged on the optical path of the scanning light between the beam splitter and the second mirror, and the scanning is performed according to the rotation angle from the initial position of the scanning mirror.
- a technique for delaying or leading light to reference light has been proposed.
- This technology uses an interferogram of anti-Stokes light as detection light emitted by coherent anti-Stokes Raman scattering generated in a test object by irradiating an interference wave generated by an interferometer using a PC.
- This is a Fourier transform coherent anti-Stokes Raman scattering spectrometer that obtains a molecular vibration spectrum in a wide band by performing a Fourier transform.
- the change in the rotation angle can be converted into a light delay amount.
- the scanning mirror can be rotated to change the optical path length of the scanning light, and the scanning light can be delayed or advanced with respect to the reference light according to the rotation angle from the initial position of the scanning mirror.
- the scanning mirror can be moved faster than in the case where the position of the movable mirror is moved and the scanning light is delayed with respect to the reference light like a conversion spectroscope, and the acquisition speed of the molecular vibration spectrum can be further improved. It has been.
- One of the exemplary objects of the present invention is to provide a Fourier transform spectroscope and a spectroscopic method capable of realizing high-speed absorption spectroscopy by higher-speed scanning and further improving the spectrum acquisition speed and the like.
- the present inventor in the course of studying high-speed measurement means of spectra such as atom, molecular electronic transition, molecular vibration, rotation, crystal lattice vibration, etc. in Fourier transform spectroscopy, when the acquired data was Fourier-transformed Attention has been paid to correcting two degrees of freedom which cause distortion. It has been found that by correcting the two degrees of freedom, the spectrum acquisition speed can be further improved even when the scanning mirror is moved faster and linearly or nonlinearly.
- the Fourier transform spectrometer 1 shown in FIG. 1 when an optical pulse which becomes an interference wave (a waveform detected by a detector) shown in FIG.
- the present invention provides two degrees of freedom that cause such a phenomenon: correction of the nonlinearity of the group delay of the envelope 18 of the scanning light 14S with respect to the reference light 14R, and the phase of the carrier 19 in the envelope 18 with respect to the reference light 14R.
- the shift non-linearity is corrected.
- a high-speed scan Fourier transform spectrometer includes a beam splitter that splits light emitted from a light source into reference light and scanning light, and the beam splitter that reflects the reference light by a first mirror.
- a first arm that re-enters the beam splitter; and a second arm that reflects the scanning light by a second mirror and re-enters the beam splitter.
- the reference beam and the scanning light that re-enter the beam splitter are provided.
- An interferometer that generates an interference wave by multiplexing, and a light emitted from the light source or any of the multiplexed interference waves is irradiated on the test object, and the detection light obtained from the test object is obtained.
- a spectral spectrum generation unit that generates an interferogram based on the intensity of the spectrum and performs a Fourier transform on the interferogram.
- the second arm has a scanning mirror disposed on an optical path of the scanning light between the beam splitter and the second mirror, and refers to the scanning light according to a rotation angle of the scanning mirror from an initial position. Delay or precede light.
- the spectral spectrum generator corrects the nonlinearity of the group delay, which is the delay between the envelope of the reference light and the envelope of the scanning light, and the nonlinearity of the phase shift, which is the phase shift of the carrier in each of the envelopes. Is corrected.
- the scanning mirror is rotated to change the optical path length of the scanning light, and the scanning light is delayed or advanced with respect to the reference light according to the rotation angle of the scanning mirror from the initial position. Therefore, the scanning mirror can be moved at a higher speed, and the speed of spectrum acquisition in absorption spectroscopy can be further improved. Then, while correcting the nonlinearity of the group delay, which is the delay between the envelope of the reference light and the envelope of the scanning light, which occurs at that time, and correcting the nonlinearity of the phase shift, which is the phase shift for the carrier in each envelope. By setting the groups and the phases at equal intervals, fast scan Fourier transform spectroscopy in absorption spectroscopy can be realized.
- the group delay and the phase shift are obtained by using two different frequencies, and the two different frequencies are different frequencies obtained from the same light source, or Or different frequencies obtained from the two light sources.
- the group delay and the phase shift may be corrected by (i) experimentally measuring the group delay and the phase shift of the scanning light with respect to the reference light, or (ii) correcting the phase by the theoretical formula.
- the correction may be performed assuming a shift curve and a group delay curve, or (iii) the phase shift curve and the group delay curve may be corrected by machine learning optimization so as to match the shape of the spectrum. Is also good.
- the high-speed scan Fourier transform spectrometer includes a diffractive optical element, wherein the second arm is provided on an optical path of the scanning light between the beam splitter and the scanning mirror, and diffracts the scanning light. According to the rotation angle from the initial position of the scanning mirror, the optical path length difference is given to the light of each wavelength component of the scanning light, and the phase state of the light of the wavelength component in the scanning light is changed with respect to the reference light.
- the scanning light may be delayed or advanced.
- the scanning mirror may include an optical scanning element that changes an angle of incident light.
- an optical scanning element include a movable scanner such as a polygon scanner, a resonant scanner, and a galvanometric scanner, a MEMS scanner, an electro-optic crystal scanner, and an acousto-optic scanner.
- the detection light emitted from the test object may be transmitted light, reflected light, or scattered light.
- a Fourier transform spectrometer is a beam splitter that splits the light emitted from the light source into reference light and scanning light, a first arm that reflects the reference light with a first mirror and re-enters the beam splitter, A second arm that reflects the scanning light by a second mirror and re-enters the beam splitter, and generates an interference wave by multiplexing the reference light and the scanning light that re-enter the beam splitter.
- Interferometer either the light emitted from the light source or the combined interference wave is applied to the test object, and an interferogram is formed based on the intensity of the detection light obtained from the test object.
- a spectral spectrum generating unit that generates and Fourier-transforms the interferogram.
- the second arm has a scanning mirror disposed on an optical path of the scanning light between the beam splitter and the second mirror, and refers to the scanning light according to a rotation angle of the scanning mirror from an initial position. It delays or precedes light.
- the group and the phase may be equally spaced, respectively.
- the scanning mirror can be moved at high speed, and fast scan Fourier transform spectroscopy in absorption spectroscopy can be realized.
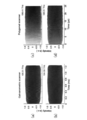
- FIGS. 2A to 2E are explanatory diagrams of two degrees of freedom to be corrected in the present invention.
- FIG. 2A shows a case where the scanning mirror is operated to move the scanning mirror linearly or nonlinearly.
- 2 (b) shows a phase form corresponding to FIG. 2 (a)
- FIG. 2 (c) shows an example of scanning light and reference light including group delay and phase shift.
- FIG. 2D shows an interference waveform when the electric field of FIG. 2C is detected by the detector
- FIG. 2E shows a spectrum waveform of FIG. 2D.
- FIG. 3A and 3B are examples of broadband absorption spectroscopy measurement of H 12 C 14 N molecules by a phase control FTS based on a galvanometric scanner, and FIG. 3A shows H 12 measured with a mode-locked laser.
- FIG. 3B is an example of a C 14 N continuous interferogram, and FIG. 3B is a broadband spectrum obtained by Fourier-transforming a single interferogram.
- 9 is an interferogram continuously measured using a mode-locked laser in broadband absorption spectrometry at a high scanning speed of 12 C 2 H 2 molecules by phase control based on a polygon scanner.
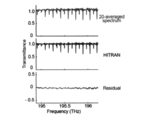
- 5 is a non-averaged transmission spectrum corresponding to the interferogram shown in FIG. FIG.
- FIG. 6 is a comparison between the 20 average spectrum and the spectrum calculated based on the HITRAN database in the examples of FIGS. 4 and 5.
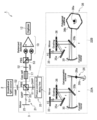
- FIG. FIG. 2 is a detailed view of the Fourier transform spectrometer shown in FIG. 1.
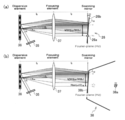
- 8A and 8B are explanatory diagrams of a scanning mechanism by phase control
- FIG. 8A is a schematic diagram of a delay line by a galvanometric scanner
- FIG. 3 is a schematic diagram of a delay line used.
- FIGS. 9 (a)-(d) are examples of continuous wave interferograms measured at two different frequencies for the phase shift and group delay added by the delay line.
- FIGS. 10A and 10B are explanatory diagrams of the phase shift of the CW interferogram.
- FIGS. 12A and 12B are explanatory diagrams of the group delay calculated from the phase shift curves at two different frequencies.
- FIGS. 12A and 12B are examples of interference waves and spectra measured by a Fourier transform spectrometer phase-controlled using an SLD light source.
- FIG. 12A shows an SLD light source at a scanning speed of 24 kHz.
- 12B is a continuous interferogram of H 12 C 14 N molecules measured in FIG. 12, and
- FIG. 12B shows a spectrum (left graph) and a 30-average spectrum (right graph) obtained by Fourier transforming a single interferogram. is there.
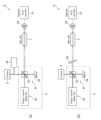
- 13 (a) and 13 (b) are schematic diagrams showing still another example of the Fourier transform type spectrometer according to the present invention, and FIG.
- FIG. 13 (a) is provided with a light source of another frequency.
- FIG. 13B has a band-pass filter.
- 14A and 14B are diagrams illustrating the correction according to the first modification.
- FIGS. 15A and 15B are diagrams illustrating calibration using a single wavelength.
- FIG. 14 is a diagram for describing correction according to Modification Example 2.
- Fourier transform spectrometer An embodiment of the Fourier transform spectrometer according to the present invention will be described with reference to the drawings.
- the present invention is not limited to the following embodiments, but includes various modifications and application examples as long as the gist is included.
- Fourier transform spectroscopy may be abbreviated as FTS.
- a Fourier transform spectrometer 1 includes a beam splitter that splits a light 13 emitted from a light source 2 into a reference light 14R and a scanning light 14S, as illustrated in FIGS. 23, a first arm (also referred to as a reference arm) 21 for reflecting the reference light 14R by the first mirror 25 and re-entering the beam splitter 23, and a beam splitter 23 for reflecting the scanning light 14S by the second mirror 35. And a second arm (also referred to as a scanning arm) 22 that re-enters the beam into the beam splitter 23.
- the interferometer generates the interference wave 14 by multiplexing the reference light 14R and the scanning light 14S that have re-entered the beam splitter 23 3 is provided. Then, either the light pulse 13 emitted from the light source 2 or the interference wave 14 multiplexed by the beam splitter 23 is applied to the test object 7, and the intensity of the detection light obtained from the test object 7 is reduced.
- a spectral spectrum generation unit 12 that generates an interferogram based on the interferogram and Fourier-transforms the interferogram is provided.
- the second arm 22 includes scanning mirrors 26b and 38b arranged on the optical path of the scanning light 14S between the beam splitter 23 and the second mirror 35.
- the scanning light 14S is delayed or preceded with respect to the reference light 14R in accordance with the rotation angles of the scanning mirrors 26b and 38b from the initial positions.
- the spectral spectrum generation unit 12 corrects a “group delay” which is a delay between the envelope 18 (envelope; the same applies hereinafter) of the reference light 14R and the envelope 18 of the scanning light 14S. It is characterized in that the group and the phase are equally spaced from each other by correcting a “phase shift” which is a phase shift of the carrier 19 in each envelope 18.
- the scanning mirrors 26b and 38b are rotated to change the optical path length of the scanning light 14S, and the scanning light 14S is used as the reference light in accordance with the rotation angle of the scanning mirrors 26b and 38b from the initial position. Since the scanning mirrors 26b and 38b can be moved at a higher speed because they can be delayed or preceded with respect to the 14R, it is possible to further improve the spectrum acquisition speed in absorption spectroscopy.
- the spectral spectrum generator 12 corrects the group delay between the envelope 18 of the reference light 14R and the envelope 18 of the scanning light 14S generated at that time, and corrects the phase shift of the carrier 19 in each envelope 18. By setting the group and the phase at equal intervals, fast scan Fourier transform spectroscopy in absorption spectroscopy is realized.
- the Fourier transform spectroscopy device 1 may include another optical element as a component as necessary.
- the light transmitted through the polarization beam splitter 23 passes outside the second mirror 35 and is reflected by the mirror 35a.
- the reflected light is diffracted by the diffractive optical element 36, reflected by the mirror 35b, and condensed by the curved mirror 30 on the scanning mirrors 26b and 38b.
- the light reflected by the curved mirror 30 passes outside the mirror 35b.
- the light reflected by the scanning mirrors 26b and 38b passes outside the mirror 35b, is reflected again by the curved mirror 30, the mirror 35b, the diffractive optical element 36, and the mirror 35a, and reaches the second mirror 35.
- the light reflected by the second mirror 35 returns to the original optical path and returns to the polarization beam splitter 23.
- FIG. 2E shows the spectrum waveform of FIG. 2D.
- the carrier 19 undergoes a non-linear phase shift with respect to time, but the change over time of the phase shift at a certain wavelength is defined by the position where the light hits and the pivot position.
- the envelope 18 also has a non-linear group delay with respect to time, and this group delay is uniquely determined by knowing the time change of the phase shift between two wavelengths. From these two points, in the state where the phase shift and the group delay have nonlinearity, even if the interference wave 14 is Fourier-transformed, the state becomes distorted. As such a correction means, the above-mentioned two points can be corrected by monitoring the time change of the phase shift of at least two wavelengths. Specifically, the following approaches can be considered.
- phase shift of two wavelengths is measured experimentally, the delay amount is corrected based on the measurement result, and the phase and the group are equally spaced.
- Group delay and phase shift are obtained using two different frequencies.
- the two different frequencies may be (i) different frequencies obtained from the two light sources 2 and 29 as shown in FIG. 13A, or (ii) shown in FIG.
- different frequencies obtained from the same light source may be used by disposing the band pass filter 43 or the like.
- the nonlinearity of group delay and phase shift may be corrected by (i) two light sources having different wavelengths prepared separately, or (ii) by two different wavelengths obtained by filtering from the light source used for absorption spectroscopy. It may be corrected. It can be said that the latter (ii) includes a case of correction using two different wavelengths obtained by filtering or wavelength tuning from one separately prepared light source.
- the bandpass filter 43 includes a fiber Bragg grating or the like as one mode.
- each correction of the group delay and the phase shift may be performed by (I) experimentally measuring the group delay and the phase shift of the scanning light 14S with respect to the reference light 14R, and using the measurement results, II) A phase shift curve and a group delay curve may be assumed by a theoretical formula and corrected using the assumed result, or (III) the phase shift curve and the group delay curve may be corrected by Optimization may be performed by machine learning so as to match, and correction may be performed using the optimized result.
- a correction function can be obtained by fitting using a theoretical formula, and the measurement result of a specific test object can be corrected using the correction function. is there.
- the machine learning optimization of the above (III) is advantageous. For example, it is preferable to collect a large number of measurement data obtained by variously distorting the phase shift curve and the group delay curve, and to apply a machine learning optimizing means when calculating a correction function from the collected large number of data. According to this method, if the calculated phase shift curve and group delay curve are provided as software, the Fourier transform spectrometer can eliminate the need for a light source for correction. The correction of the phase shift curve and the group delay curve can be updated by, for example, upgrading the version using machine learning.
- Specific correction means include several means. For example, as shown in FIG. 13A, a light pulse 13 from a light source 2 is input to a Michelson interferometer 3, and emitted light is detected by a photodetector 10 to acquire data. Further, another light source 29 having a different wavelength (for example, a CW laser having a single wavelength) is further added. . When the data thus acquired is viewed over time as a function of delay, a carrier 19 is obtained. However, when the interferometer 3 moves nonlinearly, the carrier 19 is distorted while the period changes little by little. Come out. Therefore, these signals are used for correction.
- the two wavelengths of light used may be two lasers or two different wavelengths may be demultiplexed from a single laser. Then, the lights having different wavelengths are put into the Michelson interferometer 3, and the emitted interference wave is detected by the photodetector 10, and the data is obtained and used for the same correction as described above.
- the interference waves at the two wavelengths may be acquired separately or simultaneously, and correction is performed using the result of the acquired pair of wavelength signals. In the present embodiment, since there are two degrees of freedom to be corrected, light of another wavelength is input to the Michelson interferometer 3 to perform correction using the interference waveform of each data that has come out.
- the Fourier transform spectrometer 1 includes at least a light source 2, a Michelson interferometer 3, a photodetector 10, and a spectral spectrum generator (digitizer) 12.
- the second arm 22 of the interferometer 3 includes a second mirror 35, a diffractive optical element 36, a condensing optical element 37, and scanning mirrors 26b and 38b.
- the distance between the scanning mirrors 26b and 38b and the condensing optical element 37 and the distance between the condensing optical element 37 and the diffractive optical element 36 are respectively equal to the focal length f of the condensing optical element 37. It is a so-called “4f optical system”.
- the broadband light is focused on the Fourier plane of the 4f optics after spectral separation by a dispersive element such that each spectral component is mapped to a different location on the Fourier plane.
- the scanning mirrors 26b and 38b change the angle at the angular frequency ⁇ and reflect light in an oblique direction.
- the scanning light 14S traveling through the 4f optical system is retroreflected by the second mirror 35 and returns along the same path. Since the 4f optical system is configured so that the scanning light 14S returns along the incident path at an arbitrary angle of the scanning mirrors 26b and 38b, the use of such scanning mirrors 26b and 38b makes it possible to implement the 4f optical system.
- the Fourier transform spectrometer 1 functions as a Fourier transform spectrometer capable of high-speed scanning.
- the optical frequency corresponding to the pivot position of the scanning mirrors 26b and 38b on the Fourier plane is indicated as ⁇ 0 in FIG.
- the light source 2 is not particularly limited, and a coherent mode-locked laser may be used, or a light source that uses incoherent amplified spontaneous emission light from a superluminescent diode as a broadband light source may be used.
- the coherent mode-locked laser include a fiber laser, a semiconductor laser, and a solid-state laser.
- the light source that emits the incoherent amplified spontaneous emission light may be a general lamp light source, a light source that also emits so-called incoherent light, such as an LED, an SLD, or sunlight.
- a coherent mode-locked doped fiber laser Femtolite CS-20-GS, IMRA
- an incoherent super luminescent diode S5FC1005S, Thorlabs
- a single-wavelength CW laser or the like is used as the other light source 29 having a different wavelength.
- the interferometer 3 is a scanning Michelson interferometer, and changes the time delay between beams traveling along the first arm (reference arm) and the second arm (scanning arm). Appears as a trace.
- the autocorrelation trace is digitized by converting the intensity of light interference into an electric signal (analog) by the photodetector 10 and sampling the electric signal by a digitizer (spectral spectrum generation unit).
- FIG. 7 shows an example of the interferometer 3.
- a diffractive optical element 36 having a reflection ruled grating of 600 lines / mm and a curved mirror 30 having a focal length of 150 mm are respectively combined with a diffraction element and a diffraction element. Used as an optical element.
- the number of grooves of the grating constituting the diffractive optical element 36 and the focal length of the curved mirror 30 can be arbitrarily set in order to optimize the system.
- the scanning mirror is included in an optical scanning element that changes the angle of incident light.
- the optical scanning element include a movable scanner such as a polygon scanner, a resonant scanner, and a galvanometric scanner, a MEMS scanner, and an electro-optic crystal scanner. And an acousto-optic scanner.
- the scanning mirrors 26b and 38b shown in FIG. 7 are a scanning mirror 26b included in the galvanometric scanner 28 and a scanning mirror 38b included in the polygon scanner 38. Further, a scanning mirror included in a resonant scanner (not shown) may be used.
- the scanning mirror 26b of the galvanometric scanner 26 is based on a periodic motion by a mechanism that rotates about a rotation axis 26a, and the scanning mirror 38b of the polygon scanner 38 has a polygonal column shape that rotates about a rotation axis 38a.
- the scanning mirror of the resonant scanner is based on a rotating mechanism based on resonance motion.
- the surfaces of the scanning mirrors 26b and 38b are coated with gold to have a mirror surface.
- the facet size of the galvanometric scanner 26 can be 10 mm, and the facet size of the polygon scanner 38 can be 5.6 mm as an example for each facet.
- the inside diameter of the polygon scanner 38 is 63.6 mm, and a rotation speed set to 20,000 or 40000 rpm in the experiment can be used. Note that these examples are merely examples, and other dimensions may be arbitrarily selected.
- the light collimated by the second arm 22 is split into two beams by an optional optical element such as a polarizing beam splitter or a polarization independent beam splitter.
- an arbitrary wavelength plate 51 may be provided, and adjustment is made so that the power ratio between the two output beams (reference light 14R and scanning light 14S) of the interferometer 3 is set to 50:50. be able to.
- a ⁇ wavelength plate 51 is arranged on each of the first arm 21 and the second arm 22. Since the wave plate 51 rotates the polarization of the reflected light by 90 degrees, the recombined interference wave 14 is output from the output port of the interferometer 3 having orthogonal polarization.
- the interference wave 14 passes through the test object.
- the test object can be various types of measurement objects, and examples thereof include a gas containing H 12 C 14 N or 12 C 2 H 2 as described in an experimental example described later.
- the photodetector 10 detects the interference wave 14 transmitted through the test object 7 and converts it into an electric signal, and is not particularly limited.
- One example is an InGaAs balanced photodetector (PDB415C-AC, Thorlabs).
- PDB415C-AC InGaAs balanced photodetector
- a half-wave plate 52 and a polarizing beam splitter 53 may be arranged in front of the photodetector 10 as necessary to balance the signals of the photodiodes. preferable.
- the PC 12 as a spectrum generating unit has a digitizer board mounted thereon and is connected to the digitizer board via a conductive wire.
- a mode-locked laser for the detector signal, for example, an electric signal of the intensity of the detector signal which has been low-pass filtered at 21 MHz is converted into an analog-to-digital (A / D) signal by a digitizer board.
- a / D analog-to-digital
- the digitizer board is not particularly limited, and a board that can measure a time waveform can be selected and used.
- a general oscilloscope can be used, and ATS 9440 manufactured by AlzarTech used in the present application can be used.
- the time domain data digitized in this way is divided into independent interferograms, and is subjected to Fourier transform after phase correction.
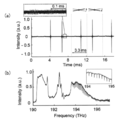
- FIG. 3 shows an example of broadband absorption spectroscopy measurement of H 12 C 14 N molecules by a phase control FTS based on a galvanometric scanner.
- FIG. 3A shows a continuous interferometer of H 12 C 14 N measured by a mode-locked laser.
- FIG. 3B is a broadband spectrum obtained by Fourier-transforming a single interferogram.
- a fiber mode-locked laser that generates a femtosecond pulse at a repetition frequency of 50 MHz is used as a light source.
- the sharp absorption line in the vibration band of HCN can be clearly observed.
- the resolution of 10 GHz corresponds to a maximum optical path length difference of 30 mm that can be achieved only by tilting the scanning mirror 26b shown in FIG.
- the scanning speed is 300 Hz (the corresponding time interval is 3.3 ms).
- the Nyquist range (0 to 25 MHz) is determined by the pulse repetition frequency of the mode-locked laser, but the Nyquist range cannot be used completely in the measurement of the galvanometric scanner.
- a polygon scanner 38 shown in FIG. 7 can be preferably used instead of the scanning mirror 26b shown in FIG. This makes it possible to fully utilize the Nyquist range and achieve the maximum scan rate at the Nyquist limit.
- FIG. 4 is an interferogram measured continuously using a mode-locked laser
- FIG. 5 is a non-averaged transmission spectrum corresponding to the interferogram
- FIG. Fig. 5 is a comparison of the spectrum calculated based on the HITRAN database. The standard deviation of the residual shown in FIG. 6 was 1.7%.
- FIG. 4 is an interferogram continuously measured at a high rotation speed of the polygon scanner 38, and bursts of the interferogram appear every 83 ⁇ s, corresponding to a scan rate of 12 kHz. And a clear modulation of the free induction decay of the molecule is observed.
- the transmission spectrum shown in FIG. 5 is a non-averaged spectrum corresponding to the interferogram, and each spectrum covers a resolution of 1.5 THz or more and 11.5 GHz, and the absorption line of C2H2 is clearly shown. To be observed.
- the spectrum was normalized and converted to transmittance using Savitzky-Golay filtering.
- the effective scanning speed is 312 m / s, which is several orders of magnitude higher than that of the conventional delay line.
- noise in the spectrum is mainly due to side modulation of the sinc function caused by rectangular Fourier transform window processing.
- This technique can arbitrarily select a combination of scanning speed, spectral bandwidth and resolution, by reducing the spectral resolution while maintaining the scanning speed, for example, measuring a wider spectral bandwidth Can be.
- This high-efficiency Fourier transform spectroscopy can be modified and applied to multidimensional Fourier transform spectroscopy.
- FIG. 7 is an explanatory diagram of a scanning mechanism by phase control in the scanning mirrors 26b and 38b included in the Fourier transform spectroscopic device 1 of FIG. 7, and FIG. 7A is a schematic diagram of a delay line by the galvanometric scanner 26. FIG. 7B is a schematic diagram of a delay line using the polygon scanner 38.
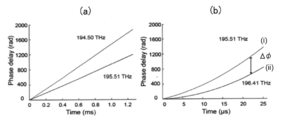
- phase correction The phase controlled delay line produces a non-linear phase shift in time. Therefore, the phase of the interferogram must be corrected before the Fourier transform. To correct and linearize the nonlinear phase shift and group delay, two calibration curves are needed to correct these two parameters, and these calibration curves are continuous wave (CW) at two different optical frequencies. It can be obtained by measuring an interferogram. The correction using the obtained calibration curve can be performed according to the procedure described in the section of [Correction] described above.
- the calibration curve was measured using an external cavity laser diode with a line width of less than 500 kHz, measuring the CW interferogram at two different frequencies, 195.51 THz and 194.50 THz for HCN measurement, and for C2H2 measurement. Measures CW interferograms at two different frequencies, 196.41 THz and 195.51 THz.
- the measurement can be accurately performed by a method using an optical frequency comb, and in a simplified manner, the frequency of the laser is ⁇ 2.6 GHz with an accuracy of an optical spectrum analyzer (for example, AQ6317B, manufactured by Yokogawa Keisoku Co., Ltd.). ) Can also be measured.
- FIGS. 9 (a)-(d) are examples of continuous wave (CW) interferograms measured at two different frequencies for the phase shift and group delay added by the delay line.
- 9A and 9B are measurement data using the galvanometric scanner 26
- FIGS. 9C and 9D are measurement data using the polygon scanner 38.
- Phase nonlinearity is clearly seen in data measured by a system using a polygon scanner.
- FIG. 10 is an explanatory diagram of the phase shift of the CW interferogram in the example of FIG.
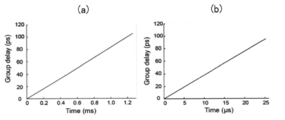
- FIG. 11 is an explanatory diagram of the group delay calculated from the phase shift at two different frequencies in the example of FIG. In these demonstrations, the maximum group delay is 100 ps, which corresponds to a spectral resolution of 10 GHz.
- FIG. 11 (a) shows a group delay curve obtained from the two phase shift curves of FIG. 10 (a).
- FIG. 11 (b) shows a group delay curve obtained from the two phase shift curves of FIG. 10 (b).
- the obtained interferogram is corrected using one of the phase shift curves obtained in FIG. This is equivalent to correcting a state in which the phase shifts nonlinearly with time.
- the non-linear transition of the phase of the interferogram is corrected, but the time transition itself, that is, the state in which the group delay is non-linearly changed remains.
- This non-linear change in group delay is corrected in the second stage.
- the group delay of the interferogram is then determined using the group delay curve obtained in FIG. 11 (b), ie, based on the two phase shift curves of FIG. 10 (b). Non-linearity is corrected.
- phase shift curve (iii) reflecting both of the two phase shift curves (i) and (ii) may be created, and the first-stage correction may be performed based on the phase shift curve (iii).
- a new phase shift curve (iii) is created based on an expression such as n ⁇ (phase shift curve (i)) ⁇ (n ⁇ 1) ⁇ (phase shift curve (ii)), where n is an integer. May be.
- FIG. 12 is an example of an interference wave and a spectrum measured by a Fourier transform spectrometer whose phase is controlled using an SLD light source.
- FIG. 12A shows H 12 C 14 measured by an SLD light source at a scanning speed of 24 kHz.
- FIG. 12B shows a spectrum (left graph) and a 30-average spectrum (right graph) obtained by Fourier transforming a single interferogram.
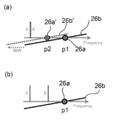
- FIG. 14A is a diagram illustrating the correction according to the first modification.
- the pivot position (position of the rotation axis) 26a of the scanning mirror 26b is movable in a direction perpendicular to the rotation axis 26a in the Fourier plane.
- p1 indicates the position of the rotating shaft 26a during normal operation.
- the scanning mirror 26b moves in the same Fourier plane in the direction perpendicular to the rotation axis 26a by shifting the rotation axis 26a from the reference position p1.
- the measurement for the calibration is performed by switching the position of the rotation axis 26a at at least two places (p1, p2) as shown in the figure while irradiating light of a single spectrum of the same wavelength (frequency f 1 ). Will be implemented.
- FIG. 14B is a diagram for explaining correction when two wavelengths are used. From the comparison between FIGS. 14A and 14B, in FIG. 14A, when the position of the rotating shaft 26a is shifted to p2 and the CW light of the frequency f1 for calibration is irradiated, the CW light 14B is equivalent to the phase shift received by the CW light when the CW light having the frequency f2 is irradiated while the position of the rotating shaft 26a is fixed at p1, as shown in FIG. 14B.
- the single frequency f1 it is possible to use the single frequency f1 to acquire the nonlinearity related to the time (or rotation angle) of the phase shift of the multiple frequencies f1 and f2.
- FIGS. 15A and 15B are diagrams for explaining calibration using a single wavelength.
- FIG. 15A shows two phase shift curves (i) and (ii). One (i) is obtained when the position of the rotation axis 26a is set to p1 in a state where the frequency f1 is irradiated, and the other (i) is obtained when the position of the rotation axis 26a is set to p2 in the state where the frequency f1 is irradiated.
- the two phase shift curves (i) and (ii) look like straight lines, but actually increase nonlinearly with time.
- the phase shift curve (ii) represents a phase shift curve of another frequency f2 different from the frequency 1 when the rotation axis 26a is p1.
- the position of the rotation shaft 38a may be made movable. That is, the rotation axis 38a may be movable in the direction parallel to the rotation axis 26a in a plane parallel to the Fourier plane. In this case, when the rotation axis 38a is shifted, the scanning mirror 38b moves in the same Fourier plane in the direction perpendicular to the rotation axis 38a.
- FIG. 16 is a diagram illustrating the correction according to the second modification.
- the frequency f1 is applied to the position q1 at the time of the normal measurement and the position q2 different from the position q1.
- the phase shift curve obtained at the position q2 represents a phase shift curve at a frequency f2 different from the frequency f1 of the calibration light.
- the method of shifting the irradiation position is not particularly limited, and can be realized by changing a part of the optical system in FIG. 1 or FIG.
- the grating 36 may be inclined.
- the correction of the group delay and the phase shift may be performed based on a theoretical calculation. That is, it is only necessary to theoretically create two phases, ie, a phase shift curve and a group delay curve, and correct them. In the case of theoretical calculation, there are two degrees of freedom (that is, the position between the pivot on the mirror and a certain frequency, and the two degrees of freedom between a certain frequency and a certain frequency). The curve may be created and calibrated before measuring the unknown spectrum.
- the current resolution of about 10 GHz can be increased to about 3 GHz.
- the expansion of the spectrum band is currently about 1.5 THz, but can be adjusted to about 10 THz by adjusting other parameters, and it can be expected to distinguish a plurality of molecular species.
- the acquisition speed is also about 12 kHz at present, but can be expected to be improved to about 100 kHz by adjusting with other parameters.
- the expansion of the wavelength region it can be expected that the wavelength region will be expanded from near-infrared to mid-infrared in the future.
- the wavelength resolution of a sanitary-mounted environmental measurement gas spectroscopic Fourier transform spectrometer is around 10 GHz, but by applying the Fourier transform spectrometer according to the embodiment, the spatial resolution of measurement is increased by improving the measurement speed. be able to.
- a wide wavelength region can be measured in a short time by improving the measurement speed.
- a Fourier transform spectrometer for field measurement environmental measurement, exhaust gas measurement, volcano It can be applied to portable systems that can be used in various situations, such as gas monitors and hazardous material monitors.
- the measurement of engine combustion in automobiles and aircrafts is performed at a spectral resolution of 10 to 20 GHz, but by applying the Fourier transform spectrometer according to the embodiment, the speed resolution is improved, and the combustion mechanism is improved. It can be applied to elucidation of (4) It can be applied to exhaust gas measurement.
- the measurement of engine combustion in automobiles and aircrafts is performed at a spectral resolution of 10 to 20 GHz.
- the present invention can be applied to food hygiene management, explosives management, and visible infrared imaging.
- FT-IR rapid analysis of total trans fatty acid content by FT-IR
- it is effective in countries such as the United States where labeling of processed foods for the content of trans fatty acids leading to an increase in LDA is required, and rapid FT -Applicable to performing processed food screening by IR.
- FT-IR rapid analysis of explosive industrial products by FT-IR
- it can be applied as a remote and simple and highly reliable explosive measurement method.
- the present invention can be used for Fourier-transform spectroscopy.
- Reference Signs List 1 Fourier transform spectroscope 2 Light source 3 Interferometer 7 Test object 10 Photodetector 11 Low-pass filter 12 PC (personal computer) as spectral spectrum generating unit Reference Signs List 13 light pulse 14 interference wave 14R reference light 14S scanning light 18 envelope 19 carrier wave 21 first arm (reference arm) 22 Second arm (scanning arm) 23 Beam splitter 25 First mirror 26 Galvanometric scanner 26a Rotation axis 26b Scanning mirror 29 Other light source (CW laser) Reference Signs List 30 curved mirror 35 second mirror 35a, 35b mirror 36 diffractive optical element 37 Condensing Optical Element 38 Polygon Scanner 38a Rotating Axis 38b Scanning Mirror 43 Bandpass Filter 51,52 Wave Plate 53 Polarizing Beam Splitter
Abstract
Dans un appareil de spectroscopie à transformée de Fourier 1, des miroirs de balayage 26b, 38b sont disposés sur l'axe optique d'une lumière de balayage 14S, la lumière de balayage 14S étant retardée ou avancée par rapport à une lumière de référence 14R en conformité avec un angle de rotation à partir des positions initiales des miroirs de balayage 26b, 38b. Une unité de génération de spectre de spectroscopie 12 génère un interférogramme sur la base de l'intensité de la lumière détectée obtenue à partir d'un objet de détection, et effectue une transformée de Fourier sur l'interférogramme. L'unité de génération de spectre de spectroscopie 12 corrige une non-linéarité d'un retard de groupe d'une enveloppe 18 de la lumière de référence 14R et d'une enveloppe 18 de la lumière de balayage 14S, et corrige une non-linéarité de déphasage dans les enveloppes 18.
Priority Applications (2)
| Application Number | Priority Date | Filing Date | Title |
|---|---|---|---|
| JP2020529032A JP7297319B2 (ja) | 2018-07-06 | 2019-07-03 | 高速スキャンフーリエ変換分光装置及び分光方法 |
| US17/140,319 US11892354B2 (en) | 2018-07-06 | 2021-01-04 | High-speed Fourier-transform spectroscopy apparatus and spectroscopy method |
Applications Claiming Priority (2)
| Application Number | Priority Date | Filing Date | Title |
|---|---|---|---|
| JP2018-129410 | 2018-07-06 | ||
| JP2018129410 | 2018-07-06 |
Related Child Applications (1)
| Application Number | Title | Priority Date | Filing Date |
|---|---|---|---|
| US17/140,319 Continuation US11892354B2 (en) | 2018-07-06 | 2021-01-04 | High-speed Fourier-transform spectroscopy apparatus and spectroscopy method |
Publications (1)
| Publication Number | Publication Date |
|---|---|
| WO2020009150A1 true WO2020009150A1 (fr) | 2020-01-09 |
Family
ID=69059182
Family Applications (1)
| Application Number | Title | Priority Date | Filing Date |
|---|---|---|---|
| PCT/JP2019/026469 WO2020009150A1 (fr) | 2018-07-06 | 2019-07-03 | Appareil de spectroscopie à transformée de fourier à balayage grande vitesse et procédé de spectroscopie |
Country Status (3)
| Country | Link |
|---|---|
| US (1) | US11892354B2 (fr) |
| JP (1) | JP7297319B2 (fr) |
| WO (1) | WO2020009150A1 (fr) |
Cited By (1)
| Publication number | Priority date | Publication date | Assignee | Title |
|---|---|---|---|---|
| WO2023283266A1 (fr) * | 2021-07-06 | 2023-01-12 | Si-Ware Systems | Analyseur de gaz reposant sur l'ia et spectroscopique à auto-étalonnage |
Families Citing this family (1)
| Publication number | Priority date | Publication date | Assignee | Title |
|---|---|---|---|---|
| WO2020009150A1 (fr) * | 2018-07-06 | 2020-01-09 | 国立大学法人東京大学 | Appareil de spectroscopie à transformée de fourier à balayage grande vitesse et procédé de spectroscopie |
Citations (5)
| Publication number | Priority date | Publication date | Assignee | Title |
|---|---|---|---|---|
| JP2000213918A (ja) * | 1999-01-21 | 2000-08-04 | Jeol Ltd | フ―リエ分光法を用いた厚み測定方法 |
| JP2001527659A (ja) * | 1997-05-16 | 2001-12-25 | マサチューセッツ インスティチュート オブ テクノロジー | 格子ベース位相制御光学遅延線 |
| JP2006215006A (ja) * | 2005-02-07 | 2006-08-17 | Fujinon Corp | 光断層画像化装置 |
| JP2014106127A (ja) * | 2012-11-28 | 2014-06-09 | Pioneer Electronic Corp | テラヘルツ波計測装置及び方法 |
| WO2017119389A1 (fr) * | 2016-01-08 | 2017-07-13 | 国立大学法人東京大学 | Dispositif spectroscopique de type à transformée de fourier |
Family Cites Families (8)
| Publication number | Priority date | Publication date | Assignee | Title |
|---|---|---|---|---|
| US6111645A (en) * | 1991-04-29 | 2000-08-29 | Massachusetts Institute Of Technology | Grating based phase control optical delay line |
| JPH0712648A (ja) | 1993-06-23 | 1995-01-17 | Fujitsu Ltd | 広視野マイケルソンフーリエ分光装置 |
| US7061622B2 (en) * | 2001-08-03 | 2006-06-13 | Case Western Reserve University | Aspects of basic OCT engine technologies for high speed optical coherence tomography and light source and other improvements in optical coherence tomography |
| JP4761817B2 (ja) * | 2005-04-22 | 2011-08-31 | 株式会社神戸製鋼所 | 干渉計,フーリエ分光装置 |
| WO2007047690A1 (fr) * | 2005-10-14 | 2007-04-26 | The General Hospital Corporation | Imagerie fluorescente codee par frequence et par spectre |
| JP2009536740A (ja) * | 2006-05-10 | 2009-10-15 | ザ ジェネラル ホスピタル コーポレイション | サンプルの周波数領域画像形成を提供するためのプロセス、構成およびシステム |
| CA3046268A1 (fr) * | 2016-12-07 | 2018-06-14 | Universite Laval | Procedes de realisation d'interferometrie a double peigne |
| WO2020009150A1 (fr) * | 2018-07-06 | 2020-01-09 | 国立大学法人東京大学 | Appareil de spectroscopie à transformée de fourier à balayage grande vitesse et procédé de spectroscopie |
-
2019
- 2019-07-03 WO PCT/JP2019/026469 patent/WO2020009150A1/fr active Application Filing
- 2019-07-03 JP JP2020529032A patent/JP7297319B2/ja active Active
-
2021
- 2021-01-04 US US17/140,319 patent/US11892354B2/en active Active
Patent Citations (5)
| Publication number | Priority date | Publication date | Assignee | Title |
|---|---|---|---|---|
| JP2001527659A (ja) * | 1997-05-16 | 2001-12-25 | マサチューセッツ インスティチュート オブ テクノロジー | 格子ベース位相制御光学遅延線 |
| JP2000213918A (ja) * | 1999-01-21 | 2000-08-04 | Jeol Ltd | フ―リエ分光法を用いた厚み測定方法 |
| JP2006215006A (ja) * | 2005-02-07 | 2006-08-17 | Fujinon Corp | 光断層画像化装置 |
| JP2014106127A (ja) * | 2012-11-28 | 2014-06-09 | Pioneer Electronic Corp | テラヘルツ波計測装置及び方法 |
| WO2017119389A1 (fr) * | 2016-01-08 | 2017-07-13 | 国立大学法人東京大学 | Dispositif spectroscopique de type à transformée de fourier |
Cited By (1)
| Publication number | Priority date | Publication date | Assignee | Title |
|---|---|---|---|---|
| WO2023283266A1 (fr) * | 2021-07-06 | 2023-01-12 | Si-Ware Systems | Analyseur de gaz reposant sur l'ia et spectroscopique à auto-étalonnage |
Also Published As
| Publication number | Publication date |
|---|---|
| JP7297319B2 (ja) | 2023-06-26 |
| JPWO2020009150A1 (ja) | 2021-08-05 |
| US20210223105A1 (en) | 2021-07-22 |
| US11892354B2 (en) | 2024-02-06 |
Similar Documents
| Publication | Publication Date | Title |
|---|---|---|
| US9207121B2 (en) | Cavity-enhanced frequency comb spectroscopy system employing a prism cavity | |
| US8917396B2 (en) | Fourier transform spectrometer with a frequency comb light source | |
| JP6389455B2 (ja) | 最適化されたkクロックを有する多速度oct掃引光源 | |
| Giorgetta et al. | Fast high-resolution spectroscopy of dynamic continuous-wave laser sources | |
| JP5445775B2 (ja) | 超高分解テラヘルツ分光計測装置 | |
| Lee et al. | Fourier-transform spectroscopy using an Er-doped fiber femtosecond laser by sweeping the pulse repetition rate | |
| US11892354B2 (en) | High-speed Fourier-transform spectroscopy apparatus and spectroscopy method | |
| US10379042B2 (en) | Fourier transform-type spectroscopic device | |
| WO2013115018A9 (fr) | Dispositif de tomographie à cohérence optique et procédé de tomographie à cohérence optique | |
| EP3865852B1 (fr) | Spectroscopie de dichroïsme circulaire vibrationnel | |
| JP5510851B2 (ja) | テラヘルツ測定法 | |
| CN107407601B (zh) | 用于补偿由光谱仪系统产生的干涉图的时间周期扰动的光谱仪系统和方法 | |
| JP5891955B2 (ja) | フーリエ変換型分光計用タイミング生成装置および該生成方法ならびにフーリエ変換型分光計および該分光方法 | |
| JP2000321134A (ja) | テラヘルツ分光光度計 | |
| Ganz et al. | Compact frequency-comb Fourier-transform infrared spectrometer | |
| JP2021047130A (ja) | 分光測定装置及び方法 | |
| JP2014228281A (ja) | フーリエ変換型分光計およびフーリエ変換型分光計の校正方法 | |
| JP2006300664A (ja) | フーリエ分光装置,測定タイミング検出方法 | |
| WO2023112909A1 (fr) | Instrument de mesure optique à étirement temporel et spectroscopie à étirement temporel | |
| Mogilnitsky et al. | Fabry-Perot interferometer in the world of pulses: New approaches and capabilities | |
| Chen et al. | Terahertz Fourier transform spectrometer based on a low-reflectivity Fabry-Perot interferometer | |
| JP2005106751A (ja) | 位相特性測定装置 | |
| Helg et al. | A novel high-resolution interference spectrometer | |
| JP2818043B2 (ja) | パルス光源を用いたフーリエ変換分光法 | |
| Milward | A complete system for interferometric Fourier spectroscopy in the far-infrared |
Legal Events
| Date | Code | Title | Description |
|---|---|---|---|
| 121 | Ep: the epo has been informed by wipo that ep was designated in this application |
Ref document number: 19830024 Country of ref document: EP Kind code of ref document: A1 |
|
| ENP | Entry into the national phase |
Ref document number: 2020529032 Country of ref document: JP Kind code of ref document: A |
|
| NENP | Non-entry into the national phase |
Ref country code: DE |
|
| 122 | Ep: pct application non-entry in european phase |
Ref document number: 19830024 Country of ref document: EP Kind code of ref document: A1 |