WO2020004353A1 - 検出装置、検出方法、及び検出プログラム - Google Patents
検出装置、検出方法、及び検出プログラム Download PDFInfo
- Publication number
- WO2020004353A1 WO2020004353A1 PCT/JP2019/025025 JP2019025025W WO2020004353A1 WO 2020004353 A1 WO2020004353 A1 WO 2020004353A1 JP 2019025025 W JP2019025025 W JP 2019025025W WO 2020004353 A1 WO2020004353 A1 WO 2020004353A1
- Authority
- WO
- WIPO (PCT)
- Prior art keywords
- particle
- particles
- flow path
- detection device
- sensor
- Prior art date
- Legal status (The legal status is an assumption and is not a legal conclusion. Google has not performed a legal analysis and makes no representation as to the accuracy of the status listed.)
- Ceased
Links
Images








Classifications
-
- G—PHYSICS
- G01—MEASURING; TESTING
- G01N—INVESTIGATING OR ANALYSING MATERIALS BY DETERMINING THEIR CHEMICAL OR PHYSICAL PROPERTIES
- G01N15/00—Investigating characteristics of particles; Investigating permeability, pore-volume or surface-area of porous materials
- G01N15/10—Investigating individual particles
-
- G—PHYSICS
- G01—MEASURING; TESTING
- G01N—INVESTIGATING OR ANALYSING MATERIALS BY DETERMINING THEIR CHEMICAL OR PHYSICAL PROPERTIES
- G01N15/00—Investigating characteristics of particles; Investigating permeability, pore-volume or surface-area of porous materials
- G01N15/10—Investigating individual particles
- G01N15/14—Optical investigation techniques, e.g. flow cytometry
-
- G—PHYSICS
- G01—MEASURING; TESTING
- G01N—INVESTIGATING OR ANALYSING MATERIALS BY DETERMINING THEIR CHEMICAL OR PHYSICAL PROPERTIES
- G01N37/00—Details not covered by any other group of this subclass
Definitions
- the present disclosure relates to a detection device, a detection method, and a detection program.
- a detection device which images particles flowing through a flow path and detects the particle size or the like of the particles based on image information.
- This type of detection device is applied to, for example, applications of detecting the state of various fine particles such as droplets, cells, microcapsules, microbubbles, or micropolymers.
- the particle size and the like of the particles are detected from the image information using a process for detecting a particle region or an image analysis algorithm such as a template matching process.
- an image analysis algorithm is useful for performing image processing on only one image, but when the number of images to be processed is large, the image analysis algorithm is not practical in terms of processing load and processing speed. Not a target.
- the number of images to be processed increases, so that such processing load and processing speed may be a problem. There is.
- the present disclosure has been made in view of the above problems, and can detect the distribution of the particle size of the particles included in the particle group to be observed or the number of particles by a simple method and with high accuracy. It is an object to provide a detection device, a detection method, and a detection program.
- a detection device for detecting the state of the entire particle group of particles transferred one by one in the flow path An input unit that acquires a sensor value of an image sensor that continuously captures a predetermined region of the flow path temporally, A calculating unit that estimates a particle size distribution of the particles included in the transferred particle group or a number of the particles based on a temporal change in a distribution of sensor values of the image sensor in a width direction of the flow path.
- It is a detection apparatus provided with.
- a detection method for detecting the state of the entire particle group of particles transferred one by one in the flow path A step of acquiring a sensor value of an image sensor that sequentially and temporally images a predetermined region of the flow path, A step of estimating the distribution of the particle size of the particles included in the transferred particle group, or the number of the particles, based on a temporal change in the distribution of the sensor values of the image sensor in the width direction of the flow path. , It is a detection method provided with.
- a detection program for detecting the state of the entire particle group of particles transferred one by one in the flow path On the computer, A process of acquiring a sensor value of an image sensor that sequentially and temporally images a predetermined region of the flow path; A process of estimating the particle size distribution of the particles included in the transferred particle group, or estimating the number of the particles, based on a temporal change in the distribution of the sensor values of the image sensor in the width direction of the channel. , Is executed.
- the detection device it is possible to detect the distribution of the particle sizes of the particles included in the particle group to be observed or the number of particles with a simple method and with high accuracy.
- FIG. 1 is a diagram illustrating an example of a configuration of a detection system according to a first embodiment.
- 2A and 2B are diagrams illustrating an example of the configuration of the droplet generation device.
- FIG. 2A is a plan view of the droplet generation device 100 as viewed from above, and FIG. It is the perspective view seen from the upper part.
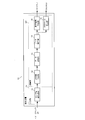
- FIG. 1 is a diagram illustrating an example of a configuration of a detection device according to a first embodiment.
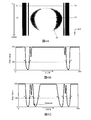
- 4A, 4B, and 4C are diagrams illustrating a method of calculating a Distance value in the particle width calculation unit according to the first embodiment
- FIG. 4A is a diagram illustrating one image in a moving image.
- FIG. 4B is a graph showing the distribution of pixel values in the row T1-T1 'in FIG. 4A
- FIG. 4C is a graph showing the distribution of pixel values in the row T2-T2' in FIG. 4A.
- 5A and 5B are diagrams illustrating details of a method of calculating the Distance value of the central region of the particle A1 in the particle width calculation unit according to the first embodiment.
- FIG. 5A illustrates the same image as FIG. 4A.
- FIG. 5B is a diagram showing a distribution of pixel values in a row of T3-T3 ′ corresponding to the central portion of the particle A1.
- FIG. 6A and 6B are diagrams for explaining details of a method of calculating the Distance value of the front end and the rear end of the particle A1 in the particle width calculation unit according to the first embodiment.
- FIG. 6A is a diagram illustrating FIG.
- FIG. 6B is a diagram showing a distribution of pixel values in a row of T4-T4 ′ corresponding to the front end of the particle A1.
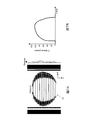
- 7A and 7B are diagrams showing the arrangement information of Distance values of one image according to the first embodiment, and FIG. 7A is the same image as FIG. 4A.
- FIG. 7B is a diagram in which arrangement information of Distance values in the image of FIG. 7A is graphed.
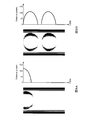
- 8A and 8B are diagrams illustrating a method of connecting Distance values in the data connection unit according to the first embodiment.
- FIG. 8A illustrates an image captured at a certain timing
- FIG. FIG. 8B is a diagram illustrating Distance values in each line
- FIG. 8B is a diagram illustrating Distance values in each line of the second image and an image captured after the first image.
- FIG. 4 is a diagram for explaining a method of connecting Distance values in a data connection unit according to the first embodiment.
- FIG. 7 is a diagram illustrating an example of linked data of Distance values in a state where one particle and another particle are not in close contact with each other according to the first embodiment.
- FIGS. 11A, 11B, and 11C are diagrams illustrating a correction process in the data correction unit according to the first embodiment
- FIG. 11A is a diagram illustrating position identification of a predetermined Distance value.
- FIG. 11B is a diagram illustrating replacement of a Distance value
- FIG. 11C is a diagram illustrating calculation of a differential value of the Distance value.
- FIG. 6 is a diagram for explaining a correction process in a data correction unit according to the first embodiment.
- FIG. 6 is a diagram for explaining a correction process in a data correction unit according to the first embodiment.
- FIGS. 14A, 14B, 14C, and 14D are diagrams comparing the diameter of the particles calculated by the particle size calculation unit according to the first embodiment with the diameter of the particles calculated by the method according to the related art.
- 14A is a diagram illustrating a first example
- FIG. 14B is a diagram illustrating a second example
- FIG. 14C is a diagram illustrating a third example
- FIG. 14D is a diagram illustrating a fourth example. It is a figure showing the example of.
- FIG. 4 is a diagram illustrating an example of a flow of an image analysis process performed by the detection device according to the first embodiment.
- FIG. 3 is a diagram illustrating an example of a configuration of a detection device according to a second embodiment.
- FIG. 1 is a diagram illustrating an example of a configuration of a detection system 1 according to the present embodiment.
- the detection system 1 includes the detection device 10, the image sensor 20, the light source 30, and the flow path 40.
- the detection system 1 is a device that detects the state of the particle group Aall existing in the storage tank 300 (typically, the particle size distribution of the particles included in the particle group Aall, and the number of particles).
- the detection system 1 according to the present embodiment is applied to, for example, a performance test of a droplet generation device, and detects a state of droplet-shaped particles (also referred to as a droplet) generated in the droplet generation device. I do.
- FIG. 2 is a diagram showing an example of the configuration of the droplet generation device 100.
- FIG. 2A is a plan view of the droplet generation device 100 as viewed from above
- FIG. 2B is a perspective view of the droplet generation device 100 as viewed from above.
- the droplet generation apparatus 100 includes a through-hole (a first liquid inlet 120, a second liquid inlet 140, and a droplet outlet 200) formed in the substrate 110, and a groove (a first channel 130, a second liquid 130).
- the common flow path 150, the second flow path 160, the third flow path 170, the droplet generation unit 180, and the droplet flow path 190 for transferring the droplet are configured.
- the substrate 110 has a first liquid introduction port 120 for introducing the first liquid, a second liquid introduction port 140 for introducing the second liquid, and the generated liquid so as to penetrate the substrate 110.
- a droplet outlet 200 for taking out droplets is formed.
- a first flow path 130, a second liquid common flow path 150, a second flow path 160, a third flow path 170, a droplet generation unit 180, and a droplet flow path 190 are formed on the upper surface of the substrate 110.
- the first flow channel 130 supplies a first liquid (for example, a liquid containing cells or the like) introduced from the first liquid introduction port 120 to the droplet generation unit 180.
- the second liquid common flow path 150, the second flow path 160, and the third flow path 170 are connected to the second liquid (for example, not compatible with the first liquid, One liquid that does not denature the liquid) is supplied to the droplet generation unit 180.
- the droplet generation unit 180 is a junction where the first liquid supplied from the first flow channel 130 and the second liquid supplied from the second flow channel 160 and the third flow channel 170 are merged.
- the first liquid from the first flow path 130 and the second liquid from the second flow path 160 and the third flow path 170 are simultaneously supplied to the droplet generation unit 180, whereby the second liquid is
- the droplets are sequentially generated so as to wrap around the first liquid. Then, the generated droplet is transferred to the droplet outlet 200 through the droplet flow channel 190.
- FIG. 1 shows a state where the droplet generation device 100 is detached from the storage tank 300.
- the particles generated by the droplet generation device 100 are, for example, droplet-shaped particles having a diameter of about 0.1 to 1000 ⁇ m, such as water or blood containing an analyte such as cells, nucleic acids, or proteins. Droplets. Then, in the storage tank 300, for example, the particles are stored in oil (second liquid).
- the detection system 1 can detect the state of the particle group Aall generated in this way so that the droplet generation device 100 can generate particles having a uniform particle size, or A performance test is performed to determine whether particles can be generated at a desired speed.
- the particles contained in the particle group Aall stored in the storage tank 300 are sequentially transferred one by one in the flow path 40 at the time of detection by the detection system 1.
- one end of the flow path 40 is disposed in the storage tank 300, and the other end is connected to a suction pump (not shown), so that the particles in the storage tank 300 are mixed with the liquid in the storage tank 300.
- a suction pump not shown
- the arrows in FIG. 1 indicate the flow direction of the particles.
- the flow path 40 is, for example, a glass tube made of a transparent member.
- the flow path 40 has, for example, a short cross section having a circular shape.
- the diameter of the channel 40 is set in accordance with, for example, the particle size of typical particles generated in the droplet generation device 100 so that the particles flow in the channel 40 one by one.
- the image sensor 20 is, for example, a CMOS (Complementary Metal Oxide Semiconductor) sensor or a CCD (Charge Coupled Device) sensor, and converts the light intensity of light coming from the imaging target region R1 set at a predetermined position of the flow path 40 into an electric signal. Convert to The image sensor 20, for example, images the imaging target region R1 continuously in time.
- the image sensor 20 according to the present embodiment generates, for example, an image having 300 pixels ⁇ 300 pixels per image as a moving image having a frame rate of 150 fps.
- the imaging target region R1 of the image sensor 20 is set such that at least one end from the one end to the other end in the width direction of the flow path 40 (representing the radial direction of the flow path 40; the same applies hereinafter) is included in the image.
- the image sensor 20 according to the present embodiment is an area sensor that images a two-dimensional area. The image sensor 20 captures an image by enlarging the imaging target region R1 several times using an optical lens.
- the light source 30 is, for example, a white lamp.
- the light source 30 is disposed on the back side of the flow path 40 when viewed from the image sensor 20.
- the light emitted from the light source 30 enhances the contrast between the particles and the surroundings of the particles when the image sensor 20 captures an image of the particles flowing through the flow path 40.
- the detection device 10 is a general computer including, for example, a CPU (Central Processing Unit), a ROM (Read Only Memory), a RAM (Random Access Memory), an input port, an output port, and the like.
- the detection device 10 acquires sensor information from the image sensor 20 and, based on the distribution of sensor values in the width direction of the flow path 40 in the imaging target region R1, based on the particle occupation width (hereinafter referred to as “Distance Value or "particle width”) is calculated. Then, the detection device 10 estimates the state of the particle group Aall based on the temporal change of the Distance value.
- the function of the detection device 10 is realized by, for example, the CPU referring to a control program or various data stored in the ROM or the RAM.
- FIG. 3 is a diagram illustrating an example of the configuration of the detection device 10 according to the present embodiment.
- the detection device 10 includes an input unit 10X and a calculation unit 10Y.
- the input unit 10X is configured by the sensor information acquisition unit 11, and the calculation unit 10Y is configured by the particle width calculation unit 12, the data connection unit 13, the data correction unit 14, the particle number calculation unit 15, and the particle size calculation unit 16. Have been.
- the sensor information acquisition unit 11 acquires, from the image sensor 20, sensor information generated by the image sensor 20. For example, after the transfer of particles from the particle group Aall stored in the storage tank 300 from the image sensor 20 is started, the sensor information acquisition unit 11 completes the transfer of all the particle groups Aall in the storage tank 300. To acquire the information of the moving image up to.
- the moving image is composed of a plurality of continuously generated still images (hereinafter simply referred to as “images”).
- the sensor information acquisition unit 11 acquires, from the image sensor 20, sensor information in which a sensor value relating to light intensity is converted into a pixel value expressed in 256 gradations.
- the sensor information acquisition unit 11 may acquire the sensor value related to the light intensity detected by the image sensor 20 as it is.
- the particle width calculation unit 12, the data connection unit 13, the data correction unit 14, the particle size calculation unit 15, and the particle number calculation unit 15, which will be described later, use the sensor values relating to the light intensity detected by the image sensor 20 as they are.
- the arithmetic processing may be performed by using this.
- the particle width calculation unit 12 calculates the Distance value of the particles (particle width with respect to the width of the flow path 40) based on the distribution of the sensor values of the image sensor 20 in the width direction of the flow path 40.
- FIG. 4 is a diagram illustrating a method of calculating a Distance value in the particle width calculation unit 12 according to the present embodiment.
- FIG. 4A shows one image in a moving image.
- 4A corresponds to one end of the flow path 40 in the width direction
- the plus Y direction corresponds to the flowing direction of the particles. That is, here, the row direction of the image corresponds to the width direction of the flow path 40.
- the plus Y direction is also referred to as the front end side of the particle
- the minus Y direction is also referred to as the rear end side of the particle.
- the sensor value related to the light intensity detected by the image sensor 20 is expressed in 256 gradations as the pixel value [Gray Value] in the image. That is, a region where the light intensity of the light arriving from the imaging target region R1 is strong (white region in the image) is represented by a pixel value of “256”, and a region where the light intensity of the light arriving from the imaging target region R1 is low ( A black area in the image) is represented by a pixel value of “0”.
- the ring-shaped object A1 is a particle A1 reflected in the imaging target region R1 in FIG. Further, the black regions extending along the ⁇ Y directions on both sides of the particle A1 in FIG. 4A are the edges of the flow path 40 (here, the glass tube).
- the particle A1 is in the form of a droplet, the central portion of the particle A1 transmits light from the light source 30 and is imaged in white, and only the outline of the particle A1 is black without transmitting light. Is imaged.
- FIG. 4B is a graph showing the distribution of pixel values in the row T1-T1 in FIG. 4A.
- FIG. 4C is a graph showing the distribution of pixel values in the row T2-T2 'in FIG. 4A. 4B and 4C, the horizontal axis represents the position in the width direction of the flow path 40, and the vertical axis represents the pixel value of each pixel.
- the pixel value “100” is set as a threshold for determining the presence or absence of a particle.
- the area between a and b and the area between cd where the pixel value is smaller than “100” are the edges of the glass tube.
- the region between ef and the region between g and h where the pixel value is smaller than “100” are contour portions of the particle A1, respectively. That is, in the graph of FIG. 4C, the distance between e and h corresponds to the occupied width of the particle A1 in the width direction of the flow channel 40, that is, the Distance value.
- the particle width calculation unit 12 calculates a Distance value from distribution information of pixel values in the width direction of the flow path 40 as shown in FIGS. 4B and 4C. Specifically, in the row T2-T2 '(FIG. 4C), the particle width calculation unit 12 calculates the Distance value to be 110 pixels corresponding to the distance between eh. On the other hand, the particle width calculation unit 12 calculates the Distance value as 0 pixel in the row of T1-T1 '(FIG. 4B), which is not the area where the particle A1 exists.
- the Distance value according to the present embodiment is calculated as the number of pixels occupied by the particle A1 in each row in the image.
- FIGS. 5 and 6 are diagrams illustrating the details of the method for calculating the Distance value in the particle width calculation unit 12.
- FIG. FIG. 5 is a diagram illustrating a method of calculating the Distance value of the central region of the particle A1
- FIG. 6 is a diagram illustrating a method of calculating the Distance values of the front end and the rear end of the particle A1.
- FIG. 5A and FIG. 6A are the same images as FIG. 4A.
- FIG. 5B is a diagram showing a distribution of pixel values in a row of T3-T3 ′ corresponding to the central portion of the particle A1
- FIG. 6B is a view of a row of T4-T4 ′ corresponding to the front end of the particle A1. It is a figure showing distribution of a pixel value.
- the particles A1 according to the present embodiment are in the form of droplets.
- the distribution of pixel values in the width direction of the flow path 40 at the front end and the rear end of the particles A1 is as follows. It shows a distribution characteristic different from that of the central part of the particle A1.
- the particle width calculation unit 12 based on the pattern of the distribution of pixel values in each row, the region where the particle A1 does not exist, the region R2 of the central portion of the particle A1, and the front end of the particle A1 or Distance values are calculated by classifying into three types of the rear end region R3.
- the particle width calculation unit 12 identifies that the particle A1 does not exist when the position where the pixel value is “100” is four in the distribution of the pixel values in one row (see FIG. 4B). reference). In addition, in the distribution of the pixel values in one row, when there are eight positions where the pixel value is “100”, the particle width calculation unit 12 identifies the position as the region R2 of the central portion of the particle A1 (FIG. 5B). ), And the distance between eh (that is, the distance between the third position and the sixth position from the minus X direction side of the position where the pixel value is “100”) is defined as the Distance value. calculate.
- the particle width calculation unit 12 identifies the particle A1 as the front end portion or the rear end region R3 of the particle A1. (See FIG. 6B), and the distance between ij (that is, between the third position and the fourth position from the minus X direction side among the positions where the pixel value is “100”) is Distance. Calculate as a value.
- the particle width calculation unit 12 calculates the Distance value of each row from the distribution of the pixel values of each row of one image by such a method. In this embodiment, since one image is composed of 300 pixels ⁇ 300 pixels, the particle width calculation unit 12 generates 300 rows of Distance values from one image.
- FIG. 7 is a diagram showing arrangement information of Distance values of one image.
- FIG. 7A is the same image as FIG. 4A.
- FIG. 7B is a diagram in which arrangement information of Distance values in the image of FIG. 7A is graphed.
- one particle is expressed as arrangement information of Distance values that draw a mountain-like curve. Therefore, the particle size of one particle can be obtained by integrating the array of Distance values that draw a mountain-like curve (details will be described later).
- the particle width calculation unit 12 generates Distance values for 300 lines for each image of the moving image by the same method. As a result, each image data of the moving image is converted into the array information of the Distance value.
- the data linking unit 13 links the array information of the Distance values calculated for each image.
- FIGS. 8 and 9 are diagrams illustrating a method of connecting Distance values in the data connecting unit 13.
- FIG. 8A shows an image captured at a certain timing (hereinafter, referred to as “first image” or “first sensor information”) and Distance values of each line of the first image.
- FIG. 8B illustrates an image captured after the first image (hereinafter, referred to as “second image” or “second sensor information”) and Distance values in each line of the second image. I have.
- FIG. 9 shows data (graph on the right side of FIG. 9) in which the Distance value in each line of the first image and the Distance value in each line of the second image are linked.
- the image on the left side of FIG. 9 is a composite image of the first image and the second image corresponding to the linked data.
- a dotted line region Ra represents a region of the first image
- a dashed line region Rb represents a region of the second image.
- the composite image in FIG. 9 is shown for explaining the processing of the data connection unit 13, and is actually data that is not generated.
- the frame rate of a moving image is faster than the speed at which particles flow, and therefore, an area that is captured repeatedly occurs between continuously generated images.
- the data linking unit 13 links the Distance value of the first image and the Distance value of the second image such that the regions that have been imaged in an overlapping manner are overlapped.
- the data connection unit 13 compares the array information of the Distance values of the first image with the array information of the Distance values of the second image, for example, to thereby determine the overlap between the first image and the second image. Identify the area. Then, the data connection unit 13 connects the Distance value of the first image and the Distance value of the second image such that the overlapping areas overlap each other. For example, the data connection unit 13 calculates a difference between the Distance value of the first image and the Distance value of the second image one pixel at a time, and connects the data so that the total value (absolute value) of the difference between the Distance values is minimized. May be.
- the data linking unit 13 performs such a process on the array information of the Distance values of all the images in the moving image to generate data in which the Distance values of all the images are linked (hereinafter, “linked data of Distance values”). ).
- the data correction unit 14 extracts a region where a plurality of particles adhere to each other from the linked data of the Distance values, and corrects the Distance value of the region.
- ⁇ Particles flowing in the flow path 40 are not always separated from each other, and may flow in close contact with other particles (see FIG. 13).
- the linked data of the Distance values are in a state in which the Distance values of two particles are not separated, which causes deterioration in the calculation accuracy of the particle size and the calculation accuracy of the number of particles. It becomes a factor. From such a viewpoint, the data correction unit 14 corrects the linked data of the Distance values.
- FIG. 10 is a diagram showing an example of linked data of Distance values in a state where particles do not adhere to each other.
- the region L1 corresponds to a data region of one particle
- the region L2 corresponds to a data region of another particle flowing following the one particle.
- the region Lt in which the Distance value has decreased to around 0 corresponds to a data region at the boundary between one particle and another particle.
- the linked data of the Distance value includes, as shown in FIG. A boundary region Lt where the Distance value decreases to “0” appears between other particles.
- the detection device 10 sequentially searches for the Distance value from the front direction (plus Y direction) through which the particles flow to the rear direction (minus Y direction) in consideration of the data characteristics of the linked data of Distance value, From the area where the Distance value has decreased to “0”, a position where the Distance value has become larger than a predetermined threshold value (here, “10”) is specified as the start position of the area of one particle. Then, the detection device 10 specifies a region from the start position of the particle region to a position where the Distance value becomes smaller than a predetermined threshold (here, “10”) as the particle region.
- a predetermined threshold value here, “10”
- the Distance value is a predetermined threshold value (here, “10”).
- the data correction unit 14 uses the Distance value in the boundary region to identify the front end of the particle in order to separate the Array information of the Distance value of one particle from the array information of the Distance value of another particle. It is reduced below a predetermined threshold (here, “10”).
- FIGS. 11, 12, and 13 are diagrams for explaining the correction processing in the data correction unit 14.
- FIG. FIGS. 11, 12, and 13 show arrangement information of Distance values of the same area.
- the data correction unit 14 determines whether or not a minimum value of the Distance value exists between the front end and the rear end of one particle, and according to the minimum value, a state in which one particle and another particle are in close contact with each other. And the position where it is in close contact is specified.
- the data correction unit 14 first specifies a position where the Distance value is “100” from the linked data of the Distance values (see FIG. 11A). Next, the data correction unit 14 sets the Distance value at a position where the Distance value is equal to or less than “100” to “0” in the data of the temporal change of the Distance value (see FIG. 11B). Next, the data correction unit 14 calculates a derivative value of the Distance value (that is, a difference in Distance value between adjacent pixels) (see FIG. 11C). In FIG. 11C, the derivative value of the Distance value is calculated from the front side to the rear side (that is, from the plus Y direction to the minus Y direction) in the flow direction of the particles. Thereby, the position where the differential value of the expressed Distance value becomes “ ⁇ 100” corresponds to the position on the rear end side of the particle.
- the data correction unit 14 specifies the position on the rear end side of the particle based on the differential value of the Distance value in FIG. 11C, and uses the position on the rear end side of the particle as a reference to determine the flow direction of the particle.
- a Distance value for 30 pixels is searched from the front side to the rear side (that is, from the plus Y direction to the minus Y direction) (FIG. 12).
- the data correction unit 14 determines whether or not the minimum value of the Distance value exists in the region for 30 pixels on the rear side of the particle (that is, after the Distance value decreases from the plus Y direction to the minus Y direction). It is determined whether or not the data characteristic has increased again).
- the data correction unit 14 extracts the state in which one particle and another particle are in close contact with each other, and specifies the X point at which the Distance value becomes the minimum value as the boundary position between the adjacent one particle and another particle. I do.
- the data correction unit 14 determines that the plurality of particles are not in a state of being in close contact with each other. Do not process.
- the data correction unit 14 corrects the Distance value at the position of the point X specified in FIG. 12 to “0” in the linked data of the Distance values (see FIG. 13).
- the left graph of FIG. 13 is a diagram illustrating linked data of Distance values before performing the correction processing.
- the right graph of FIG. 13 is a diagram illustrating linked data of Distance values after performing the correction processing.
- the linked data of the corrected Distance value is data that draws a curve in which the Distance value decreases to zero and then increases again even at a position where one particle and another particle are in close contact (FIG. 13).
- the detection device 10 the particle number calculation unit 15 and the particle size calculation unit 16
- the detection device 10 separates one particle and another particle that are in close contact with each other based on the linked data of the Distance values, and determines the particle size and the particle size. The number can be calculated.
- the data correction unit 14 uses the Distance value “100” as a reference value when extracting a position where one particle and another particle are in close contact.
- the particle size of individual particles, or the degree of close contact between one particle and another can vary.
- the data correction unit 14 more preferably performs the contact position specification using the Distance value “90” as a reference value, in addition to the above-described contact position specification processing using the Distance value “100” as a reference value.
- the process and the contact position specifying process using the Distance value “80” as a reference value are executed. As a result, it is possible to more reliably correct the connection data of the Distance value that makes it possible to separate one particle from another particle.
- the reference value of the Distance value in the data correction unit 14 can be changed as appropriate.
- the particle number calculation unit 15 calculates the number of particles included in the particle group Aall based on the linked data of the Distance values corrected by the data correction unit 14.
- the particle number calculation unit 15 specifies the data area of each particle from the linked data of the Distance values, and thereby calculates the number of particles included in the particle group Aall. Specifically, as described with reference to FIG. 10, the particle number calculation unit 15 first converts the connected data of the corrected Distance values from the front direction through which the particles flow to the rear direction. The search is performed in order, and a position where the Distance value becomes larger than a predetermined threshold value (here, “10”) from the region where the Distance value is reduced to 0 is specified as the start position of the region of one particle. Then, the particle number calculation unit 15 specifies a range from the start position of the region of the particle to a position where the Distance value becomes smaller than a predetermined threshold value (here, “10”) as the data region of the particle.
- a predetermined threshold value here, “10”
- the particle number calculation unit 15 calculates the number of all particles included in the particle group Aall by counting the number of data regions of particles in the linked data of the Distance values.
- the particle size calculation unit 16 calculates the distribution of the particle size (such as area or diameter) of the particles included in the particle group Aall based on the linked data of the Distance values corrected by the data correction unit 14.
- the particle size calculation unit 16 converts the connected data of the corrected Distance values from the front of the flow of the particles to the backward of the flow of the particles. Are sequentially searched, and the data area of each particle in the linked data of the corrected Distance values is specified.
- the particle size calculation unit 16 integrates the Distance value in the data area of the particle from the front end side to the rear end side of the particle (see FIG. 7). ). Then, the particle size calculation unit 16 performs the same processing on the data area of each particle, and thereby calculates the particle size of each particle included in the particle group Aall.
- the particle size calculation unit 16 calculates the particle size distribution of all particles included in the particle group Aall based on the linked data of the Distance values corrected by the data correction unit 14. Note that the particle size of the particles calculated in this way corresponds to the area of the particles in the image.
- FIG. 14 is a diagram comparing the particle diameter calculated by the particle size calculation unit 16 with the particle diameter calculated by the method according to the related art.
- image analysis software ImageIJ is used.
- the region of a particle in an image is manually set, and the diameter of the particle is calculated from the region of the particle.
- this method can calculate the particle size of particles with high accuracy, it requires a long time for image processing because it involves manual work.
- the particle size calculated by the particle size calculation unit 16 and the particle size calculated by the conventional method have substantially the same value. I have. That is, according to the particle size calculation unit 16 according to the present embodiment, it is understood that the particles in the image can be specified with high accuracy by a simple method.
- FIG. 14 shows only the particle size of one particle, but the particle size calculation unit 16 calculates the particle size of all the particles included in the particle group Aall.
- FIG. 15 is a diagram illustrating an example of a flow of an image analysis process performed by the detection device 10 according to the present embodiment.
- the detection device 10 uses the image sensor 20 to start the transfer of the particle group Aall stored in the storage tank 300, and then performs all of the particle group Aall in the storage tank 300 A moving image is acquired until the transfer of the particles is completed (step S1).
- the detection device 10 particle width calculation unit 12 calculates the distance value of each row of the image for each image in the moving image based on the distribution of the sensor values of the image sensor 20 in the width direction of the flow path 40. (Step S2).
- the detection device 10 data linking unit 13 links the distance values calculated for each image (step S3).
- the detection device 10 (the data correction unit 14) corrects the linked data of the distance values generated in step S3 so that one particle and another particle that adhere to each other can be separated ( Step S4).
- the detection device 10 (particle number calculation unit 15) calculates the number of particles included in the particle group based on the linked data of the distance values corrected in step S4 (step S5).
- the detection device 10 (particle size calculation unit 16) calculates the particle size distribution of the particles included in the particle group based on the linked data of the distance values corrected in step S4 (step S6).
- the detection device 10 estimates the particle size distribution of the particles included in the particle group Aall and the number of particles included in the particle group Aall.
- the detection device 10 includes the input unit 10X that acquires the sensor value of the image sensor 20 that captures the predetermined region R1 of the flow path 40 continuously in time, A calculation unit 10Y for estimating the distribution of the particle size of the transferred particles or the number of the transferred particles based on the temporal change in the distribution of the sensor values of the image sensor 20 in the direction.
- the detection device 10 it is possible to detect the distribution of the particle size of the particles included in the particle group Aall to be observed or the number of particles with a simple method and with high accuracy. it can.
- the detection device 10 according to the present embodiment compared with a method of identifying particles appearing in an image using pattern recognition or the like (for example, a process of detecting a particle region or a template matching process), the processing load is high. Is small, and the processing speed can be improved.
- the detection device 10 estimates the particle size and the like of the particles based on the transmitted light emitted from the light source 30 and transmitted through the flow path 40. Therefore, according to the detection device 10 according to the present embodiment, highly accurate estimation is possible even in comparison with a conventionally known method of estimating the particle size and the like of the particles by causing the particles to emit light by containing a fluorescent agent. is there.
- the detection system 1 according to the present embodiment differs from the first embodiment in that the image sensor 20 is configured to image only a linear region (also referred to as a line sensor). The description of the configuration common to the first embodiment is omitted.
- FIG. 16 is a diagram illustrating an example of a configuration of the detection system 1 according to the second embodiment.
- the illustration of the light source 30 and the storage tank 300 is omitted.
- the image sensor 20 sets only the linear region including the region between one end and the other end in the width direction of the flow path 40 as the imaging target region R1. Therefore, the distribution of the sensor values in the linear region detected by the image sensor 20 is expressed in the same manner as in FIGS. 4B and 4C described in the first embodiment.
- the detection device 10 uses the same method as the method described in the first embodiment to detect the particle Distance value (that is, the current value) from the sensor information detected by the image sensor 20.
- the particle occupation width with respect to the width of the path 40) is calculated.
- the detecting device 10 since the overlapping area does not exist in the temporal change of the sensor information detected by the image sensor 20, the detecting device 10 detects the sensor information of the imaging target area R1 captured at different timing. It is not necessary to perform the process of superimposing (the process of the data connection unit 13 described above). In other words, the sensor information generated by the image sensor 20 can be directly converted into linked data of Distance values.
- the processing load is further reduced and the processing speed is further improved. be able to.
- the particle group Aall stored in the storage tank 300 is described as an example of the observation target by the detection system 1.
- an object to be observed by the detection system 1 according to the present invention may be a particle that has been transported in the flow path 40 within a predetermined time.
- the detection system 1 may detect particles generated from the droplet generation device 100 in the droplet channel 190.
- droplet-shaped particles are shown as an example of the observation target by the detection system 1.
- the observation target by the detection system 1 according to the present invention may be solid particles.
- the detection system 1 is applied to a performance test of the droplet generation device 100
- the application target of the detection system 1 according to the present invention is arbitrary, and may be applied to, for example, applications such as quality control of particles transferred in the flow path 40.
- a glass tube is shown as an example of the flow path 40.
- the channel 40 may be a tube, a groove formed on a glass substrate, or the like.
- a white lamp was shown as an example of the light source 30.
- the light source 30 a laser, a light emitting diode, an incandescent light source, a fluorescent light source, or the like may be used.
- the detection device it is possible to detect the distribution of the particle sizes of the particles included in the particle group to be observed or the number of particles with a simple method and with high accuracy.
Landscapes
- Chemical & Material Sciences (AREA)
- Biochemistry (AREA)
- Physics & Mathematics (AREA)
- Health & Medical Sciences (AREA)
- Life Sciences & Earth Sciences (AREA)
- Analytical Chemistry (AREA)
- General Health & Medical Sciences (AREA)
- General Physics & Mathematics (AREA)
- Immunology (AREA)
- Pathology (AREA)
- Dispersion Chemistry (AREA)
- Image Analysis (AREA)
- Length Measuring Devices By Optical Means (AREA)
Abstract
簡易な手法で、且つ、高精度に、観察対象の粒子群に含まれる粒子の粒子サイズの分布や、又は粒子の個数を検出し得る検出装置を提供する。流路(40)内を一個ずつ移送される粒子の全体としての状態を検出する検出装置であって、流路(40)の所定領域を時間的に連続して撮像するイメージセンサ(20)のセンサ値を取得する入力部(10X)と、流路(40)の幅方向におけるイメージセンサ(20)のセンサ値の分布の時間的変化に基づいて、移送された前記粒子群に含まれる粒子の粒子サイズの分布、又は粒子の個数を推定する演算部(10Y)と、を備える。
Description
本開示は、検出装置、検出方法、及び検出プログラムに関する。
従来、流路中を通流する粒子を撮像して、画像情報に基づいて、当該粒子の粒子サイズ等を検出する検出装置が知られている。この種の検出装置は、例えば、ドロップレット(液滴)、細胞、マイクロカプセル、マイクロバブル、又はマイクロポリマー等の種々の微粒子の状態を検出する用途に適用される。
ところで、この種の検出装置の応用として、観察対象の粒子群に含まれる粒子の粒子サイズの分布や、又は粒子の個数を検出する要請がある。
一般に、この種の検出装置においては、粒子領域を検出する処理や、又はテンプレートマッチング処理等の画像解析アルゴリズムを用いて、画像情報から粒子の粒子サイズ等の検出を行っている。この点、かかる画像解析アルゴリズムは、一枚の画像のみに対して画像処理を行う上では有用であるが、処理対象の画像数が多い場合等においては、処理負荷及び処理速度の点で、実用的とは言えない。特に、かかる画像解析アルゴリズムを用いて、流路中を順次に通流する多数の粒子を撮像する場合には、処理対象の画像数も増大するため、かかる処理負荷及び処理速度が問題となる場合がある。
本開示は、上記問題点に鑑みてなされたもので、簡易な手法で、且つ、高精度に、観察対象の粒子群に含まれる粒子の粒子サイズの分布や、又は粒子の個数を検出し得る検出装置、検出方法、及び検出プログラムを提供することを目的とする。
前述した課題を解決する主たる本開示は、
流路内を一個ずつ移送される粒子の粒子群全体としての状態を検出する検出装置であって、
前記流路の所定領域を時間的に連続して撮像するイメージセンサのセンサ値を取得する入力部と、
前記流路の幅方向における前記イメージセンサのセンサ値の分布の時間的変化に基づいて、移送された前記粒子群に含まれる前記粒子の粒子サイズの分布、又は前記粒子の個数を推定する演算部と、
を備える検出装置である。
流路内を一個ずつ移送される粒子の粒子群全体としての状態を検出する検出装置であって、
前記流路の所定領域を時間的に連続して撮像するイメージセンサのセンサ値を取得する入力部と、
前記流路の幅方向における前記イメージセンサのセンサ値の分布の時間的変化に基づいて、移送された前記粒子群に含まれる前記粒子の粒子サイズの分布、又は前記粒子の個数を推定する演算部と、
を備える検出装置である。
又、他の局面では、
流路内を一個ずつ移送される粒子の粒子群全体としての状態を検出する検出方法であって、
前記流路の所定領域を時間的に連続して撮像するイメージセンサのセンサ値を取得する工程と、
前記流路の幅方向における前記イメージセンサのセンサ値の分布の時間的変化に基づいて、移送された前記粒子群に含まれる前記粒子の粒子サイズの分布、又は前記粒子の個数を推定する工程と、
を備える検出方法である。
流路内を一個ずつ移送される粒子の粒子群全体としての状態を検出する検出方法であって、
前記流路の所定領域を時間的に連続して撮像するイメージセンサのセンサ値を取得する工程と、
前記流路の幅方向における前記イメージセンサのセンサ値の分布の時間的変化に基づいて、移送された前記粒子群に含まれる前記粒子の粒子サイズの分布、又は前記粒子の個数を推定する工程と、
を備える検出方法である。
又、他の局面では、
流路内を一個ずつ移送される粒子の粒子群全体としての状態を検出する検出プログラムであって、
コンピュータに、
前記流路の所定領域を時間的に連続して撮像するイメージセンサのセンサ値を取得する処理と、
前記流路の幅方向における前記イメージセンサのセンサ値の分布の時間的変化に基づいて、移送された前記粒子群に含まれる前記粒子の粒子サイズの分布、又は前記粒子の個数を推定する処理と、
を実行させる検出プログラムである。
流路内を一個ずつ移送される粒子の粒子群全体としての状態を検出する検出プログラムであって、
コンピュータに、
前記流路の所定領域を時間的に連続して撮像するイメージセンサのセンサ値を取得する処理と、
前記流路の幅方向における前記イメージセンサのセンサ値の分布の時間的変化に基づいて、移送された前記粒子群に含まれる前記粒子の粒子サイズの分布、又は前記粒子の個数を推定する処理と、
を実行させる検出プログラムである。
本開示に係る検出装置によれば、観察対象の粒子群に含まれる粒子の粒子サイズの分布や、又は粒子の個数を、簡易な手法で、且つ、高精度に、検出可能である。
以下に添付図面を参照しながら、本開示の好適な実施形態について詳細に説明する。尚、本明細書及び図面において、実質的に同一の機能を有する構成要素については、同一の符号を付することにより重複説明を省略する。
(第1の実施形態)
以下、図1を参照して、本実施形態に係る検出装置が適用される検出システムの構成の一例について説明する。
以下、図1を参照して、本実施形態に係る検出装置が適用される検出システムの構成の一例について説明する。
図1は、本実施形態に係る検出システム1の構成の一例を示す図である。
検出システム1は、検出装置10、イメージセンサ20、光源30、及び、流路40を備えている。
検出システム1は、貯留槽300内に存在する粒子群Aallの状態(典型的には、粒子群Aallに含まれる粒子の粒子サイズの分布、及び粒子の個数)を検出する装置である。本実施形態に係る検出システム1は、例えば、ドロップレット生成装置の性能試験の用途に適用され、ドロップレット生成装置において生成された液滴状の粒子(ドロップレットとも称される)の状態を検出する。
図2は、ドロップレット生成装置100の構成の一例を示す図である。図2Aは、ドロップレット生成装置100を上方から見た平面図であり、図2Bは、ドロップレット生成装置100を上方から見た斜視図である。
ドロップレット生成装置100は、基板110に形成された貫通孔(第1液体導入口120、第2液体導入口140、及びドロップレット取出口200)、及び溝(第1流路130、第2液体共通流路150、第2流路160、第3流路170、ドロップレット生成部180、及びドロップレットが移送されるドロップレット流路190)によって構成されている。
具体的には、基板110には、当該基板110を貫通するように、第1液体を導入する第1液体導入口120、第2液体を導入する第2液体導入口140、及び、生成されたドロップレットを取り出すドロップレット取出口200が形成されている。
又、基板110の上面には、第1流路130、第2液体共通流路150、第2流路160、第3流路170、ドロップレット生成部180、及びドロップレット流路190が形成されている。ここで、第1流路130は、第1液体導入口120から導入される第1液体(例えば、細胞等を含む液体)をドロップレット生成部180に供給する。一方、第2液体共通流路150、第2流路160及び第3流路170は、第2液体導入口140から導入される第2液体(例えば、第1液体と相溶せず、かつ第1液体を変性させないオイル等)をドロップレット生成部180に供給する。
ドロップレット生成部180は、第1流路130から供給される第1液体と、第2流路160及び第3流路170供給される第2液体とを合流する合流部である。ドロップレット生成部180には、第1流路130からの第1液体と、第2流路160及び第3流路170からの第2液体とが、同時に供給され、これによって、第2液体が第1液体の周囲を包み込むようにして、順次、ドロップレットが生成される。そして、生成されたドロップレットは、ドロップレット流路190を介して、ドロップレット取出口200に移送される。
ドロップレット生成装置100に生成された粒子は、ドロップレット取出口200を介して、貯留槽300に貯留される。尚、図1では、ドロップレット生成装置100は、貯留槽300から取り外された状態を示している。
ドロップレット生成装置100に生成された粒子は、例えば、直径が0.1~1000μm程度の液滴状の粒子であって、細胞、核酸又はタンパク質等の被分析物を内包する水又は血液等の液滴である。そして、貯留槽300内には、例えば、当該粒子が、オイル(第2液体)中に、貯留されている。
本実施形態に係る検出システム1は、このようにして生成された粒子群Aallの状態を検出することで、ドロップレット生成装置100が均一な粒径の粒子を生成することができるか、又は、所望の速度で粒子を生成することができるか等の性能試験を行う。
図1に戻って、本実施形態に係る検出システム1の構成について、説明する。
貯留槽300に貯留された粒子群Aallに含まれる粒子は、検出システム1による検出の際には、流路40内を一個ずつ順番に移送される。ここでは、流路40の一端が貯留槽300内に配設され、他端が吸引ポンプ(図示せず)に接続されることによって、貯留槽300内の粒子が、貯留槽300内の液体と共に、流路40内を一個ずつ移送されている。尚、図1の矢印は、粒子の通流方向を表している。
流路40は、例えば、透過性の部材によって構成されたガラス管である。流路40は、例えば、短手断面が円形状を呈している。そして、流路40の直径は、流路40内を粒子が一個ずつ通流するように、例えば、ドロップレット生成装置100に生成される典型的な粒子の粒子サイズにあわせて設定されている。
イメージセンサ20は、例えば、CMOS(Complementary Metal Oxide Semiconductor)センサ又はCCD(Charge Coupled Device)センサであって、流路40の所定位置に設定した撮像対象領域R1から到来する光の光強度を電気信号に変換する。イメージセンサ20は、例えば、撮像対象領域R1を時間的に連続して撮像する。本実施形態に係るイメージセンサ20は、例えば、一枚あたり300画素×300画素を有する画像を、150fpsのフレームレートの動画像として生成する。
イメージセンサ20の撮像対象領域R1は、少なくとも流路40の幅方向(流路40の径方向を表す。以下同じ)の一端から他端までが画像内に映るように、設定されている。又、本実施形態に係るイメージセンサ20は、二次元領域を撮像するエリアセンサである。尚、イメージセンサ20は、光学レンズを用いて、撮像対象領域R1を数倍に拡大して撮像している。
光源30は、例えば、白色ランプである。光源30は、イメージセンサ20から見て、流路40の背面側に配設されている。光源30から発される光は、イメージセンサ20が流路40内を通流する粒子を撮像する際に、粒子と当該粒子の周囲との間のコントラストを高める。
検出装置10は、例えば、CPU(Central Processing Unit)、ROM(Read Only Memory)、RAM(Random Access Memory)、入力ポート、及び、出力ポート等を含んで構成される一般的なコンピュータである。検出装置10は、イメージセンサ20からセンサ情報を取得し、撮像対象領域R1の流路40の幅方向におけるセンサ値の分布に基づいて、流路40の幅に対する粒子の占有幅(以下、「Distance値」又は「粒子幅」と称する)を算出する。そして、検出装置10は、Distance値の時間的変化に基づいて、粒子群Aallの状態を推定する。
尚、検出装置10が有する機能は、例えば、CPUがROMやRAMに格納された制御プログラムや各種データを参照することによって実現される。
[画像解析処理について]
次に、図3~図15を参照して、本実施形態に係る検出装置10が行う画像解析処理について説明する。
次に、図3~図15を参照して、本実施形態に係る検出装置10が行う画像解析処理について説明する。
図3は、本実施形態に係る検出装置10の構成の一例を示す図である。
本実施形態に係る検出装置10は、入力部10Xと演算部10Yとを備えている。入力部10Xは、センサ情報取得部11によって構成され、演算部10Yは、粒子幅算出部12、データ連結部13、データ補正部14、粒子個数算出部15、及び、粒子サイズ算出部16によって構成されている。
<センサ情報取得部11について>
センサ情報取得部11は、イメージセンサ20から、当該イメージセンサ20が生成したセンサ情報を取得する。センサ情報取得部11は、例えば、イメージセンサ20から、貯留槽300内に貯留された粒子群Aallから粒子の移送が開始されてから、貯留槽300内のすべての粒子群Aallの移送が完了するまでの間の動画像の情報を取得する。
センサ情報取得部11は、イメージセンサ20から、当該イメージセンサ20が生成したセンサ情報を取得する。センサ情報取得部11は、例えば、イメージセンサ20から、貯留槽300内に貯留された粒子群Aallから粒子の移送が開始されてから、貯留槽300内のすべての粒子群Aallの移送が完了するまでの間の動画像の情報を取得する。
尚、動画像は、連続的に生成された複数の静止画像(以下、単に「画像」と略称する)によって構成されている。
本実施形態に係るセンサ情報取得部11は、イメージセンサ20から、光強度に係るセンサ値が、256階調で表現された画素値に変換されたセンサ情報を取得している。但し、センサ情報取得部11は、イメージセンサ20が検出した光強度に係るセンサ値を、そのままの状態で取得してもよい。換言すると、後述する粒子幅算出部12、データ連結部13、データ補正部14、粒子サイズ算出部15、及び、粒子個数算出部15は、イメージセンサ20が検出した光強度に係るセンサ値をそのまま用いて演算処理を行ってもよい。
<粒子幅算出部12について>
粒子幅算出部12は、流路40の幅方向におけるイメージセンサ20のセンサ値の分布に基づいて、粒子のDistance値(流路40の幅に対する粒子幅)を算出する。
粒子幅算出部12は、流路40の幅方向におけるイメージセンサ20のセンサ値の分布に基づいて、粒子のDistance値(流路40の幅に対する粒子幅)を算出する。
図4は、本実施形態に係る粒子幅算出部12におけるDistance値の算出方法について、説明する図である。
図4Aは、動画像中の一枚の画像を示している。図4AのプラスX方向が流路40の幅方向の一端側に相当し、プラスY方向が粒子の通流方向に相当する。即ち、ここでは、画像の行方向が、流路40の幅方向に相当する。尚、以下では、プラスY方向を粒子の前端側、マイナスY方向を粒子の後端側とも称する。
尚、本実施形態では、イメージセンサ20が検出した光強度に係るセンサ値は、画像中の画素値[Gray Value]として256階調で表現されている。即ち、撮像対象領域R1から到来する光の光強度が強い領域(画像中の白色の領域)は「256」の画素値で表現され、撮像対象領域R1から到来する光の光強度が低い領域(画像中の黒色の領域)は「0」の画素値で表現されている。
図4Aにおいて、リング状の物体A1は、図1の撮像対象領域R1に映る粒子A1である。又、図4A中の粒子A1の両側の±Y方向に沿って延在する黒色領域は、流路40(ここでは、ガラス管)の縁部である。ここでは、粒子A1は、液滴状であるため、当該粒子A1の中心部分は光源30からの光を透過して白色に撮像され、当該粒子A1の輪郭部分のみが光を透過させずに黒色に撮像されている。
図4Bは、図4AのT1-T1’の行における画素値の分布を示すグラフである。図4Cは、図4AのT2-T2’の行における画素値の分布を示すグラフである。図4B及び図4Cにおいて、横軸は流路40の幅方向の位置を示し、縦軸は各画素の画素値を示している。尚、本実施形態では、画素値「100」を、粒子の存在の有無を判定するための閾値として設定している。
図4B、図4Cのグラフにおいて、画素値が「100」よりも小さくなっているa-b間の領域及びc-d間の領域は、ガラス管の縁部である。
又、図4Cのグラフにおいて、画素値が「100」よりも小さくなっているe-f間の領域及びg-h間の領域は、それぞれ、粒子A1の輪郭部分である。つまり、図4Cのグラフにおいては、e-h間の距離が、流路40の幅方向のうちの粒子A1の占有幅、即ちDistance値に相当する。
粒子幅算出部12は、図4B、図4Cに示すような流路40の幅方向における画素値の分布情報から、Distance値を算出する。具体的には、粒子幅算出部12は、T2-T2’の行(図4C)においては、Distance値を、e-h間の距離に相当する110画素と算出する。一方、粒子幅算出部12は、T1-T1’の行(図4B)においては、粒子A1が存在する領域ではないため、Distance値を0画素と算出する。
つまり、本実施形態に係るDistance値は、画像内の各行において粒子A1が占有する画素数として算出される。
図5、図6は、粒子幅算出部12におけるDistance値の算出方法の詳細について、説明する図である。図5は、粒子A1の中心領域のDistance値の算出方法を示す図であり、図6は、粒子A1の前端部及び後端部のDistance値の算出方法を示す図である。
尚、図5A、図6Aは、いずれも、図4Aと同一の画像である。又、図5Bは、粒子A1の中心部分に相当するT3-T3’の行の画素値の分布を示す図であり、図6Bは、粒子A1の前端部に相当するT4-T4’の行の画素値の分布を示す図である。
本実施形態に係る粒子A1は、液滴状であり、図5Bと図6Bを比較すると分かるように、粒子A1の前端部及び後端部の流路40の幅方向における画素値の分布は、粒子A1の中心部分とは異なる分布特性を示す。
そこで、本実施形態に係る粒子幅算出部12は、各行における画素値の分布のパターンに基づいて、粒子A1が存在しない領域、粒子A1の中心部分の領域R2、及び、粒子A1の前端部又は後端部の領域R3の3種類に分類して、Distance値を算出している。
具体的には、粒子幅算出部12は、一行の画素値の分布の中で、画素値が「100」である位置が4箇所の場合には粒子A1が存在しないと識別する(図4Bを参照)。又、粒子幅算出部12は、一行の画素値の分布の中で、画素値が「100」である位置が8箇所の場合には、粒子A1の中心部分の領域R2と識別し(図5Bを参照)、e-h間の距離(即ち、画素値が「100」である位置のうちのマイナスX方向側から3つ目の位置と6つ目の位置の間の距離)をDistance値として算出する。一方、粒子幅算出部12は、一行の画素値の分布の中で、画素値が「100」である位置が6箇所の場合には、粒子A1の前端部又は後端部の領域R3と識別し(図6Bを参照)、i-j間の距離(即ち、画素値が「100」である位置のうちのマイナスX方向側から3つ目の位置と4つ目の位置の間)をDistance値として算出する。
これによって、粒子A1の端部領域におけるDistance値の算出精度を高めている。
粒子幅算出部12は、このような手法によって、一枚の画像の各行の画素値の分布から、各行のDistance値を算出する。尚、本実施形態では、一枚の画像は、300画素×300画素によって構成されているため、粒子幅算出部12は、一枚の画像から、300行分のDistance値を生成する。
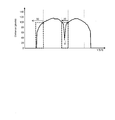
図7は、一枚の画像のDistance値の配列情報を示す図である。図7Aは、図4Aと同一の画像である。図7Bは、図7Aの画像におけるDistance値の配列情報をグラフ化した図である。
一個の粒子は、図7Bに示すように、山なり状のカーブを描くDistance値の配列情報として表出する。そのため、山なり状のカーブを描くDistance値の配列を、積算することにより、一個の粒子の粒子サイズを求めることができる(詳細は後述)。
粒子幅算出部12は、同様の手法により、動画像の各画像について、300行分のDistance値を生成する。これによって、動画像の各画像データは、Distance値の配列情報に変換されることになる。
<データ連結部13について>
データ連結部13は、各画像において算出されたDistance値の配列情報を連結する。
データ連結部13は、各画像において算出されたDistance値の配列情報を連結する。
図8、図9は、データ連結部13におけるDistance値の連結方法について、説明する図である。図8Aは、あるタイミングで撮像された画像(以下、「第1の画像」又は「第1センサ情報」と称する)と、当該第1の画像の各ラインにおけるDistance値を表している。図8Bは、第1の画像に続いて撮像された画像(以下、「第2の画像」又は「第2センサ情報」と称する)と、当該第2の画像の各ラインにおけるDistance値を表している。
図9は、第1の画像の各ラインにおけるDistance値と第2の画像の各ラインにおけるDistance値を連結したデータ(図9の右側のグラフ)を表している。尚、図9の左側の画像は、当該連結データに対応する第1の画像と第2の画像の合成画像である。図9において、点線領域Raは第1の画像の領域、一点鎖線領域Rbは第2の画像の領域を表している。但し、図9の合成画像は、データ連結部13の処理を説明するために示すものであり、実際には、生成されないデータである。
一般に、動画像におけるフレームレートは、粒子が通流する速度よりも早いため、連続して生成される画像間には、重複して撮像される領域が発生する。そこで、データ連結部13は、重複して撮像された領域同士を重ね合わせるようにして、第1の画像のDistance値と第2の画像のDistance値を連結する。
データ連結部13は、例えば、第1の画像のDistance値の配列情報と、第2の画像のDistance値の配列情報を比較することにより、第1の画像と第2の画像との間における重複領域を特定する。そして、データ連結部13は、当該重複領域同士を重ね合わせるようにして、第1の画像のDistance値と、第2の画像のDistance値とを連結する。データ連結部13は、例えば、第1の画像のDistance値と第2の画像のDistance値との差分を1ピクセルずつ算出し、Distance値の差分の合計値(絶対値)が最小となるよう連結してもよい。
データ連結部13は、このような処理を、動画像中の全画像のDistance値の配列情報について実行し、全画像のDistance値を連結したデータを生成する(以下、「Distance値の連結データ」と称する)。
<データ補正部14について>
データ補正部14は、Distance値の連結データから複数の粒子が密着した領域を抽出し、当該領域のDistance値を補正する。
データ補正部14は、Distance値の連結データから複数の粒子が密着した領域を抽出し、当該領域のDistance値を補正する。
流路40中を通流する粒子は、必ずしも、互いに離間した状態となっておらず、他の粒子と密着するようにして通流する場合がある(図13を参照)。このような場合、Distance値の連結データは、粒子2個分のDistance値が分離されてない状態となっており、粒子サイズの算出精度の悪化、及び、粒子の個数の算出精度の悪化を引き起こす要因となる。データ補正部14は、かかる観点から、Distance値の連結データを補正する。
まず、検出装置10が、Distance値の連結データから各粒子のデータ領域を特定する方法について、説明する。
図10は、粒子同士が密着していない状態のDistance値の連結データの一例を示す図である。尚、図10において、領域L1が一の粒子のデータ領域に相当し、領域L2が一の粒子に続いて通流する他の粒子のデータ領域に相当する。又、Distance値が0付近まで低下した領域Ltが一の粒子と他の粒子の境界のデータ領域に相当する。
流路40内において粒子は、一個ずつ順番に通流するため、一の粒子と他の粒子が密着していない場合、Distance値の連結データには、図10に示すように、一の粒子と他の粒子の間に、Distance値が「0」まで低下する境界領域Ltが表出する。
検出装置10は、Distance値の連結データの当該データ特性を考慮して、粒子の通流する前方向(プラスY方向)から後方向(マイナスY方向)に向かってDistance値を順番に探索し、Distance値が「0」まで低下している領域から、Distance値が所定の閾値(ここでは、「10」)よりも大きくなった位置を一の粒子の領域の開始位置と特定する。そして、検出装置10は、粒子の領域の開始位置から、Distance値が所定の閾値(ここでは、「10」)よりも小さくなる位置までの間を当該粒子の領域と特定する。
但し、一の粒子と他の粒子が密着するようにして通流している場合、一の粒子と他の粒子の間の境界領域においても、Distance値は、所定の閾値(ここでは、「10」)以下とならない。そこで、データ補正部14は、一の粒子に係るDistance値の配列情報と他の粒子に係るDistance値の配列情報を互いに分離するべく、当該境界領域におけるDistance値を粒子の前端を識別する際の所定の閾値(ここでは、「10」)以下まで低下させる。
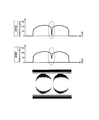
図11、図12及び図13は、データ補正部14における補正処理について、説明する図である。尚、図11、図12及び図13は、同一領域のDistance値の配列情報を示している。
データ補正部14は、一個の粒子の前端と後端の間にDistance値の極小値が存在するか否かを判定し、当該極小値によって、一の粒子と他の粒子が密着している状態及び密着している位置を特定する。
具体的には、データ補正部14は、まず、Distance値の連結データから、Distance値が「100」の位置を特定する(図11Aを参照)。次に、データ補正部14は、Distance値の時間的変化のデータのうち、Distance値が「100」以下の位置のDistance値を「0」にする(図11Bを参照)。次に、データ補正部14は、Distance値の微分値(即ち、隣接する画素間におけるDistance値の差)を算出する(図11Cを参照)。尚、図11Cでは、粒子の通流方向の前方側から後方側(即ち、プラスY方向からマイナスY方向)に向かって、Distance値の微分値を算出している。これによって、表出したDistance値の微分値が「-100」となる位置が、粒子の後端側の位置に該当する。
次に、データ補正部14は、図11CのDistance値の微分値に基づいて、粒子の後端側の位置を特定し、当該粒子の後端側の位置を基準として、粒子の通流方向の前方側から後方側(即ち、プラスY方向からマイナスY方向)に向かって30画素分のDistance値を探索する(図12)。この際、データ補正部14は、当該粒子の後方側30画素分の領域において、Distance値の極小値が存在するか(即ち、プラスY方向からマイナスY方向に向かって、Distance値が減少した後に再び増加しているデータ特性となっているか)否かを判定し、Distance値の極小値が存在する場合、当該極小値の位置(図12のX点)を特定する。これにより、データ補正部14は、一の粒子と他の粒子が密着した状態を抽出すると共に、Distance値が極小値となるX点を、隣接する一の粒子と他の粒子の境界位置と特定する。
尚、データ補正部14は、この際、粒子の後方側30画素分のDistance値が、単調的に減少している場合には、複数の粒子が密着した状態ではないと判断して、特に、処理を行わない。
次に、データ補正部14は、Distance値の連結データのうち、図12で特定したX点の位置におけるDistance値を「0」に補正する(図13を参照)。図13の左グラフは、補正処理を行う前のDistance値の連結データを示す図である。図13の右グラフは、補正処理を行った後のDistance値の連結データを示す図である。
つまり、補正後のDistance値の連結データは、一の粒子と他の粒子が密着する位置においても、Distance値がゼロまで低下した後に再び増加するようなカーブを描くようなデータとなる(図13の右グラフを参照)。これによって、検出装置10(粒子個数算出部15及び粒子サイズ算出部16)は、当該Distance値の連結データに基づいて、密着する一の粒子と他の粒子とを分離して、粒子サイズ及び粒子個数の算出を行うことが可能となる。
尚、上記では、粒子サイズがおよそ直径100μmである粒子の場合のデータ補正方法を示した。データ補正部14は、一の粒子と他の粒子が密着する位置を抽出する際に、Distance値「100」を基準値とした。しかしながら、個々の粒子の粒子サイズ、又は一の粒子と他の粒子が密着する密着度合いは、種々に変化し得る。かかる観点から、データ補正部14は、より好適には、上記したようなDistance値「100」を基準値とした密着位置特定処理に加えて、Distance値「90」を基準値とした密着位置特定処理、及び、Distance値「80」を基準値とした密着位置特定処理を実行する。これによって、より確実に、一の粒子と他の粒子とを分離可能にしたDistance値の連結データに補正することが可能である。
尚、目的とする粒子サイズが異なる場合には、データ補正部14におけるDistance値の基準値は、適宜変更しうる。
<粒子個数算出部15について>
粒子個数算出部15は、データ補正部14で補正したDistance値の連結データに基づいて、粒子群Aallに含まれる粒子の個数を算出する。
粒子個数算出部15は、データ補正部14で補正したDistance値の連結データに基づいて、粒子群Aallに含まれる粒子の個数を算出する。
粒子個数算出部15は、Distance値の連結データから各粒子のデータ領域を特定し、これによって、粒子群Aallに含まれる粒子の個数を算出する。具体的には、粒子個数算出部15は、図10を参照して説明したように、まず、補正後のDistance値の連結データを粒子の通流する前方向から後方向に向かってDistance値を順番に探索し、Distance値が0まで低下している領域からDistance値が所定の閾値(ここでは、「10」)よりも大きくなった位置を一の粒子の領域の開始位置と特定する。そして、粒子個数算出部15は、当該粒子の領域の開始位置から、Distance値が所定の閾値(ここでは、「10」)よりも小さくなる位置までの間を当該粒子のデータ領域と特定する。
そして、粒子個数算出部15は、Distance値の連結データ中における粒子のデータ領域の個数をカウントすることによって、粒子群Aallに含まれる全粒子の個数を算出する。
<粒子サイズ算出部16について>
粒子サイズ算出部16は、データ補正部14で補正したDistance値の連結データに基づいて、粒子群Aallに含まれる粒子の粒子サイズ(面積又は直径等)の分布を算出する。
粒子サイズ算出部16は、データ補正部14で補正したDistance値の連結データに基づいて、粒子群Aallに含まれる粒子の粒子サイズ(面積又は直径等)の分布を算出する。
具体的には、まず、粒子サイズ算出部16は、図10を参照して説明したように、補正後のDistance値の連結データを、粒子の通流する前方向から後方向に向かってDistance値を順番に探索し、補正後のDistance値の連結データ中における各粒子のデータ領域を特定する。
次に、粒子サイズ算出部16は、一個の粒子の粒子サイズを算出する際には、当該粒子のデータ領域におけるDistance値を、当該粒子の前端側から後端側まで積算する(図7を参照)。そして、粒子サイズ算出部16は、各粒子のデータ領域に対して同様の処理を実行し、これによって、粒子群Aallに含まれる各粒子の粒子サイズを算出する。
このように、粒子サイズ算出部16は、データ補正部14で補正したDistance値の連結データに基づいて、粒子群Aallに含まれる全粒子の粒子サイズの分布を算出する。尚、このようにして算出された粒子の粒子サイズは、画像内における粒子の面積に相当する。
尚、粒子サイズ算出部16は、各粒子を完全球体と仮定して、S=π×r2(但し、Sは面積、rは粒子の半直径)の公式から、各粒子の直径(即ち、2×r)を算出し、粒子群Aallに含まれる全粒子の直径の分布を算出してもよい。又、粒子サイズ算出部16は、粒子の粒子サイズの単位を、画素数基準の単位から、SI単位系(例えば、μm単位)に変換してもよい。
図14は、粒子サイズ算出部16によって算出された粒子の直径と、従来技術に係る手法によって算出された粒子の直径を比較した図である。
図14A、図14B、図14C、及び図14Dにおいては、それぞれ、画像内に映る粒子の直径が算出されている。
従来技術に係る手法としては、公知の画像解析ソフトImage Jを用いている。当該手法は、画像内における粒子の領域を手作業で設定させ、当該粒子の領域から当該粒子の直径を算出するものである。尚、当該手法は、高精度に粒子の粒子サイズを算出可能であるものの、手作業を含むため画像処理に長時間を要する。
図14A、図14B、図14C、及び図14Dから分かるように、粒子サイズ算出部16によって算出された粒子のサイズと、従来手法によって算出された粒子のサイズとは、略同一の値となっている。つまり、本実施形態に係る粒子サイズ算出部16によれば、簡易な手法で、高精度に画像内における粒子を特定することが可能であることが分かる。
尚、図14では、一個の粒子の粒子サイズのみを示しているが、粒子サイズ算出部16は、粒子群Aallに含まれる全粒子の粒子サイズを算出する。
<画像解析処理のフローについて>
図15は、本実施形態に係る検出装置10が行う画像解析処理のフローの一例を示す図である。
図15は、本実施形態に係る検出装置10が行う画像解析処理のフローの一例を示す図である。
検出装置10(センサ情報取得部11)は、まず、イメージセンサ20を用いて、貯留槽300内に貯留された粒子群Aallの移送が開始されてから、貯留槽300内の粒子群Aallのすべての粒子の移送が完了するまでの間の動画像を取得する(ステップS1)。次に、検出装置10(粒子幅算出部12)は、イメージセンサ20のセンサ値の流路40の幅方向における分布に基づいて、動画像中の画像それぞれについて、画像の各行のdistance値を算出する(ステップS2)。次に、検出装置10(データ連結部13)は、各画像において算出されたdistance値を連結する(ステップS3)。次に、検出装置10は(データ補正部14)、ステップS3で生成したdistance値の連結データを、密着する一の粒子と他の粒子とを分離することが可能になるように、補正する(ステップS4)。次に、検出装置10(粒子個数算出部15)は、ステップS4で補正したdistance値の連結データに基づいて、粒子群に含まれる粒子の個数を算出する(ステップS5)。次に、検出装置10(粒子サイズ算出部16)は、ステップS4で補正したdistance値の連結データに基づいて、粒子群に含まれる粒子の粒子サイズの分布を算出する(ステップS6)。
尚、ステップS1~ステップS6の各工程の詳細は、上記した通りである。
このようにして、検出装置10は、粒子群Aallに含まれる粒子の粒子サイズの分布、及び粒子群Aallに含まれる粒子の個数を推定する。
[効果]
以上のように、本実施形態に係る検出装置10は、流路40の所定領域R1を時間的に連続して撮像するイメージセンサ20のセンサ値を取得する入力部10Xと、流路40の幅方向におけるイメージセンサ20のセンサ値の分布の時間的変化に基づいて、移送された粒子の粒子サイズの分布、又は移送された粒子の個数を推定する演算部10Yと、を備えている。
以上のように、本実施形態に係る検出装置10は、流路40の所定領域R1を時間的に連続して撮像するイメージセンサ20のセンサ値を取得する入力部10Xと、流路40の幅方向におけるイメージセンサ20のセンサ値の分布の時間的変化に基づいて、移送された粒子の粒子サイズの分布、又は移送された粒子の個数を推定する演算部10Yと、を備えている。
従って、本実施形態に係る検出装置10によれば、簡易な手法で、且つ、高精度に、観察対象の粒子群Aallに含まれる粒子の粒子サイズの分布、又は粒子の個数を検出することができる。特に、本実施形態に係る検出装置10によれば、パターン認識等を用いて画像に映る粒子を識別する手法(例えば、粒子領域を検出する処理や、又はテンプレートマッチング処理)と比較すると、処理負荷が小さく、処理速度の向上を図ることができる点で、有用である。
又、特に、本実施形態に係る検出装置10は、光源30から発せられ、流路40を透過した透過光に基づいて、粒子の粒子サイズ等を推定する。従って、本実施形態に係る検出装置10によれば、蛍光剤を含有させて粒子を発光させて粒子の粒子サイズ等を推定する従来公知の手法と比較しても、高精度な推定が可能である。
(第2の実施形態)
次に、図16を参照して、第2の実施形態に係る検出システム1について説明する。本実施形態に係る検出システム1は、イメージセンサ20が線状領域のみを撮像するように構成されている(ラインセンサとも称される)点で、第1の実施形態と相違する。尚、第1の実施形態と共通する構成については、説明を省略する。
次に、図16を参照して、第2の実施形態に係る検出システム1について説明する。本実施形態に係る検出システム1は、イメージセンサ20が線状領域のみを撮像するように構成されている(ラインセンサとも称される)点で、第1の実施形態と相違する。尚、第1の実施形態と共通する構成については、説明を省略する。
図16は、第2の実施形態に係る検出システム1の構成の一例を示す図である。尚、図16では、光源30及び貯留槽300の図示を省略している。
本実施形態に係るイメージセンサ20は、図16に示すように、流路40の幅方向における一端と他端との間の領域を含む線状領域のみを撮像対象領域R1とする。従って、イメージセンサ20によって検出された線状領域のセンサ値の分布は、第1の実施形態で説明した図4B、図4C等と同様に表出する。
本実施形態に係る検出装置10(粒子幅算出部12)は、第1の実施形態で説明した手法と同様の手法によって、イメージセンサ20が検出したセンサ情報から、粒子のDistance値(即ち、流路40の幅に対する粒子の占有幅)を算出する。但し、本実施形態においては、イメージセンサ20が検出したセンサ情報の時間的変化の中には、重複領域は存在しないため、検出装置10は、異なるタイミングで撮像された撮像対象領域R1のセンサ情報を重ね合わせる処理(上記したデータ連結部13の処理)を行う必要はない。換言すると、当該イメージセンサ20に生成されたセンサ情報は、直接、Distance値の連結データに変換することができる。
以上のように、本実施形態に係る検出装置10によれば、イメージセンサ20が線状領域のみを撮像するように構成されているため、より一層の処理負荷の軽減及び処理速度の向上を図ることができる。
(その他の実施形態)
本発明は、上記実施形態に限らず、種々に変形態様が考えられる。
本発明は、上記実施形態に限らず、種々に変形態様が考えられる。
上記実施形態では、検出システム1による観察対象の一例として、貯留槽300に貯留された粒子群Aallを示した。しかしながら、本発明に係る検出システム1による観察対象としては、一定時間内に流路40内を移送された粒子であってもよい。例えば、検出システム1は、ドロップレット生成装置100から生成される粒子を、ドロップレット流路190において検出してもよい。
又、上記実施形態では、検出システム1による観察対象の一例として、液滴状の粒子を示した。しかしながら、本発明に係る検出システム1による観察対象としては、固体状の粒子であってもよい。
又、上記実施形態では、検出システム1の適用対象の一例として、ドロップレット生成装置100の性能試験に適用する態様を示した。しかしながら、本発明に係る検出システム1の適用対象は、任意であり、例えば、流路40内を移送される粒子の品質管理等の用途にも適用し得る。
又、上記実施形態では、流路40の一例として、ガラス管を示した。しかしながら、流路40としては、チューブ、又は、ガラス基板上に形成された溝等が用いられてもよい。
又、上記実施形態では、光源30の一例として、白色ランプを示した。しかしながら、光源30としては、レーザ、発光ダイオード、白熱光源、又は、蛍光光源等が用いられてもよい。
以上、本発明の具体例を詳細に説明したが、これらは例示にすぎず、請求の範囲を限定するものではない。請求の範囲に記載の技術には、以上に例示した具体例を様々に変形、変更したものが含まれる。
本出願は、2018年6月29日出願の特願2018-124245に基づく優先権を主張する。当該出願明細書および図面に記載された内容は、すべて本願明細書に援用される。
本開示に係る検出装置によれば、観察対象の粒子群に含まれる粒子の粒子サイズの分布や、又は粒子の個数を、簡易な手法で、且つ、高精度に、検出可能である。
1 検出システム
10 検出装置
10X 入力部
10Y 演算部
11 センサ情報取得部
12 粒子幅算出部
13 データ連結部
14 データ補正部
15 粒子個数算出部
16 粒子サイズ算出部
20 イメージセンサ
30 光源
40 流路
100 ドロップレット生成装置
300 貯留槽
Aall 粒子群
10 検出装置
10X 入力部
10Y 演算部
11 センサ情報取得部
12 粒子幅算出部
13 データ連結部
14 データ補正部
15 粒子個数算出部
16 粒子サイズ算出部
20 イメージセンサ
30 光源
40 流路
100 ドロップレット生成装置
300 貯留槽
Aall 粒子群
Claims (16)
- 流路内を一個ずつ移送される粒子の粒子群全体としての状態を検出する検出装置であって、
前記流路の所定領域を時間的に連続して撮像するイメージセンサのセンサ値を取得する入力部と、
前記流路の幅方向における前記イメージセンサのセンサ値の分布の時間的変化に基づいて、移送された前記粒子群に含まれる前記粒子の粒子サイズの分布、又は前記粒子の個数を推定する演算部と、
を備える検出装置。 - 前記演算部は、前記流路の幅方向における前記イメージセンサのセンサ値の分布の時間的変化に係るデータを、粒子幅の時間的変化に係るデータに変換する
請求項1に記載の検出装置。 - 前記演算部は、前記粒子毎に、前記粒子の前端側から後端側までの間の前記粒子幅の積算値を算出することにより、移送された前記粒子群に含まれる前記粒子の粒子サイズの分布を推定する
請求項2に記載の検出装置。 - 前記演算部は、前記粒子の前端と後端の間に前記粒子幅の極小値が存在する場合、当該極小値の位置における前記粒子幅を前記粒子の前端を識別する際の所定値以下まで低下させる
請求項2又は3に記載の検出装置。 - 前記演算部は、前記極小値の存在の有無を判定する際、二以上の基準値を用いる
請求項4に記載の検出装置。 - 前記演算部は、前記粒子幅の時間的変化に係るデータに基づいて、各別の前記粒子のデータ領域を識別し、移送された前記粒子群に含まれる前記粒子の個数をカウントする
請求項2乃至5のいずれか一項に記載の検出装置。 - 前記粒子は、液滴状の粒子である
請求項2乃至6のいずれか一項に記載の検出装置。 - 前記演算部は、前記流路の幅方向における前記イメージセンサのセンサ値の分布が、前記粒子が存在しない領域、前記粒子の中央部分の領域、及び、前記粒子の端部領域のいずれに該当するかを識別して、前記流路の幅方向における前記イメージセンサのセンサ値の分布の時間的変化に係るデータを、粒子幅の時間的変化に係るデータに変換する
請求項7に記載の検出装置。 - 前記イメージセンサは、前記イメージセンサから見て前記流路の背部に配設された光源から発せられ、前記流路を透過した光の強度を検出する
請求項1乃至8のいずれか一項に記載の検出装置。 - 前記イメージセンサは、前記流路の幅方向における一端と他端との間の領域を含む二次元領域を撮像する
請求項1乃至9のいずれか一項に記載の検出装置。 - 前記演算部は、第1タイミングで前記イメージセンサに生成された第1センサ情報と、前記第1タイミングに続く第2タイミングで前記イメージセンサに生成された第2センサ情報とを参照して、前記第1センサ情報と前記第2センサ情報との間における重複領域を重ね合わせるようにして、前記第1センサ情報と前記第2センサ情報とを連結する
請求項10に記載の検出装置。 - 前記イメージセンサは、前記流路の幅方向における一端と他端との間の領域を含む線状領域を撮像する
請求項1乃至9のいずれか一項に記載の検出装置。 - 前記粒子群は、貯留槽に貯留された粒子群である
請求項1乃至12のいずれか一項に記載の検出装置。 - ドロップレット生成装置の性能試験に適用される
請求項1乃至13のいずれか一項に記載の検出装置。 - 流路内を一個ずつ移送される粒子の粒子群全体としての状態を検出する検出方法であって、
前記流路の所定領域を時間的に連続して撮像するイメージセンサのセンサ値を取得する工程と、
前記流路の幅方向における前記イメージセンサのセンサ値の分布の時間的変化に基づいて、移送された前記粒子群に含まれる前記粒子の粒子サイズの分布、又は前記粒子の個数を推定する工程と、
を備える検出方法。 - 流路内を一個ずつ移送される粒子の粒子群全体としての状態を検出する検出プログラムであって、
コンピュータに、
前記流路の所定領域を時間的に連続して撮像するイメージセンサのセンサ値を取得する処理と、
前記流路の幅方向における前記イメージセンサのセンサ値の分布の時間的変化に基づいて、移送された前記粒子群に含まれる前記粒子の粒子サイズの分布、又は前記粒子の個数を推定する処理と、
を実行させる検出プログラム。
Applications Claiming Priority (2)
| Application Number | Priority Date | Filing Date | Title |
|---|---|---|---|
| JP2018-124245 | 2018-06-29 | ||
| JP2018124245A JP2020003384A (ja) | 2018-06-29 | 2018-06-29 | 検出装置、検出方法、及び検出プログラム |
Publications (1)
| Publication Number | Publication Date |
|---|---|
| WO2020004353A1 true WO2020004353A1 (ja) | 2020-01-02 |
Family
ID=68985064
Family Applications (1)
| Application Number | Title | Priority Date | Filing Date |
|---|---|---|---|
| PCT/JP2019/025025 Ceased WO2020004353A1 (ja) | 2018-06-29 | 2019-06-25 | 検出装置、検出方法、及び検出プログラム |
Country Status (2)
| Country | Link |
|---|---|
| JP (1) | JP2020003384A (ja) |
| WO (1) | WO2020004353A1 (ja) |
Cited By (1)
| Publication number | Priority date | Publication date | Assignee | Title |
|---|---|---|---|---|
| JP2021152518A (ja) * | 2020-03-24 | 2021-09-30 | 株式会社Cybo | イメージングフローサイトメーター、ソート方法、及びキャリブレーション方法 |
Citations (5)
| Publication number | Priority date | Publication date | Assignee | Title |
|---|---|---|---|---|
| JPS5383677A (en) * | 1976-12-29 | 1978-07-24 | Rikagaku Kenkyusho | Measurement of grain size distribution |
| JPS59154337A (ja) * | 1983-02-23 | 1984-09-03 | Fuji Electric Co Ltd | 流体中粒状懸濁物質の粒度分布測定装置 |
| JPH0658928A (ja) * | 1992-08-10 | 1994-03-04 | Toa Medical Electronics Co Ltd | 粒子分析装置 |
| JP2014507662A (ja) * | 2011-02-22 | 2014-03-27 | バイオ−ラド ラボラトリーズ インコーポレイテッド | ラインスキャン血球計算システムおよび方法 |
| JP2015520397A (ja) * | 2012-06-22 | 2015-07-16 | マルバーン インストゥルメンツ リミテッド | 不均質流体試料の特性評価 |
-
2018
- 2018-06-29 JP JP2018124245A patent/JP2020003384A/ja active Pending
-
2019
- 2019-06-25 WO PCT/JP2019/025025 patent/WO2020004353A1/ja not_active Ceased
Patent Citations (5)
| Publication number | Priority date | Publication date | Assignee | Title |
|---|---|---|---|---|
| JPS5383677A (en) * | 1976-12-29 | 1978-07-24 | Rikagaku Kenkyusho | Measurement of grain size distribution |
| JPS59154337A (ja) * | 1983-02-23 | 1984-09-03 | Fuji Electric Co Ltd | 流体中粒状懸濁物質の粒度分布測定装置 |
| JPH0658928A (ja) * | 1992-08-10 | 1994-03-04 | Toa Medical Electronics Co Ltd | 粒子分析装置 |
| JP2014507662A (ja) * | 2011-02-22 | 2014-03-27 | バイオ−ラド ラボラトリーズ インコーポレイテッド | ラインスキャン血球計算システムおよび方法 |
| JP2015520397A (ja) * | 2012-06-22 | 2015-07-16 | マルバーン インストゥルメンツ リミテッド | 不均質流体試料の特性評価 |
Cited By (1)
| Publication number | Priority date | Publication date | Assignee | Title |
|---|---|---|---|---|
| JP2021152518A (ja) * | 2020-03-24 | 2021-09-30 | 株式会社Cybo | イメージングフローサイトメーター、ソート方法、及びキャリブレーション方法 |
Also Published As
| Publication number | Publication date |
|---|---|
| JP2020003384A (ja) | 2020-01-09 |
Similar Documents
| Publication | Publication Date | Title |
|---|---|---|
| KR102109941B1 (ko) | 라이다 센서 및 카메라를 이용한 객체 검출 방법 및 그를 위한 장치 | |
| US9111348B2 (en) | Computer-based method and system of dynamic category object recognition | |
| US9508000B2 (en) | Object recognition apparatus | |
| CN110709749A (zh) | 组合式明视场和相衬显微镜系统及配备其的图像处理设备 | |
| CN101383005A (zh) | 一种利用辅助规则纹理的乘客目标图像和背景分离方法 | |
| Hou et al. | Detection and localization of citrus picking points based on binocular vision | |
| EP1519142A2 (en) | Method and system for image processing for profiling with structured light | |
| US11256929B2 (en) | Image-based road cone recognition method and apparatus, storage medium, and vehicle | |
| Zhang et al. | Depth monocular estimation with attention-based encoder-decoder network from single image | |
| JP2020003384A (ja) | 検出装置、検出方法、及び検出プログラム | |
| US9674503B2 (en) | Stereo matching apparatus using image property | |
| CN113028993B (zh) | 一种用于描述微滴式数字pcr液滴相对位置的方法 | |
| JPH11278182A (ja) | 車両用霧状況検出装置 | |
| US6845178B1 (en) | Automatic separation of subject pixels using segmentation based on multiple planes of measurement data | |
| US8155424B2 (en) | Coin detecting apparatus | |
| KR20200013486A (ko) | 객체 검출 장치 및 방법 | |
| US10970570B2 (en) | Device and a method for clustering light spots | |
| JP4733433B2 (ja) | ビーズアレイ用蛍光読取装置及びビーズアレイ用蛍光読取方法 | |
| JP2001243456A (ja) | 障害物検出装置及び障害物検出方法 | |
| CN113269150A (zh) | 基于深度学习的车辆多属性识别的系统及方法 | |
| US11568547B2 (en) | Deposit detection device and deposit detection method | |
| US11010625B2 (en) | Vehicle exterior environment recognition apparatus and method of recognizing exterior environment outside vehicle | |
| Yakimov | Preprocessing digital images for quickly and reliably detecting road signs | |
| CN117965703B (zh) | 一种校正荧光图像获取扩增荧光结果方法及扩增检测系统 | |
| CN115240276B (zh) | 一种面部朝向识别方法及装置 |
Legal Events
| Date | Code | Title | Description |
|---|---|---|---|
| 121 | Ep: the epo has been informed by wipo that ep was designated in this application |
Ref document number: 19824878 Country of ref document: EP Kind code of ref document: A1 |
|
| NENP | Non-entry into the national phase |
Ref country code: DE |
|
| 122 | Ep: pct application non-entry in european phase |
Ref document number: 19824878 Country of ref document: EP Kind code of ref document: A1 |