WO2020004102A1 - 機能回復訓練支援システムおよび方法 - Google Patents
機能回復訓練支援システムおよび方法 Download PDFInfo
- Publication number
- WO2020004102A1 WO2020004102A1 PCT/JP2019/023853 JP2019023853W WO2020004102A1 WO 2020004102 A1 WO2020004102 A1 WO 2020004102A1 JP 2019023853 W JP2019023853 W JP 2019023853W WO 2020004102 A1 WO2020004102 A1 WO 2020004102A1
- Authority
- WO
- WIPO (PCT)
- Prior art keywords
- support system
- subject
- function recovery
- recovery training
- unit
- Prior art date
Links
Images


Classifications
-
- G—PHYSICS
- G16—INFORMATION AND COMMUNICATION TECHNOLOGY [ICT] SPECIALLY ADAPTED FOR SPECIFIC APPLICATION FIELDS
- G16H—HEALTHCARE INFORMATICS, i.e. INFORMATION AND COMMUNICATION TECHNOLOGY [ICT] SPECIALLY ADAPTED FOR THE HANDLING OR PROCESSING OF MEDICAL OR HEALTHCARE DATA
- G16H50/00—ICT specially adapted for medical diagnosis, medical simulation or medical data mining; ICT specially adapted for detecting, monitoring or modelling epidemics or pandemics
- G16H50/20—ICT specially adapted for medical diagnosis, medical simulation or medical data mining; ICT specially adapted for detecting, monitoring or modelling epidemics or pandemics for computer-aided diagnosis, e.g. based on medical expert systems
-
- A—HUMAN NECESSITIES
- A61—MEDICAL OR VETERINARY SCIENCE; HYGIENE
- A61B—DIAGNOSIS; SURGERY; IDENTIFICATION
- A61B5/00—Measuring for diagnostic purposes; Identification of persons
- A61B5/103—Detecting, measuring or recording devices for testing the shape, pattern, colour, size or movement of the body or parts thereof, for diagnostic purposes
- A61B5/11—Measuring movement of the entire body or parts thereof, e.g. head or hand tremor, mobility of a limb
-
- A—HUMAN NECESSITIES
- A61—MEDICAL OR VETERINARY SCIENCE; HYGIENE
- A61B—DIAGNOSIS; SURGERY; IDENTIFICATION
- A61B5/00—Measuring for diagnostic purposes; Identification of persons
- A61B5/22—Ergometry; Measuring muscular strength or the force of a muscular blow
-
- A—HUMAN NECESSITIES
- A63—SPORTS; GAMES; AMUSEMENTS
- A63B—APPARATUS FOR PHYSICAL TRAINING, GYMNASTICS, SWIMMING, CLIMBING, OR FENCING; BALL GAMES; TRAINING EQUIPMENT
- A63B24/00—Electric or electronic controls for exercising apparatus of preceding groups; Controlling or monitoring of exercises, sportive games, training or athletic performances
- A63B24/0062—Monitoring athletic performances, e.g. for determining the work of a user on an exercise apparatus, the completed jogging or cycling distance
-
- G—PHYSICS
- G01—MEASURING; TESTING
- G01C—MEASURING DISTANCES, LEVELS OR BEARINGS; SURVEYING; NAVIGATION; GYROSCOPIC INSTRUMENTS; PHOTOGRAMMETRY OR VIDEOGRAMMETRY
- G01C22/00—Measuring distance traversed on the ground by vehicles, persons, animals or other moving solid bodies, e.g. using odometers, using pedometers
- G01C22/02—Measuring distance traversed on the ground by vehicles, persons, animals or other moving solid bodies, e.g. using odometers, using pedometers by conversion into electric waveforms and subsequent integration, e.g. using tachometer generator
-
- G—PHYSICS
- G16—INFORMATION AND COMMUNICATION TECHNOLOGY [ICT] SPECIALLY ADAPTED FOR SPECIFIC APPLICATION FIELDS
- G16H—HEALTHCARE INFORMATICS, i.e. INFORMATION AND COMMUNICATION TECHNOLOGY [ICT] SPECIALLY ADAPTED FOR THE HANDLING OR PROCESSING OF MEDICAL OR HEALTHCARE DATA
- G16H20/00—ICT specially adapted for therapies or health-improving plans, e.g. for handling prescriptions, for steering therapy or for monitoring patient compliance
- G16H20/30—ICT specially adapted for therapies or health-improving plans, e.g. for handling prescriptions, for steering therapy or for monitoring patient compliance relating to physical therapies or activities, e.g. physiotherapy, acupressure or exercising
-
- G—PHYSICS
- G16—INFORMATION AND COMMUNICATION TECHNOLOGY [ICT] SPECIALLY ADAPTED FOR SPECIFIC APPLICATION FIELDS
- G16H—HEALTHCARE INFORMATICS, i.e. INFORMATION AND COMMUNICATION TECHNOLOGY [ICT] SPECIALLY ADAPTED FOR THE HANDLING OR PROCESSING OF MEDICAL OR HEALTHCARE DATA
- G16H50/00—ICT specially adapted for medical diagnosis, medical simulation or medical data mining; ICT specially adapted for detecting, monitoring or modelling epidemics or pandemics
- G16H50/30—ICT specially adapted for medical diagnosis, medical simulation or medical data mining; ICT specially adapted for detecting, monitoring or modelling epidemics or pandemics for calculating health indices; for individual health risk assessment
-
- A—HUMAN NECESSITIES
- A63—SPORTS; GAMES; AMUSEMENTS
- A63B—APPARATUS FOR PHYSICAL TRAINING, GYMNASTICS, SWIMMING, CLIMBING, OR FENCING; BALL GAMES; TRAINING EQUIPMENT
- A63B71/00—Games or sports accessories not covered in groups A63B1/00 - A63B69/00
- A63B71/06—Indicating or scoring devices for games or players, or for other sports activities
- A63B71/0619—Displays, user interfaces and indicating devices, specially adapted for sport equipment, e.g. display mounted on treadmills
- A63B2071/065—Visualisation of specific exercise parameters
-
- A—HUMAN NECESSITIES
- A63—SPORTS; GAMES; AMUSEMENTS
- A63B—APPARATUS FOR PHYSICAL TRAINING, GYMNASTICS, SWIMMING, CLIMBING, OR FENCING; BALL GAMES; TRAINING EQUIPMENT
- A63B2220/00—Measuring of physical parameters relating to sporting activity
- A63B2220/40—Acceleration
- A63B2220/44—Angular acceleration
-
- A—HUMAN NECESSITIES
- A63—SPORTS; GAMES; AMUSEMENTS
- A63B—APPARATUS FOR PHYSICAL TRAINING, GYMNASTICS, SWIMMING, CLIMBING, OR FENCING; BALL GAMES; TRAINING EQUIPMENT
- A63B2230/00—Measuring physiological parameters of the user
- A63B2230/04—Measuring physiological parameters of the user heartbeat characteristics, e.g. ECG, blood pressure modulations
-
- A—HUMAN NECESSITIES
- A63—SPORTS; GAMES; AMUSEMENTS
- A63B—APPARATUS FOR PHYSICAL TRAINING, GYMNASTICS, SWIMMING, CLIMBING, OR FENCING; BALL GAMES; TRAINING EQUIPMENT
- A63B2230/00—Measuring physiological parameters of the user
- A63B2230/08—Measuring physiological parameters of the user other bio-electrical signals
-
- A—HUMAN NECESSITIES
- A63—SPORTS; GAMES; AMUSEMENTS
- A63B—APPARATUS FOR PHYSICAL TRAINING, GYMNASTICS, SWIMMING, CLIMBING, OR FENCING; BALL GAMES; TRAINING EQUIPMENT
- A63B2230/00—Measuring physiological parameters of the user
- A63B2230/40—Measuring physiological parameters of the user respiratory characteristics
-
- G—PHYSICS
- G01—MEASURING; TESTING
- G01C—MEASURING DISTANCES, LEVELS OR BEARINGS; SURVEYING; NAVIGATION; GYROSCOPIC INSTRUMENTS; PHOTOGRAMMETRY OR VIDEOGRAMMETRY
- G01C22/00—Measuring distance traversed on the ground by vehicles, persons, animals or other moving solid bodies, e.g. using odometers, using pedometers
- G01C22/006—Pedometers
Definitions
- the present invention relates to a function recovery training support system and method for presenting a function recovery situation, a function recovery task, a function recovery target, and the like.
- Patent Literature 1 Japanese Patent Application Laid-Open No. 2005-352686 proposes a rehabilitation management device that analyzes information on exercise (rehabilitation exercise) performed by a patient for functional recovery and manages the entire history of motor functions of a plurality of patients. Have been.
- Patent Document 2 Japanese Patent Application Laid-Open No. 2010-108430 discloses that the evaluation values of a large number of evaluation items of functional recovery training (rehabilitation) generally indicate that the evaluation values are going to be better, that there is no change, There has been proposed a rehabilitation support device that enables the user to easily grasp whether he or she is heading for the wrong one by going back to a desired point in time.
- the function is limited to a function of managing and displaying the results of the function recovery training exercise performed by the patient, and how much the patient's physical function has recovered and how close the patient is to a healthy person. , could not understand clearly.
- conventionally there has been a problem that it is difficult to grasp the results of the function recovery training.
- the present invention has been made to solve the above problems, and has as its object to make it easier to grasp the results of function recovery training.
- a function recovery training support system includes: a physical measurement unit that is mounted on a subject and measures in a time series physical information representing a static or dynamic state of a body of the subject; A physiological measurement unit that measures physiological information in the body of the subject in time series, a first calculation unit that determines the amount of activity of the subject from changes in the physical information measured by the physical measurement unit, and a physiological measurement that is measured by the physiological measurement unit A second calculator for calculating a physiological load on the subject from a change in the target information, and a graph generator for generating a graph relating to the amount of activity determined by the first calculator and the physiological load determined by the second calculator. And a display unit for the subject to visually recognize the graph generated by the graph generation unit.
- the function recovery training support method includes a first step of measuring physical information representing a sexual or dynamic state of a subject's body, and a first step of measuring physiological information in the subject's body. Two steps, a third step of obtaining the amount of activity of the subject from the measured physical information, a fourth step of obtaining a physiological load on the subject from the measured physiological information, and a third step It includes a fifth step of generating a graph relating to the determined amount of activity and the physiological load determined in the fourth step, and a sixth step of displaying the generated graph so as to be visible to the subject.
- the present invention since the graph relating to the activity amount and the exercise load determined from the physical information and the physiological information measured in the subject is displayed, the result of the function recovery training is improved. An excellent effect that it becomes easy to grasp is obtained.
- FIG. 1 is a configuration diagram showing a configuration of a function recovery training support system according to Embodiment 1 of the present invention.
- FIG. 2 is a configuration diagram showing a hardware configuration of a part of the function recovery training support system according to the first embodiment of the present invention.
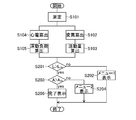
- FIG. 3 is a flowchart for explaining an operation example (function recovery training support method) of the function recovery training support system according to the first embodiment of the present invention.
- FIG. 4 is an explanatory diagram for explaining a waveform of cardiac potential data and a heart rate.
- FIG. 5 is an explanatory diagram illustrating an example of a two-dimensional graph displayed by the function recovery training support system according to the first embodiment of the present invention.
- FIG. 6 is a characteristic diagram showing statistical data on the relationship between the measured movement standard deviation of acceleration and FIM.
- FIG. 7 is a configuration diagram showing a partial configuration of a function recovery training support system according to Embodiment 2 of the present invention.
- FIG. 8 is a two-dimensional graph in which the 24-hour cumulative value of% HRR is an exercise load, and the 24-hour activity time (sum of standing time, sitting time, and walking time) is the amount of activity.
- FIG. 9 is a characteristic diagram showing a result of measuring a posture angle of the subject.
- FIG. 10 is a characteristic diagram showing a change in the estimated posture.
- FIG. 11 is a characteristic diagram showing the measured values of the angles when standing up, lying on the back, and prone.
- FIG. 12 is an explanatory diagram for explaining a range of 30 to 140 degrees that is determined to be occurring based on the measured values of the angles when standing up, lying on the back, and prone.
- FIG. 13 is a characteristic diagram showing statistical data on the relationship between the activity amount and the quotient obtained by dividing the exercise load by the activity amount.
- FIG. 14 is a characteristic diagram showing statistical data on the relationship between the quotient obtained by dividing the exercise load by the amount of activity and the SIAS.
- FIG. 15 is a graph showing a time series in which the exercise load is divided by the amount of activity (additional processing value).
- FIG. 16 is an explanatory diagram illustrating a state in which walking is detected.
- FIG. 16 is an explanatory diagram for explaining a range of 30 to 140 degrees that is determined to be occurring based on the measured values of the angles when standing up, lying on the back, and prone.
- FIG. 13 is a characteristic diagram showing statistical data on the relationship between the activity amount and the quotient obtained by
- FIG. 17 is an explanatory diagram showing a state in which the threshold for counting the number of steps is set to two in accordance with the left and right feet to ensure the accuracy of walking detection.
- FIG. 18 is a configuration diagram showing a configuration of a function recovery training support system according to Embodiment 3 of the present invention.
- FIG. 19 is a two-dimensional graph in which the vertical axis represents the total exercise intensity (exercise load) in one day, and the horizontal axis represents the total activity time (activity) in one day.
- FIG. 20 is an explanatory diagram showing a threshold value A th of the activity amount and a threshold value L th of the exercise load set for the activity amount A and the exercise load L.
- FIG. 21 is a flowchart for explaining an operation example of the function recovery training support system according to the third embodiment of the present invention.
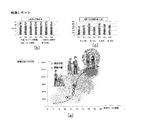
- FIG. 22 is an explanatory diagram showing an example in which a two-dimensional graph (a) of the exercise load and the activity amount is displayed by adding the time lapse of the exercise load (b) and the time lapse of the activity amount (c).
- FIG. 23 is an explanatory diagram illustrating an example in which advice (advice) is displayed in addition to the results of the exercise load and the activity amount.
- FIG. 24 is a characteristic diagram showing the relationship between the amount of activity and the reserve oxygen intake amount from walking to running of the subject, calculated by equation (4). .
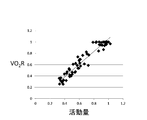
- FIG. 25 is a characteristic diagram showing a relationship between the positive square root of the activity amount from walking to running of the subject calculated by the equation (4) and the reserve oxygen intake.
- FIG. 26 is a characteristic diagram illustrating a result of performing a fast Fourier transform on a temporal change of the sum of accelerations in three directions measured by the physical measurement unit 101.
- FIG. 27 is a characteristic diagram showing the relationship between the frequency of the peak obtained by performing the fast Fourier transform on the time change of the sum of the accelerations in the three directions measured by the physical measurement unit 101 and the reserve oxygen intake.
- FIG. 28 is a configuration diagram showing a configuration of a function recovery training support system according to Embodiment 4 of the present invention.
- FIG. 29 is a configuration diagram showing a configuration of a function recovery training support system according to Embodiment 5 of the present invention.
- FIG. 30 shows the amount of activity obtained by the positive square root of the value calculated by equation (4) and the% HRR, with respect to the acceleration measurement value during the period from walking to running of the subject calculated by equation (4).
- FIG. 4 is a characteristic diagram showing a relationship between the amount of oxygen and reserve oxygen.
- FIG. 31 is a characteristic diagram showing the relationship between healthy subjects with the positive square root of the amount of activity as the horizontal axis and% HRR as the vertical axis.
- This function recovery training support system includes a physical measurement unit 101, a physiological measurement unit 102, a first calculation unit 103, a second calculation unit 104, a graph generation unit 105, and a display unit 106.
- the physical measurement unit 101 is worn on a subject (patient) and measures time-series physical information representing a static / dynamic state of the subject's body.
- the physical information is, for example, at least one of acceleration, angular velocity, and position coordinates.
- an acceleration measurement unit that measures acceleration in time series will be described as an example.
- the physiological measurement unit 102 measures physiological information in the body of the subject.
- the physiological information is, for example, at least one of cardiac potential, heart rate, pulse rate, blood pressure, myoelectric potential, and respiratory activity.
- an example of an electrocardiographic measurement unit that measures a subject's cardiac potential will be described as the physiological measurement unit 102.
- the first calculation unit 103 obtains the amount of activity related to the body movement of the subject from the change in the physical information measured by the physical measurement unit 101. For example, the first calculator 103 calculates the sum of squares of the measured physical information, the square root of the sum of squares, or the accumulated value of any period, or the time difference, or the absolute value of the time difference, the standard deviation of any period, or The amount of activity is obtained by one or a combination of variances.
- the second calculating unit 104 obtains a physiological load applied to the subject from a change in the physiological information measured by the physiological measuring unit 102.
- the second calculating unit 104 calculates, for example, an exercise load as the physiological load.
- the second calculator 104 calculates a value obtained by normalizing the measured physiological information based on an arbitrary standard, a value accumulated over an arbitrary period, or an averaged value, a median value, or a differentiated value.
- the exercise load may be obtained by any one or a combination.
- the arbitrary period may be, for example, 24 hours in which the progress of one day is completely included.
- the graph generation unit 105 generates a graph relating to the activity calculated by the first calculation unit 103 and the physiological load calculated by the second calculation unit 104. For example, the graph generation unit 105 uses the change in the amount of activity obtained by the first calculation unit 103 as a first parameter, the change in a physiological load (eg, exercise load) obtained by the second calculation unit 104 as a second parameter, Let the first parameter and the second parameter be a two-dimensional graph.
- the display unit 106 displays a graph based on the graph data generated by the graph generation unit 105 so that the graph can be visually recognized by the subject.
- Two-dimensional graph data may be generated using the obtained change in exercise load as the first parameter and the second parameter as the second parameter, and a graph based on this graph data may be displayed to the subject.
- the server is a computer device including a CPU (Central Processing Unit), a main storage device, an external storage device, a network connection device, and the like, and the CPU operates according to a program developed in the main storage device.
- CPU Central Processing Unit
- the device shown in FIG. 2 includes an acceleration sensor 111, a capacitance detection circuit 112, an analog-digital circuit (ADC) 113, two electrodes 114a and 114b, a potential detection circuit 115, an analog-digital circuit (ADC) 116, and an arithmetic processing circuit 117. , A radio circuit 118.
- a radio circuit 118 A radio circuit 118.
- the acceleration sensor 111 generates a capacitance change by displacing a movable body provided therein due to a change in acceleration. This change in capacitance is converted into an electric signal by the capacitance detection circuit 112, converted into digital data by the ADC 113, and used as acceleration data.
- the physical measurement unit 101 includes an acceleration sensor 111, a capacitance detection circuit 112, and an ADC 113.
- the two electrodes 114a and 114b are, for example, embedded in clothes so that they can come into contact with the skin.
- the potential difference between the two electrodes 114a and 114b is detected by a potential detection circuit 115, and the analog-digital circuit is used.
- ADC Analog-digital circuit
- the data is converted into digital data and becomes cardiac potential data.
- the electrodes 114a and 114b, the potential detection circuit 115, and the ADC 116 constitute the physiological measurement unit 102.
- the arithmetic processing circuit 117 acquires acceleration data and cardiac potential data at each set time (for example, every one second).
- the acceleration data and the cardiac potential data acquired by the arithmetic processing circuit 117 are transmitted to the server by a wireless circuit 118 via a gateway (not shown).
- step S101 the physical measurement unit 101 measures a capacitance change as a change in acceleration, for example, as physical information, and the physiological measurement unit 102 measures a potential difference as physiological information (first step, second step). Process).
- step S102 the physical measurement unit 101 calculates a displacement from the measured change in capacitance to obtain acceleration data.
- step S103 the first calculation unit 103 obtains an activity amount related to the body movement of the subject from the acceleration data (third step).
- step S104 the physiological measurement unit 102 calculates an electrocardiogram from the measured potential difference and sets the electrocardiogram as the subject's cardiac potential.
- step S105 the second calculation unit 104 obtains the exercise load of the subject from the cardiac potential (fourth step).
- step S106 the graph generation unit 105 generates graph data relating to the activity calculated in the third step and the physiological load calculated in the fourth step (fifth step). For example, the graph generation unit 105 uses the obtained change in the amount of activity as the first parameter, the obtained change in the exercise load as the second parameter, the first parameter on the horizontal axis, and the second parameter on the vertical axis. Generate dimensional graph data.
- step S107 the display unit 106 displays the generated graph (two-dimensional graph) (sixth step).
- the exercise load can be obtained from the heart rate.
- the heart rate can be calculated as the number of peaks per minute, for example, by detecting the peak by thresholding the waveform of the electrocardiographic data with a predetermined threshold, measuring the time interval from the peak to the next peak. (See FIG. 4).
- the value obtained by dividing this heart rate by the maximum heart rate of the subject may be used as the exercise load.
- the measured heart rate / maximum heart rate of the subject ⁇ 100 is generally called exercise intensity (% MHR; Maximum ; Heart Rate).
- the exercise load is calculated by using the difference between the resting heart rate and the maximum heart rate (reserve heart rate, Heart Rate Reserved; HRR), (measured heart rate ⁇ resting heart rate of the subject) ⁇ (measured heart rate) Heart rate at rest-heart rate at rest).
- HRR Heart Rate Reserved
- acceleration is detected using a three-axis acceleration sensor that detects acceleration in three directions of XYZ axes. Since the acceleration of each axis changes depending on the inclination of the physical measurement unit 101 mounted on the subject, for example, the norm (the sum of vectors) is used as the displacement.
- Norm x-axis, y-axis, the acceleration in each direction of the z-axis a x, a y,
- a z given by "
- (a x 2 + a y 2 + a z 2) 1/2
- the amount of activity is calculated (moving sum) by integrating the norm as shown in the following equation (1).
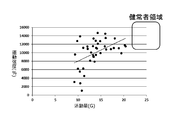
- the measurement results of the exercise amount and the activity amount obtained as described above are generated as a two-dimensional graph (see FIG. 5) in which exercise intensity (exercise load) is set on the vertical axis and activity amount is set on the horizontal axis.
- exercise intensity exercise load
- activity amount is set on the horizontal axis.
- the measurement results are indicated by circles.
- a healthy person region obtained from a data group of healthy people measured in advance is set and displayed. This makes it possible to visually grasp how close the measurement result indicated by the white circle is to the healthy person zone.
- the effect of recovery by rehabilitation can be considered in association with (associated with) physical function.
- the activity amount may be calculated by integrating a value obtained by squaring the difference of the time change of the norm as shown in the following equation (2).
- the activity amount may be calculated by integrating the absolute value of the difference in the time change of the norm (sum of the absolute values of the difference), as shown in the following equation (3). In this case, the amount of calculation can be reduced as compared with the sum of squares of the difference.
- the amount of activity may be calculated as the standard deviation of the time change of the norm and the moving standard deviation.
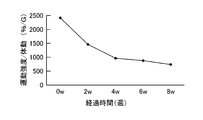
- FIG. 6 shows statistical data relating to the relationship between the moving standard deviation and FIM (Functional Independence).
- FIM is an evaluation index of ADL (Activities @ of @ daily @ living). It can be seen that the moving standard deviation has a correlation with the FIM.
- the same value (1 G) as the gravitational acceleration is output even at rest, but a very small value is output at rest because the moving standard deviation is an amount indicating the distance from the average.
- the first calculation unit 103 estimates the posture of the subject based on the acceleration measured by the physical measurement unit 101 and sets the posture as the activity amount.
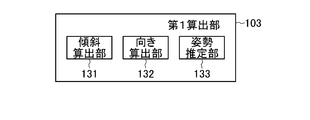
- the first calculator 103 includes a tilt calculator 131, a direction calculator 132, and a posture estimator 133.
- the inclination calculation unit 131 obtains the inclination angle ⁇ of the subject from the acceleration measured by the physical measurement unit 101 using the following equation (5).
- the direction calculation unit 132 obtains the direction ⁇ of the subject from the acceleration measured by the physical measurement unit 101 using the following equation (6).
- ⁇ ( ⁇ 90 ⁇ ⁇ ⁇ 270) is the inclination of the z-axis of the physical measurement unit 101 with respect to the vertical direction
- ⁇ ( ⁇ 90 ⁇ ⁇ ⁇ 270) is the inclination of the x-axis of the physical measurement unit 101 with respect to the vertical direction.
- the unit is degree [degree].
- the posture estimation unit 133 estimates the posture by comparing the values of the inclination angle ⁇ and the direction ⁇ obtained as described above with threshold values. Since the inclination of the physical measurement unit 101 reflects the inclination of the body of the subject wearing the physical measurement unit 101, the posture of the subject can be estimated from the inclination of the physical measurement unit 101.
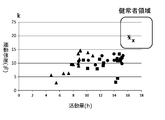
- FIG. 8 is a two-dimensional graph in which the 24-hour cumulative value of% HRR is exercise intensity (exercise load), and the 24-hour activity time (sum of standing time, sitting time, and walking time) is the amount of activity.
- the measurement results of the patient are indicated by circles, squares, and triangles. Circles indicate patients with high FIM, squares indicate patients with intermediate FIM, and triangles indicate patients with low FIM.
- a healthy subject region (*) obtained from a data group of healthy subjects measured in advance is set and displayed.
- the FIM the closer to the healthy person area is, the higher the FIM, which is a medical evaluation index of existing rehabilitation, is related to the measurement result. Thereby, it is possible to visually grasp how close the measurement result indicated by a circle is to the healthy person zone.
- the effect of recovery by rehabilitation can be considered in association with (associated with) physical function.
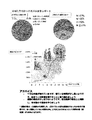
- FIG. 9 shows the results of measuring the posture angle of the patient (subject). This is a result of measuring for 28 hours (including men and women) for 48 hours per person.
- a highly reliable threshold value based on the hospitalized living condition can be set.
- the total time other than the sum of the sitting, standing, and walking times, that is, the time other than the sleeping (lying) time is defined as the activity amount.
- the standard deviation s of the acceleration may be obtained from the acceleration measured by the physical measurement unit 101 according to the following equation (7), and the direction calculated by the direction calculation unit 132 may be compensated based on the standard deviation s. .
- the acceleration measured by the physical measurement unit 101 when the acceleration measured by the physical measurement unit 101 is large, it is interpreted as sitting or standing, and when the acceleration measured by the physical measurement unit 101 is small, , The orientation of the body determined by the orientation calculation unit 132 is held for a certain period of time. Focusing on the magnitude of the acceleration measured by the physical measurement unit 101 and holding it enables a posture estimation that is stable against disturbance and stable.
- the measured values of the angles when standing up, lying on the back, and prone will be described with reference to FIGS.
- the results ranged from 165 to 200 degrees when lying on the back, from 1 to 27 degrees when prone, and from 67 to 118 degrees when standing up.
- the range in which it is determined to be awake is set to a range of 30 to 140 degrees (FIG. 12).
- the second calculating unit 104 calculates an additional processing value obtained by dividing the calculated exercise load by the activity amount calculated by the first calculating unit 103.
- the graph generating unit 105 calculates the additional processing value calculated by the second calculating unit 104. May be used as a second parameter, and the first parameter and the second parameter may be represented as a two-dimensional graph. For example, in the graph shown in FIG. 5, the vertical axis may be shown in FIG. 13 using the quotient (additional processing value) obtained by dividing the exercise load by the activity amount as the exercise intensity (exercise load). In FIG. 13, circles indicate patients with high FIM, squares indicate patients with intermediate FIM, and triangles indicate patients with low FIM.
- FIG. 14 shows statistical data on the relationship between the 24-hour accumulation of% HRR divided by the amount of activity calculated by the movement standard deviation and the evaluation index SIAS (StrokepairImpairment Assessment) Set) for dysfunction used during stroke treatment.
- SIAS StressImpairment Assessment
- the index on the vertical axis has an inverse correlation with the SIAS.
- Exercise intensity (exercise load) divided by the amount of activity is an index of efficiency when the patient moves the body, so using this as the vertical axis, the amount of activity as activity time and the efficiency of physical manipulation Can be evaluated.
- the graph generation unit 105 generates a graph (time-series graph) in which the additional processing values obtained by the second calculation unit 104 are displayed in time series as illustrated in FIG. A series graph may be displayed.
- FIG. 15 illustrates changes in body movements of a plurality of patients, that is, changes in the load (exercise intensity / body movement) of a plurality of patients as additional processing values.
- the graph generation unit 105 may generate both a time-series graph indicating the additional processing value in a time series and the two-dimensional graph described above, and simultaneously display these on the display unit 106.
- One of the graphs may be generated, and the generated one of the graphs may be displayed on the display unit 106.
- the function recovery training support system according to the first embodiment further includes a training item storage unit 107 and an item selection unit 108.
- the training item storage unit 107 stores a plurality of items related to the function recovery training in association with the activity amount and the exercise load.
- the item selection unit 108 selects one of the items stored in the training item storage unit 107 based on the activity amount obtained by the first calculation unit 103 and the exercise load obtained by the second calculation unit 104. As described above, the item selected by the item selection unit 108 is displayed on the display unit 106 together with the graph generated by the graph generation unit 105.
- the function recovery training support system includes an advice storage unit 109 and an advice selection unit 110.
- the advice storage unit 109 stores a plurality of advices relating to the function recovery training in association with the activity amount and the exercise load.
- the advice selection unit 110 selects one of the advices stored in the advice storage unit 109 based on the activity amount obtained by the first calculation unit 103 and the exercise load obtained by the second calculation unit 104. As described above, the advice selected by the advice selecting unit 110 is displayed on the display unit 106 together with the graph generated by the graph generating unit 105.
- FIG. 19 shows a two-dimensional graph in which the vertical axis represents the total exercise intensity (exercise load) in one day, and the horizontal axis represents the total activity time (activity) in one day.
- the total exercise intensity in one day “(measured heart rate ⁇ resting heart rate of the subject) ⁇ (maximum heart rate of the subject ⁇ resting heart rate) ⁇ 100” is used.
- the activity time the total time in a posture other than the sleeping or lying time in one day is used. As shown in FIG. 19, it can be seen that the greater the exercise load and the amount of activity, the longer the time that can be moved, the higher the activity that can be performed, and the more efficiently the user can move long.
- a threshold value A th of the activity amount and a threshold value L th of the exercise load are set based on the region of the healthy person.
- the rehabilitation menu can be presented as a training item suited to the patient's condition by determining the obtained exercise load and activity amount as threshold values based on the flowchart of FIG.
- step S101 the physical measurement unit 101 measures a change in capacitance as a change in acceleration, and the physiological measurement unit 102 measures a potential difference.
- step S102 the physical measurement unit 101 calculates a displacement from the measured change in capacitance to obtain acceleration data.
- step S103 the first calculation unit 103 obtains an activity amount related to the body movement of the subject from the acceleration data.
- step S104 the physiological measurement unit 102 calculates an electrocardiogram from the measured potential difference and sets the electrocardiogram as the subject's cardiac potential.
- step S105 the second calculation unit 104 obtains the exercise load of the subject from the cardiac potential.
- step S201 the item selecting unit 108, the obtained exercise load L whether the threshold L th is greater than. If exercise load L is equal to or less than the threshold L th (no in step S201), in step S202, the item selecting unit 108 selects the menu 1 from training item storage unit 107, the display unit 106. On the other hand, if the exercise load L is larger than the threshold value L th (yes in step S201), the process proceeds to step S203, the item selecting unit 108, the obtained amount of activity A is equal to or threshold A th or greater.
- step S202 When the activity amount A is equal to or smaller than the threshold value Ath (No in step S203), in step S202, the item selecting unit 108 selects the menu 2 from the training item storage unit 107 and displays the menu 2 on the display unit 106. On the other hand, when the activity amount A is larger than the threshold value Ath (Yes in step S203), the process proceeds to step S205, and the item selecting unit 108 displays on the display unit 106 a notification that the rehabilitation is completed.
- the elapsed time (b) of the exercise load and the elapsed time (c) of the activity amount may be displayed.
- the patient can grasp the activity in daily life in association with the exercise load and the amount of activity, and can feed back to the function recovery training that is being performed.
- advice (advice) is displayed in addition to the results of the exercise load and the activity amount.
- Advice from a doctor or the like is stored in the advice storage unit 109.
- the advice selecting unit 110 the results of the obtained exercise load and the amount of activity are selected by using an algorithm such as machine learning, and an advice as a standard document stored in the advice storage unit 109 is selected and displayed on the display unit 106.
- an algorithm such as machine learning
- FIG. 24 shows the relationship between the amount of activity and the reserve oxygen uptake from walking to running of the subject, calculated by equation (4).
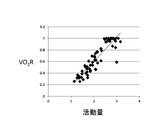
- FIG. 25 shows the relationship between the positive square root of the amount of activity from walking to running of the subject calculated by equation (4) and the reserve oxygen intake.
- the plot is non-linearly distributed in a quadratic function, whereas in FIG. 25, the plot is linearly, that is, linearly distributed. This tendency is similar even when the maximum oxygen intake is used instead of the reserve oxygen intake. The same tendency can be obtained by using equations (1), (2) and (3) instead of equation (4).
- the linear relationship has the advantage that it is intuitive and predictive for oxygen uptake, and the amount of calculation is small.Also, the application to linear assumption analysis, such as multiple regression analysis, is performed with high reliability. It becomes possible.
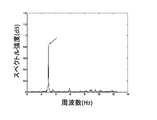
- FIG. 26 shows a result obtained by performing a fast Fourier transform (FFT) on a temporal change of 1024 points that are temporally continuous at the data rate of 25 Hz, that is, a sum of the accelerations in the three directions measured by the physical measurement unit 101 at a data rate of 25 Hz.
- FFT fast Fourier transform
- FIG. 27 shows the relationship between such peak frequency and reserve oxygen intake, and it can be seen that a correlation has been obtained. This indicates the relationship between the walking pitch and the oxygen intake, and it is possible to simultaneously grasp the specific condition of walking or running and the oxygen intake in that condition.
- the function recovery training support system according to the third embodiment further includes an oxygen intake amount calculation unit 121.
- the oxygen intake amount calculation unit 121 creates a regression equation from the distribution of the activity amount and the oxygen intake amount, and calculates the oxygen intake amount using the created regression equation.
- the regression equation may be created using a distribution obtained in advance, or may be created each time from the oxygen intake and the activity stored in the oxygen intake calculator 121.
- the oxygen uptake calculation unit 121 can also implement these regression equations.
- Oxygen intake is originally measured from expiration, but since expiration measurement places a large burden on the subject, it can be easily estimated from the amount of activity using the above-mentioned regression equation to achieve low oxygen consumption. The intake amount can be grasped.
- the function recovery training support system according to the fourth embodiment further includes a subject information storage unit 122.
- the subject information storage unit 122 includes the subject's date of birth, age, gender, height, weight, medical history, medication history, hospitalization / discharge history, treatment staff, FIM (Functional Independence Measure), hospital room, and beds used. At least one of the history information of the subject is stored. By providing the subject information storage unit 122 that stores the history information of the subject, it is possible to associate the change in the activity amount or the exercise load of the subject with the cause. Can be.
- the oxygen uptake calculating unit 121 calculates the activity amount obtained by the first calculating unit 103, the physiological load obtained by the second calculating unit 104, and the history information of the subject stored in the subject information storage unit 122.
- the maximal oxygen uptake or reserve oxygen uptake can be determined from at least one of the following.
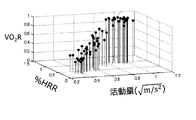
- FIG. 30 shows the amount of activity calculated by the positive square root of the value calculated by equation (4) and the% HRR with respect to the acceleration measurement value during the period from walking to running of the subject calculated by equation (4).
- the regression equation described above may be created using such a relationship.
- Equation (8) does not include the history information of the subject, but if multiple regression analysis is performed using the history information as the following terms, a regression equation including the history information can be obtained. Also, if the number of x 1 is large, using stepwise variable selection method (see Non-Patent Document 1), may be to selected only strong x 1 a more relationship with Y to create a regression equation. Since the stepwise variable selection method can be performed mechanically, it can be easily implemented in a system.
- Table 1 below, the amount of activity positive determination of the preliminary oxygen uptake regression equation obtained by using the square root factor R 2,% determination of the regression equation for the preliminary oxygen uptake obtained with HRR coefficient R 2, The coefficient of determination R 2 of the regression equation for reserve oxygen uptake obtained by using the multiple regression analysis for both the positive square root of the amount of activity and the% HRR is shown. It can be seen that the best estimation accuracy is obtained when both are used. Using such a multivariate regression equation can provide an accurate estimate of oxygen uptake.
- logistic regression can be used for the multivariate regression equation. These can perform non-linear regression, which cannot be performed by multiple regression analysis, so that more optimized regression can be performed and a reliable oxygen intake estimate can be provided.
- each term can be multiplied by a coefficient, and the value of the coefficient can be switched according to a condition.
- FIG. 31 illustrates the relationship between the positive square root of the amount of activity and the healthy subject, with the horizontal axis representing% HRR and the vertical axis representing% HRR.
- the results of the function recovery training are displayed. Is easier to grasp.
- the physical measurement unit may use an angular velocity sensor (gyro sensor).
- the angular velocity sensor has an advantage that the activity amount can be more easily obtained because the angular velocity sensor outputs an angle that is a substitute for the above ⁇ and ⁇ as a measured value.
- the physical measurement unit may use GPS. Since the GPS acquires position information, it can calculate the amount of movement from its history, and can provide an effective amount of exercise from the viewpoint of exercise monitoring.
- the physiological measurement unit may use an electromyograph.
- the electrocardiograph can grasp the metabolism of the whole body, including the central and peripheral systems. Load information can be provided.
- a respirometer may be used for the physiological measurement unit. Since the respiratory rate generally increases when the exercise load increases, the respirometer can be expected to play a role similar to that of an electrocardiograph, and it is expected that the heart rate can be replaced with the respiratory rate.
- the respirometer has an advantage that the sensor does not need to be arranged on the surface of the skin of the body, so that it can be easily attached and detached.
- a sphygmomanometer may be used on the side of the physiological meter. Exercise increases oxygen consumption and increases blood pressure as well as heart rate, so blood pressure can replace heart rate. When blood pressure is constantly measured due to illness or the like, since it is complicated to use other sensors in combination, it is possible to secure convenience by using the blood pressure monitor used.
- a pulse meter may be used for the side of the physiological meter. If a pulse is used, measurement can be performed with an arm, a foot, a neck, or the like where it is difficult to measure a cardiac potential, and measurement can be more easily performed.
Abstract
第1算出部(103)は、物理測定部(101)が測定した物理的情報の変化から被測定者の体動に関連する活動量を求める。第2算出部(104)は、生理測定部(102)が測定した生理的情報の変化から被測定者にかかる生理的負荷を求める。グラフ生成部(105)は、第1算出部(103)が求めた活動量および第2算出部(104)が求めた生理的負荷に関するグラフを生成する。例えば、グラフ生成部(105)は、第1算出部(103)が求めた活動量の変化を第1パラメータとし、第2算出部(104)が求めた生理的負荷の変化を第2パラメータとし、第1パラメータと第2パラメータとを2次元のグラフデータとする。表示部(106)は、グラフ生成部(105)が生成したグラフデータによるグラフを被測定者に視認可能に表示する。
Description
本発明は、機能回復の状況、機能回復における課題、機能回復の目標などを提示する機能回復訓練支援システムおよび方法に関する。
特許文献1(特開2005-352686号)には、機能回復のために患者が行う運動(リハビリテーション運動)による情報を分析し、複数の患者の運動機能の履歴全般について管理するリハビリテーション管理装置が提案されている。また、特許文献2(特開2010-108430号)には、機能回復訓練(リハビリテーション)の多数の評価項目の評価値が、総体として、良い方へ向かっているのか、変化が無いのか、あるいは、悪い方へ向かっているのかを、所望の時点まで遡って容易に把握できるようにしたリハビリテーション支援装置が提案されている。
日経BigData Data Market、「変数選択の過程の説明がしやすいステップワイズ法」、[令和1年5月23日検索]、(https://business.nikkeibp.co.jp/atclbdt/15/recipe/120400035/?ST=print)。
しかしながら、上述した従来の技術では、患者が行った機能回復訓練運動の実績を管理・表示する機能に限定されており、患者の身体機能がどの程度回復したのか、健常者にどの程度近づいたのか、をわかりやすく理解することができなかった。このように、従来では、機能回復訓練の成果が把握しにくいという問題があった。
本発明は、以上のような問題点を解消するためになされたものであり、機能回復訓練の成果を把握しやすくすることを目的とする。
本発明に係る機能回復訓練支援システムは、被測定者に装着されて被測定者の身体の静的または動的な状態を表す物理的情報を時系列に測定する物理測定部と、被測定者の体内における生理的情報を時系列に測定する生理測定部と、物理測定部が測定した物理的情報の変化から被測定者の活動量を求める第1算出部と、生理測定部が測定した生理的情報の変化から被測定者にかかる生理的負荷を求める第2算出部と、第1算出部が求めた活動量および第2算出部が求めた生理的負荷に関するグラフを生成するグラフ生成部と、グラフ生成部が生成したグラフを被測定者が視認するための表示部とを備える。
本発明に係る機能回復訓練支援方法は、被測定者の身体の性的または動的な状態を表す物理的情報を測定する第1工程と、被測定者の体内における生理的情報を測定する第2工程と、測定された物理的情報より被測定者の活動量を求める第3工程と、測定された生理的情報より被測定者にかかる生理的負荷を求める第4工程と、第3工程で求めた活動量および第4工程で求めた生理的負荷に関するグラフを生成する第5工程と、生成したグラフを被測定者に視認可能に表示する第6工程とを備える。
以上説明したように、本発明によれば、被測定者において測定された物理的情報および生理的情報より求めた活動量および運動負荷に関するグラフを表示するようにしたので、機能回復訓練の成果が把握しやすくなるという優れた効果が得られる。
以下、本発明の実施の形態おける機能回復訓練支援システムについて説明する。
[実施の形態1]
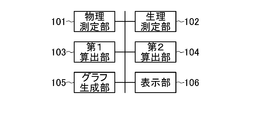
はじめに、本発明の実施の形態1係る機能回復訓練支援システムについて、図1を参照して説明する。この機能回復訓練支援システムは、物理測定部101、生理測定部102、第1算出部103、第2算出部104、グラフ生成部105、表示部106を備える。
はじめに、本発明の実施の形態1係る機能回復訓練支援システムについて、図1を参照して説明する。この機能回復訓練支援システムは、物理測定部101、生理測定部102、第1算出部103、第2算出部104、グラフ生成部105、表示部106を備える。
物理測定部101は、被測定者(患者)に装着されて、被測定者の身体の静的・動的状態を表す物理的情報を時系列に測定する。例えば、物理的情報とは、例えば、加速度、角速度、位置座標の少なくとも1つである。以下では、物理測定部101として、加速度を時系列に測定する加速度測定部を例に説明する。生理測定部102は、被測定者の体内の生理的情報を測定する。生理的情報とは、例えば、心電位、心拍数、脈拍数、血圧、筋電位、呼吸活動の少なくとも1つである。以下では、生理測定部102として、被測定者の心電位を測定する心電測定部を例に説明する。
第1算出部103は、物理測定部101が測定した物理的情報の変化から被測定者の体動に関する活動量を求める。例えば、第1算出部103は、測定された物理情報の二乗和、または二乗和の平方根、または任意の期間の累積値、または時間差分、または時間差分の絶対値、任意の期間の標準偏差または分散のいずれか、もしくは組み合わせにより活動量を求める。
第2算出部104は、生理測定部102が測定した生理的情報の変化から被測定者にかかる生理的負荷を求める。第2算出部104は、生理的負荷として、例えば、運動負荷を求める。例えば、第2算出部104は、測定された生理的情報を任意の基準をもとに規格化した値、または任意の期間累積した値、または平均化した値、中央値、または微分した値のいずれか、もしくは組み合わせにより運動負荷を求めるようにしてもよい。任意の期間は、例えば1日の経過が漏れなく含まれる24時間とすればよい。
グラフ生成部105は、第1算出部103が求めた活動量および第2算出部104が求めた生理的負荷に関するグラフを生成する。例えば、グラフ生成部105は、第1算出部103が求めた活動量の変化を第1パラメータとし、第2算出部104が求めた生理的負荷(例えば運動負荷)の変化を第2パラメータとし、第1パラメータと第2パラメータとを2次元のグラフとする。表示部106は、グラフ生成部105が生成したグラフデータによるグラフを被測定者に視認可能に表示する。
例えば、図2に示すようなウエアラブルなデバイスを用い、ゲートウエイを介して遠隔に配置されているサーバに測定データを送信し、サーバにおいて、活動量および運動負荷を求め、求めた活動量の変化を第1パラメータとし、求めた運動負荷の変化を第2パラメータとした2次元のグラフデータを生成し、このグラフデータによるグラフを被測定者に表示するようにしてもよい。
この構成では、第1算出部103、第2算出部104、グラフ生成部105の機能を、サーバにおいて実現する。サーバは、CPU(Central Processing Unit;中央演算処理装置)と主記憶装置と外部記憶装置とネットワーク接続装置となどを備えたコンピュータ機器であり、主記憶装置に展開されたプログラムによりCPUが動作することで、上述した各機能が実現される。
図2に示すデバイスは、加速度センサ111,容量検出回路112,アナログ-デジタル回路(ADC)113,2つの電極114a,114b,電位検出回路115,アナログ-デジタル回路(ADC)116,演算処理回路117,無線回路118を備える。
加速度センサ111は、内部に備えられている可動体が加速度の変化により変位し、容量変化を生成する。この容量の変化は、容量検出回路112により電気信号に変換され、ADC113によりデジタルデータに変換され、加速度データとされる。物理測定部101は、加速度センサ111,容量検出回路112,ADC113を備える。
また、2つの電極114a,114bは、例えば、着衣に埋め込まれて皮膚に接触可能とされ、この2つの電極114a,114bの間に生じる電位差が、電位検出回路115で検出され、アナログ-デジタル回路(ADC)116においてデジタルデータに変換されて心電位データとなる。電極114a,114b、電位検出回路115、ADC116が、生理測定部102となる。
演算処理回路117は、設定されている時刻毎(例えば1秒毎)に、加速度データ、心電位データを取得する。演算処理回路117が取得した加速度データ、心電位データは、無線回路118により、図示しないゲートウエイを介してサーバに送信される。
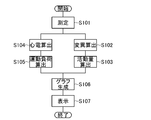
次に、実施の形態1係る機能回復訓練支援システムの動作例(機能回復訓練支援方法)について、図3のフローチャートを用いて説明する。
まず、ステップS101で、物理測定部101において、物理情報として、例えば、加速度の変化として容量変化が測定され、生理測定部102において、生理的情報として電位差が測定される(第1工程,第2工程)。次に、ステップS102で、物理測定部101が、測定した容量変化より変位を算出して加速度データとする。次に、ステップS103で、第1算出部103が、加速度データより被測定者の体動に関連する活動量を求める(第3工程)。
また、ステップS104で、生理測定部102が、測定した電位差より心電を算出して被測定者の心電位とする。次に、ステップS105で、第2算出部104が、心電位より被測定者の運動負荷を求める(第4工程)。
次に、ステップS106で、グラフ生成部105が、第3工程で求めた活動量および第4工程で求めた生理的負荷に関するグラフのデータを生成する(第5工程)。例えば、グラフ生成部105は、求められた活動量の変化を第1パラメータとし、求められた運動負荷の変化を第2パラメータとし、第1パラメータを横軸、第2パラメータを縦軸とした2次元グラフのデータを生成する。次に、ステップS107で、表示部106が、生成されたグラフ(2次元グラフ)を表示する(第6工程)。
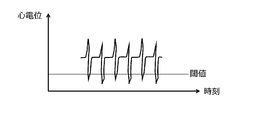
ここで、運動負荷の算出について説明する。運動負荷は、心拍数から求めることができる。心拍数は、心電位データの波形を所定の閾値で閾値処理してピークを検出し、ピークから次のピークまでの時間間隔を測定し、例えば1分間当たりのピークの数として算出することができる(図4参照)。この心拍数を、被測定者の最大心拍数で除した値を運動負荷とすればよい。なお、測定された心拍数÷被測定者の最大心拍数×100は、一般に運動強度(%MHR;Maximum Heart Rate)と呼ばれている。
ところで、運動負荷は、安静時心拍数と最大心拍数の差(予備心拍数、Heart Rate Reserved;HRR)を用い、(測定された心拍数-被測定者の安静時心拍数)÷(被測定者の最大心拍数-安静時心拍数)により求めてもよい。この計算結果は、運動強度(%HRR;% Heart Rate Reserve)と呼ばれている。
次に、加速度より求める活動量について説明する。まず、加速度は、XYZ軸の3方向の加速度を検出する3軸の加速度センサを用いて検出する。各軸の加速度は、被測定者に装着されている物理測定部101の傾きに依存して変化するため、変位として、例えば、ノルム(ベクトルの合成和)を用いる。ノルムは、x軸、y軸、z軸の各方向の加速度をax、ay、azとすると、「|a|=(ax
2+ay
2+az
2)1/2」で与えられる。平方根を用いることは、計算量を増大させるため、2乗和(ax
2+ay
2+az
2)を用いてもよい。また、測定される加速度における意図しない極端に大きな振動を除去するため、ノルムや2乗和に対してローパスフィルタを適用してもよい。
活動量は、以下の式(1)に示すように、ノルムを積分することにより(移動和)計算される。

上述したように求めた運動量および活動量の測定結果を、運動強度(運動負荷)を縦軸とし、活動量を横軸とした2次元グラフ(図5参照)として生成する。図5において、測定結果を丸で示す。また、このグラフの中に、予め測定した健常者のデータ群から求めた健常者領域を設定して表示する。これにより、健常者ゾーンに対して、白丸で示す測定結果がどの程度近づいてきているのかを視覚的に把握できる。また、リハビリによる回復の効果が、身体機能と紐付けて(関連付けて)考えることができる。
また、活動量は、以下の式(2)に示すように、ノルムの時間変化の差を2乗した値を積分して算出してもよい。

また、活動量は、以下の式(3)に示すように、ノルムの時間変化の差の絶対値を積分して算出してもよい(差の絶対値の和)。この場合、差の2乗和に比べて計算量を減らすことができる。

また、活動量は、以下の式(4)に示すように、ノルムの時間変化の標準偏差とし、移動標準偏差で算出してもよい。

図6に、移動標準偏差とFIM(Functional Independence)との関係に関する統計データを示す。FIMは、ADL(Activities of daily living)の評価指標である。移動標準偏差はFIMと相関の関係にあることが分かる。前述した活動量では、静止時にも重力加速度と同じ値(1G)を出力するが、移動標準偏差は平均からの隔たりを表す量であるため、静止時には非常に小さな値を出力する。移動標準偏差を使うことでより運動時を反映した指標を与えることができる。
[実施の形態2]
次に、本発明の実施の形態2係る機能回復訓練支援システムについて説明する。実施の形態2では、第1算出部103が、物理測定部101が測定した加速度より、被測定者の姿勢を推定して活動量とする。実施の形態2では、図7に示すように、第1算出部103が、傾斜算出部131,向き算出部132、姿勢推定部133を備える。
次に、本発明の実施の形態2係る機能回復訓練支援システムについて説明する。実施の形態2では、第1算出部103が、物理測定部101が測定した加速度より、被測定者の姿勢を推定して活動量とする。実施の形態2では、図7に示すように、第1算出部103が、傾斜算出部131,向き算出部132、姿勢推定部133を備える。
まず、傾斜算出部131は、物理測定部101で測定した加速度より、以下の式(5)により、被測定者の傾斜の角度θを求める。

また、向き算出部132は、物理測定部101で測定した加速度より、以下の式(6)により、被測定者の向きφを求める。

なお、θ(-90≦θ<270)は鉛直方向に対する物理測定部101のz軸の傾き、φ(-90≦φ<270)は鉛直方向に対する物理測定部101のx軸の傾きであり、単位は度[degree]である。
姿勢推定部133は、以上のようにして求めた傾斜の角度θおよび向きφの値を閾値と比較をすることで、姿勢を推定する。物理測定部101の傾きは、物理測定部101を身に着けた被測定者の上体の傾きを反映するため、物理測定部101の傾きから被測定者の姿勢を推定できる。
図8は、%HRRの24時間累積値を運動強度(運動負荷)、24時間の活動時間(立位時間、座位時間、歩行時間の総和)を活動量とした2次元グラフである。図8において、患者の測定結果を丸、四角、三角で示す。丸はFIMが高い患者を示し、四角はFIMが中間の患者を示し、三角はFIMが低い患者を示す。また、このグラフの中に、予め測定した健常者のデータ群から求めた健常者領域(*)を設定して表示する。図8では、FIMが高いほど健常者領域に漸近しており、既存のリハビリテーションの医学的評価指標であるFIMと測定結果とに関係があることが分かる。これにより、健常者ゾーンに対して、丸で示す測定結果がどの程度近づいてきているのかを視覚的に把握できる。また、リハビリによる回復の効果が、身体機能と紐付けて(関連付けて)考えることができる。
図9に、患者(被測定者)の姿勢角度を測定した結果を示す。28名(男女含む)の被測定者について、一人当たり48時間計測した結果である。姿勢が切り替わる角度を統計的に探索することで、例えば、入院生活容態に基づく高信頼な閾値を設定することができる。
推定した姿勢のなかで、座っている、立っている、歩いている時間を足した時間、すなわち、寝ている(横になっている)時間以外の合計時間を活動量とする。姿勢を考慮することで、活動量の精度を向上することができる。
ところで、物理測定部101が測定している加速度より以下の式(7)により加速度の標準偏差sを求め、この標準偏差sにより、向き算出部132が求めた向きを補償するようにしてもよい。

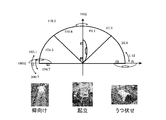
例えば、図10に示すように、物理測定部101が測定している加速度が大きい場合、座位または立位であると解釈し、物理測定部101が測定している加速度が小さい場合は、臥位であるとして、向き算出部132が求めた体の向きを一定時間保持する。物理測定部101が測定している加速度の大きさに着目して保持することにより、擾乱に強く安定した姿勢推定が可能となる。
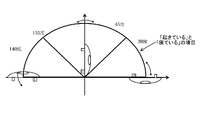
以下、起立、仰向け、うつ伏せ時の角度の実測値について図11,図12を参照して説明する。図11に示すように、仰向け時は165~200度、うつ伏せ時は1~27度、起立時は67~118度の範囲となる結果が得られた。実験結果から、起きていると判定する範囲を30~140度の範囲に設定する(図12)。このように、姿勢の閾値を患者の統計分布から決定することで、実際の入院生活を模擬することができ、姿勢を推定する精度を向上させることができる。
また、第2算出部104において、求めた運動負荷を第1算出部103が求めた活動量で除した追加処理値を求め、グラフ生成部105では、第2算出部104が求めた追加処理値の変化を第2パラメータとして、第1パラメータと第2パラメータとを2次元のグラフとしてもよい。例えば、図5に示したグラフにおいて、縦軸を、運動負荷を活動量で割った商(追加処理値)を運動強度(運動負荷)として用いて図13に示すようにしても良い。図13において、丸はFIMが高い患者を示し、四角はFIMが中間の患者を示し、三角はFIMが低い患者を示す。
また、移動標準偏差で求めた活動量で割った%HRRの24時間累積と、脳卒中治療時に用いられる機能障害の評価指標SIAS(Stroke Impairment Assessment Set)との関係に関する統計データを図14に示す。図14に示すように、縦軸の指標は、SIASと逆相関の関係にあることがわかる。活動量で割られた運動強度(運動負荷)は、患者が身体を動かす際の効率性の指標であるため、これを縦軸に用いることで、活動時間としての活動量と身体操作の効率性の関係性を評価することが可能となる。
また、グラフ生成部105は、第2算出部104において求めた追加処理値を、図15に例示するように、時系列に表示したグラフ(時系列グラフ)を生成し、表示部106がこの時系列グラフを表示してもよい。図15では、追加処理値として、複数の患者の体動すなわち身体操作の負荷(運動強度/体動)の推移が示されている。このような時系列グラフを表示部106に表示することで、リハビリの成果として週の経過とともに負荷が減少してくことが確認できる。負荷が減るということは、楽に体を動かせるようになったことを意味し、効率性が改善されていることを表している。このように追加処理値は、この時系列情報にも価値を持つため、表示部106に時系列に表示することで、リハビリを適切に支援することができる。なお、グラフ生成部105は、追加処理値を時系列に示す時系列グラフおよび前述した2次元のグラフをともに生成し、これらを表示部106に同時に表示してもよく、グラフ生成部105は、いずれか一方のグラフを生成し、生成したいずれか一方のグラフを表示部106に表示してもよい。
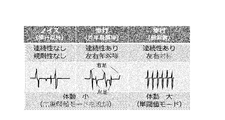
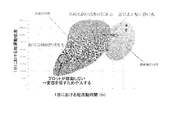
ところで、脳卒中患者の場合、下半身の麻ひなどが発生する場合があり、この場合、右足と左足での体動が異なり、一般的に用いられる歩数計では、歩行を検知する精度が十分に得られない(図16参照)。このような場合、図17に示すように、歩数をカウントする際の閾値を左右の足に対応させて2つにすることで、片半身が麻ひしている患者に対しても歩行検出の精度を確保することができるようになる。
[実施の形態3]
次に、本発明の実施の形態3係る機能回復訓練支援システムについて図18を参照して説明する。実施の形態3では、実施の形態1係る機能回復訓練支援システムに、さらに、訓練項目記憶部107、項目選択部108を備える。
次に、本発明の実施の形態3係る機能回復訓練支援システムについて図18を参照して説明する。実施の形態3では、実施の形態1係る機能回復訓練支援システムに、さらに、訓練項目記憶部107、項目選択部108を備える。
訓練項目記憶部107は、機能回復訓練に関する複数の項目が活動量および運動負荷に関連付けて記憶している。項目選択部108は、第1算出部103が求めた活動量、および第2算出部104が求めた運動負荷を元に訓練項目記憶部107に記憶されているいずれかの項目を選択する。このように、項目選択部108が選択した項目は、表示部106が、グラフ生成部105が生成したグラフとともに表示する。
また、実施の形態3係る機能回復訓練支援システムは、助言記憶部109、助言選択部110を備える。
助言記憶部109は、機能回復訓練に関する複数の助言が活動量および運動負荷に関連付けて記憶している。助言選択部110は、第1算出部103が求めた活動量、および第2算出部104が求めた運動負荷を元に、助言記憶部109に記憶されているいずれかの助言を選択する。このように、助言選択部110が選択した助言は、表示部106が、グラフ生成部105が生成したグラフとともに表示する。
例えば、図19に、縦軸を1日における総運動強度(運動負荷)、横軸を1日における総活動時間(活動量)とした2次元グラフに示す。1日における総運動強度として、「(測定された心拍数-被測定者の安静時心拍数)÷(被測定者の最大心拍数-安静時心拍数)×100」を用い、1日における総活動時間として、1日における寝ているまたは横になっている時間以外の姿勢となっている合計時間を用いる。図19に示すように、運動負荷および活動量が大きいほど、動ける時間が増えること、負荷の高い活動を行えること、効率良く長く動けることが分かる。
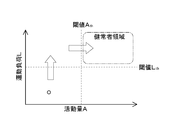
ここで、図20に示すように、活動量Aと運動負荷Lに関し、健常者の領域を元に、活動量の閾値Ath、運動負荷の閾値Lthを設定する。この条件の下に、図21のフローチャートに基づき、求められた運動負荷および活動量を閾値判定することで、患者の状態にあった訓練項目としてリハビリメニューを提示することができる。
まず、ステップS101で、物理測定部101において、加速度の変化として容量変化が測定され、生理測定部102において、電位差が測定される。次に、ステップS102で、物理測定部101が、測定した容量変化より変位を算出して加速度データとする。次に、ステップS103で、第1算出部103が、加速度データより被測定者の体動に関連する活動量を求める。
また、ステップS104で、生理測定部102が、測定した電位差より心電を算出して被測定者の心電位とする。次に、ステップS105で、第2算出部104が、心電位より被測定者の運動負荷を求める。
次に、ステップS201で、項目選択部108が、求められた運動負荷Lが閾値Lthより大きいか否かを判定する。運動負荷Lが閾値Lth以下の場合(ステップS201のno)、ステップS202で、項目選択部108は、訓練項目記憶部107よりメニュー1を選択し、表示部106に表示する。一方、運動負荷Lが閾値Lthより大きい場合(ステップS201のyes)、ステップS203に進み、項目選択部108が、求められた活動量Aが閾値Athより大きいか否かを判定する。活動量Aが閾値Ath以下の場合、(ステップS203のno)、ステップS202で、項目選択部108は、訓練項目記憶部107よりメニュー2を選択し、表示部106に表示する。一方、活動量Aが閾値Athより大きい場合(ステップS203のyes)、ステップS205に進み、項目選択部108は、リハビリが完了したことを通知する旨を表示部106に表示する。
ところで、図22に示すように、運動負荷と活動量との2次元グラフ(a)に加え、運動負荷の時間経過(b)、活動量の時間経過(c)を表示するようにしてもよい。これにより、患者は日常生活の動作と運動負荷、活動量と関連付けて把握することができ、実施している機能回復訓練にフィードバックすることができる。
次に、助言の提示例について説明する。例えば、図23に示すように、運動負荷および活動量の結果に加えてアドバイス(助言)を表示する。医師などによるアドバイスを助言記憶部109に記憶しておく。助言選択部110において、求められた運動負荷と活動量の結果を機械学習などのアルゴリズムを用い、助言記憶部109に記憶されている定型の文書としてのアドバイスを選択し、表示部106に表示するこれにより、患者に、実施している機能回復訓練の改善点を提示することができる。
ところで、活動量は、式(1)、式(2)、式(3)、式(4)で算出される活動量の正の平方根を用いることもできる。式(4)で算出される被測定者の歩行から走行における活動量と予備酸素摂取量との関係を図24に示す。また、式(4)で算出される被測定者の歩行から走行における活動量の正の平方根と、予備酸素摂取量との関係を図25に示す。図24では、プロットが2次関数的に非線形に分布しているのに対し、図25では、直線的、すなわち線形に分布している。この傾向は、予備酸素摂取量の代わりに最大酸素摂取量を用いても同様である。また式(4)の代わりに式(1)、式(2)、式(3)を用いても同様の傾向が得られる。
線形の関係性のほうが、酸素摂取量を予測するうえで直感的に扱いやすい、計算量が少ないといった利点があり、また、線形を仮定した解析、たとえば重回帰分析への応用が高信頼に実施可能となる。
また、活動量は、物理測定部101が測定した3方向の加速度の和の時間変化のピーク周波数を用いることもできる。物理測定部101が測定した3方向の加速度の和を時間的に連続する1024点、すなわち25Hzのデータレートで40.96秒間の時間変化を高速フーリエ変換(FFT)した結果を図26に示す。3Hzのところにピークがあるが、これから1秒間に3歩、すなわち1分間で180歩のピッチで走行していたことが分かる。このようなピークの周波数と予備酸素摂取量との関係を示したものが図27であり、相関関係が得られていることが分かる。これは、歩行ピッチと酸素摂取量の関係性を示すものであり、歩行もしくは走行の具体的な容態とその容態における酸素摂取量が同時に把握可能となる。
[実施の形態4]
次に、本発明の実施の形態4係る機能回復訓練支援システムについて図28を参照して説明する。実施の形態4では、実施の形態3係る機能回復訓練支援システムにさらに酸素摂取量算出部121を備える。酸素摂取量算出部121は、活動量と酸素摂取量の分布から回帰式を作成し、作製した回帰式を用いて酸素摂取量を算出する。回帰式は、あらかじめ得た分布を用いて作成してもよいし、酸素摂取量算出部121に格納されている酸素摂取量と活動量から都度作成してもよい。
次に、本発明の実施の形態4係る機能回復訓練支援システムについて図28を参照して説明する。実施の形態4では、実施の形態3係る機能回復訓練支援システムにさらに酸素摂取量算出部121を備える。酸素摂取量算出部121は、活動量と酸素摂取量の分布から回帰式を作成し、作製した回帰式を用いて酸素摂取量を算出する。回帰式は、あらかじめ得た分布を用いて作成してもよいし、酸素摂取量算出部121に格納されている酸素摂取量と活動量から都度作成してもよい。
あらかじめ得た分布を用いる場合について、図24、図25、図27に示した分布を例として説明する。例えば、図24に示した分布の回帰式は、予備酸素摂取量をY、活動量をXとすると「Y=-0.9X2+1.79X+0.11」となる。また、図25に示した分布の回帰式は、予備酸素摂取量をY、活動量をXとすると「Y=1.12X-0.06」となる。また、図27に示した分布の回帰式は、予備酸素摂取量をY、活動量をXとすると「Y=0.42X-0.24」となる。酸素摂取量算出部121は、これら回帰式を実装することもできる。
酸素摂取量は、本来は呼気から計測されるものであるが、呼気計測は被測定者の負担が大きいため、上述した回帰式を用いて活動量から簡便に推定することで、低負担で酸素摂取量が把握可能となる。
[実施の形態5]
次に、本発明の実施の形態5に係る機能回復訓練支援システムについて図29を参照して説明する。実施の形態5では、実施の形態4係る機能回復訓練支援システムにさらに被測定者情報記憶部122を備える。被測定者情報記憶部122は、被測定者の生年月日、年齢、性別、身長、体重、病歴、投薬履歴、入退院履歴、治療担当者、FIM(Functional Independence Measure)、病室、利用ベッドを含む被測定者の履歴情報の少なくとも1つを格納する。こうした被測定者の履歴情報を格納する被測定者情報記憶部122を備えることで、被測定者の活動量や運動負荷の変化が、何によってもたらされたものであるかを関連付けて考えることができる。
次に、本発明の実施の形態5に係る機能回復訓練支援システムについて図29を参照して説明する。実施の形態5では、実施の形態4係る機能回復訓練支援システムにさらに被測定者情報記憶部122を備える。被測定者情報記憶部122は、被測定者の生年月日、年齢、性別、身長、体重、病歴、投薬履歴、入退院履歴、治療担当者、FIM(Functional Independence Measure)、病室、利用ベッドを含む被測定者の履歴情報の少なくとも1つを格納する。こうした被測定者の履歴情報を格納する被測定者情報記憶部122を備えることで、被測定者の活動量や運動負荷の変化が、何によってもたらされたものであるかを関連付けて考えることができる。
また、酸素摂取量算出部121は、第1算出部103が求めた活動量、第2算出部104が求めた生理的負荷、被測定者情報記憶部122に格納された被測定者の履歴情報の少なくとも1つより、最大酸素摂取量または予備酸素摂取量を求めることができる。
図30に、式(4)で算出された被測定者の歩行から走行における期間の加速度計測値に対し、式(4)で算出された値の正の平方根により求めた活動量と、%HRRおよび予備酸素摂取量との関係を示す。活動量と%HRRとは、ともに予備酸素摂取量と相関があることが分かる。こうした関係性を用いて前述した回帰式を作成してもよい。重回帰分析の式は、一般にY=β0+Σi=1βixi(i=1,2,3,…)であるが、予備酸素摂取量をY、運動負荷をx1、活動量の正の平方根をx2とすると、回帰式は重回帰分析を用いて「Y=0.39x1+0.71x2-0.07・・・(8)」となる。
式(8)には、被測定者の履歴情報が含まれていないが、履歴情報を以降の項として用いた重回帰分析を行えば、履歴情報を含んだ回帰式を得ることができる。また、x1の数が多い場合は、ステップワイズ変数選択法(非特許文献1参照)を用いて、Yとより関係性の強いx1のみを選抜して回帰式を作成してもよい。ステップワイズ変数選択法は、機械式に行えるので容易にシステムへの実装が可能である。
以下の表1に、活動量の正の平方根を用いて得た予備酸素摂取量の回帰式の決定係数R2、%HRRを用いて得た予備酸素摂取量の回帰式の決定係数R2、活動量の正の平方根および%HRRの両者を重回帰分析を用いて得た予備酸素摂取量の回帰式の決定係数R2を示す。両者を用いた場合が最も良好な推定精度が得られていることがわかる。こうした多変量の回帰式を用いることで、正確な酸素摂取量の推定値を提供することができる。

多変量の回帰式には、重回帰分析の代わりに、ロジスティック回帰や、サポートベクトル回帰およびニューラルネットワークを用いることもできる。これらは、重回帰分析ではできない、非線形的な回帰が可能なため、より最適化された回帰を実施でき、高信頼な酸素摂取量の推定値を提供できる。
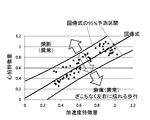
また、多変量の回帰式には、各項に係数を乗じ、条件に応じて係数の値を切り替えることもできる。たとえば、「Y=β0+aβ1x1+bβ2x2=0.39ax1+0.71bx2-0.07」といった係数a,b(0≦a,b≦1)を与え、条件に応じてこれら係数の値を切り替える。切り替えの例を図31を用いて説明する。図31は、活動量の正の平方根を横軸、%HRRを縦軸として健常者のこれらにおける関係を図示したものである。回帰線に対してデータ点が個人差や測定誤差によりばらついているが、95%予測区間を算出することにより、統計的にばらつきがその範囲内に留まることを把握ができる。
しかし、健常者とは異なり、患者の場合はこの95%予測区間を超えた位置にデータが現れることがある。たとえば、頻脈を有する患者であれば、%HRRが高いために95%予測区間を超えてしまう。一方で、過度の麻痺により歩行における体の揺れが大きい場合は、活動量の正の平方根が大きくなり、これも95%予測区間を超えてしまう。これらの場合は、運動負荷か活動量のどちらかの項の値が異常値となるので、上記の回帰式を用いると異常値の項が信頼性の低下を招くために使用は適当ではない。
一方、図31において%HRRが高くて95%予測区間を超える場合は、上の式においてa=0として寄与をなくすことで、異常値の項が信頼性の低下を招くことはなくなり、適切な推定が行える。同様に、活動量の正の平方根が高くて95%予測区間を超える場合は、上の式においてb=0として寄与をなくしてしまえば、異常値の項が信頼性の低下を招くことはなくなり、適切な推定が行える。データが95%予測区間の中に入る場合は、a=b=1とする。このように各項に係数を乗じ、条件に応じて係数の値を切り替えることで、疾病を有した人物であっても高信頼な酸素摂取量の推定値を提供できる。
以上に説明したように、本発明によれば、被測定者において測定された物理的情報および生理的情報より求めた活動量および運動負荷に関するグラフを表示するようにしたので、機能回復訓練の成果が把握しやすくなる。
上記機能回復訓練支援システムにおいて、物理測定部は角速度センサ(ジャイロセンサ)を用いてもよい。角速度センサは、上記θ、Φの代替となる角度を計測値として出力するので、より容易に活動量を取得できる利点がある。また、物理測定部はGPSを用いても良い。GPSは位置情報を取得するため、その履歴から移動量を算出することができ、運動のモニタリングという観点で有効な運動量を提供することができる。
また、生理測定部は筋電計を用いても良い。心電計で把握できるのは中枢系と抹消系を含めた身体全体の代謝であることに対して、筋電計を用いれば、局所的な筋電位を計測でき、解析を容易化する限定的な負荷情報を提供することができる。また、生理計測部には、呼吸計を用いてもよい。運動負荷が高まると一般に呼吸数が増えるために、呼吸計により心電計と類似の役割が期待でき、心拍数を呼吸数に代替できることが期待される。かつ、呼吸計はセンサが身体の皮膚表面に配置される必要が無いため、着脱が容易であるという利点がある。
また生理計側部には、血圧計を用いてもよい。運動をすると酸素消費量が増えるため、心拍数と同様に血圧も上昇することから、血圧が心拍との代替を果たせる。疾病等の関係で血圧を常時測る場合などは、他センサを併用すると煩雑であることから、利用している血圧計で賄うことで利便性が確保できる。また生理計側部には、脈拍計を用いてもよい。脈拍を用いれば、心電位が計測しにくい腕や足や首などで計測が可能であり、より容易に計測ができる。
なお、本発明は以上に説明した実施の形態に限定されるものではなく、本発明の技術的思想内で、当分野において通常の知識を有する者により、多くの変形および組み合わせが実施可能であることは明白である。
101…物理測定部、102…生理測定部、103…第1算出部103、104…第2算出部104、105…グラフ生成部、106…表示部。
Claims (17)
- 被測定者に装着されて前記被測定者の身体の静的または動的な状態を表す物理的情報を時系列に測定する物理測定部と、
前記被測定者の体内における生理的情報を時系列に測定する生理測定部と、
前記物理測定部が測定した物理的情報の変化から前記被測定者の活動量を求める第1算出部と、
前記生理測定部が測定した生理的情報の変化から前記被測定者にかかる生理的負荷を求める第2算出部と、
前記第1算出部が求めた活動量および前記第2算出部が求めた生理的負荷に関するグラフを生成するグラフ生成部と、
前記グラフ生成部が生成したグラフを前記被測定者が視認するための表示部と
を備えることを特徴とする機能回復訓練支援システム。 - 請求項1記載の機能回復訓練支援システムにおいて、
前記物理測定部が測定する物理的情報は、加速度、角速度、位置座標の少なくとも1つであり、
前記生理測定部が測定する生理的情報は、心電位、心拍、脈拍、筋電位、呼吸の少なくとも1つである
ことを特徴とする機能回復訓練支援システム。 - 請求項1または2記載の機能回復訓練支援システムにおいて、
前記物理測定部は、加速度を時系列に測定する加速度測定部であり、
前記生理測定部は、前記被測定者の心電位を測定する心電測定部であり、
前記第2算出部は、生理的負荷として運動負荷を求めることを特徴とする機能回復訓練支援システム。 - 請求項3記載の機能回復訓練支援システムにおいて、
前記第2算出部は、測定された心拍数÷前記被測定者の最大心拍数、または、(測定された心拍数-前記被測定者の安静時心拍数)÷(前記被測定者の最大心拍数-安静時心拍数)、またはこれらを任意の期間累積した値、またはこれらの任意の期間における平均値または中央値により運動負荷を求めることを特徴とする機能回復訓練支援システム。 - 請求項3または4記載の機能回復訓練支援システムにおいて、
前記加速度測定部は、互いに直交するXYZ軸の3方向の加速度を測定し、
前記第1算出部は、測定された3方向の加速度の和の積分値、測定された3方向の加速度の和の時間変化の差を2乗した値の積分値、測定された3方向の加速度の和の時間変化の差の絶対値の積分値、測定された3方向の加速度の和の時間変化の移動標準偏差のいずれかにより活動量を求める
ことを特徴とする機能回復訓練支援システム。 - 請求項5記載の機能回復訓練支援システムにおいて、
前記第1算出部は、測定された3方向の加速度の和の積分値、測定された3方向の加速度の和の時間変化の差を2乗した値の積分値、測定された3方向の加速度の和の時間変化の差の絶対値の積分値、測定された3方向の加速度の和の時間変化の移動標準偏差のいずれかの正の平方根をとることにより活動量を求める
ことを特徴とする機能回復訓練支援システム。 - 請求項3または4記載の機能回復訓練支援システムにおいて、
前記加速度測定部は、互いに直交するXYZ軸の3方向の加速度を測定し、
前記第1算出部は、測定された加速度より前記被測定者の上体の傾斜の角度を求め、求めた傾斜の角度より決定される前記被測定者の姿勢を活動量として求める
ことを特徴とする機能回復訓練支援システム。 - 請求項3または4記載の機能回復訓練支援システムにおいて、
前記加速度測定部は、互いに直交するXYZ軸の3方向の加速度を測定し、
前記第1算出部は、測定された3方向の加速度の和の時間変化のピーク周波数をとることにより活動量を求めること
を特徴とする機能回復訓練支援システム。 - 請求項3~8のいずれか1項に記載の機能回復訓練支援システムにおいて、
前記第2算出部は、求めた運動負荷を前記第1算出部が求めた活動量で除した追加処理値を求め、
前記グラフ生成部は、前記第1算出部が求めた活動量の変化を第1パラメータ、前記第2算出部が求めた追加処理値の変化を第2パラメータとして、前記第1パラメータと前記第2パラメータとを2次元のグラフとする
ことを特徴とする機能回復訓練支援システム。 - 請求項3~8のいずれか1項に記載の機能回復訓練支援システムにおいて、
前記第2算出部は、求めた運動負荷を前記第1算出部が求めた活動量で除した追加処理値を求め、
前記グラフ生成部は、前記第2算出部によって算出された追加処理値を時系列に示すグラフを生成する
ことを特徴とする機能回復訓練支援システム。 - 請求項1~10のいずれか1項に記載の機能回復訓練支援システムにおいて、
前記グラフ生成部は、前記第1算出部が求めた活動量の変化を第1パラメータ、前記第2算出部が求めた生理的負荷の変化を第2パラメータとして、前記第1パラメータと前記第2パラメータとを2次元のグラフとする
ことを特徴とする機能回復訓練支援システム。 - 請求項1~11のいずれか1項に記載の機能回復訓練支援システムにおいて、
機能回復訓練に関する複数の項目が活動量および生理的負荷に関連付けられて記憶された訓練項目記憶部と、
前記第1算出部が求めた活動量、および前記第2算出部が求めた生理的負荷を元に前記訓練項目記憶部に記憶されているいずれかの項目を選択する項目選択部と
を備え、
前記表示部は、前記項目選択部が選択した項目を前記グラフ生成部が生成したグラフとともに表示する
ことを特徴とする機能回復訓練支援システム。 - 請求項1~12のいずれか1項に記載の機能回復訓練支援システムにおいて、
機能回復訓練に関する複数の助言が活動量および生理的負荷に関連付けられて記憶された助言記憶部と、
前記第1算出部が求めた活動量、および前記第2算出部が求めた生理的負荷を元に前記助言記憶部に記憶されているいずれかの助言を選択する助言選択部と
を備え、
前記表示部は、前記助言選択部が選択した助言を前記グラフ生成部が生成したグラフとともに表示する
ことを特徴とする機能回復訓練支援システム。 - 請求項1~13のいずれか1項に記載の機能回復訓練支援システムにおいて、
前記第1算出部が求めた活動量、前記第2算出部が求めた生理的負荷のいずれかにより最大酸素摂取量および予備酸素摂取量の少なくとも1つを求める酸素摂取量算出部をさらに備えることを特徴とする機能回復訓練支援システム。 - 請求項1~14のいずれか1項に記載の機能回復訓練支援システムにおいて、
前記被測定者の生年月日、年齢、性別、身長、体重、病歴、投薬履歴、入退院履歴、治療担当者、FIM、病室、利用ベッドを含む前記被測定者の履歴情報の少なくとも1つを格納する被測定者情報記憶部を備えることを特徴とする機能回復訓練支援システム。 - 請求項15記載の機能回復訓練支援システムにおいて、
前記酸素摂取量算出部は、前記第1算出部が求めた活動量、前記第2算出部が求めた生理的負荷、前記被測定者情報記憶部に格納された前記被測定者の履歴情報の少なくとも1つより、前記最大酸素摂取量および前記予備酸素摂取量の少なくとも1つを求める
ことを特徴とする機能回復訓練支援システム。 - 被測定者の身体の性的または動的な状態を表す物理的情報を測定する第1工程と、
前記被測定者の体内における生理的情報を測定する第2工程と、
測定された物理的情報より前記被測定者の活動量を求める第3工程と、
測定された生理的情報より前記被測定者にかかる生理的負荷を求める第4工程と、
前記第3工程で求めた活動量および前記第4工程で求めた生理的負荷に関するグラフを生成する第5工程と、
生成したグラフを前記被測定者に視認可能に表示する第6工程と
を備えることを特徴とする機能回復訓練支援方法。
Priority Applications (2)
| Application Number | Priority Date | Filing Date | Title |
|---|---|---|---|
| US17/255,617 US20210217509A1 (en) | 2018-06-25 | 2019-06-17 | Rehabilitation Support System and Method |
| JP2020527408A JP7036211B2 (ja) | 2018-06-25 | 2019-06-17 | 機能回復訓練支援システム |
Applications Claiming Priority (2)
| Application Number | Priority Date | Filing Date | Title |
|---|---|---|---|
| JP2018119729 | 2018-06-25 | ||
| JP2018-119729 | 2018-06-25 |
Publications (1)
| Publication Number | Publication Date |
|---|---|
| WO2020004102A1 true WO2020004102A1 (ja) | 2020-01-02 |
Family
ID=68986479
Family Applications (1)
| Application Number | Title | Priority Date | Filing Date |
|---|---|---|---|
| PCT/JP2019/023853 WO2020004102A1 (ja) | 2018-06-25 | 2019-06-17 | 機能回復訓練支援システムおよび方法 |
Country Status (3)
| Country | Link |
|---|---|
| US (1) | US20210217509A1 (ja) |
| JP (1) | JP7036211B2 (ja) |
| WO (1) | WO2020004102A1 (ja) |
Cited By (3)
| Publication number | Priority date | Publication date | Assignee | Title |
|---|---|---|---|---|
| WO2021246285A1 (ja) * | 2020-06-01 | 2021-12-09 | 株式会社Arblet | 情報処理システム、サーバ、情報処理方法及びプログラム |
| WO2024004099A1 (ja) * | 2022-06-29 | 2024-01-04 | 日本電信電話株式会社 | 容態分析装置、および容態分析方法 |
| WO2024009487A1 (ja) * | 2022-07-08 | 2024-01-11 | 日本電信電話株式会社 | 推定装置、推定方法、およびプログラム |
Families Citing this family (1)
| Publication number | Priority date | Publication date | Assignee | Title |
|---|---|---|---|---|
| WO2021033281A1 (ja) * | 2019-08-21 | 2021-02-25 | 日本電気株式会社 | 情報処理方法 |
Citations (5)
| Publication number | Priority date | Publication date | Assignee | Title |
|---|---|---|---|---|
| JP2008262522A (ja) * | 2007-04-11 | 2008-10-30 | Aichi Micro Intelligent Corp | 歩数計 |
| JP2011193976A (ja) * | 2010-03-18 | 2011-10-06 | Nippon Koden Corp | 目標心拍数到達時間予測装置および目標心拍数到達時間予測方法 |
| JP2015132957A (ja) * | 2014-01-10 | 2015-07-23 | フクダ電子株式会社 | リハビリテーション支援装置及びリハビリテーションレポート |
| JP2017006745A (ja) * | 2016-10-17 | 2017-01-12 | 国立大学法人東北大学 | 健康情報処理装置、健康情報表示装置及び方法 |
| JP2017148312A (ja) * | 2016-02-25 | 2017-08-31 | 富士通株式会社 | センサ情報処理装置、センサユニット、及び、センサ情報処理プログラム |
Family Cites Families (5)
| Publication number | Priority date | Publication date | Assignee | Title |
|---|---|---|---|---|
| JP4357503B2 (ja) * | 2006-06-28 | 2009-11-04 | 株式会社東芝 | 生体情報計測装置、生体情報計測方法および生体情報計測プログラム |
| US20110245688A1 (en) * | 2010-03-31 | 2011-10-06 | General Electric Company | System and method of performing electrocardiography with motion detection |
| JP5741964B2 (ja) * | 2012-12-19 | 2015-07-01 | カシオ計算機株式会社 | センサデータ抽出システム、センサデータ抽出方法およびセンサデータ抽出プログラム |
| CN104840191A (zh) * | 2015-04-30 | 2015-08-19 | 吴健康 | 测试心脏运动功能的设备、系统和方法 |
| KR102457563B1 (ko) * | 2015-11-24 | 2022-10-24 | 삼성전자주식회사 | 서비스 제공을 위한 웨어 시스템 및 방법 |
-
2019
- 2019-06-17 JP JP2020527408A patent/JP7036211B2/ja active Active
- 2019-06-17 US US17/255,617 patent/US20210217509A1/en active Pending
- 2019-06-17 WO PCT/JP2019/023853 patent/WO2020004102A1/ja active Application Filing
Patent Citations (5)
| Publication number | Priority date | Publication date | Assignee | Title |
|---|---|---|---|---|
| JP2008262522A (ja) * | 2007-04-11 | 2008-10-30 | Aichi Micro Intelligent Corp | 歩数計 |
| JP2011193976A (ja) * | 2010-03-18 | 2011-10-06 | Nippon Koden Corp | 目標心拍数到達時間予測装置および目標心拍数到達時間予測方法 |
| JP2015132957A (ja) * | 2014-01-10 | 2015-07-23 | フクダ電子株式会社 | リハビリテーション支援装置及びリハビリテーションレポート |
| JP2017148312A (ja) * | 2016-02-25 | 2017-08-31 | 富士通株式会社 | センサ情報処理装置、センサユニット、及び、センサ情報処理プログラム |
| JP2017006745A (ja) * | 2016-10-17 | 2017-01-12 | 国立大学法人東北大学 | 健康情報処理装置、健康情報表示装置及び方法 |
Cited By (4)
| Publication number | Priority date | Publication date | Assignee | Title |
|---|---|---|---|---|
| WO2021246285A1 (ja) * | 2020-06-01 | 2021-12-09 | 株式会社Arblet | 情報処理システム、サーバ、情報処理方法及びプログラム |
| JP2021190122A (ja) * | 2020-06-01 | 2021-12-13 | 株式会社Arblet | 情報処理システム、サーバ、情報処理方法及びプログラム |
| WO2024004099A1 (ja) * | 2022-06-29 | 2024-01-04 | 日本電信電話株式会社 | 容態分析装置、および容態分析方法 |
| WO2024009487A1 (ja) * | 2022-07-08 | 2024-01-11 | 日本電信電話株式会社 | 推定装置、推定方法、およびプログラム |
Also Published As
| Publication number | Publication date |
|---|---|
| US20210217509A1 (en) | 2021-07-15 |
| JPWO2020004102A1 (ja) | 2021-02-15 |
| JP7036211B2 (ja) | 2022-03-15 |
Similar Documents
| Publication | Publication Date | Title |
|---|---|---|
| WO2020004102A1 (ja) | 機能回復訓練支援システムおよび方法 | |
| Radha et al. | Estimating blood pressure trends and the nocturnal dip from photoplethysmography | |
| Paalasmaa et al. | Unobtrusive online monitoring of sleep at home | |
| US10213153B2 (en) | Wearable pain monitor using accelerometry | |
| KR101656611B1 (ko) | 무구속적으로 측정한 생체신호를 이용하여 산소탈포화지수를 획득하는 방법 | |
| JP6047346B2 (ja) | 生体情報処理システム、ウェアラブル装置、サーバーシステム及びプログラム | |
| CA2656062C (en) | Automatic and ambulatory monitoring of congestive heart failure patients | |
| US10856810B2 (en) | Smart carpet systems and methods of using same for monitoring physical and physiological activities | |
| EP3429456B1 (en) | A method and apparatus for determining a baseline for one or more physiological characteristics of a subject | |
| Liu et al. | Breathsens: A continuous on-bed respiratory monitoring system with torso localization using an unobtrusive pressure sensing array | |
| JP4754447B2 (ja) | 生体解析装置及びプログラム | |
| WO2017090732A1 (ja) | 呼吸推定方法および装置 | |
| JP6692933B2 (ja) | 活動状態解析装置および方法 | |
| CN112272534B (zh) | 用于估计血压替代物趋势的方法和装置 | |
| Selvaraj et al. | Fully disposable wireless patch sensor for continuous remote patient monitoring | |
| Gaiduk et al. | Estimation of sleep stages analyzing respiratory and movement signals | |
| JP6450025B2 (ja) | 呼吸推定方法および装置 | |
| JP2021122580A (ja) | 体調評価方法、および、体調評価システム | |
| US20230007922A1 (en) | Method and System for Estimating Physiological Parameters Utilizing a Deep Neural Network to Build a Calibrated Parameter Model | |
| Lakudzode et al. | Review on human stress monitoring system using wearable sensors | |
| Xu et al. | Total health: Toward continuous personal monitoring | |
| Kutilek et al. | Methods of motion assessment of upper limb for rehabilitation application | |
| JP7294449B2 (ja) | 監視システム、監視方法、および監視プログラム | |
| Sprowls et al. | Integrated Sensing Systems for Monitoring Interrelated Physiological Parameters in Young and Aged Adults: A Pilot Study | |
| CN110022758B (zh) | 用于确定心力衰竭风险的确定系统 |
Legal Events
| Date | Code | Title | Description |
|---|---|---|---|
| 121 | Ep: the epo has been informed by wipo that ep was designated in this application |
Ref document number: 19824700 Country of ref document: EP Kind code of ref document: A1 |
|
| ENP | Entry into the national phase |
Ref document number: 2020527408 Country of ref document: JP Kind code of ref document: A |
|
| NENP | Non-entry into the national phase |
Ref country code: DE |
|
| 122 | Ep: pct application non-entry in european phase |
Ref document number: 19824700 Country of ref document: EP Kind code of ref document: A1 |